-
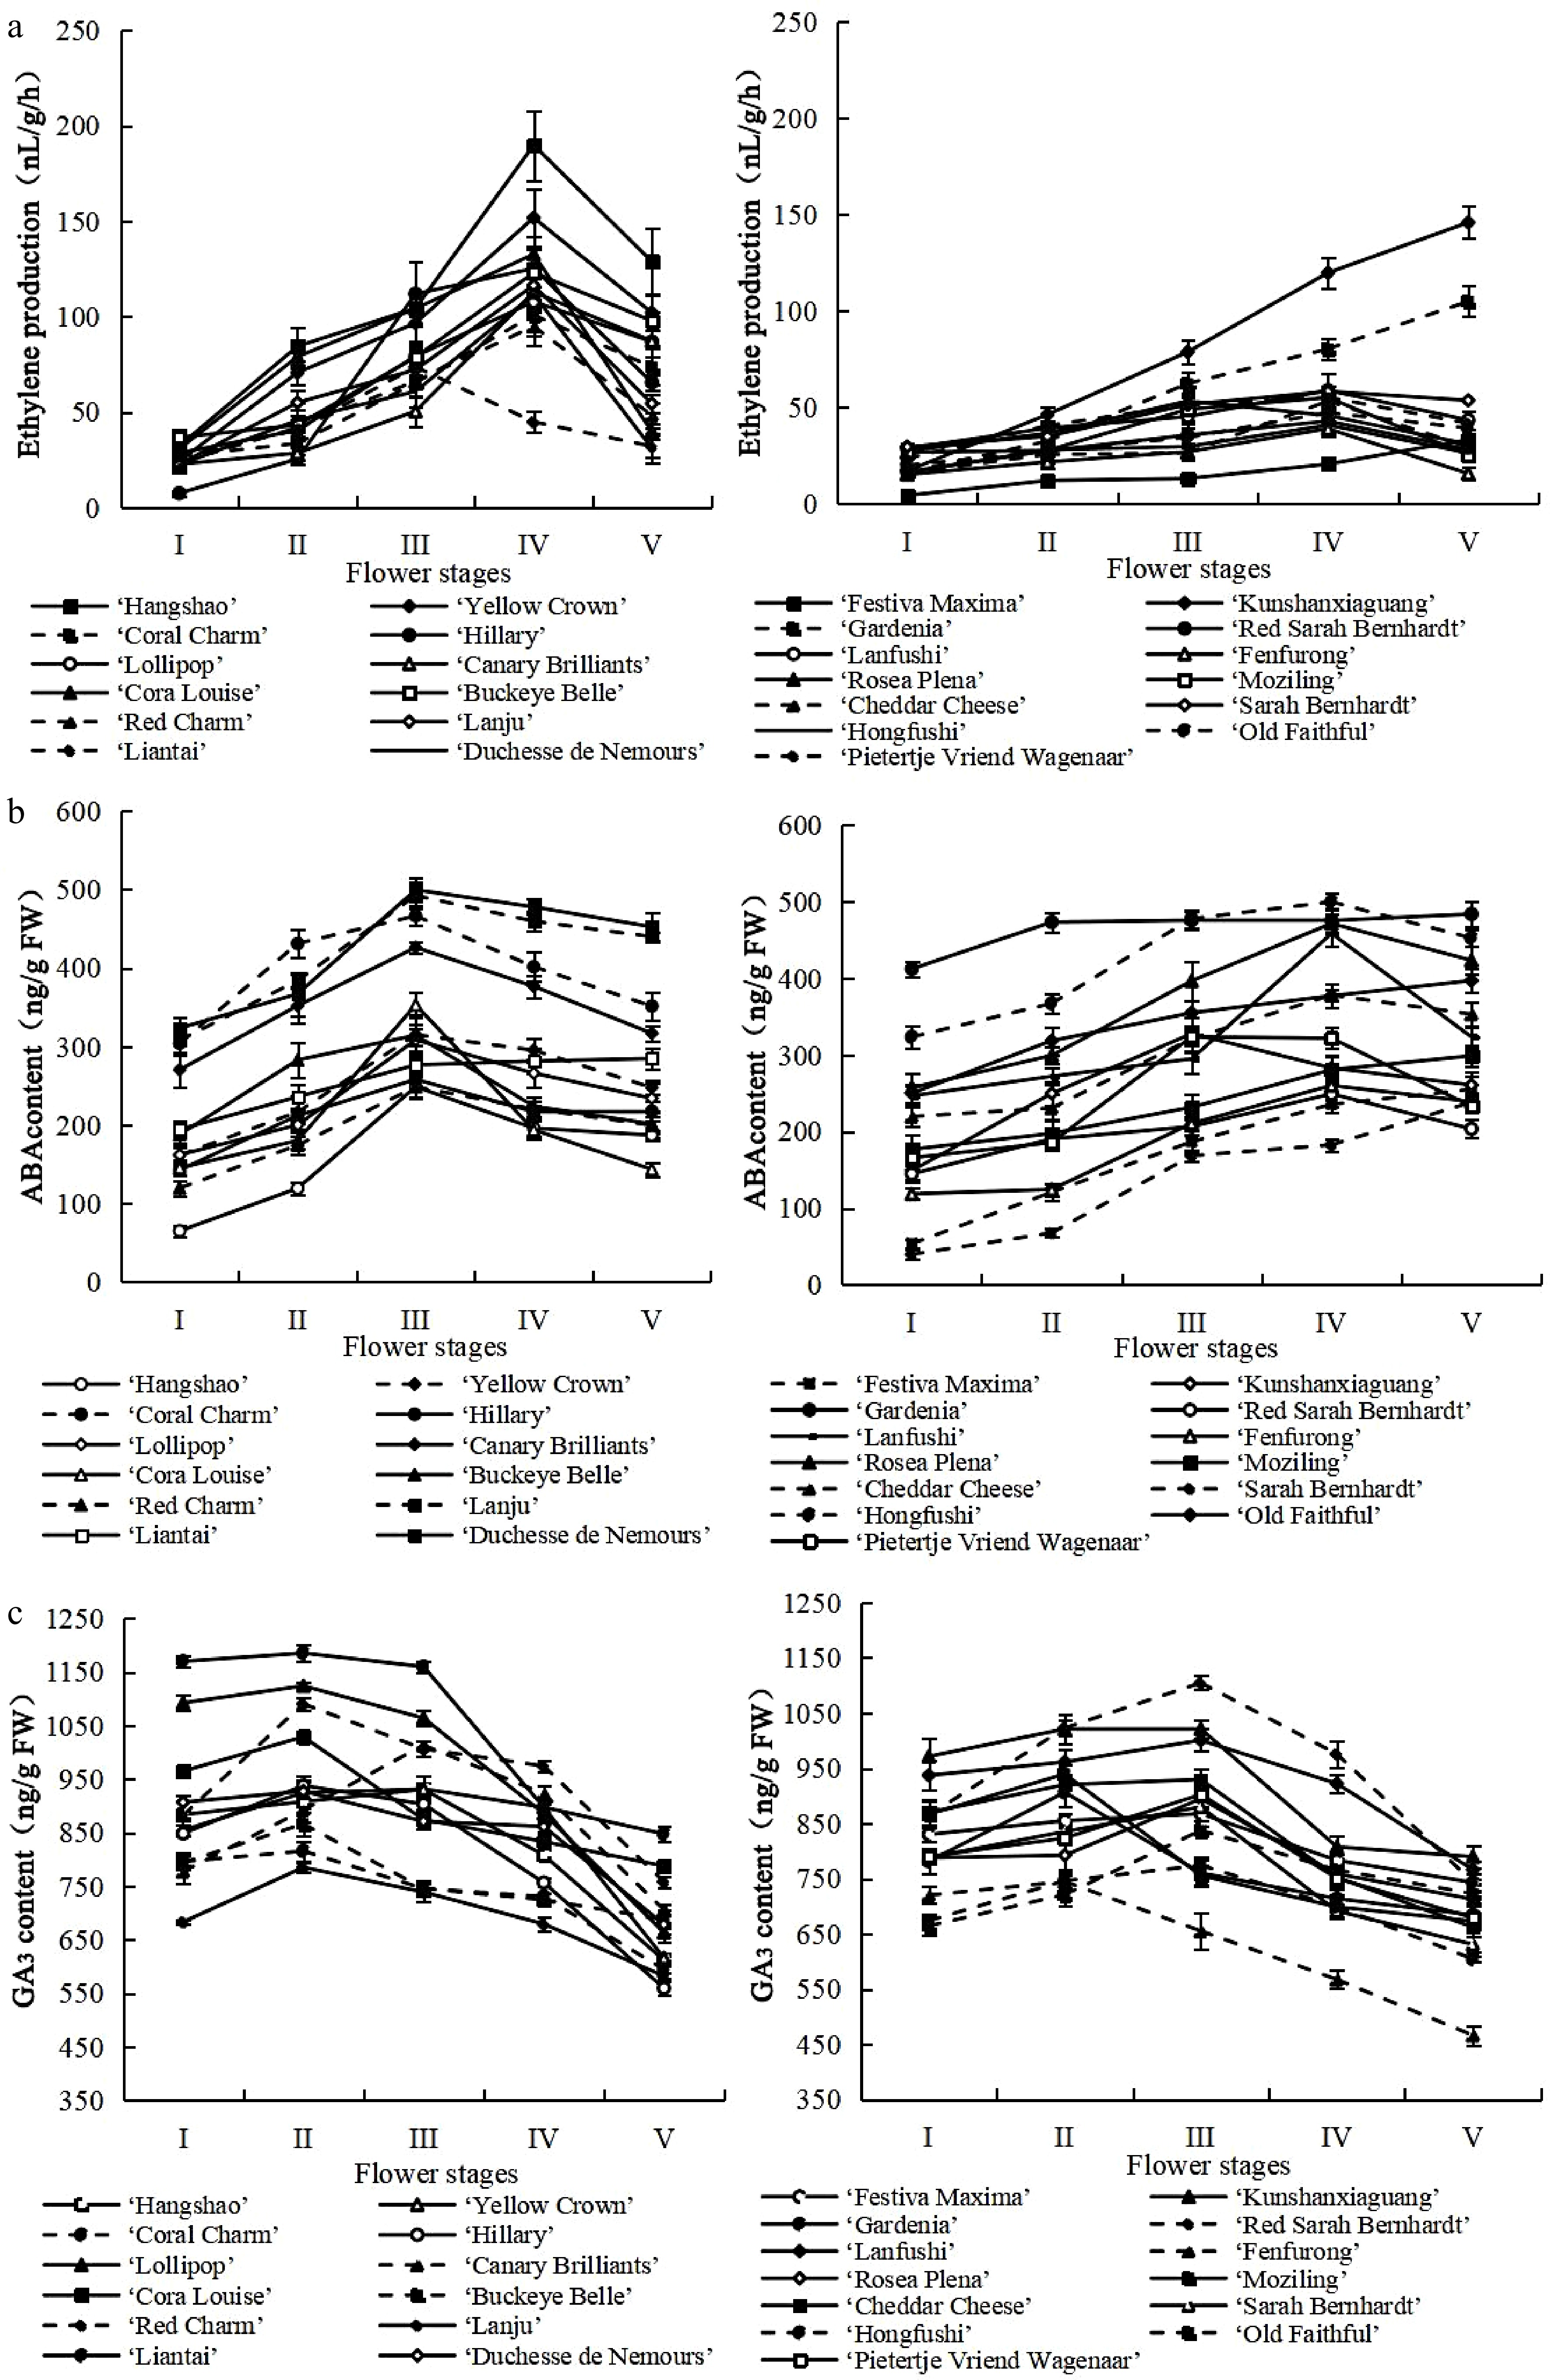
Figure 1.
Changes in content of phytohormone during herbaceous peony senescence. (a) Changes in ethylene production. (b) Changes in ABA content. (c) Changes in GA3 content. Error bars show the SD of the means of three biological replicates.
-
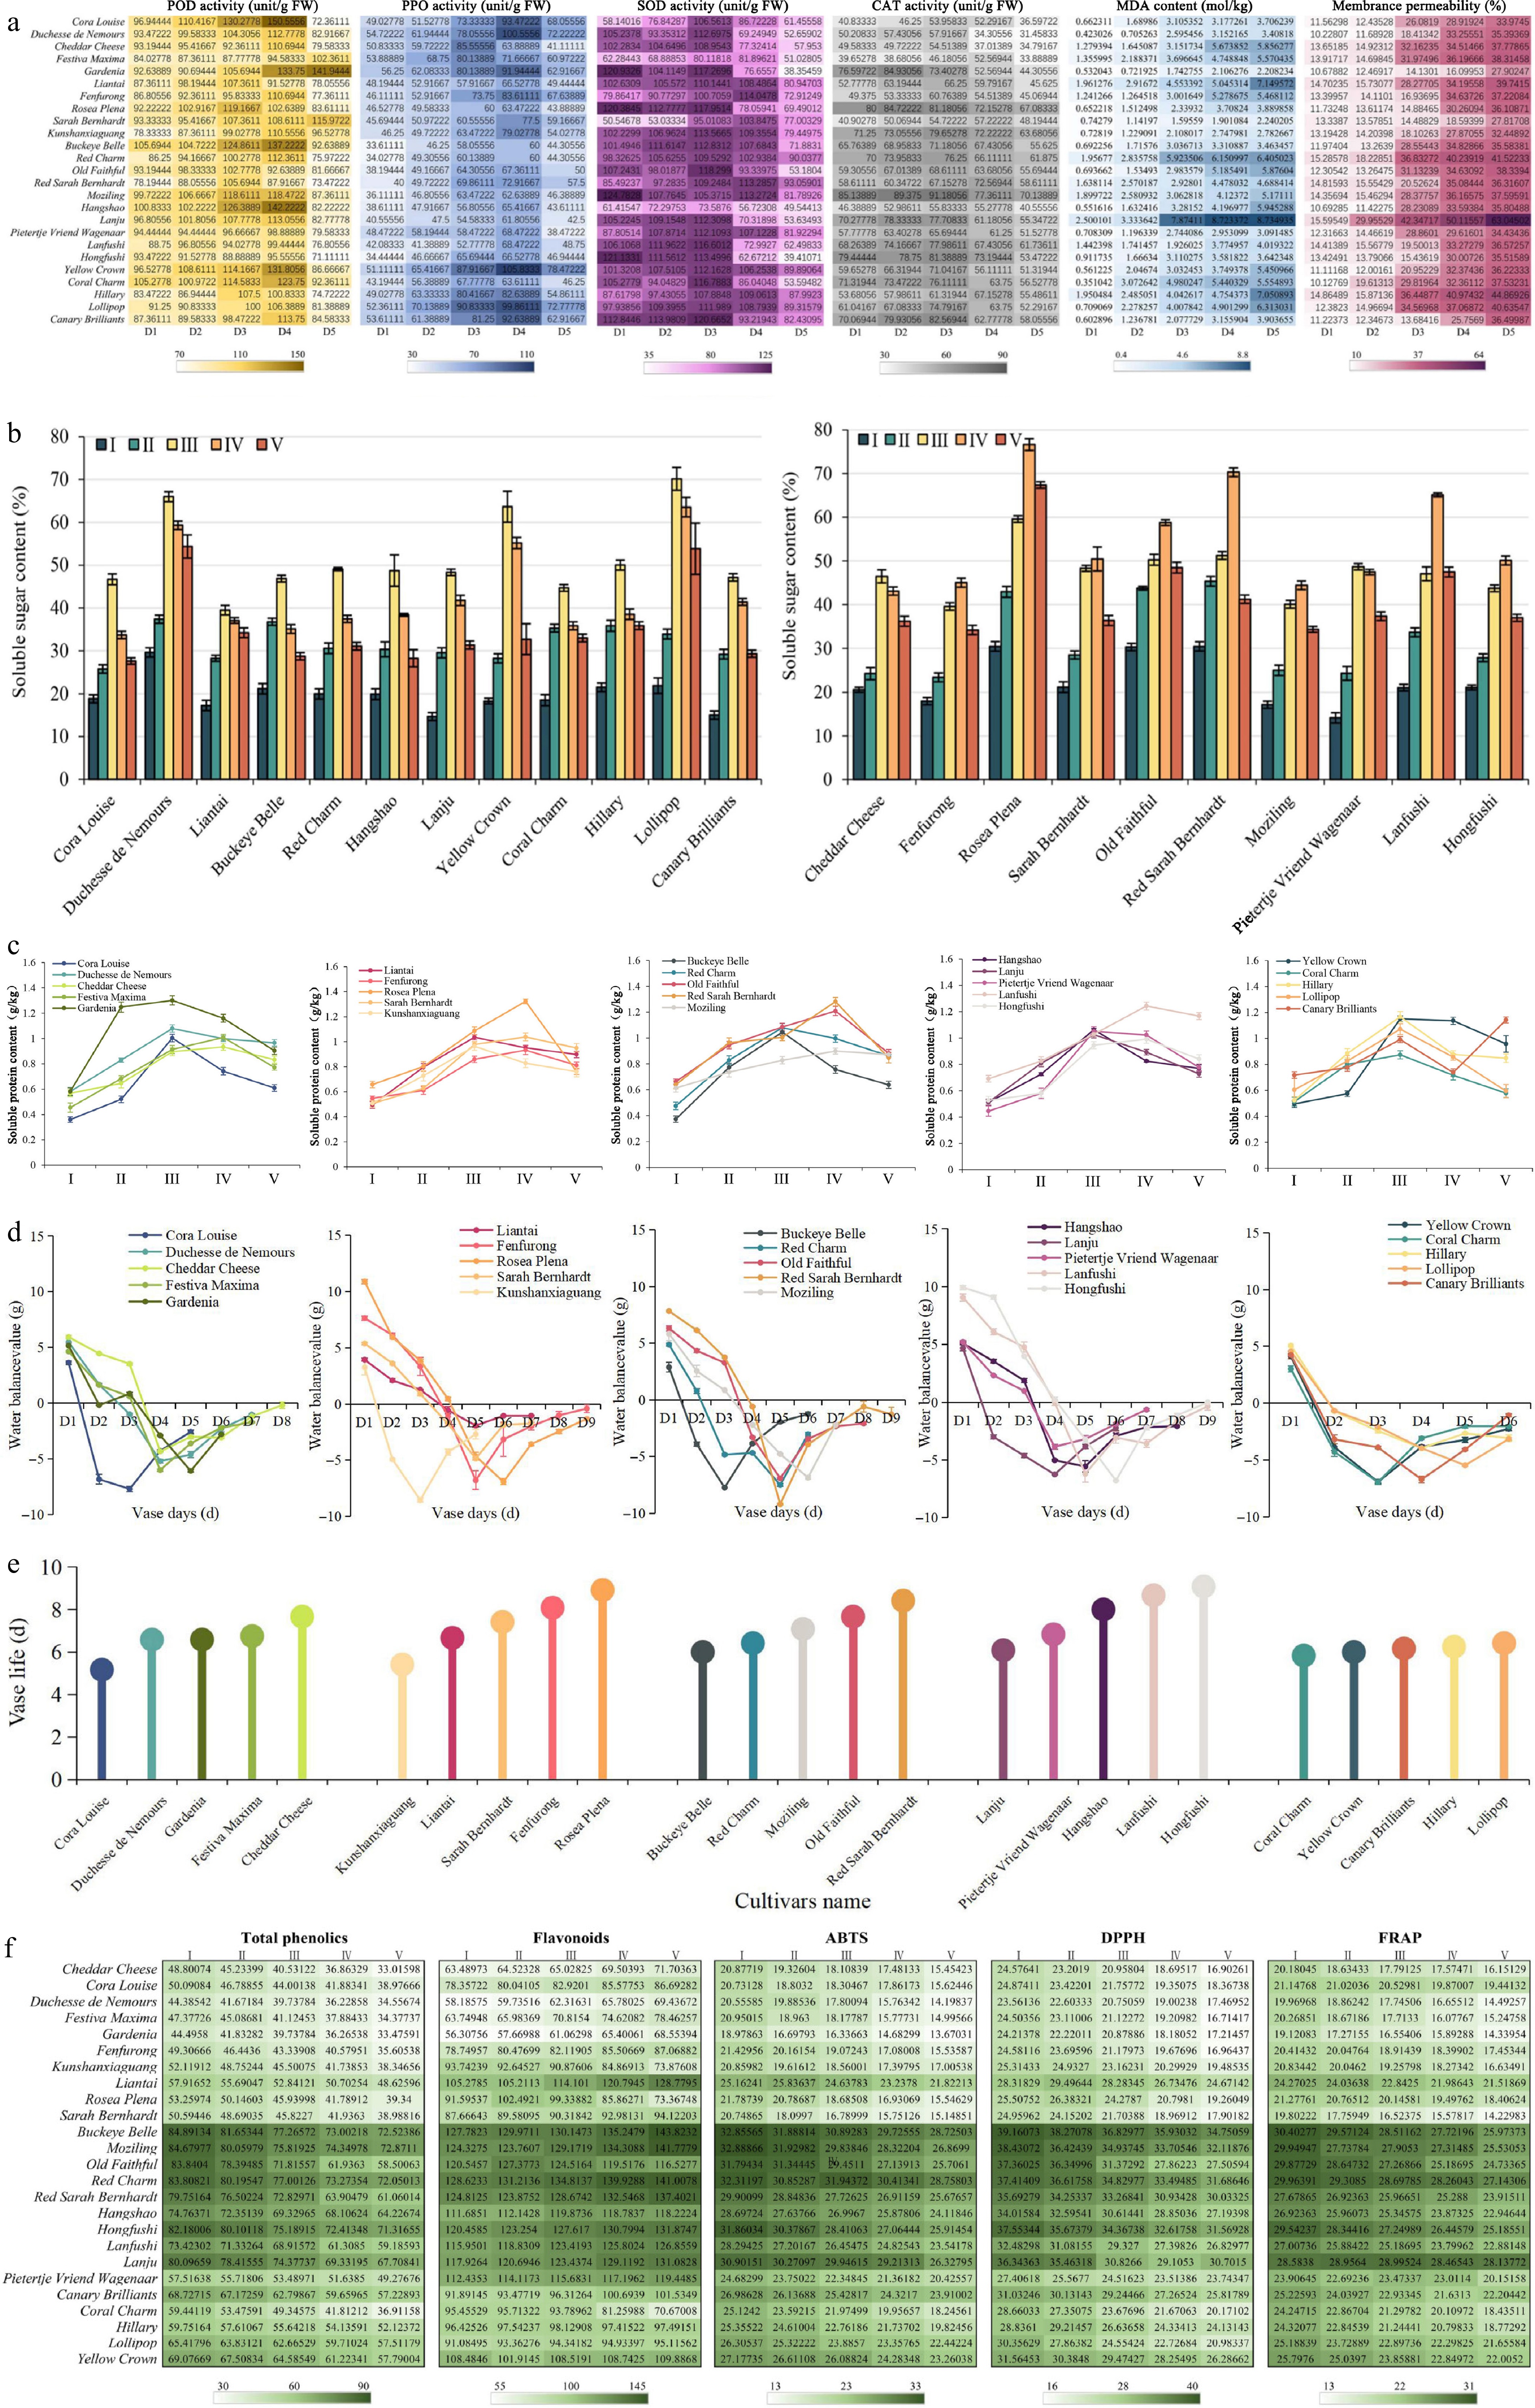
Figure 2.
Longevity of different cultivars of herbaceous peony flowers and their changes in physiological indicators during herbaceous peony senescence. (a) Changes in POD, PPO, SOD, CAT activity, MDA content, and membrance permeability. (b) Changes in soluble sugar content. (c) Changes in soluble protein content. (d) Changes in water balance. (e) Longevity of different herbaceous peony cultivars. (f) Changes in total phenolic and flavonoid content and activity of three antioxidants. Error bars show the SD of the means of three biological replicates.
-
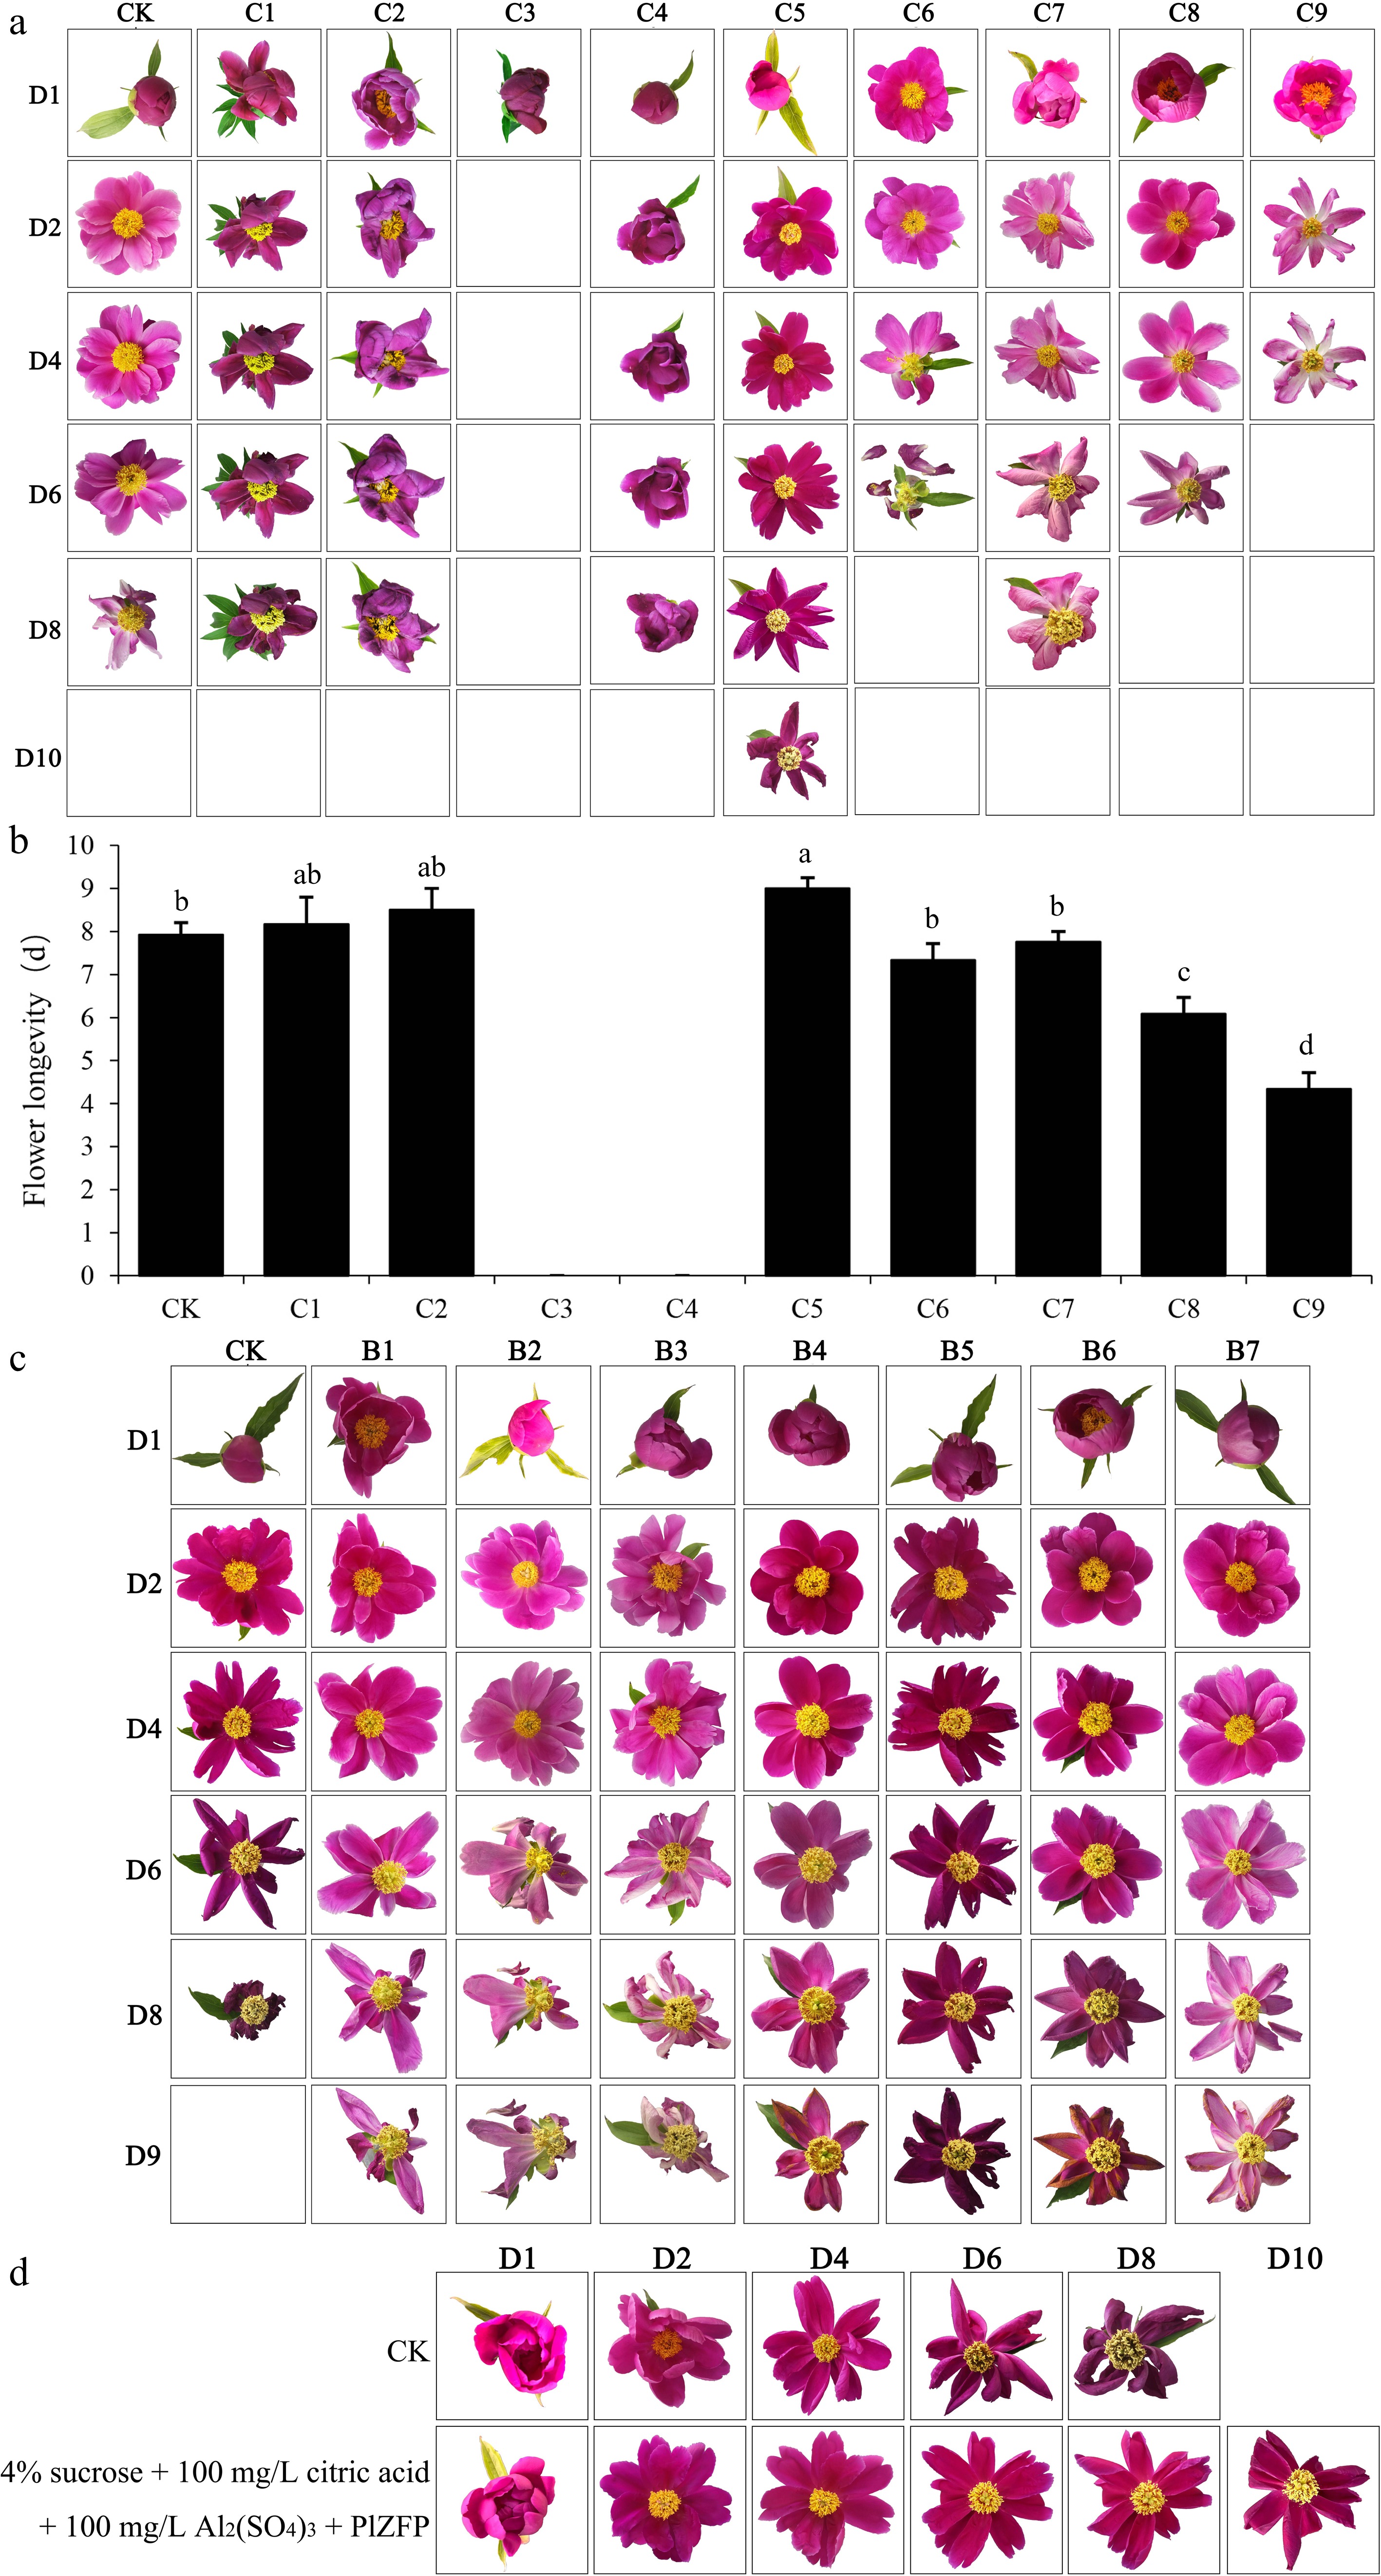
Figure 3.
Phenotypic statistics and flower longevity of cut flowers after different treatment. (a) Phenotypic statistics of cut flowers after different VIGS treatment. (b) Flower longevity after different VIGS treatment. Different letters indicate significant differences at the p ≤ 0.05 level by Duncan test. (c) Phenotypic statistics of cut flowers after different vase solutions treatment. (d) Phenotypic statistics of cut flowers after vase solutions and VIGS treatment. Error bars show the SD of the means of three biological replicates.
-
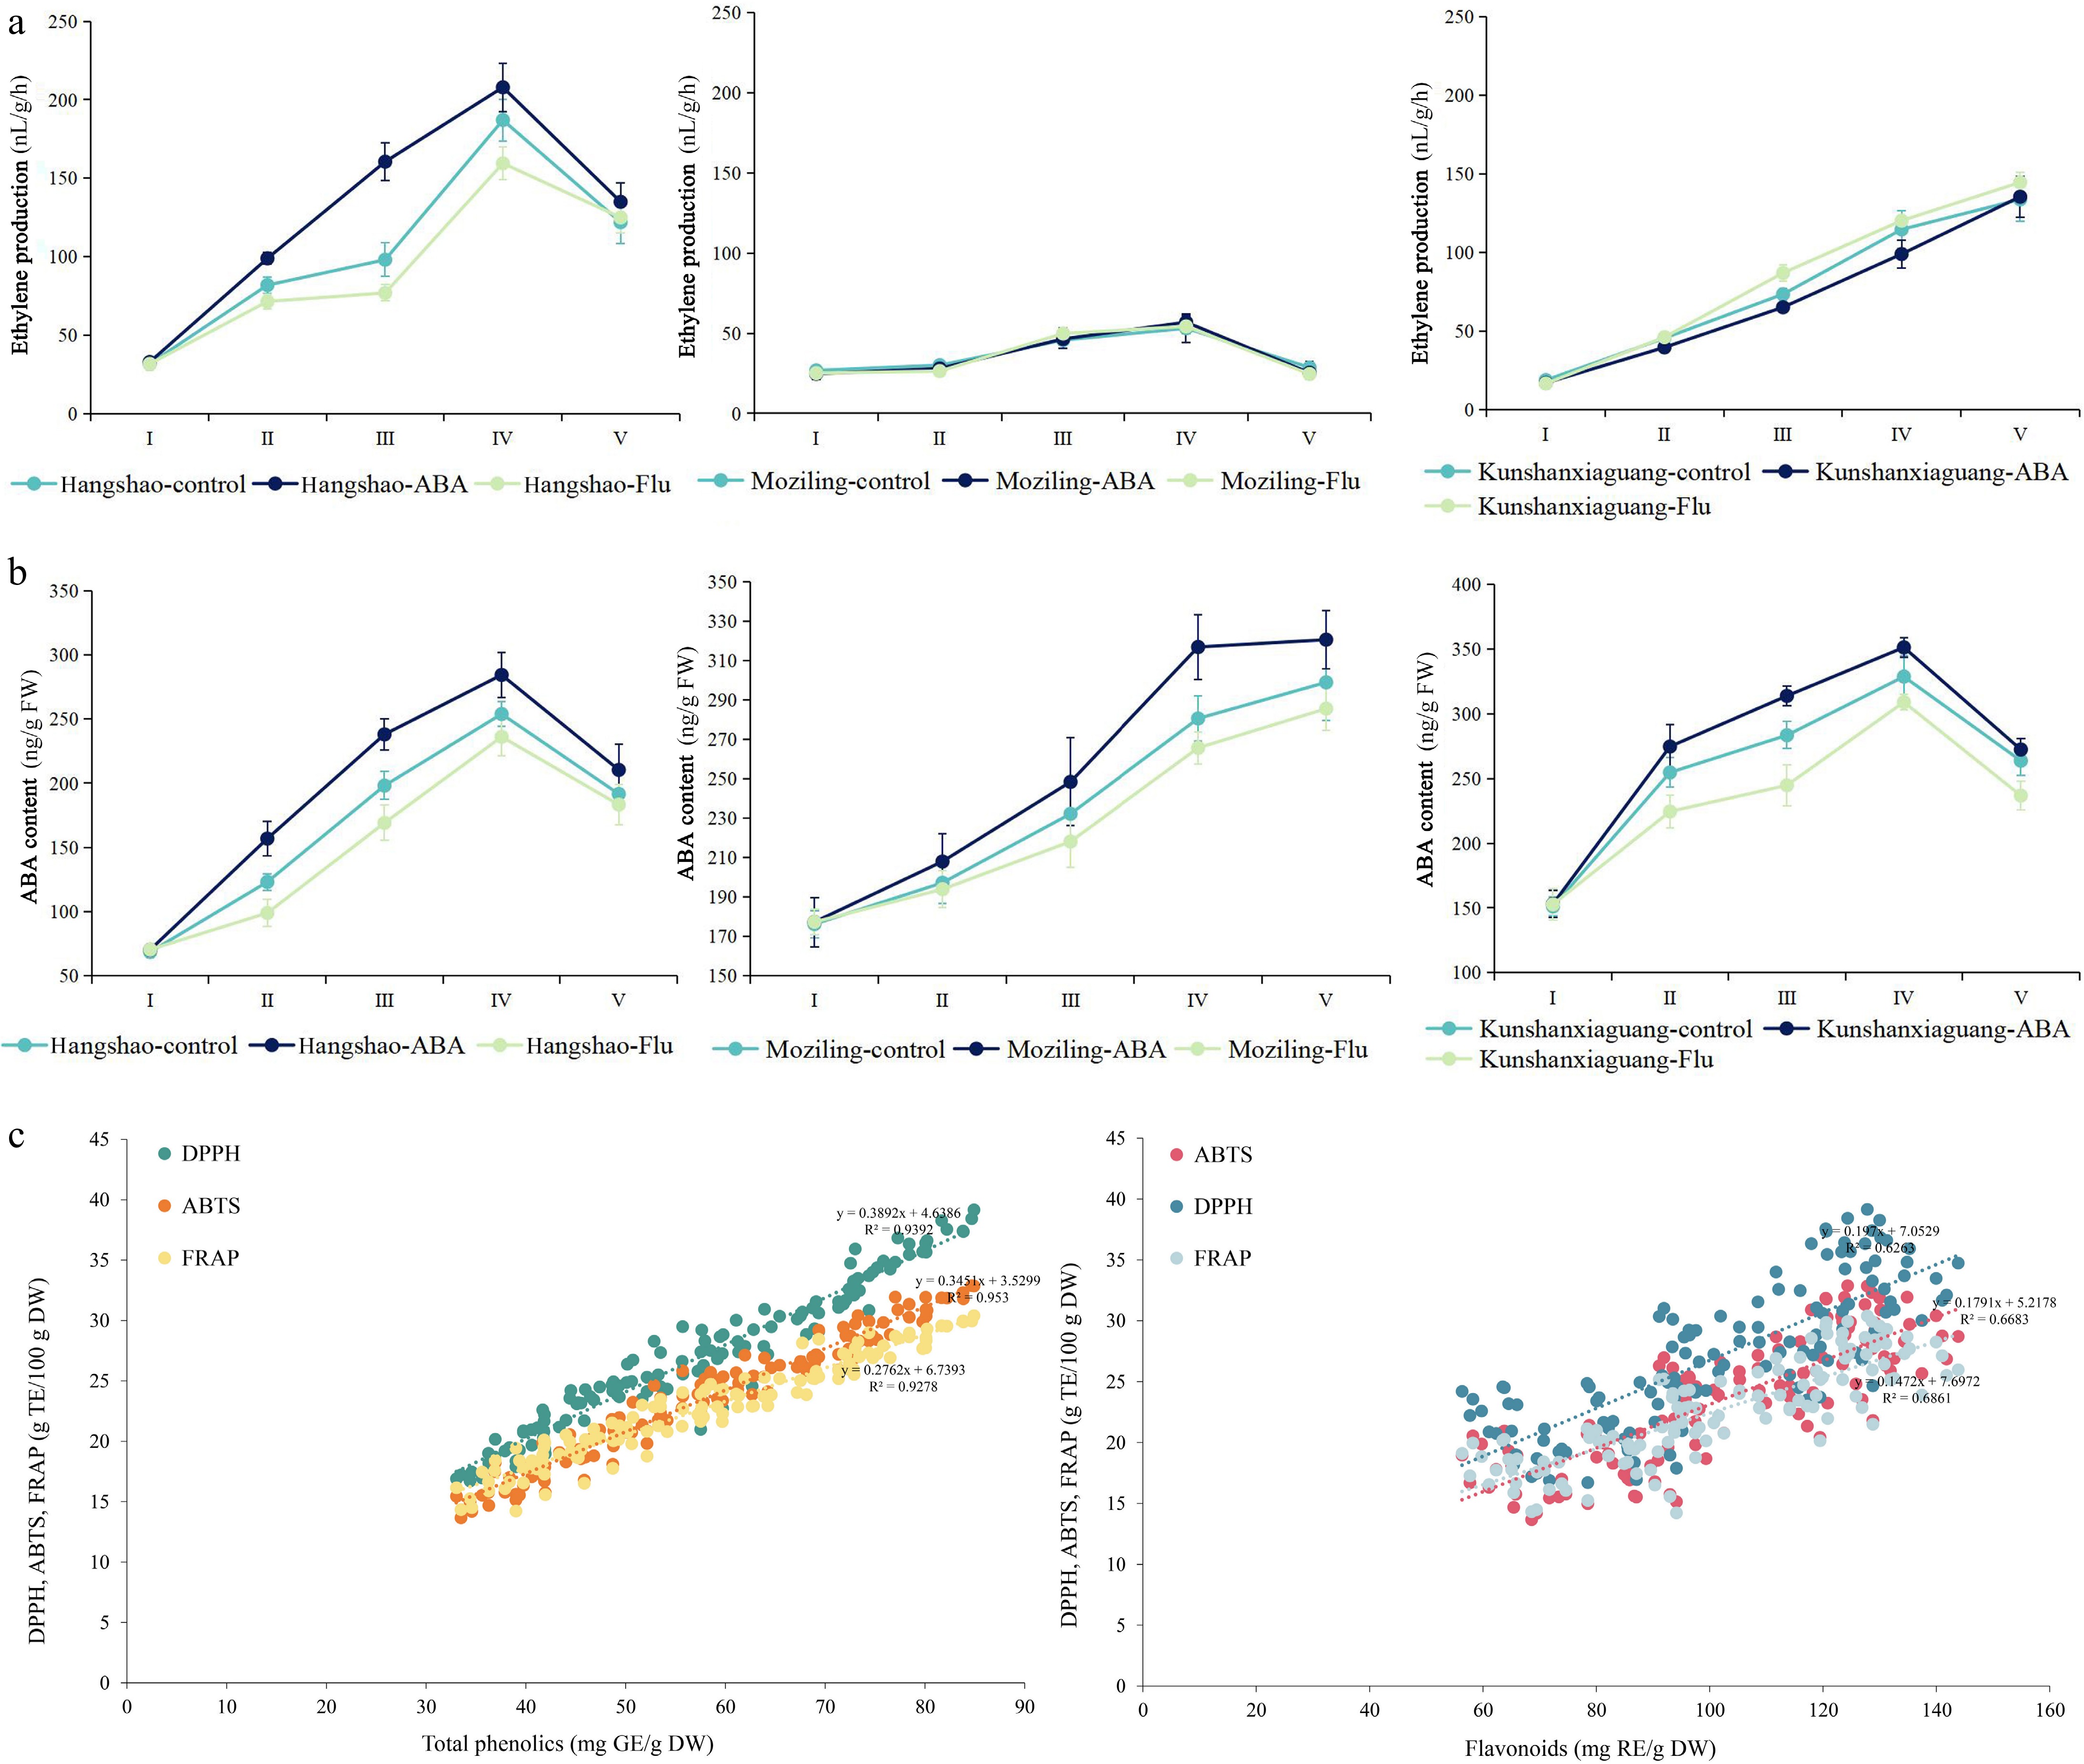
Figure 4.
Ethylene production and ABA content in 'Hangshao', 'Moziling', and 'Kunshanxiaguang' after ABA and Flu treatment, and scatter diagram of the antioxidant activity with total phenolics/flavonoids. (a) Changes in ethylene production during 'Hangshao', 'Moziling', and 'Kunshanxiaguang' senescence after ABA and Flu treatment. (b) Changes in ABA content during 'Hangshao', 'Moziling', and 'Kunshanxiaguang' senescence after ABA and Flu treatment. (c) Scatter diagram of the antioxidant activity with total phenolics and total flavonoids.
-
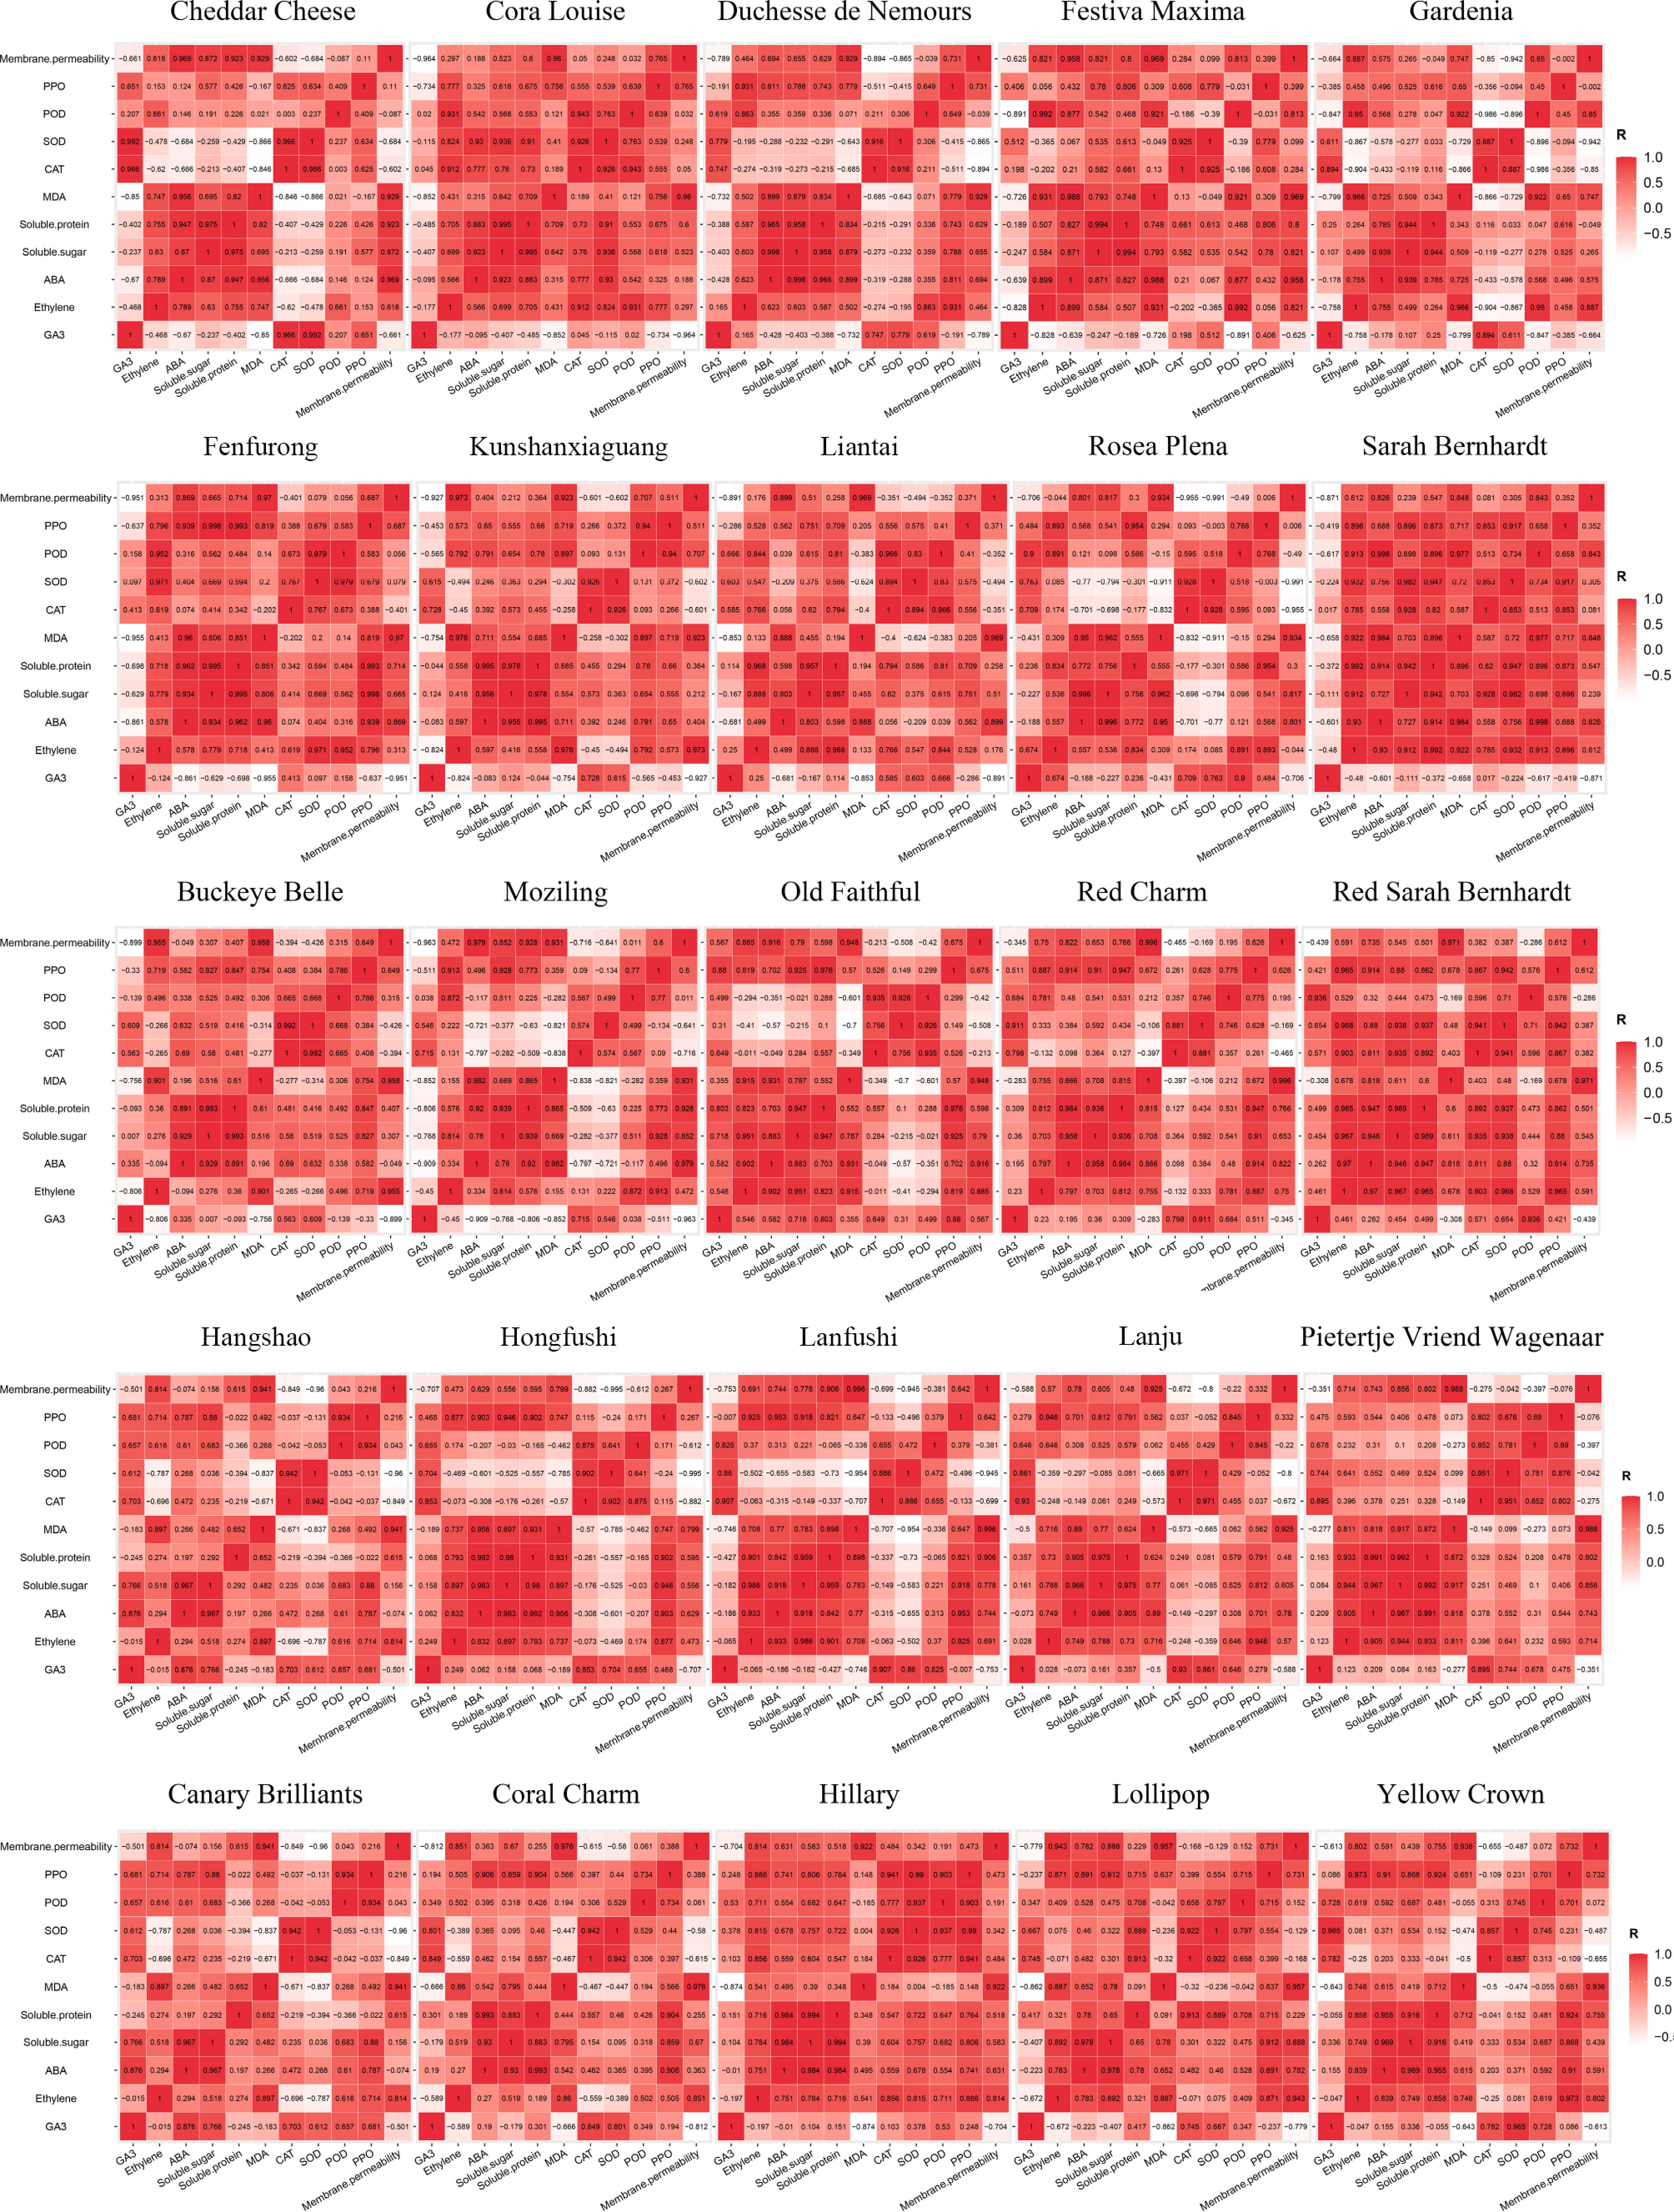
Figure 5.
Plot of correlation coefficients for each biochemical and physiological index.
-
Number Method Process C1 The syringe injection method 0.25 mL of the VIGS bacterial solution was injected into the cut flower from the bottom of the bud using a syringe. C2 0.5 mL of the VIGS bacterial solution was injected into the cut flower from the bottom of the bud using a syringe. C3 1.0 mL of the VIGS bacterial solution was injected into the cut flower from the bottom of the bud using a syringe. C4 The vacuum infection method When the bud was relatively hard and the petals were tightly closed, the entire bud was immersed into the VIGS bacterial solution for 10 min, under a vacuum at 0.7 atm. C5 When the bud was relatively soft and the petals were loose, the entire bud was immersed into the VIGS bacterial solution for 10 min, under a vacuum at 0.7 atm. C6 When the bud was open, revealing the stamens and pistils, the entire bud was immersed into the VIGS bacterial solution for 10 min, under a vacuum at 0.7 atm. C7 The vase solution absorption method The cut flowers were inserted into the VIGS bacterial solution with an OD value of 0.25 for 24 h. C8 The cut flowers were inserted into the VIGS bacterial solution with an OD value of 0.5 for 24 h. C9 The cut flowers were inserted into the VIGS bacterial solution with an OD value of 1.0 for 24 h. Table 1.
The optimization process of VIGS technology.
-
No. Formulas of vase solutions Opening days (d) Blooming days (d) Vase life (d) CK Water 2.17 ± 0.14b 3.42 ± 0.38b 7.92 ± 0.58c B1 4% sucrose + 100 mg/L citric acid 2.08 ± 0.29b 4.08 ± 0.14a 9.33 ± 0.14b B2 4% sucrose + 100 mg/L Al2(SO4)3 2.42 ± 0.29ab 4.17 ± 0.14a 9.50 ± 0.43ab B3 4% sucrose + 200 mg/L 8-HQS 2.33 ± 0.14ab 4.00 ± 0.25ab 9.25 ± 0.25b B4 4% sucrose + 100 mg/L citric acid + 100 mg/L Al2(SO4)3 2.58 ± 0.29a 4.17 ± 0.14a 9.75 ± 0.25a B5 4% sucrose + 100 mg/L citric acid + 200 mg/L 8-HQS 2.42 ± 0.14ab 4.08 ± 0.38a 9.33 ± 0.38ab B6 4% sucrose + 100 mg/L Al2(SO4)3 + 200 mg/L 8-HQS 2.50 ± 0.25ab 4.00 ± 0.25ab 9.58 ± 0.14ab B7 4% sucrose + 100 mg/L citric acid + 100 mg/L Al2(SO4)3 + 200 mg/L 8-HQS 2.50 ± 0.25a 4.08 ± 0.14a 9.67 ± 0.38ab Different letters indicate significant differences using one-way ANOVA test at p < 0.05. Table 2.
Effect of vase solutions on senescence of cut herbaceous peony flowers.
-
Treatment Opening days (d) Blooming days (d) Vase life (d) CK 2.25 ± 0.25a 3.25 ± 0.25b 8.08 ± 0.38c 4% sucrose + 100 mg/L citric acid + 100 mg/LAl2(SO4)3 + PlZFP 2.17 ± 0.29a 4.58 ± 0.14a 10.67 ± 0.29a Different letters indicate significant differences using one-way ANOVA test at p < 0.05. Table 3.
Effect of vase solutions and VIGS on senescence of cut herbaceous peony flowers.
Figures
(5)
Tables
(3)