-
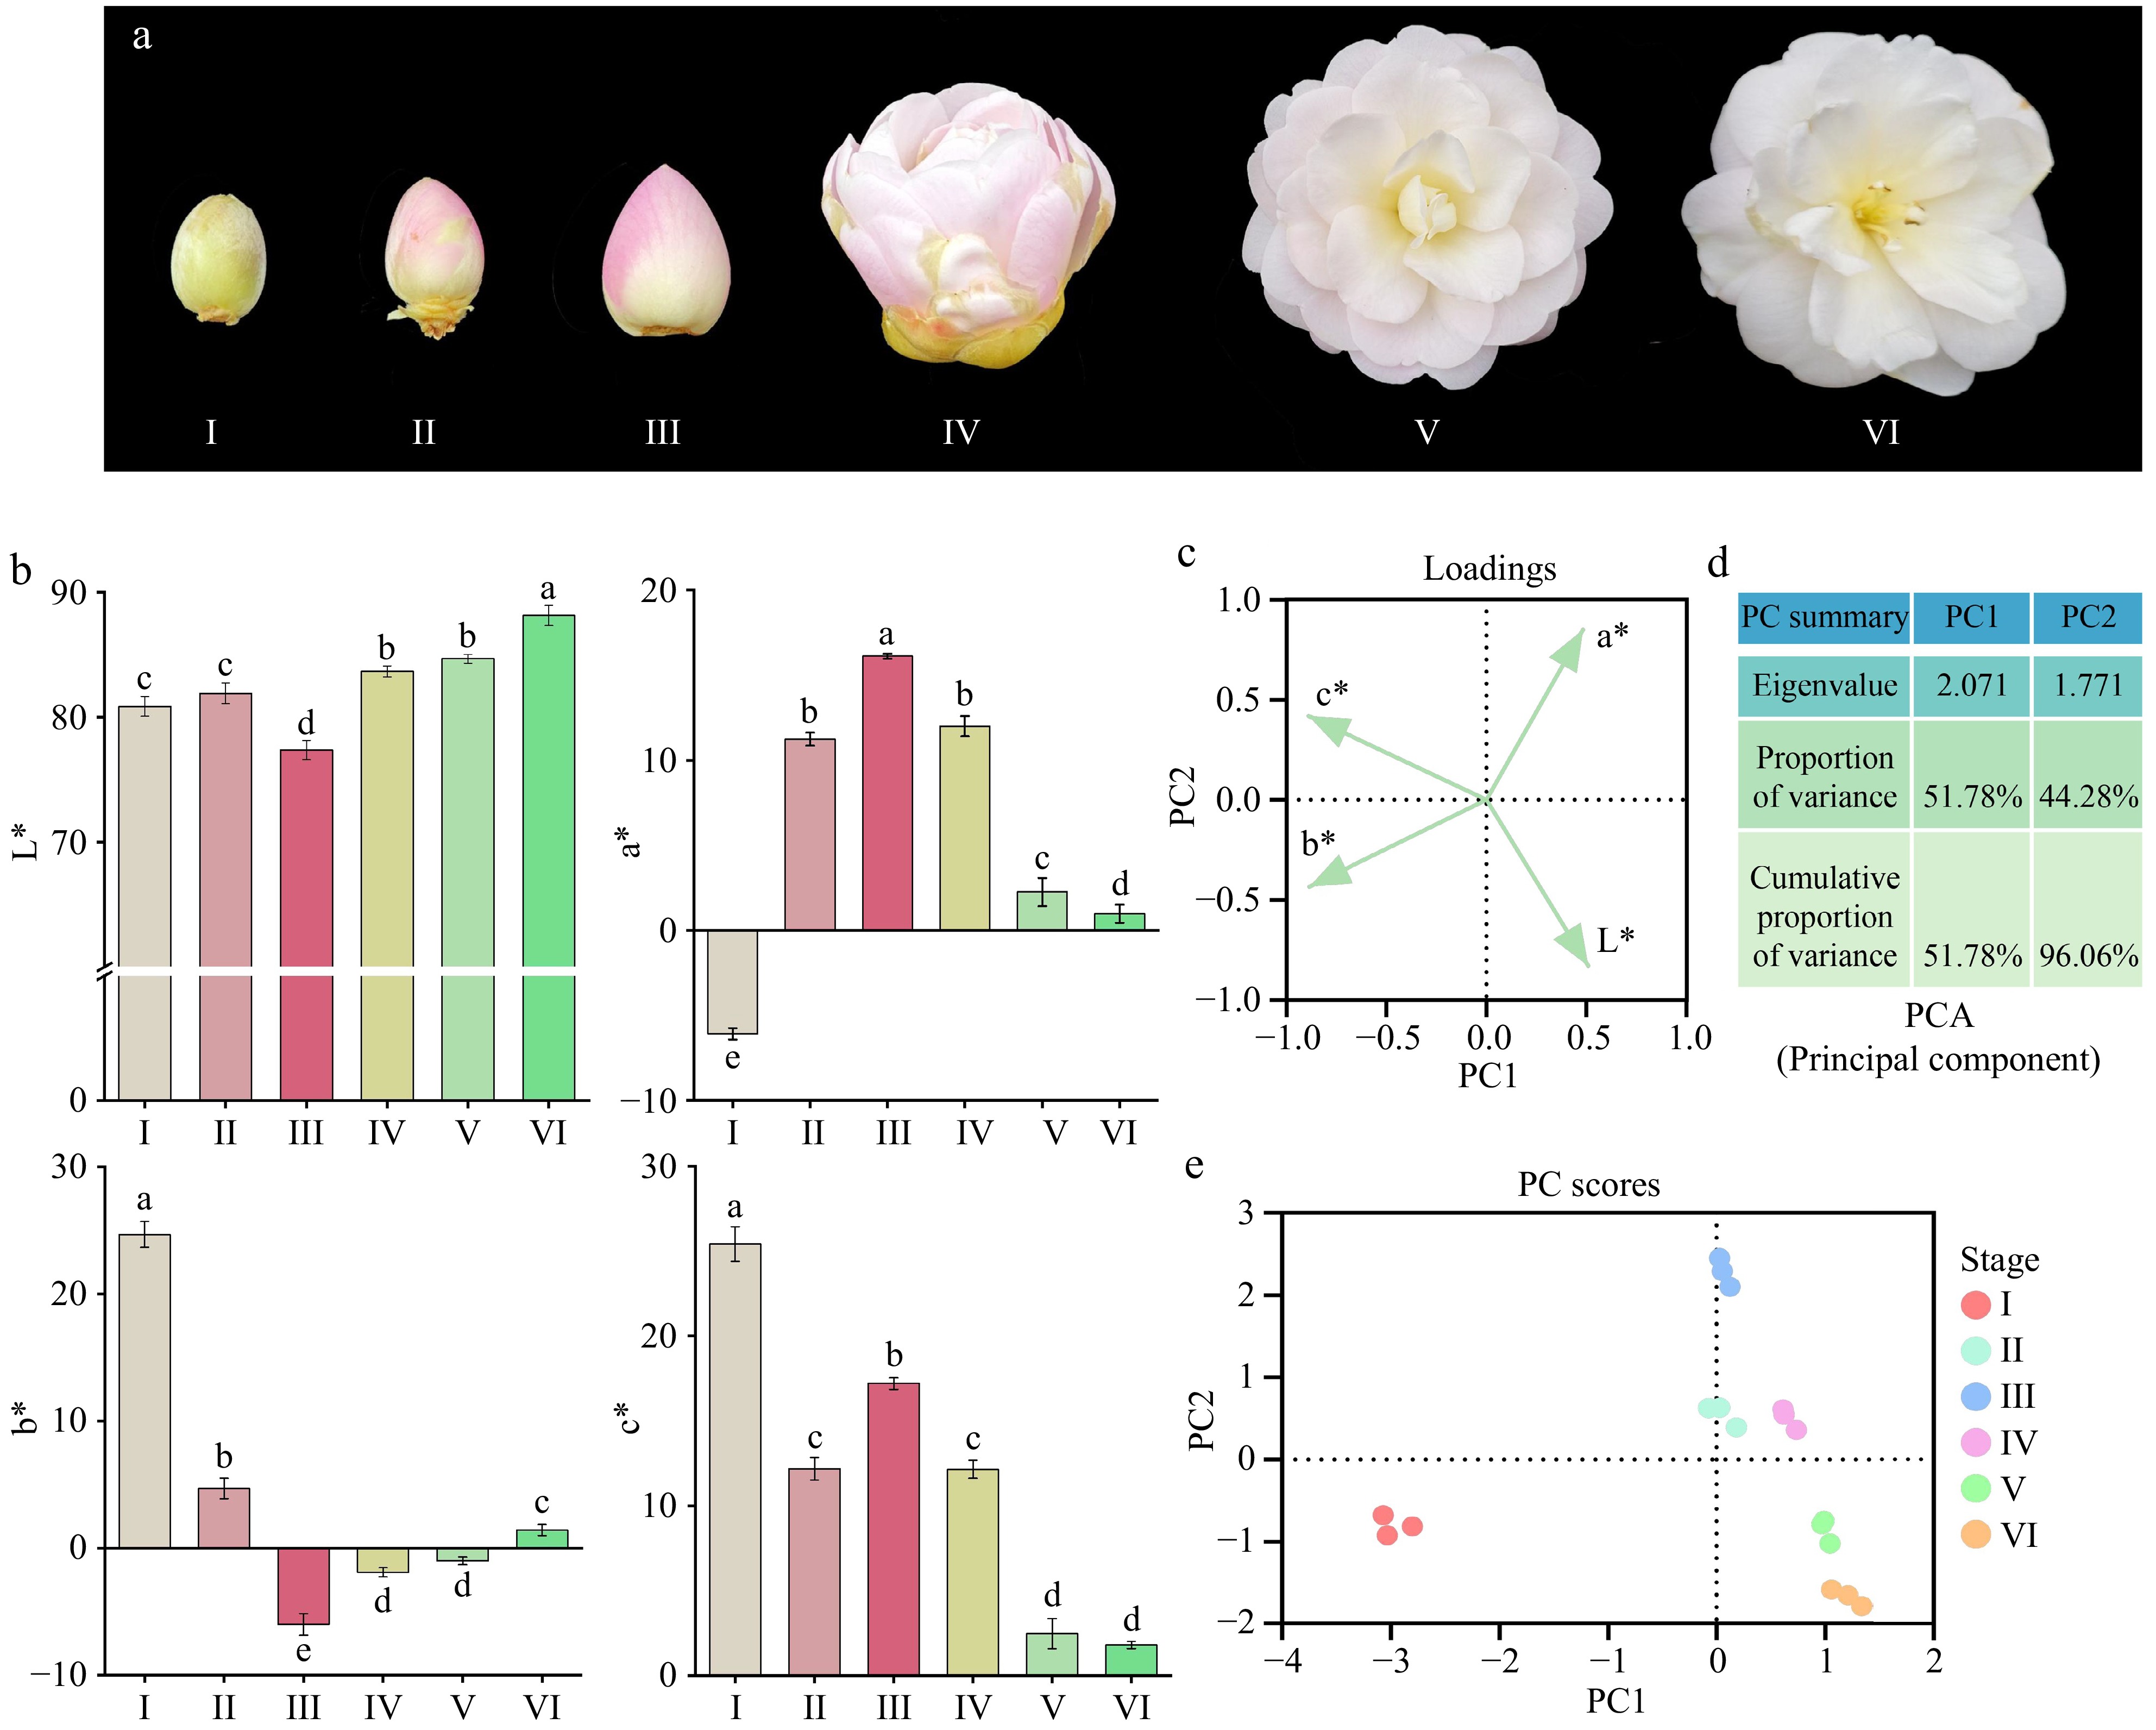
Figure 1.
(a) Color changes in 'Tongzimian' petals at six different flowering stages: I (yellow-green, bud stage), II (light pink, coloring stage), III (distinct pink, exposed color stage), IV (light pink, early bloom stage), V (whitish, full bloom stage), and VI (white, senescence stage). (b) CIELab* color parameters of petals at six coloration stages; different lowercase letters indicate significant differences (p < 0.05, ANOVA). Error bars represent the standard deviation of three biological replicates. (c) Loadings plot of Principal Component Analysis (PCA). (d) Principal Component Analysis (PCA) results. (e) Component analysis score plot.
-
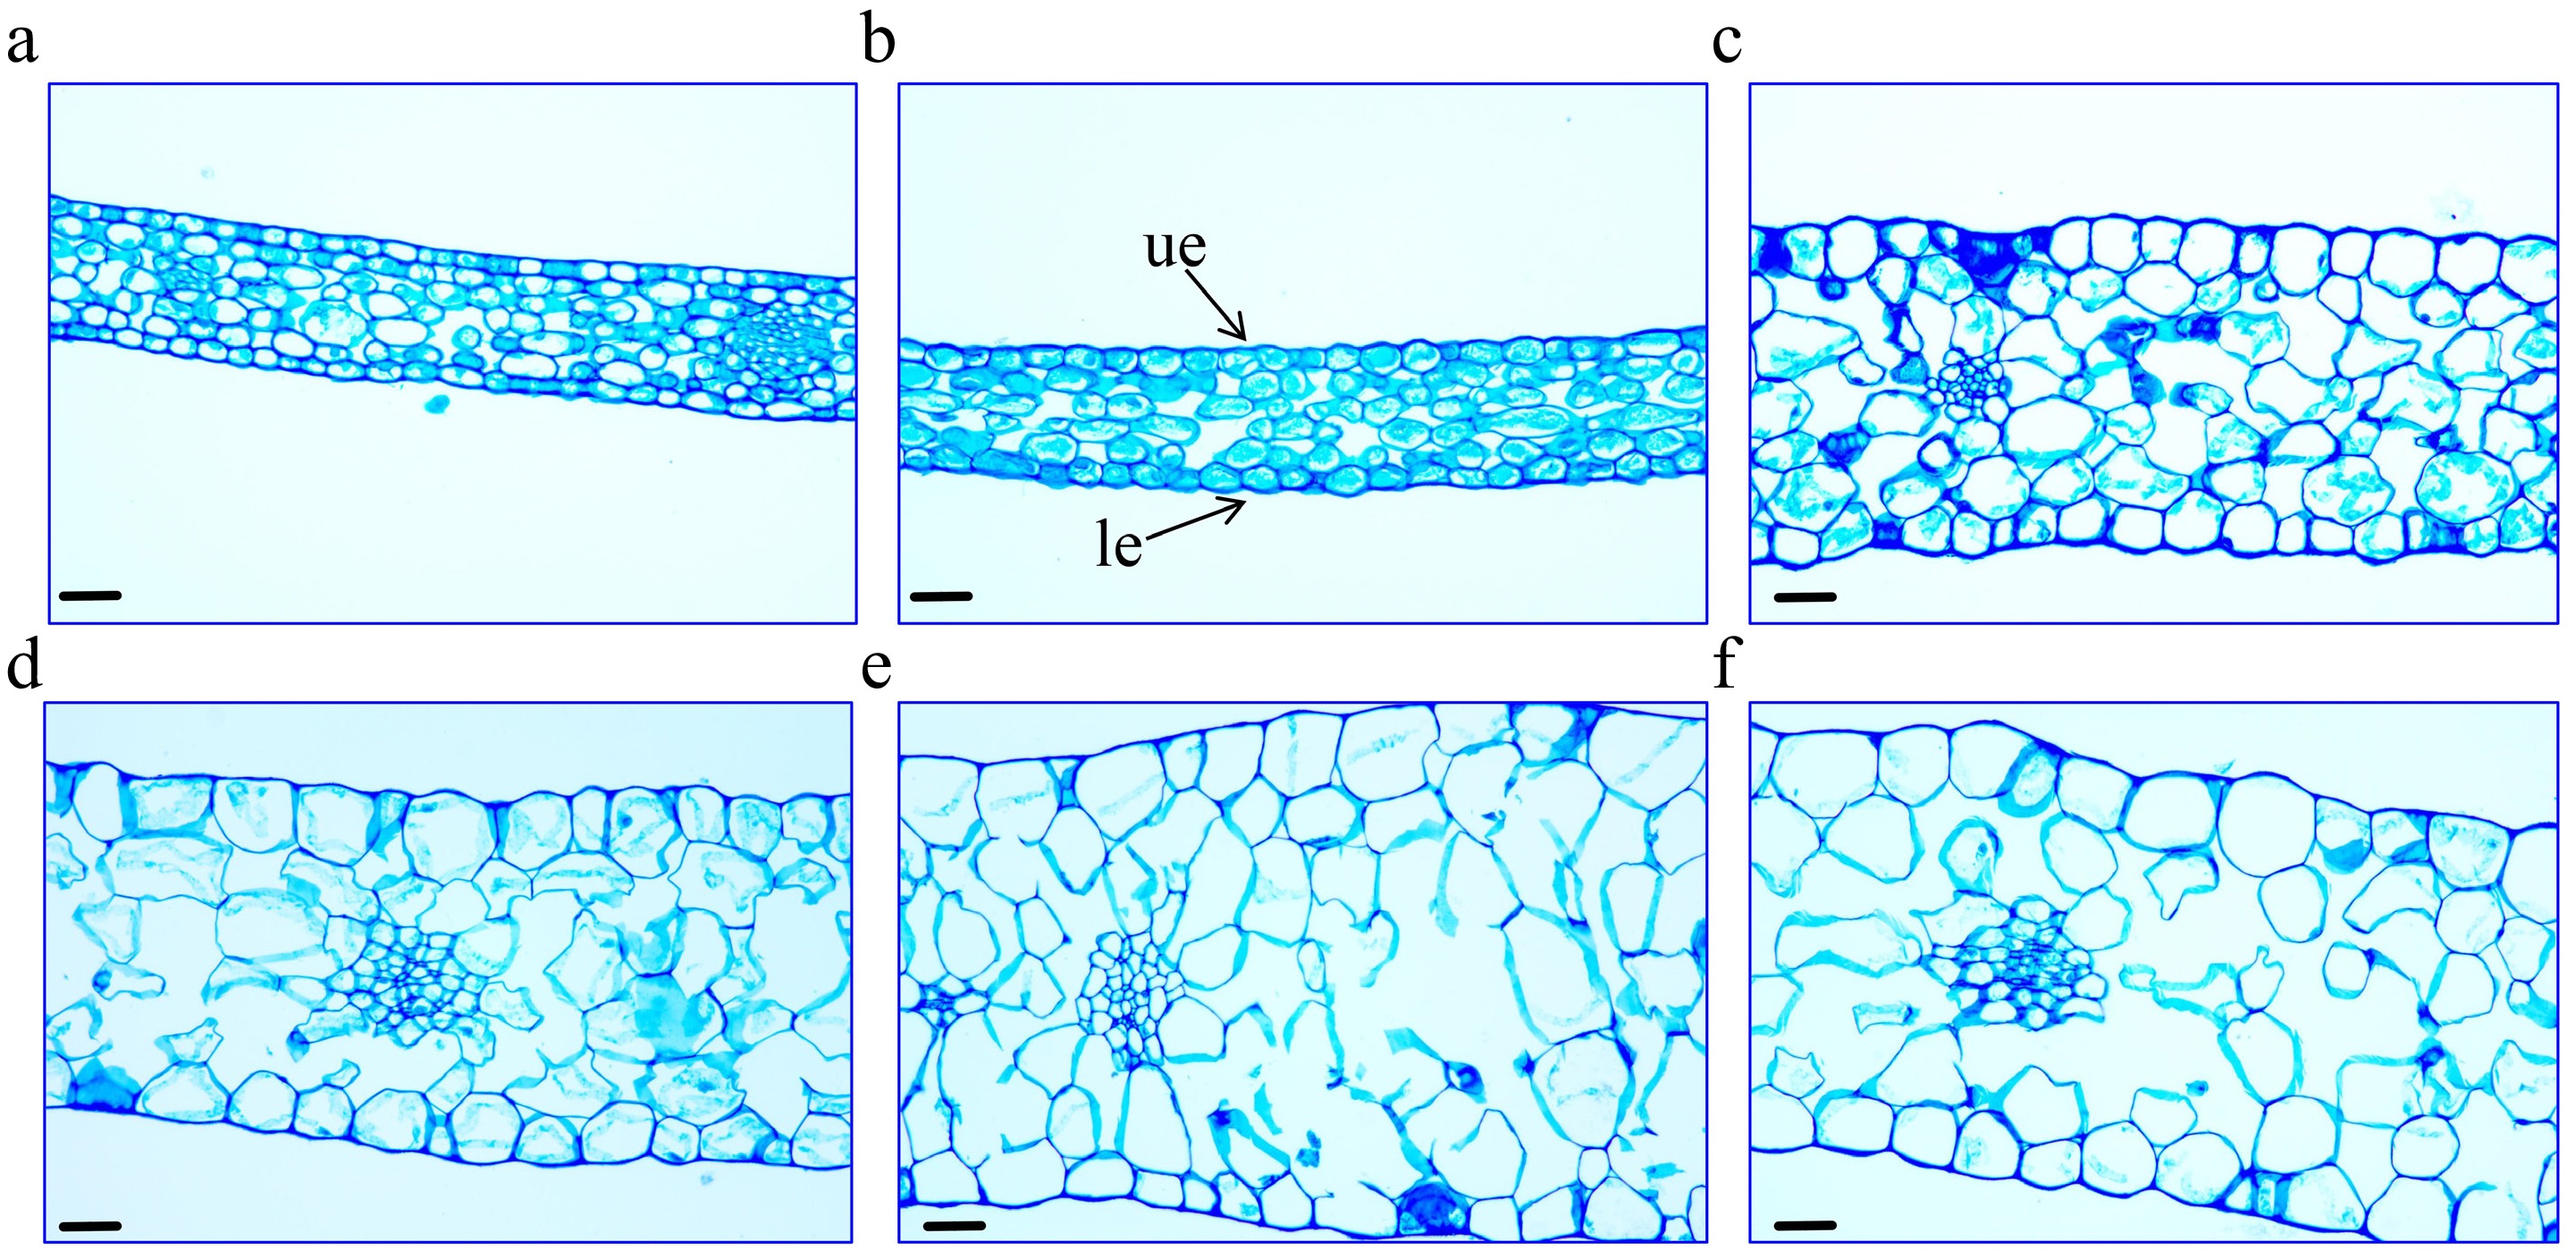
Figure 2.
Morphological changes in petal cells of 'Tongzimian' at flowering stages. (a) I (bud stage). (b) II (coloring stage). (c) III (exposed color stage). (d) IV (early bloom stage). (e) V (full bloom stage). (f) VI (senescence stage). ue: upper epidermal cells, le: lower epidermal cells. Scale bar = 40 μm.
-
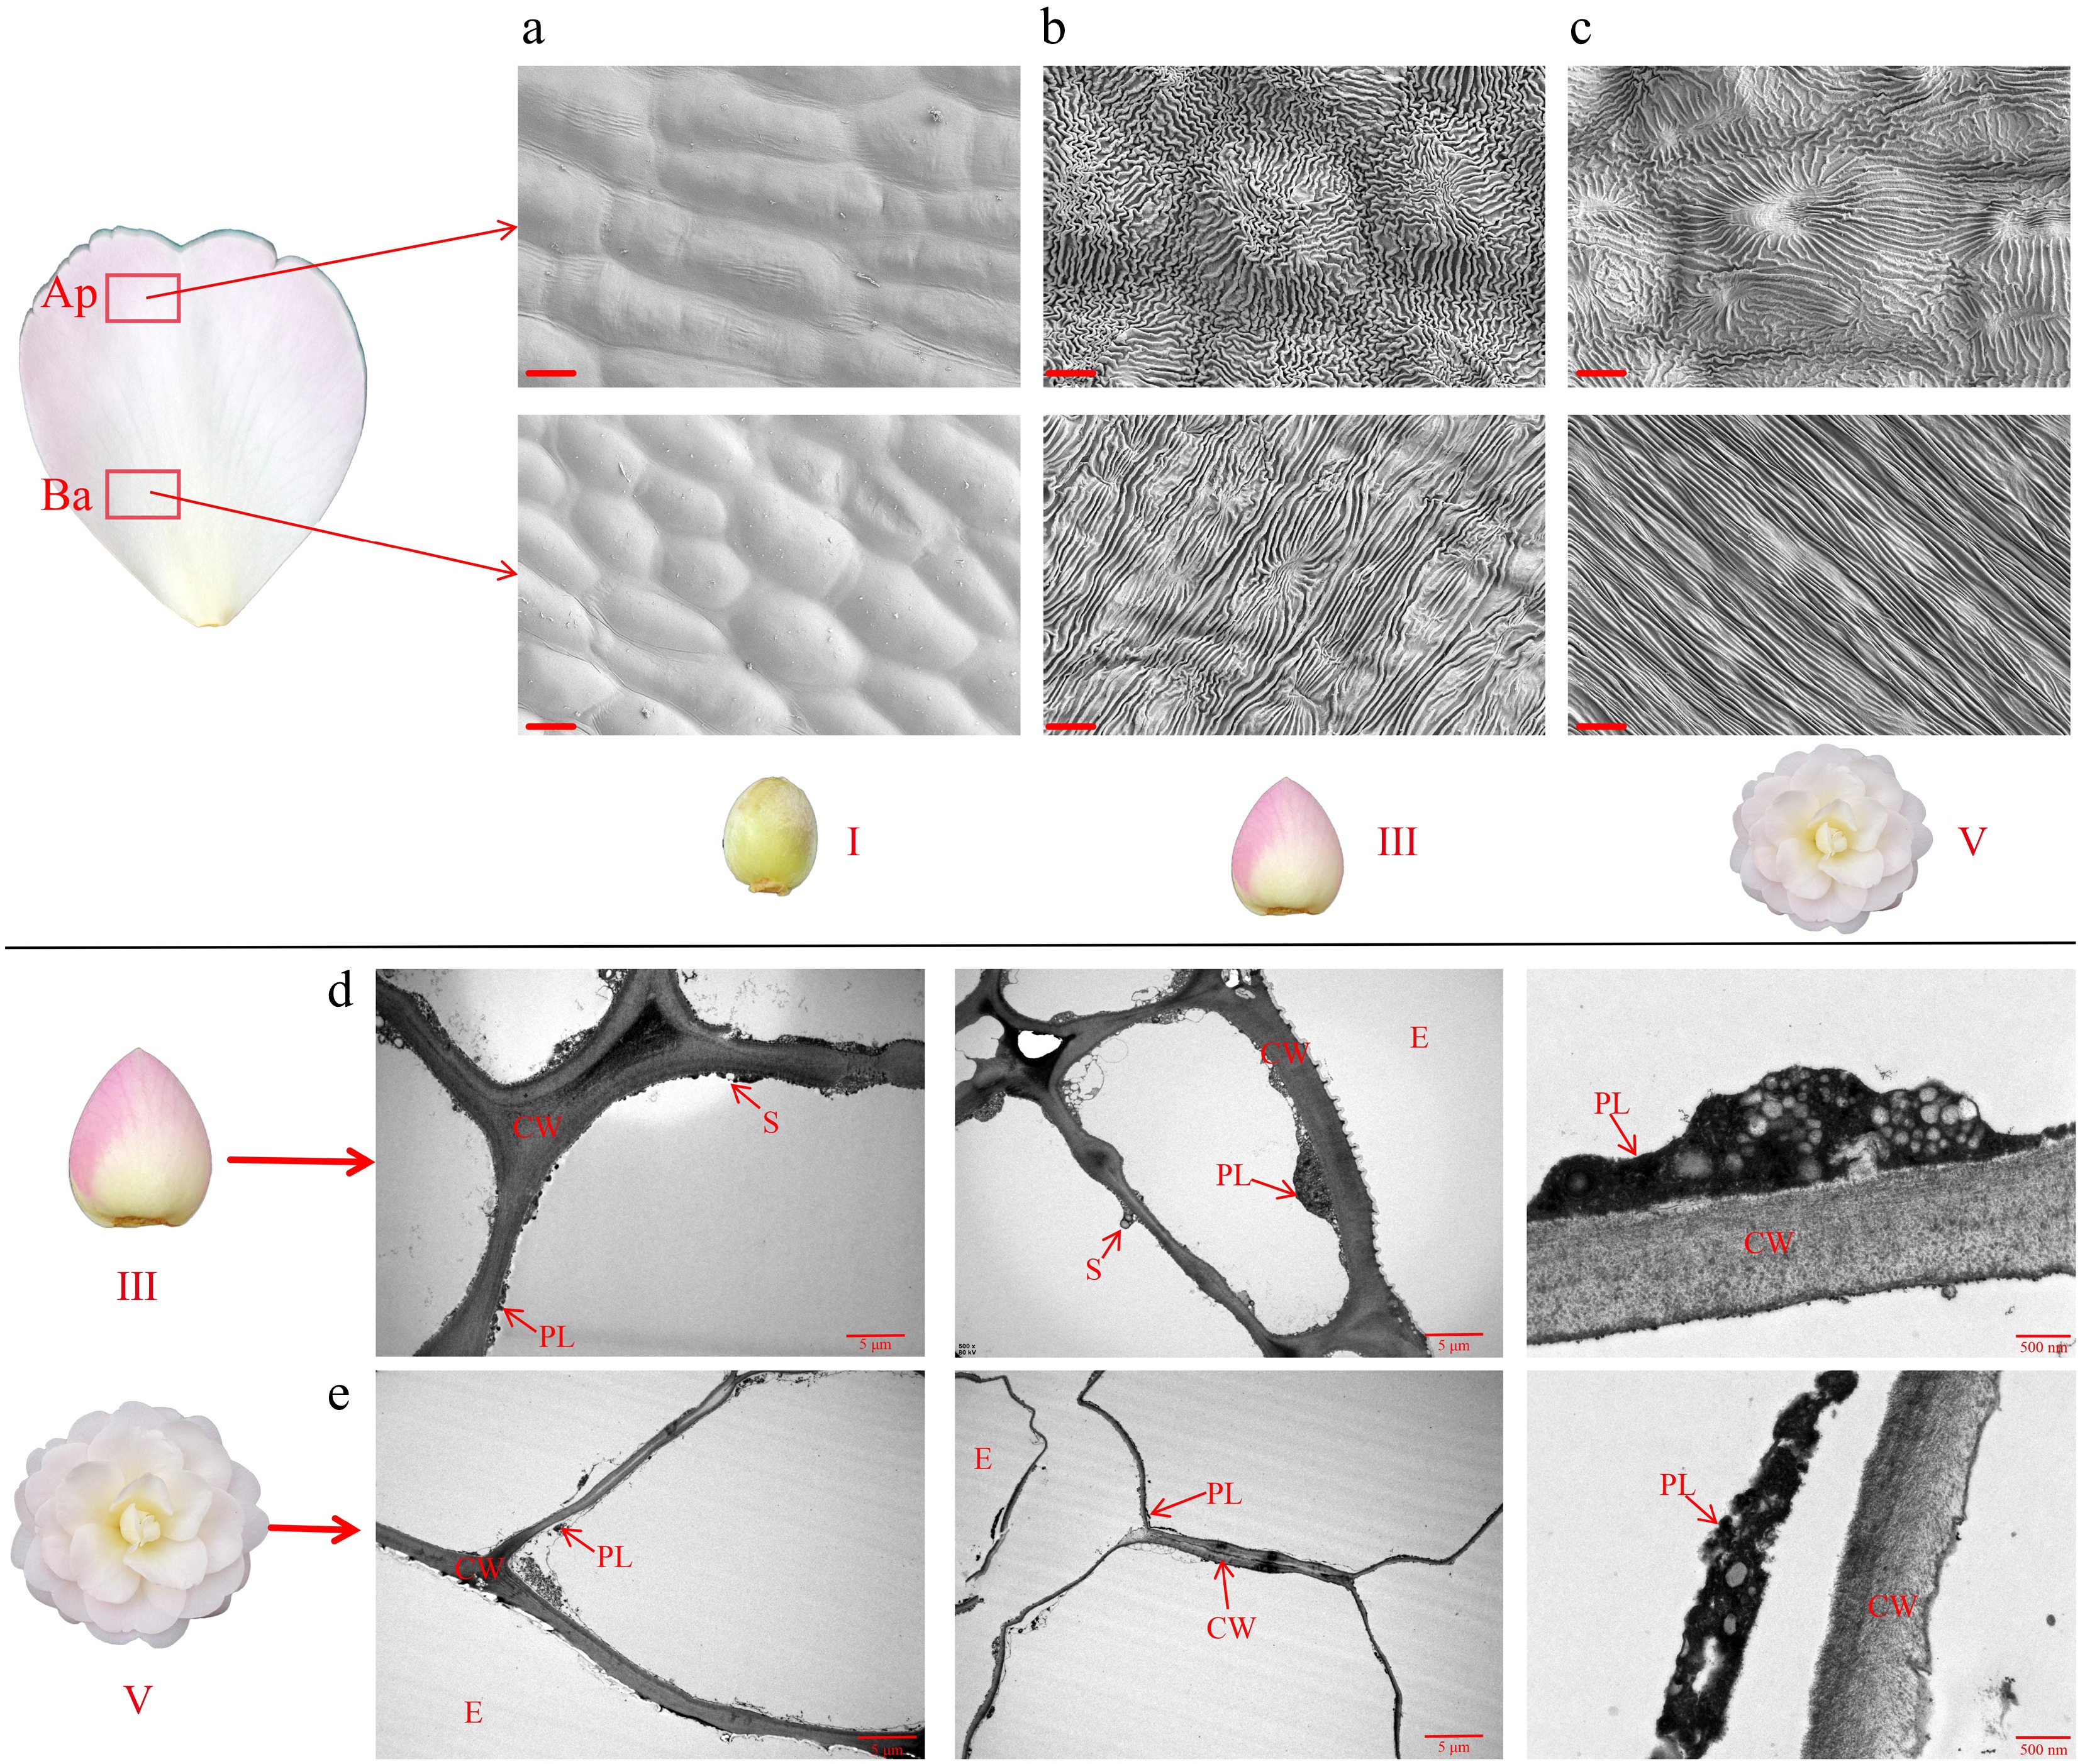
Figure 3.
Morphological changes in petal cells of 'Tongzimian'. (a)−(c) Ultrastructure of petal cells from SEM at stage I, stage III, and stage V; Ap: Apex position of the petal; Ba: Base position of the petal; scale bar = 10 μm. (d), (e) Ultrastructure of petal cells from TEM at stage III and stage V; PL: Plastid, CW: Cell wall, S: Starch granule, E: Epidermal cells; scale bar = 5 μm.
-
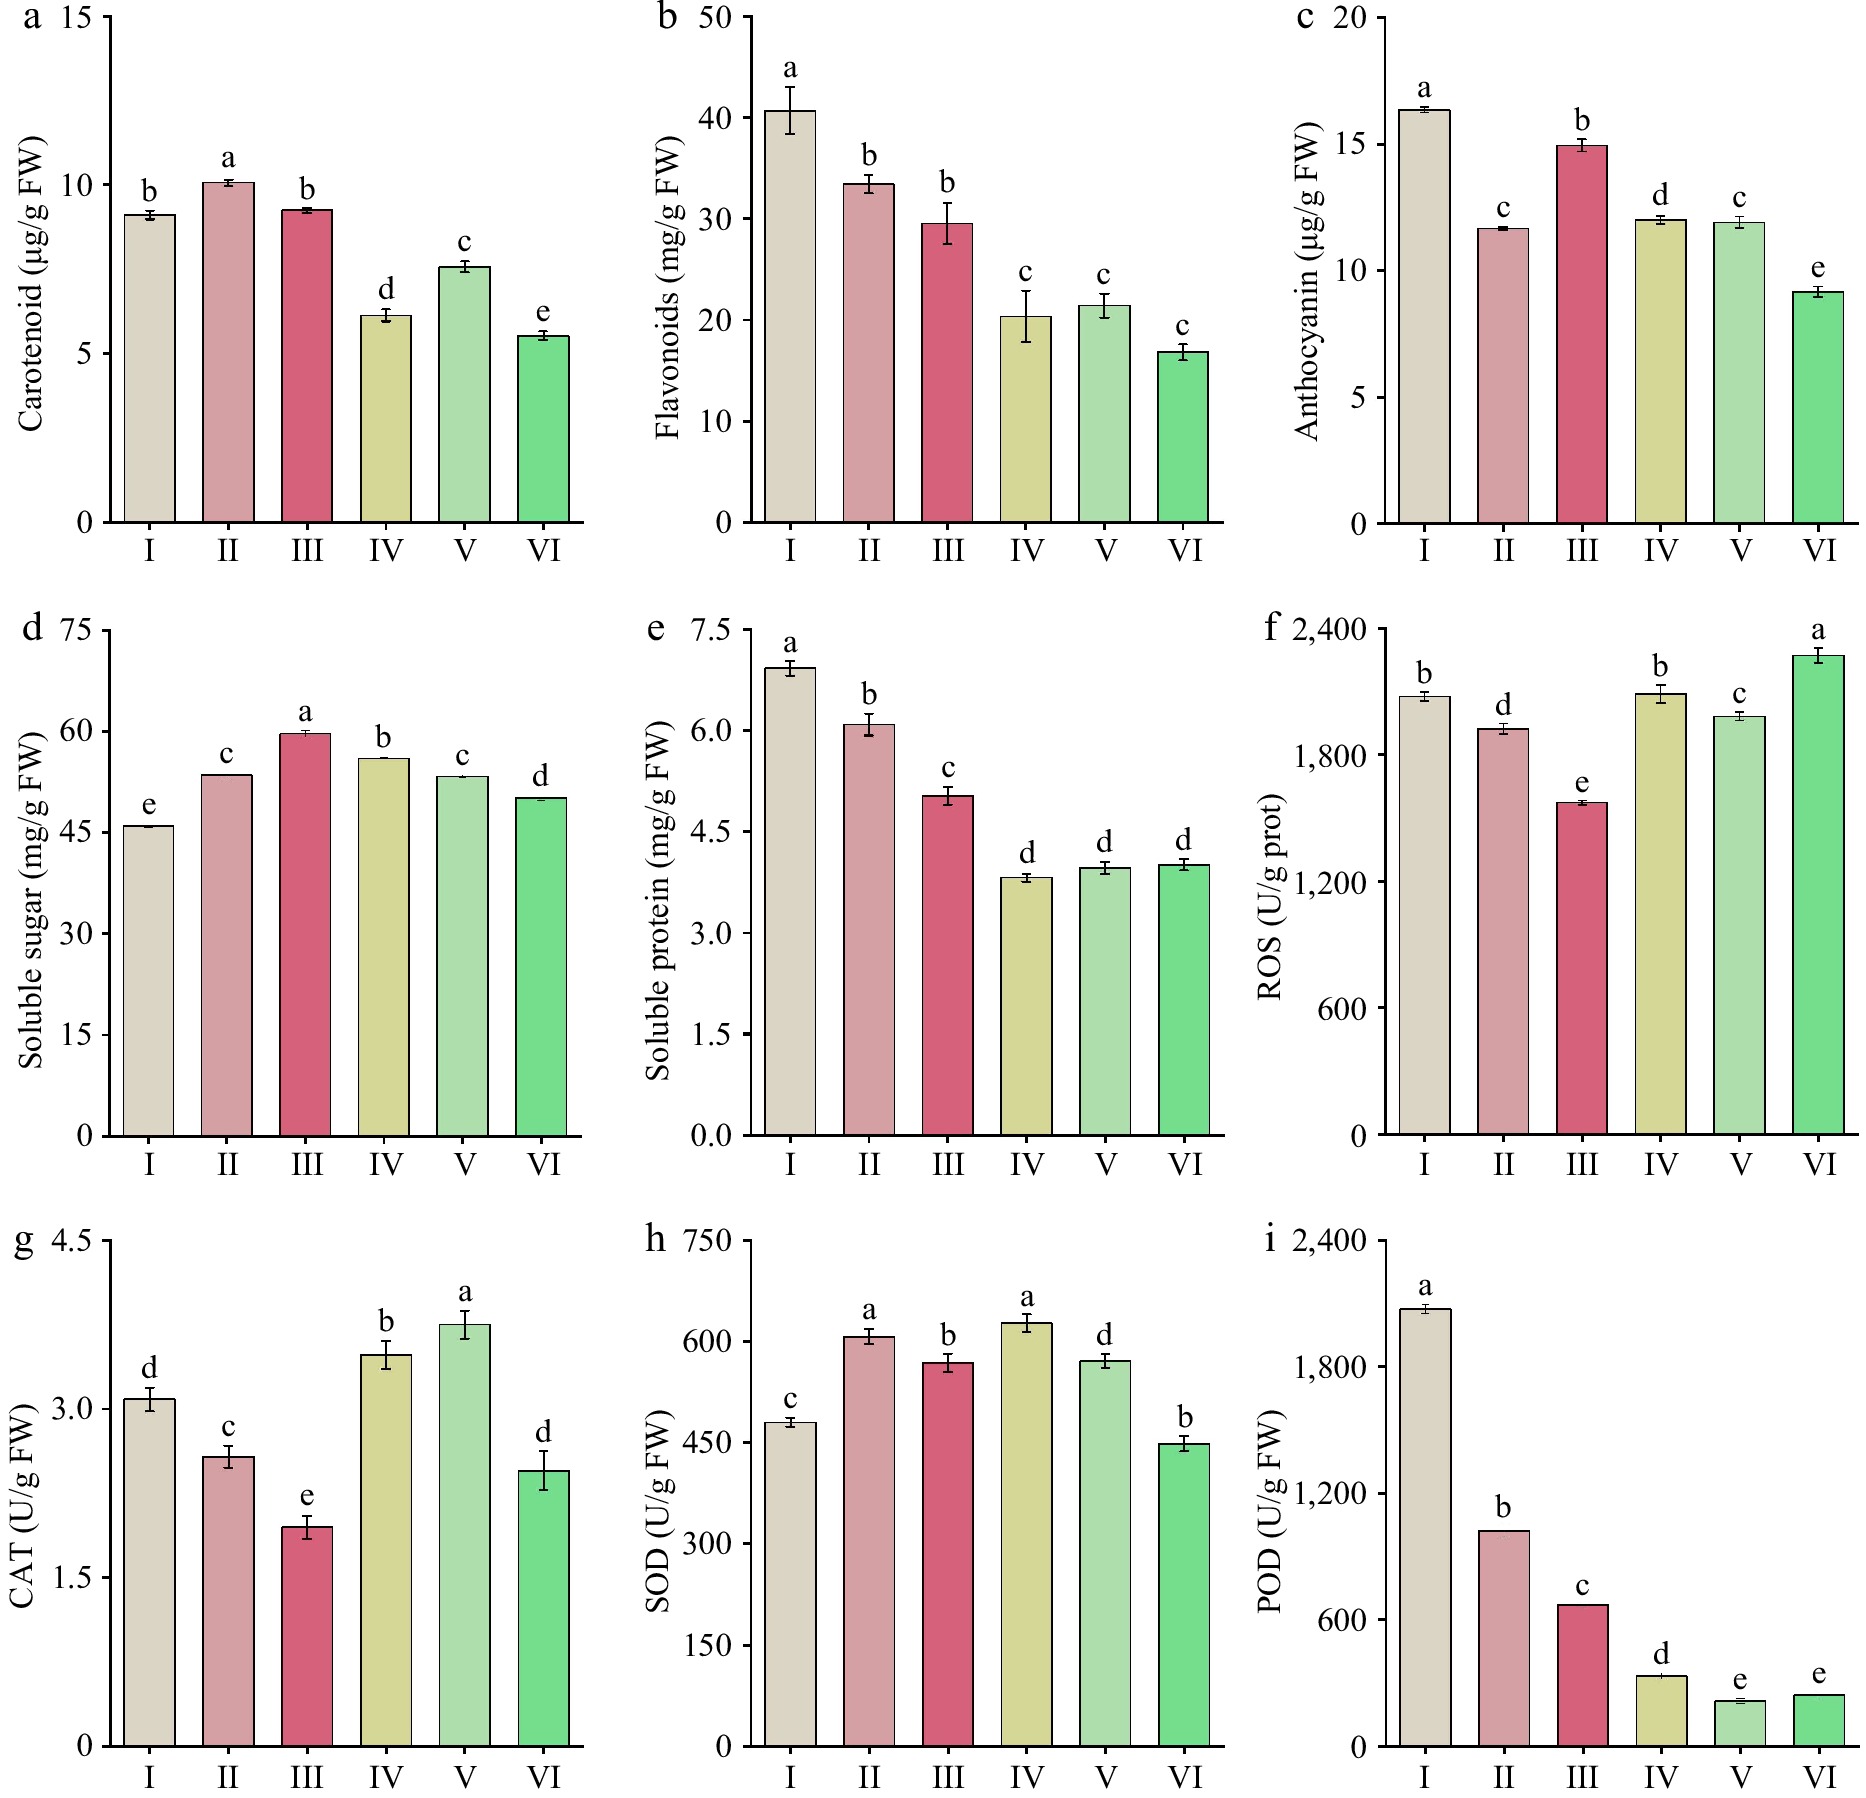
Figure 4.
Changes in pigment content, osmotic regulatory substances, and antioxidant enzyme activity in 'Tongzimian' petals at flowering stages. (a) Carotenoids. (b) Flavonoids. (c) Anthocyanin. (d) Soluble sugars. (e) Soluble protein. (f) Reactive oxygen species (ROS). (g) Catalase (CAT). (h) Superoxide dismutase (SOD). (i) Peroxidase (POD). Different lowercase letters indicate significant differences (p < 0.05, ANOVA).
-
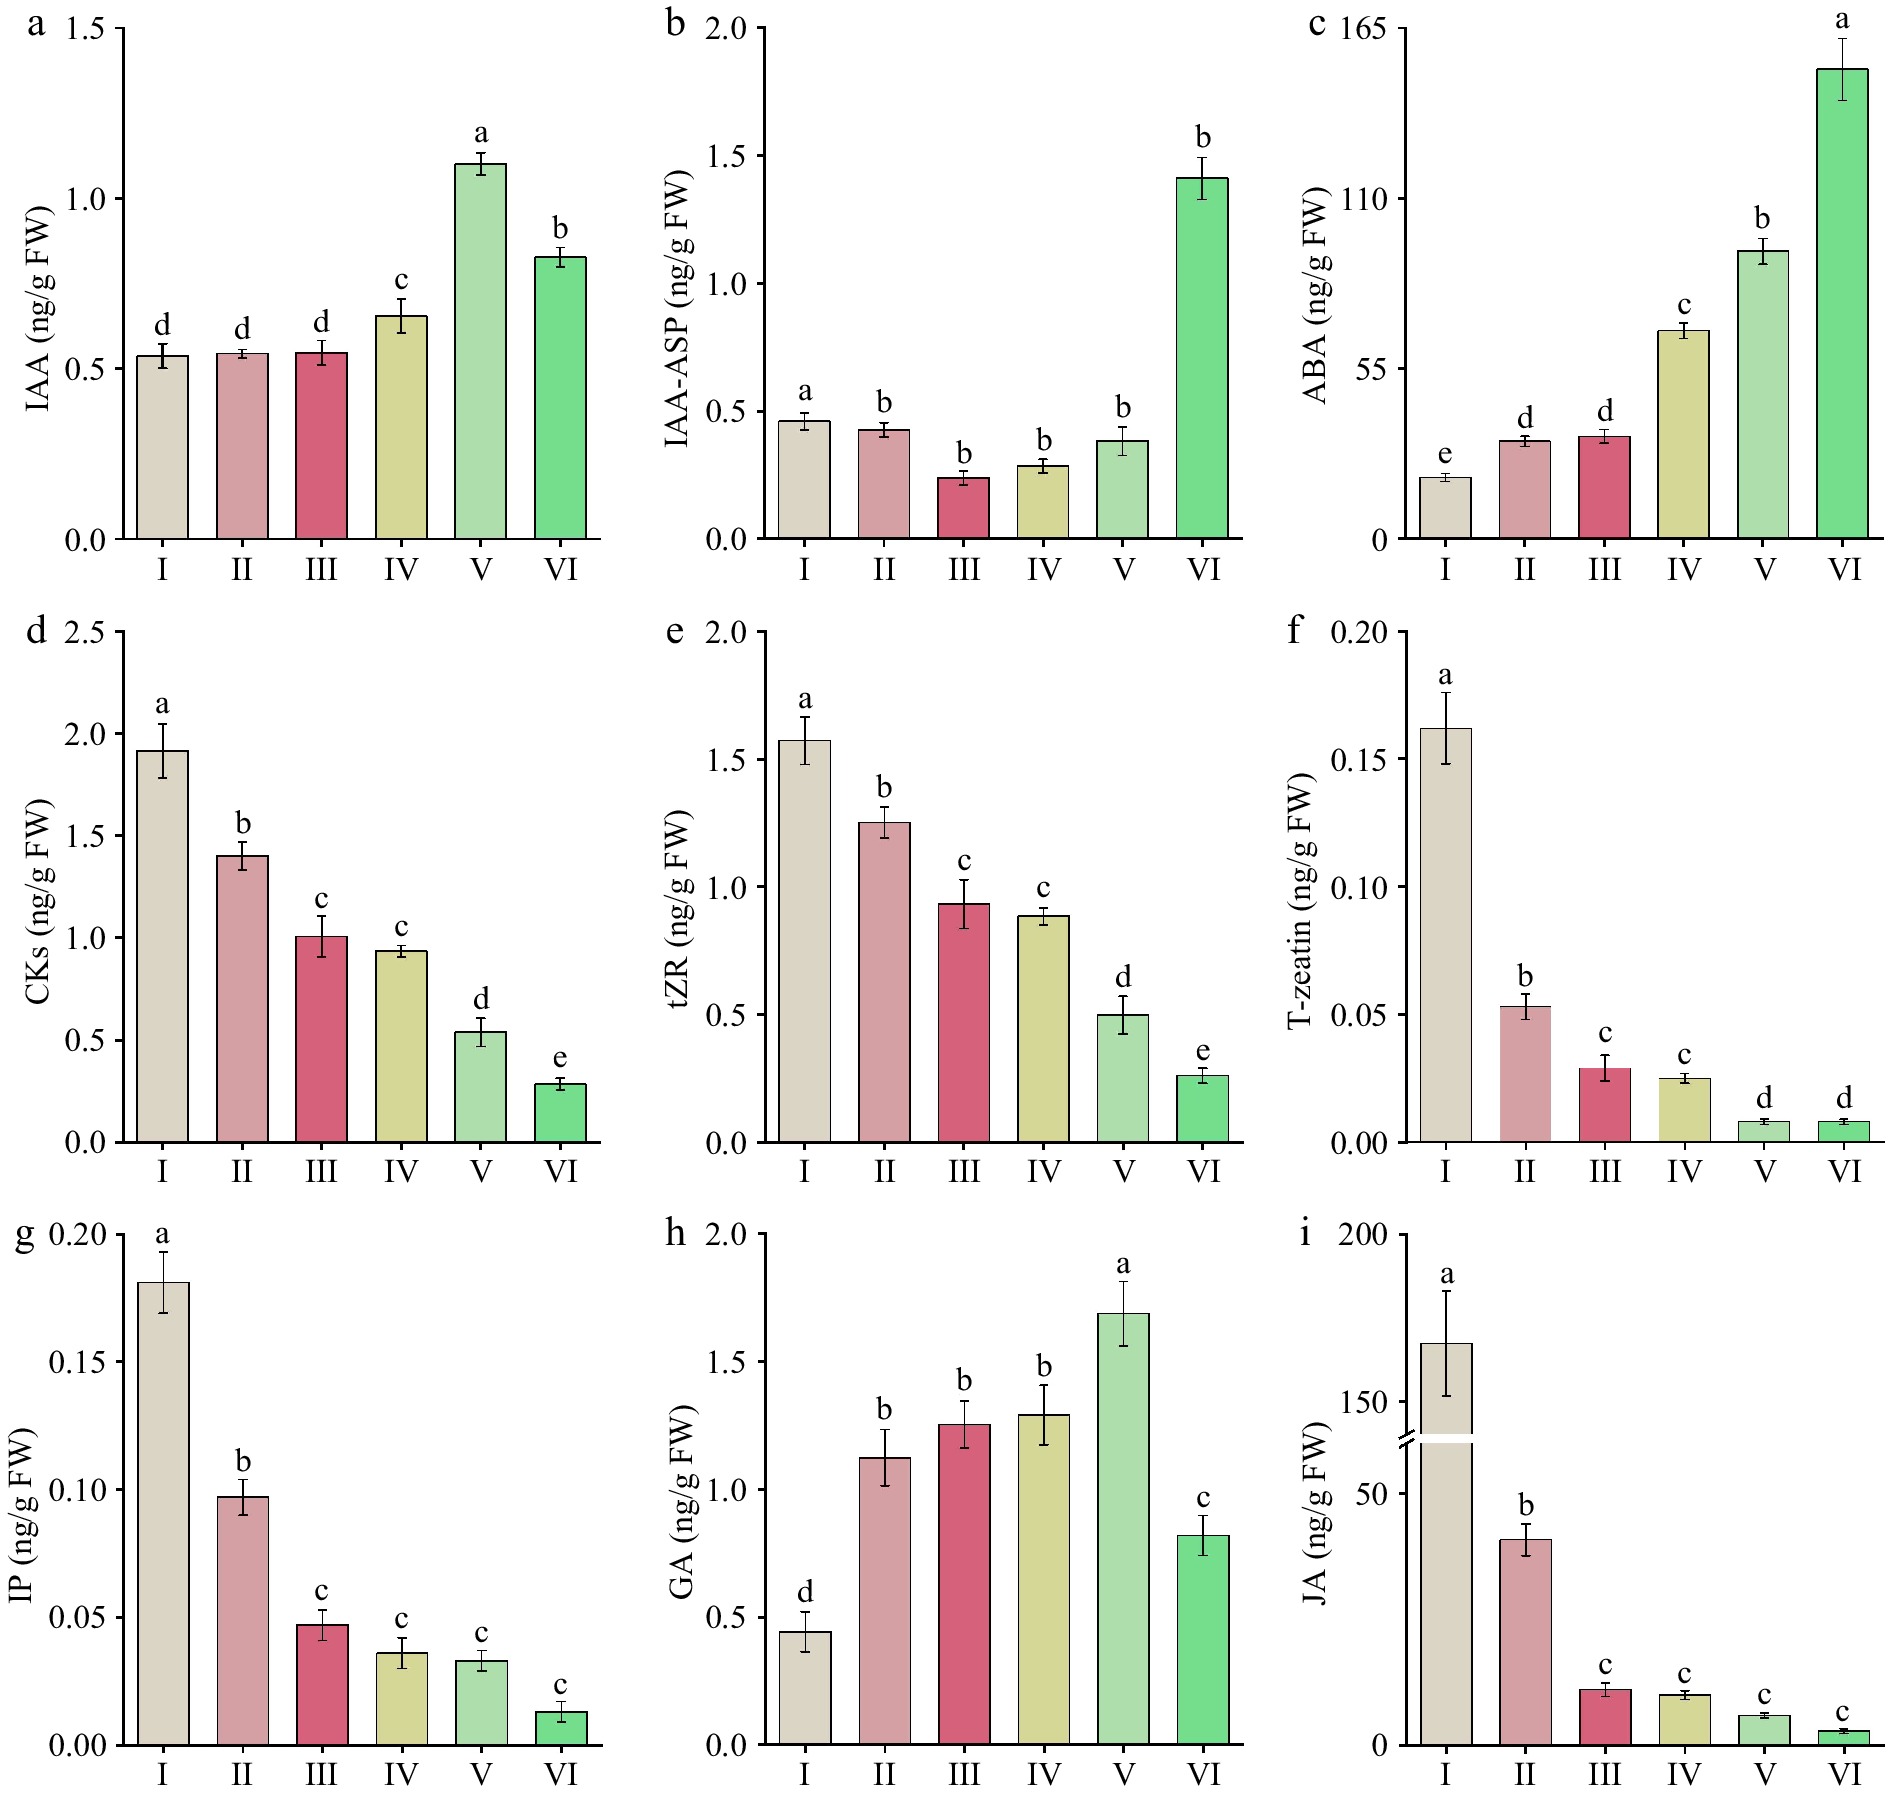
Figure 5.
Endogenous hormone levels in 'Tongzimian' petals at six different flowering stages. (a) Auxin (IAA). (b) Indole-3-acetic acid-aspartic (IAA-ASP). (c) Abscisic acid (ABA). (d) Cytokinins (CKs). (e) Trans-zeatin riboside (tZR). (f) Trans-zeatin (T-zeatin). (g) Isopentenyl adenine (IP). (h) Gibberellins (GA). (i) Jasmonic acid (JA). Different lowercase letters indicate significant differences (p < 0.05, ANOVA).
-
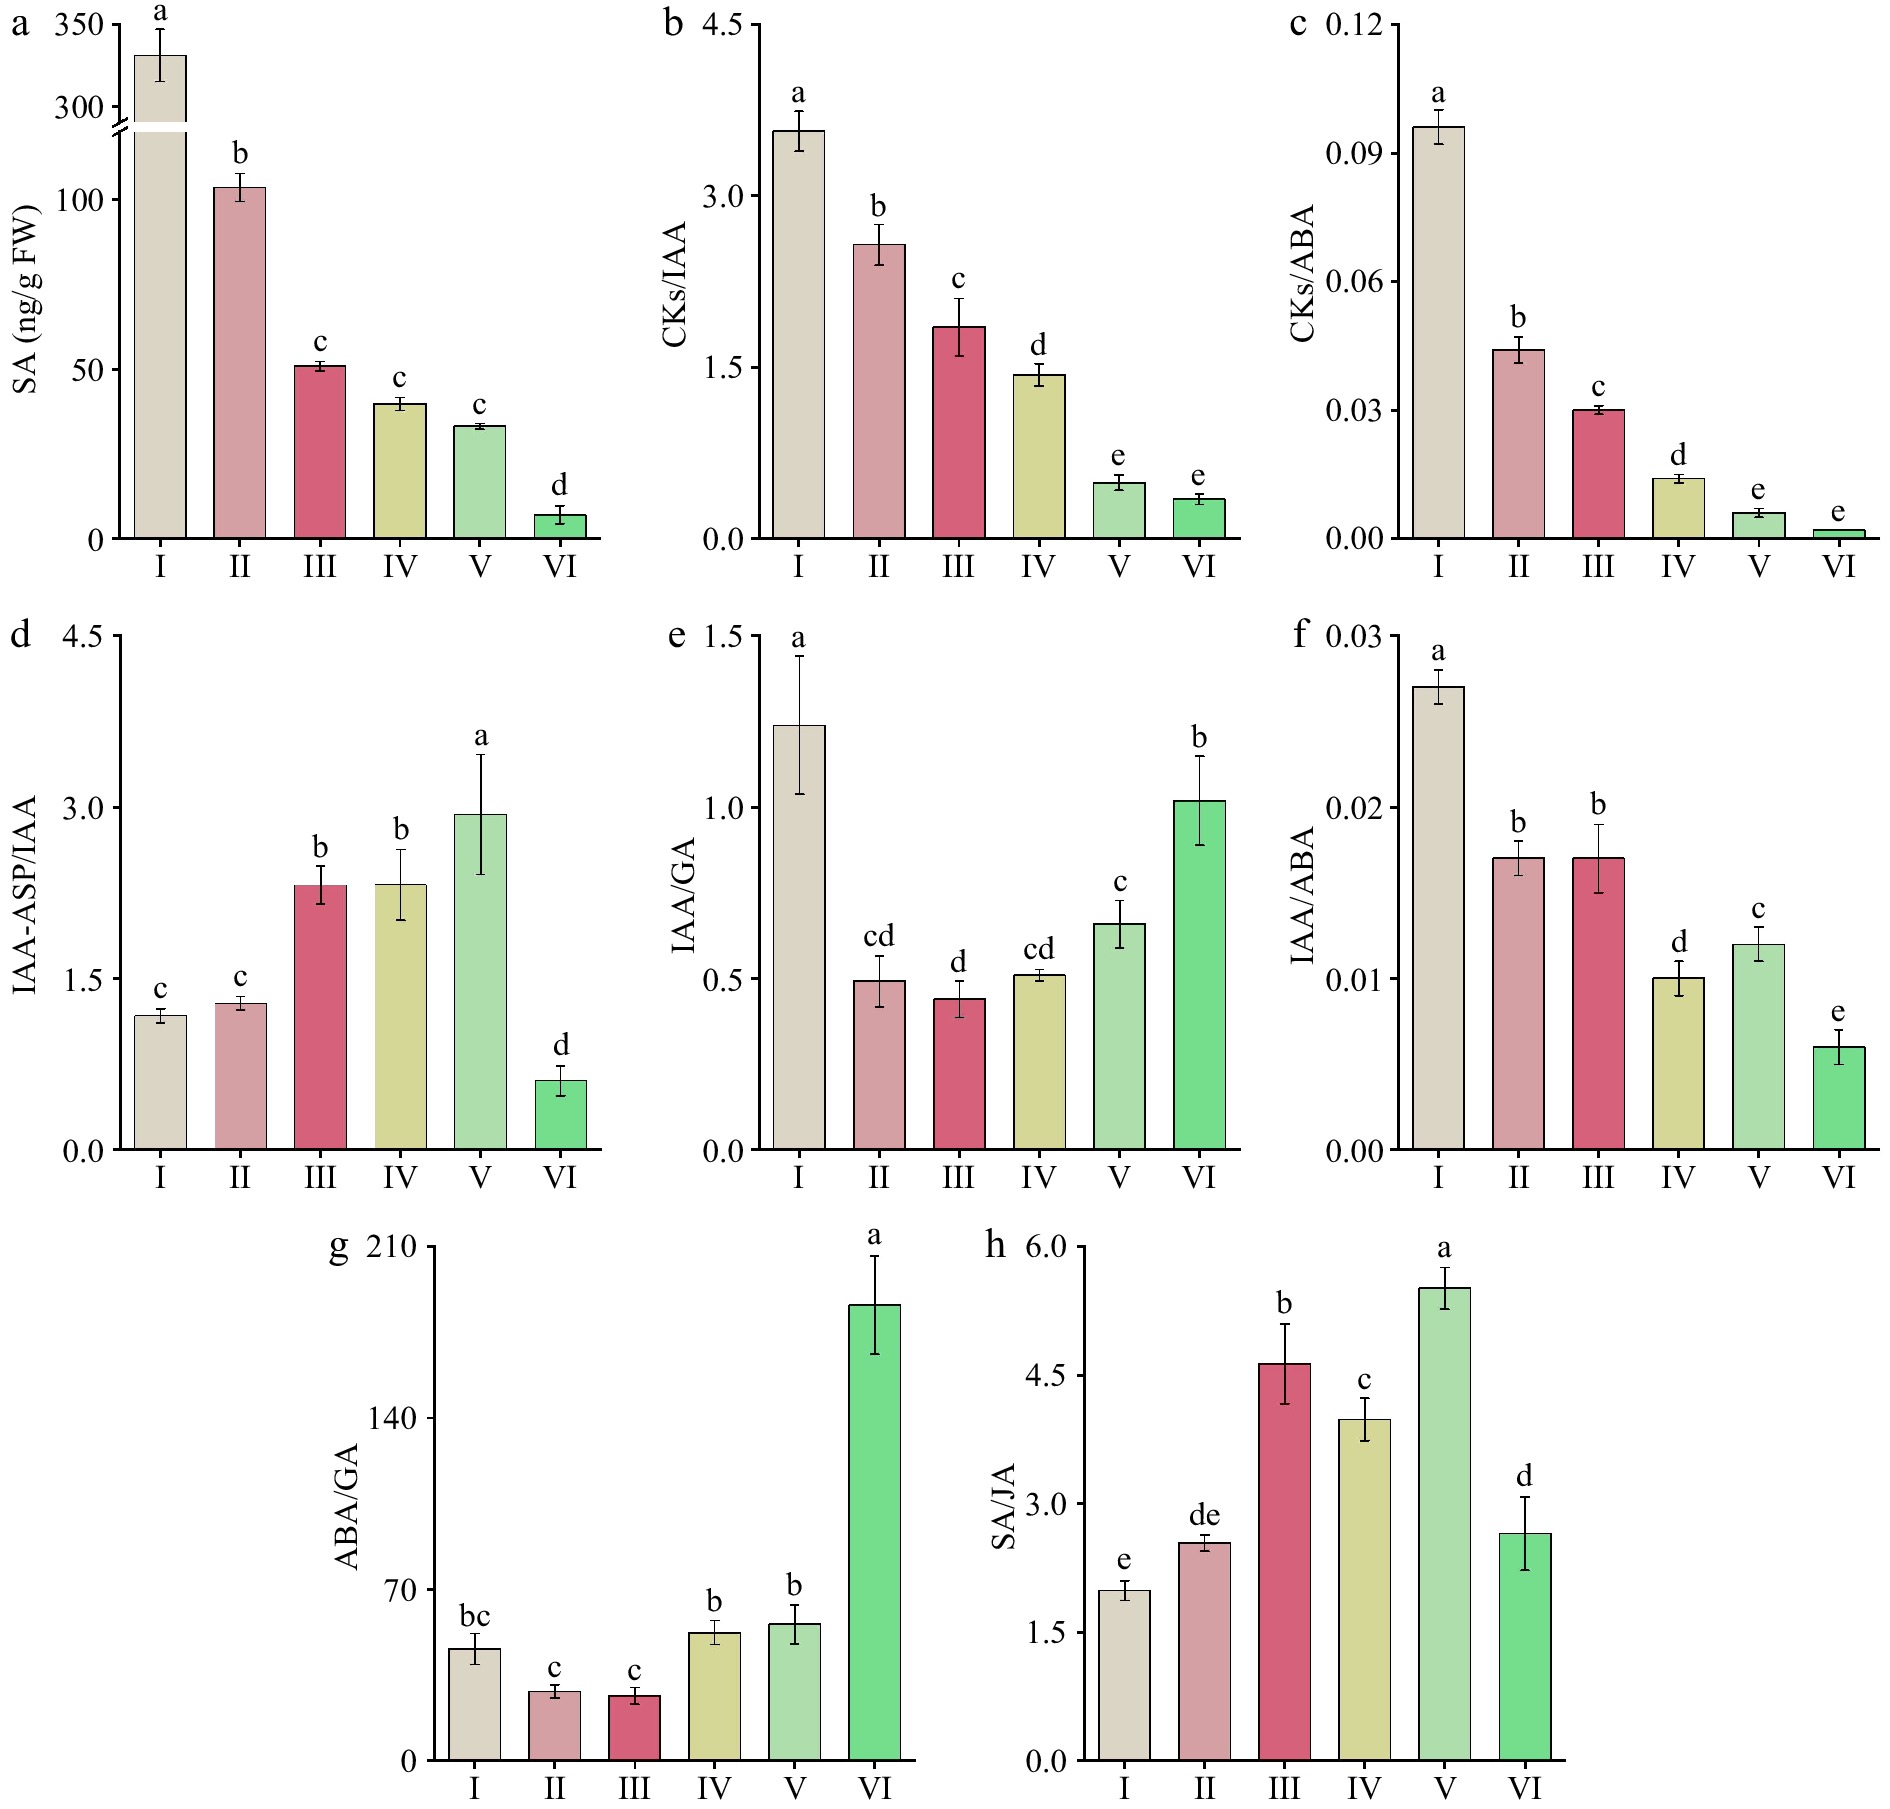
Figure 6.
Changes in endogenous hormone levels and their ratios at six different flowering stages of 'Tongzimian'. (a) Salicylic acid (SA). (b) Cytokinins/Auxin (CKs/IAA). (c) Cytokinins/Abscisic acid (CKs/ABA). (d) Auxin/Indole-3-acetyl-aspartic acid (IAA/IAA-ASP). (e) Auxin/Gibberellin (IAA/GA). (f) Auxin/Abscisic acid (IAA/ABA). (g) Abscisic acid/Gibberellin (ABA/GA). (h) Salicylic Acid/Jasmonic acid (SA/JA). Different lowercase letters indicate significant differences (p < 0.05, ANOVA).
-
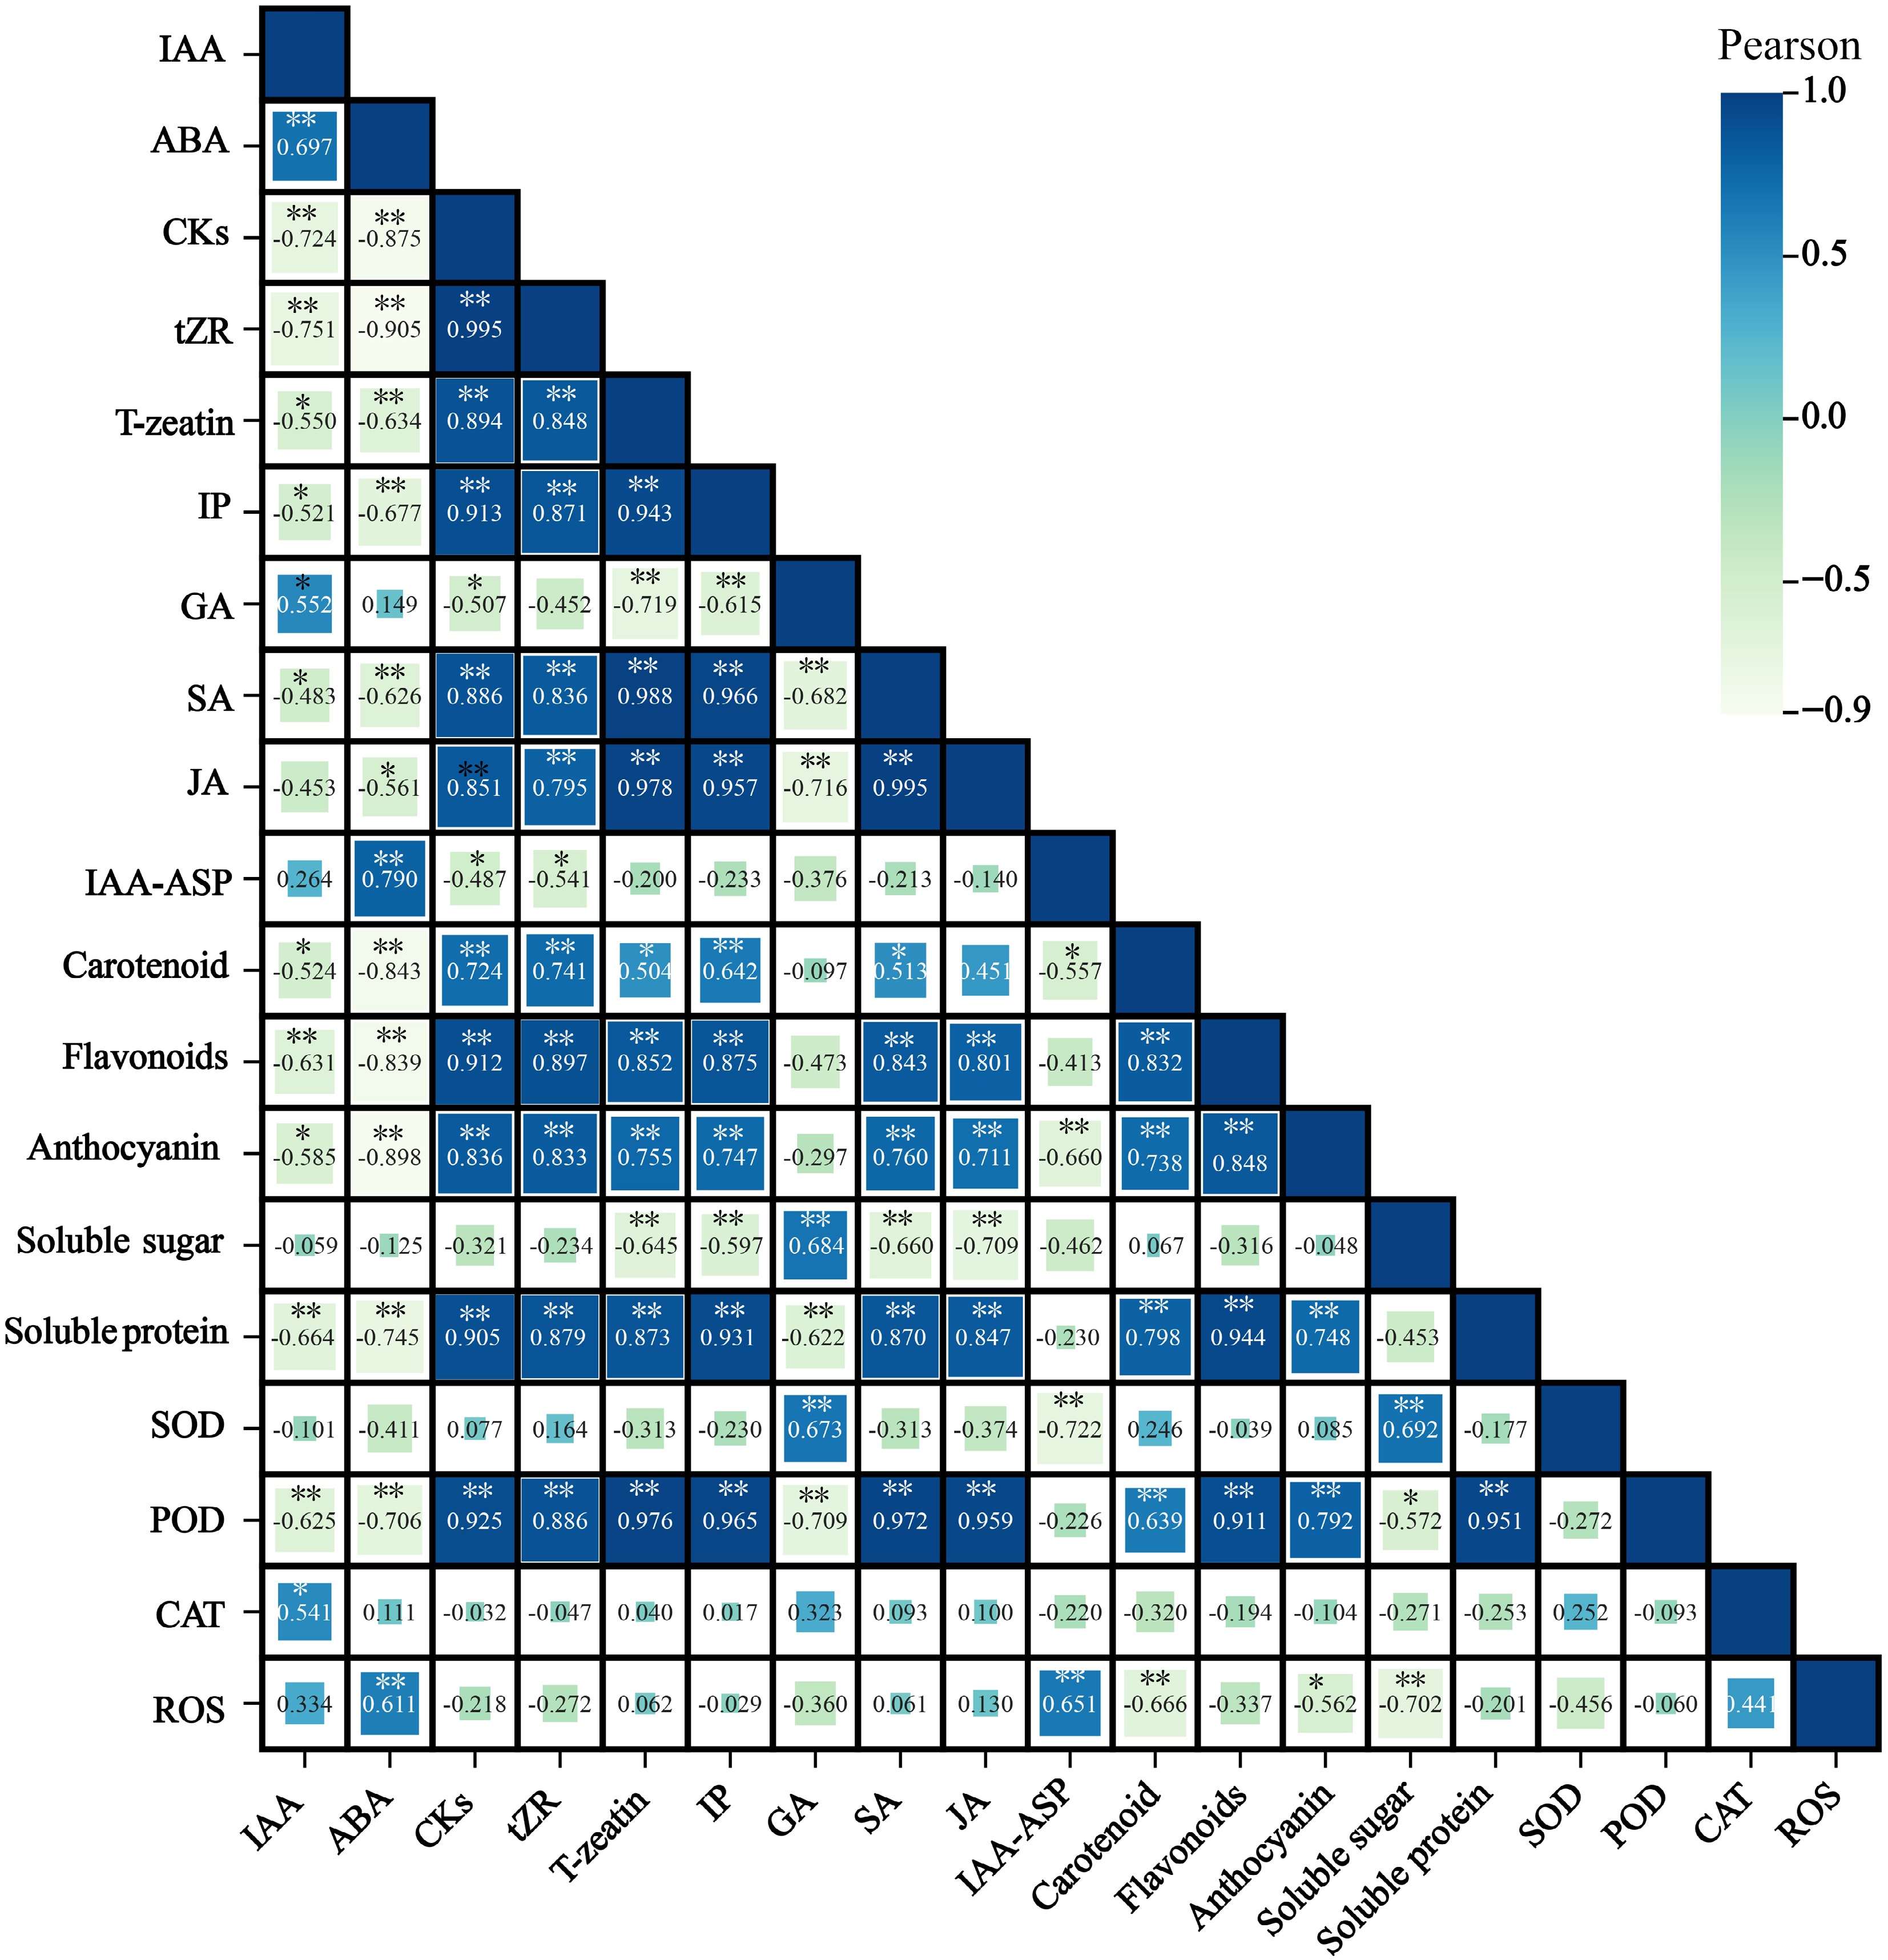
Figure 7.
Correlation between petal pigment composition and content, endogenous hormones, osmotic regulatory substances, and antioxidant enzymes at flowering stages of 'Tongzimian'. Auxin (IAA), Abscisic acid (ABA), Cytokinins (CKs), Trans-zeatin riboside (tZR), Trans-zeatin (T-zeatin), Isopentenyl adenine (IP), Gibberellins (GA), Salicylic acid (SA), Jasmonic acid (JA), Indole-3-acetic acid-aspartic (IAA-ASP), Superoxide dismutase (SOD), Peroxidase (POD), Catalase (CAT), Reactive oxygen species (ROS). Darker colors indicate positive correlations, while lighter colors indicate negative correlations. * Indicates significance at the 0.05 level, and ** indicates significance at the 0.01 level.
Figures
(7)
Tables
(0)