-
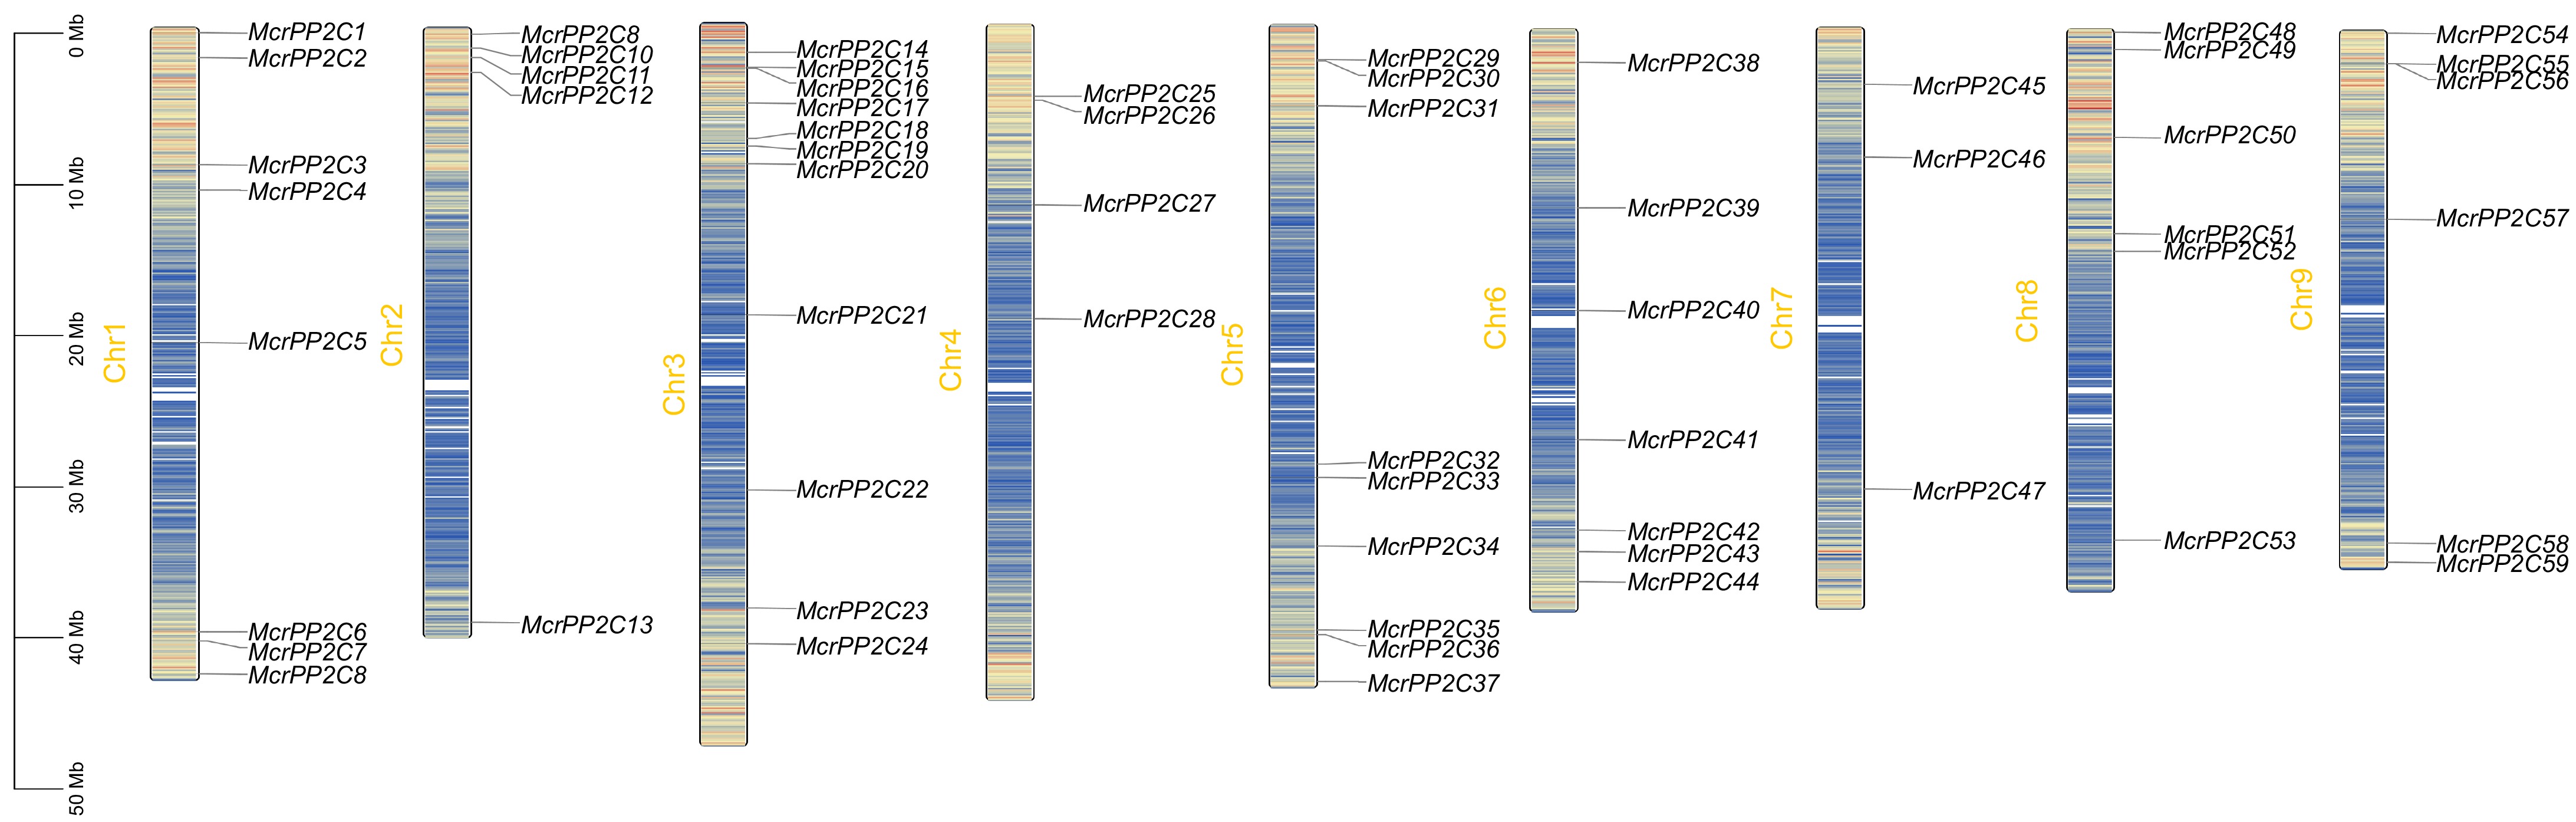
Figure 1.
Chromosome distribution of the PP2C gene family in M. crystallinum. McrPP2Cs are marked on nine chromosomes and the chromosome length is demonstrated in the left scale. Different chromosomal colors indicate different gene densities, with red representing the highest density and blue representing the lowest density.
-
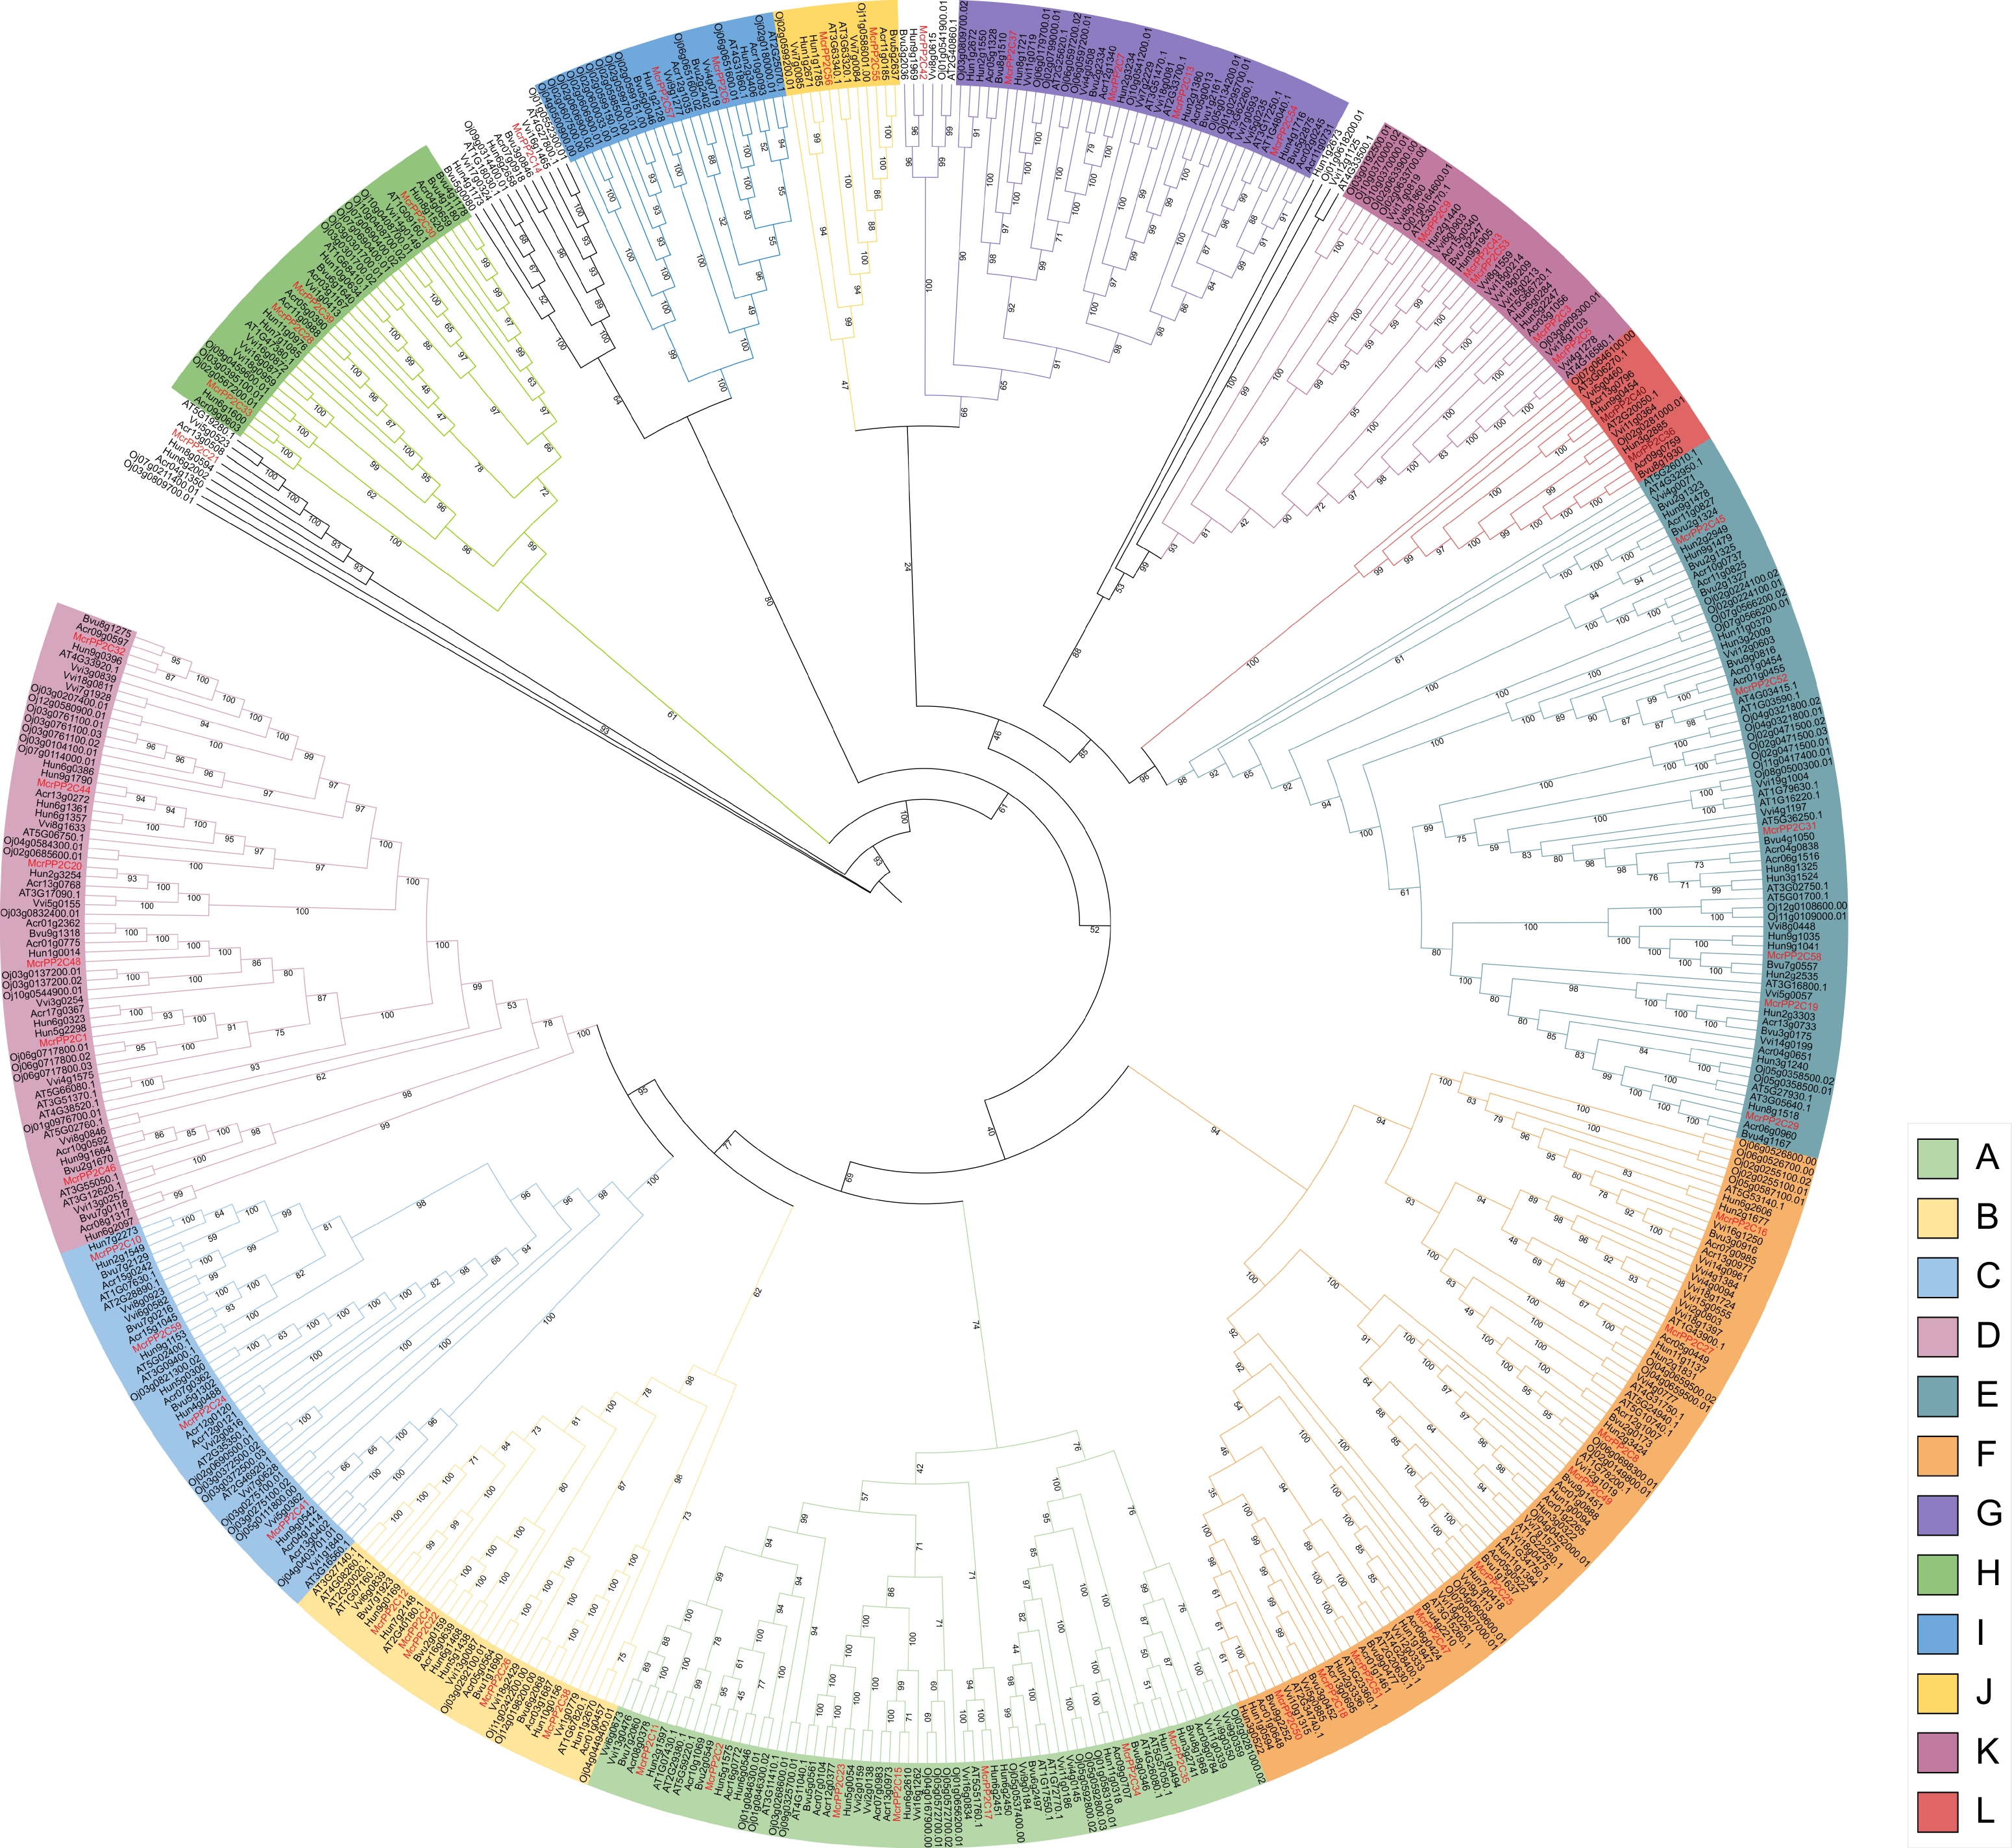
Figure 2.
Phylogenetic analysis of the PP2C gene family from M. crystallinum, H. undatus, A. caudatus, B. vulgaris, V. vinifera, A. thaliana, and O. sativa. Phylogenetic trees were constructed using the PP2C protein sequences and different colors indicate different clades. PP2C genes in M. crystallinum are marked in red.
-
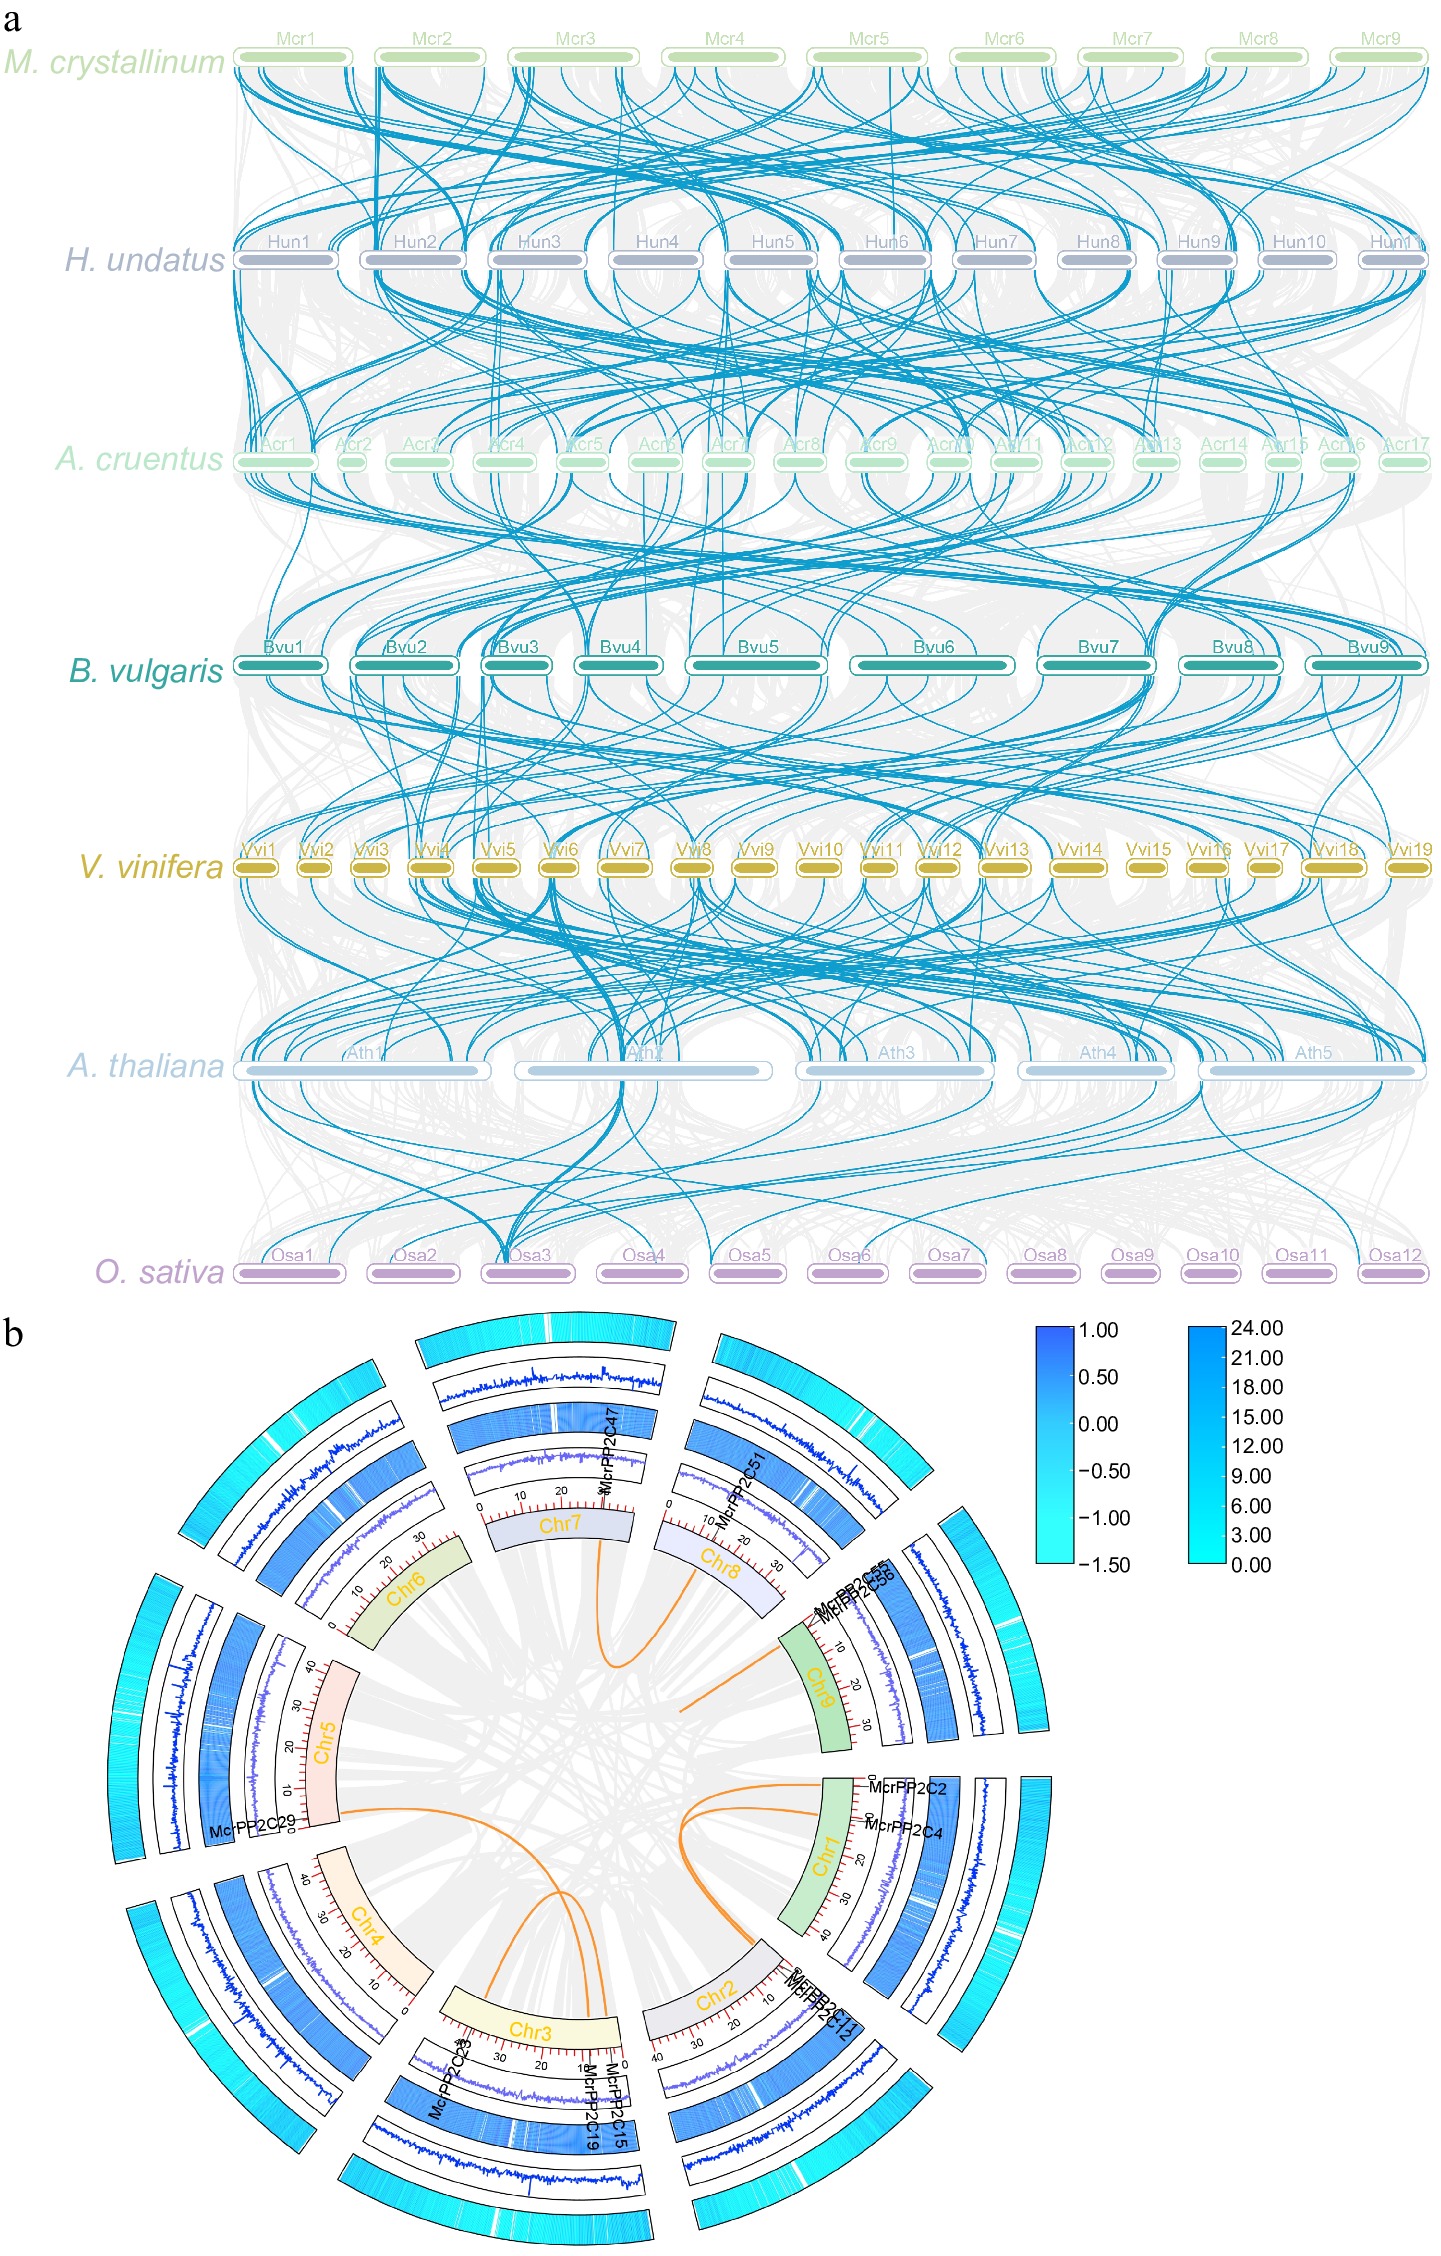
Figure 3.
Collinearity analysis of the PP2C gene family. (a) The collinear genes are shown by gray lines, while the syntenic PP2C homologous gene pairs are highlighted by blue lines. The species from top to bottom are M. crystallinum, H. undatus, A. caudatus, B. vulgaris, V. vinifera, A. thaliana, and O. sativa. (b) Collinearity analysis of McrPP2Cs. The gray lines represent all collinear genes in the ice plant, and orange lines represent the McrPP2C collinearity genes.
-
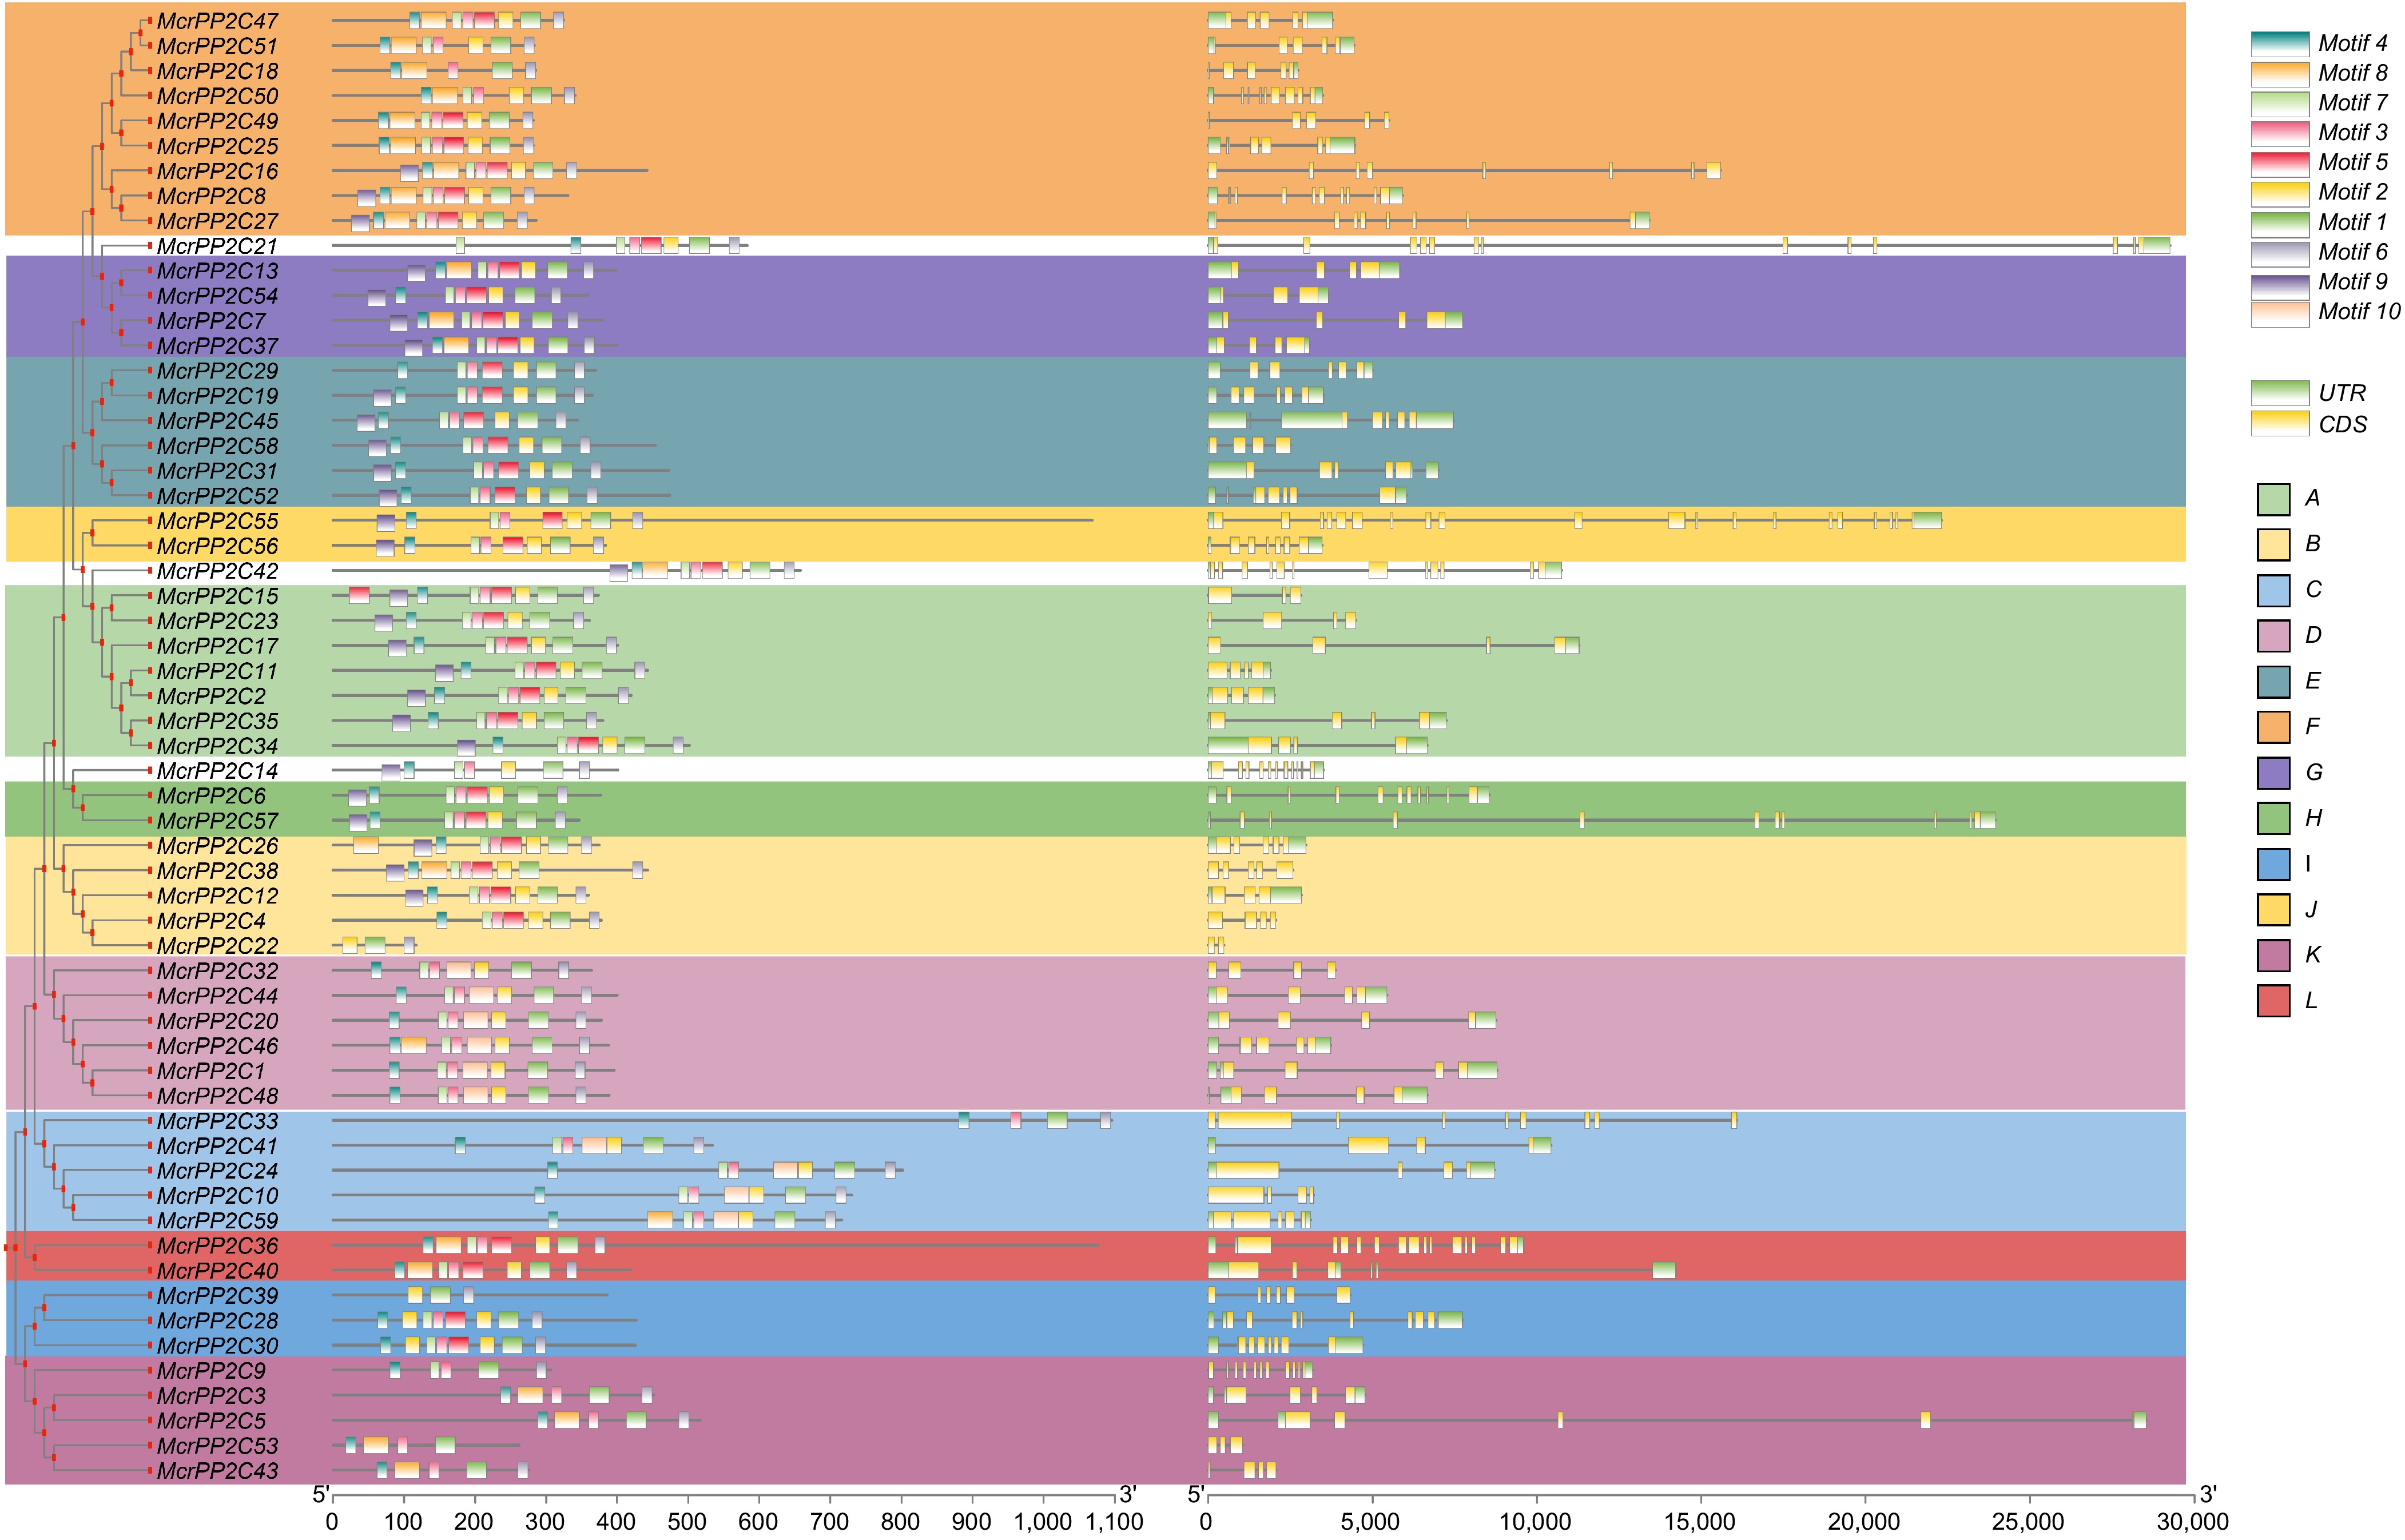
Figure 4.
The motif and exon-intron structure analyses of the PP2C gene family in M. crystallinum.
-
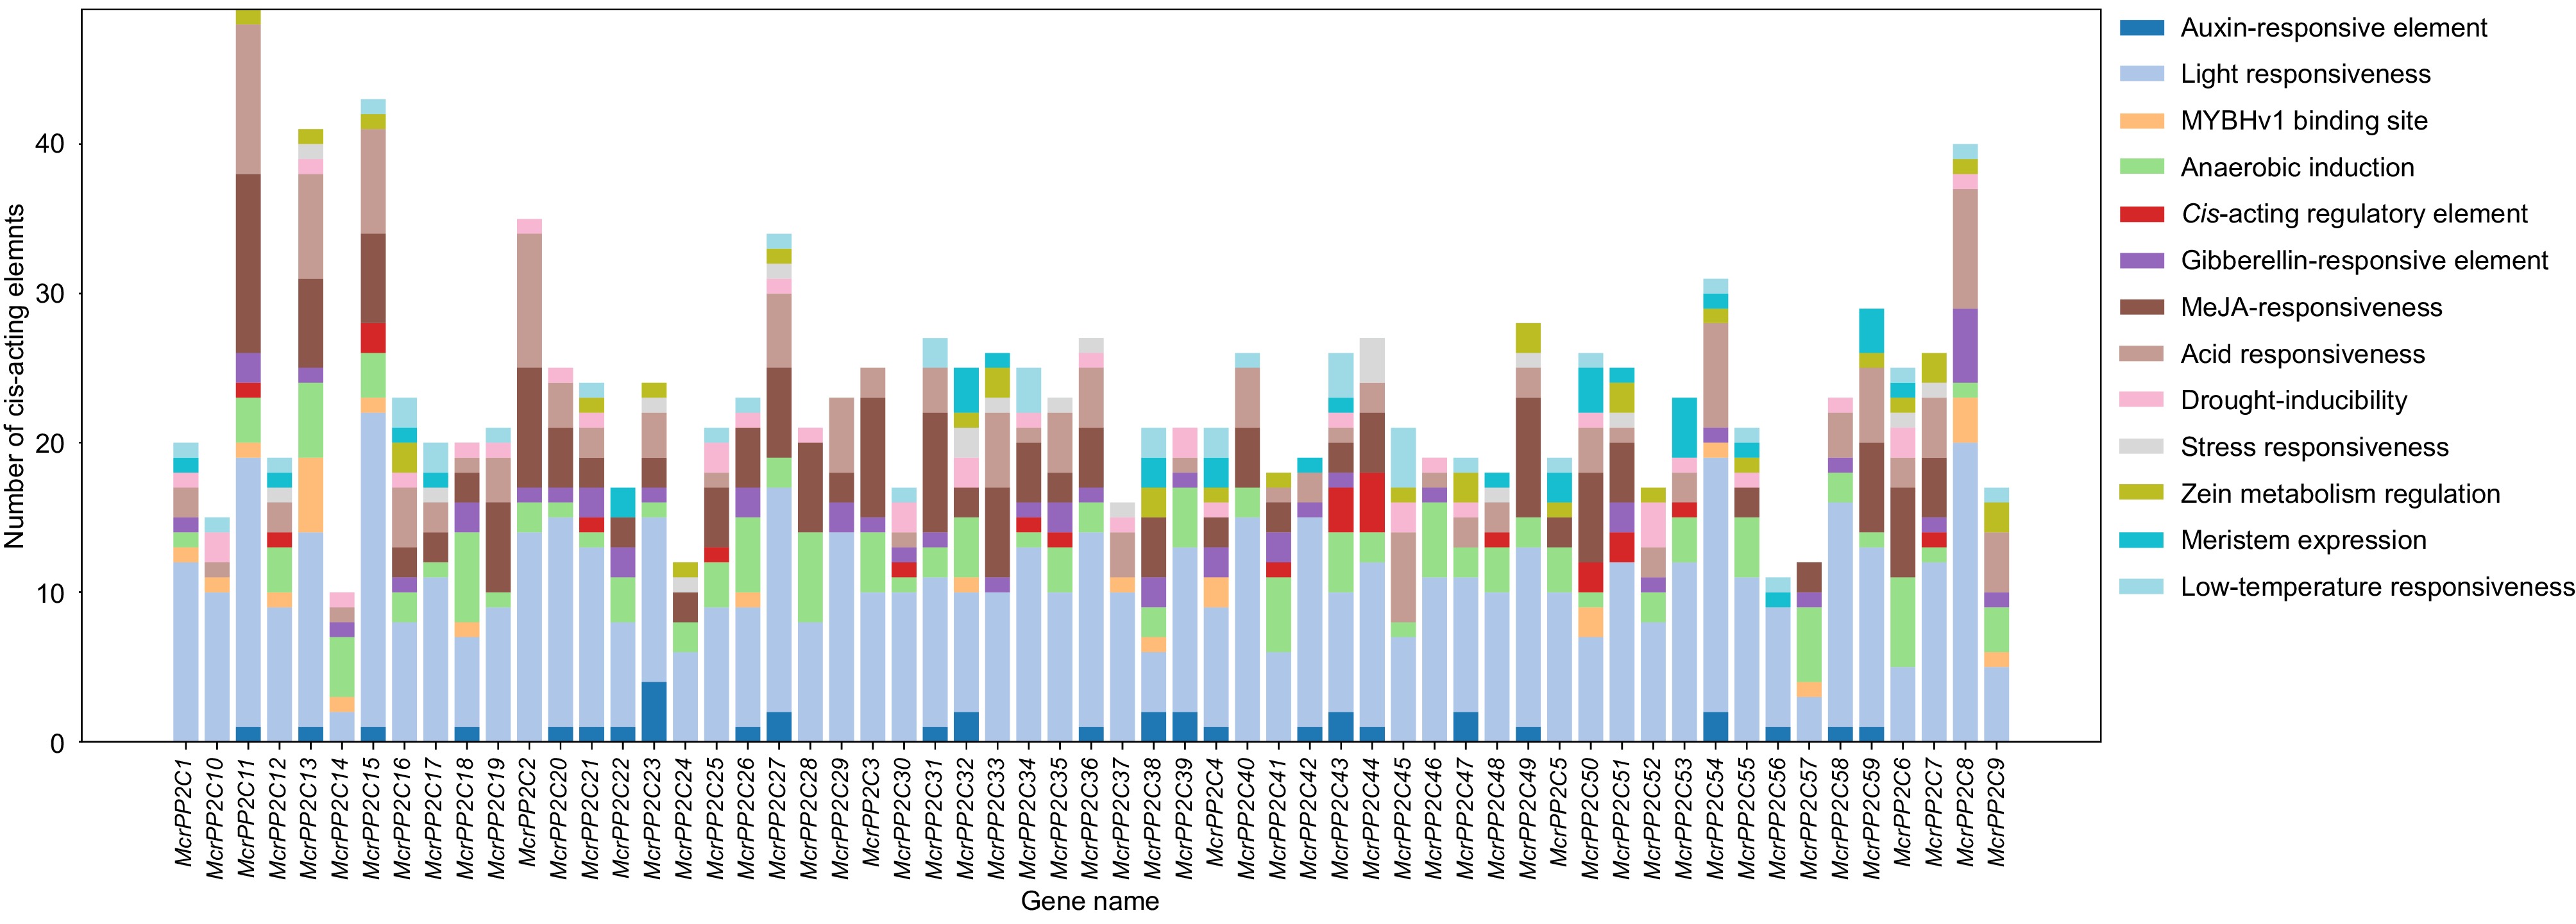
Figure 5.
Cis-elements analysis of PP2C genes in M. crystallinum. Different colors indicate different components. The vertical bar indicate the number of elements.
-
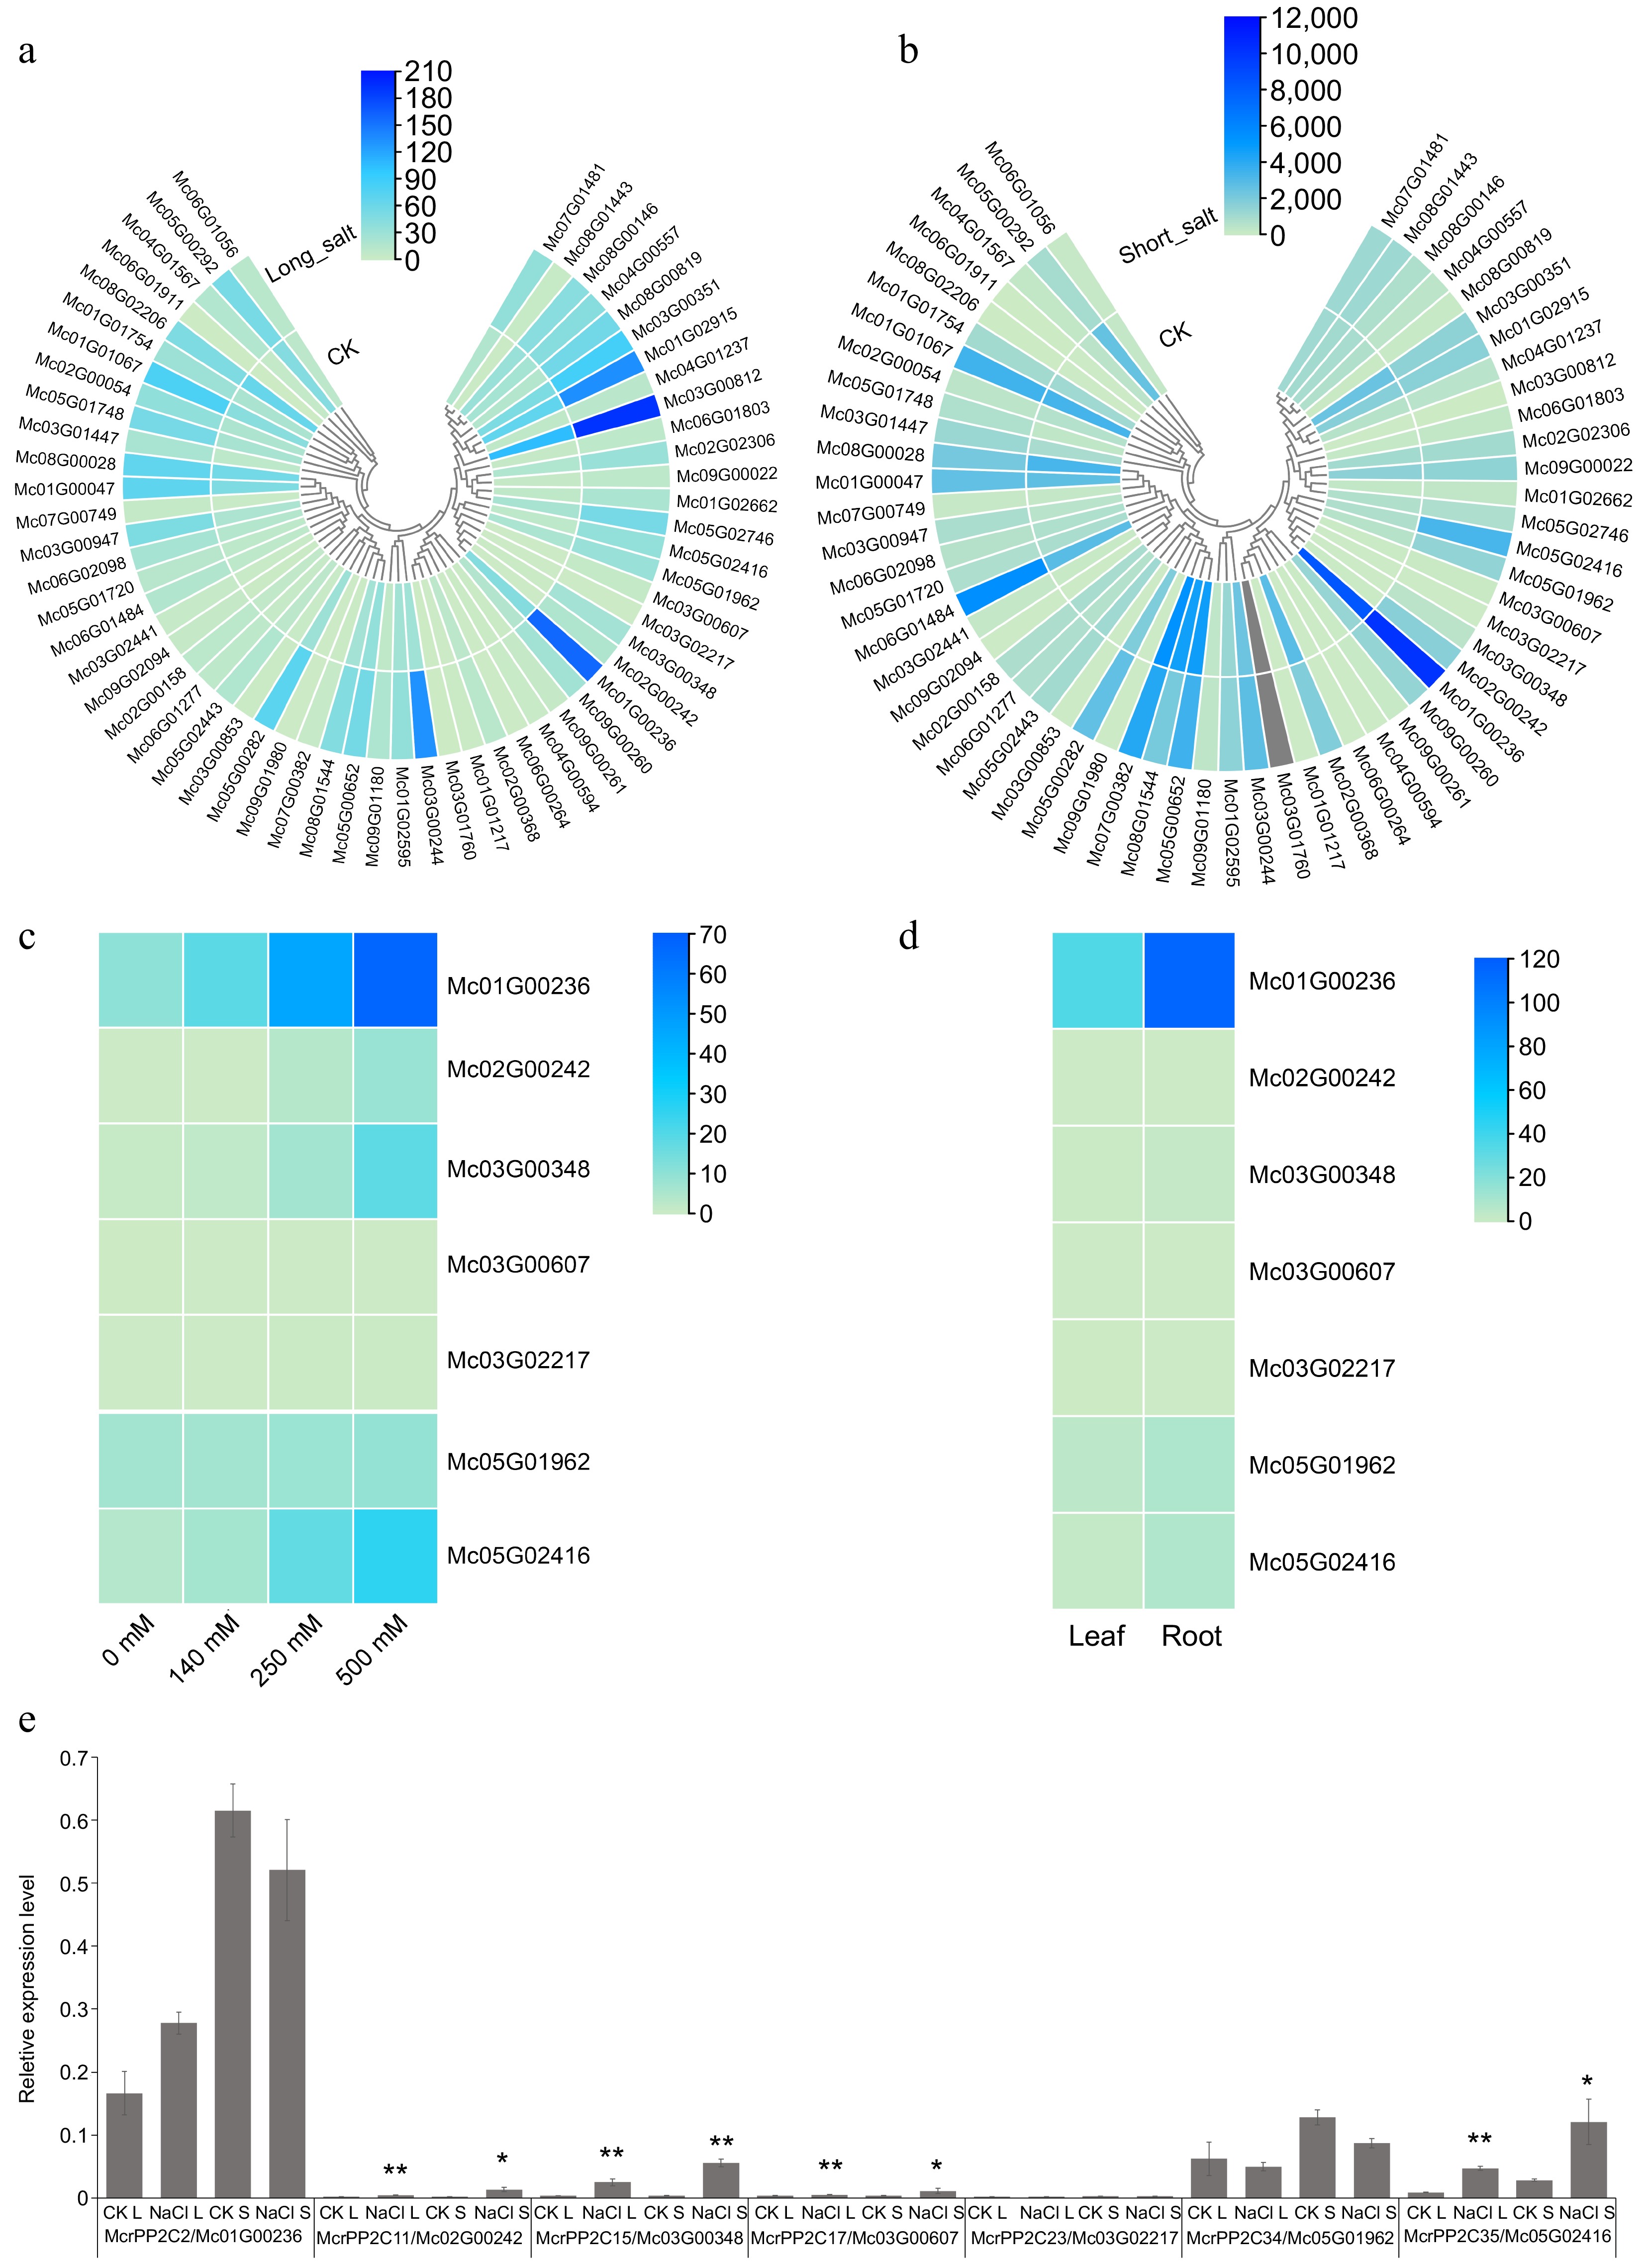
Figure 6.
Expression pattern analysis of PP2C genes in M. crystallinum. Expression pattern analysis of McrPP2Cs in leaf under (a) 14 d and (b) 36 h salt stress. CK indicates the corresponding control group. Grey bars mean the gene was not detected. (c) Expression pattern analysis of clade A McrPP2Cs in root under different NaCl treatments. (d) Expression pattern analysis of clade A McrPP2Cs in leaf and root under unstressed condition. (e) qRT-PCR analysis of clade A McrPP2Cs in leaf under long and short salt stress. CK L: 14 d salt stress control; NaCl L: 14 d salt stress; CK S: 36 h salt stress control; NaCl S: 36 h salt stress. Compared with corresponding control, a p-value < 0.05 and absolute fold change ≥ 2.0 signified differential expression (* p < 0.05, ** p < 0.01).
-
Clade O. sativa V. vinifera H. undatus B. vulgaris A. cruentus A. thaliana M. crystallinum A 13 12 10 6 9 9 7 B 4 4 6 4 4 6 5 C 8 6 6 3 7 7 5 D 17 9 11 4 8 9 6 E 15 7 13 9 10 12 6 F 12 17 13 8 11 12 9 G 8 6 6 4 5 6 4 H 9 5 5 3 5 3 2 I 12 2 2 2 2 2 3 J 2 2 2 1 1 2 2 K 7 9 4 1 2 3 5 L 2 2 2 1 2 2 2 Single Branch 6 4 6 3 3 7 3 Table 1.
The number of PP2Cs in each clade.
-
Species Singleton Dispersed Proximal Tandem WGD or segmental Total PP2Cs M. crystallinum 0 0 11 18.6% 1 1.7% 2 3.4% 45 76.3% 59 H. undatus 0 0 38 44.2% 7 8.1% 3 3.5% 38 44.2% 86 A. cruentus 0 0 36 52.2% 4 5.8% 3 4.3% 26 37.7% 69 B. vulgaris 0 0 34 69.4% 4 8.2% 6 12.2% 5 10.2% 49 V. vinifera 0 0 15 17.4% 1 1.2% 5 5.8% 65 75.6% 86 A. thaliana 0 0 41 51.3% 0 0.0% 3 3.8% 36 45.0% 80 O. sativa 0 0 34 40.0% 6 7.1% 4 4.7% 41 48.2% 85 Whole genome M. crystallinum 4,008 17.3% 6,915 29.8% 979 4.2% 2,527 10.9% 8,754 37.8% 23,183 H. undatus 4,798 17.5% 9,867 35.9% 1,638 6.0% 2,836 10.3% 8,351 30.4% 27,490 A. cruentus 5,963 23.9% 10,958 43.9% 845 3.4% 2,010 8.0% 5,210 20.9% 24,986 B. vulgaris 7,247 32.4% 10,780 48.1% 1,308 5.8% 2,148 9.6% 908 4.1% 22,391 V. vinifera 4,906 14.4% 10,025 29.4% 2,359 6.9% 4,628 13.6% 12,152 35.7% 34,070 A. thaliana 5,590 20.4% 9,861 35.9% 1,061 3.9% 3,126 11.4% 7,807 28.4% 27,445 O. sativa 12,761 33.9% 13,402 35.6% 2,627 7.0% 2,982 7.9% 5,858 15.6% 37,630 Table 2.
The identification of duplicated types for PP2C genes and all genes in ice plant.
Figures
(6)
Tables
(2)