-
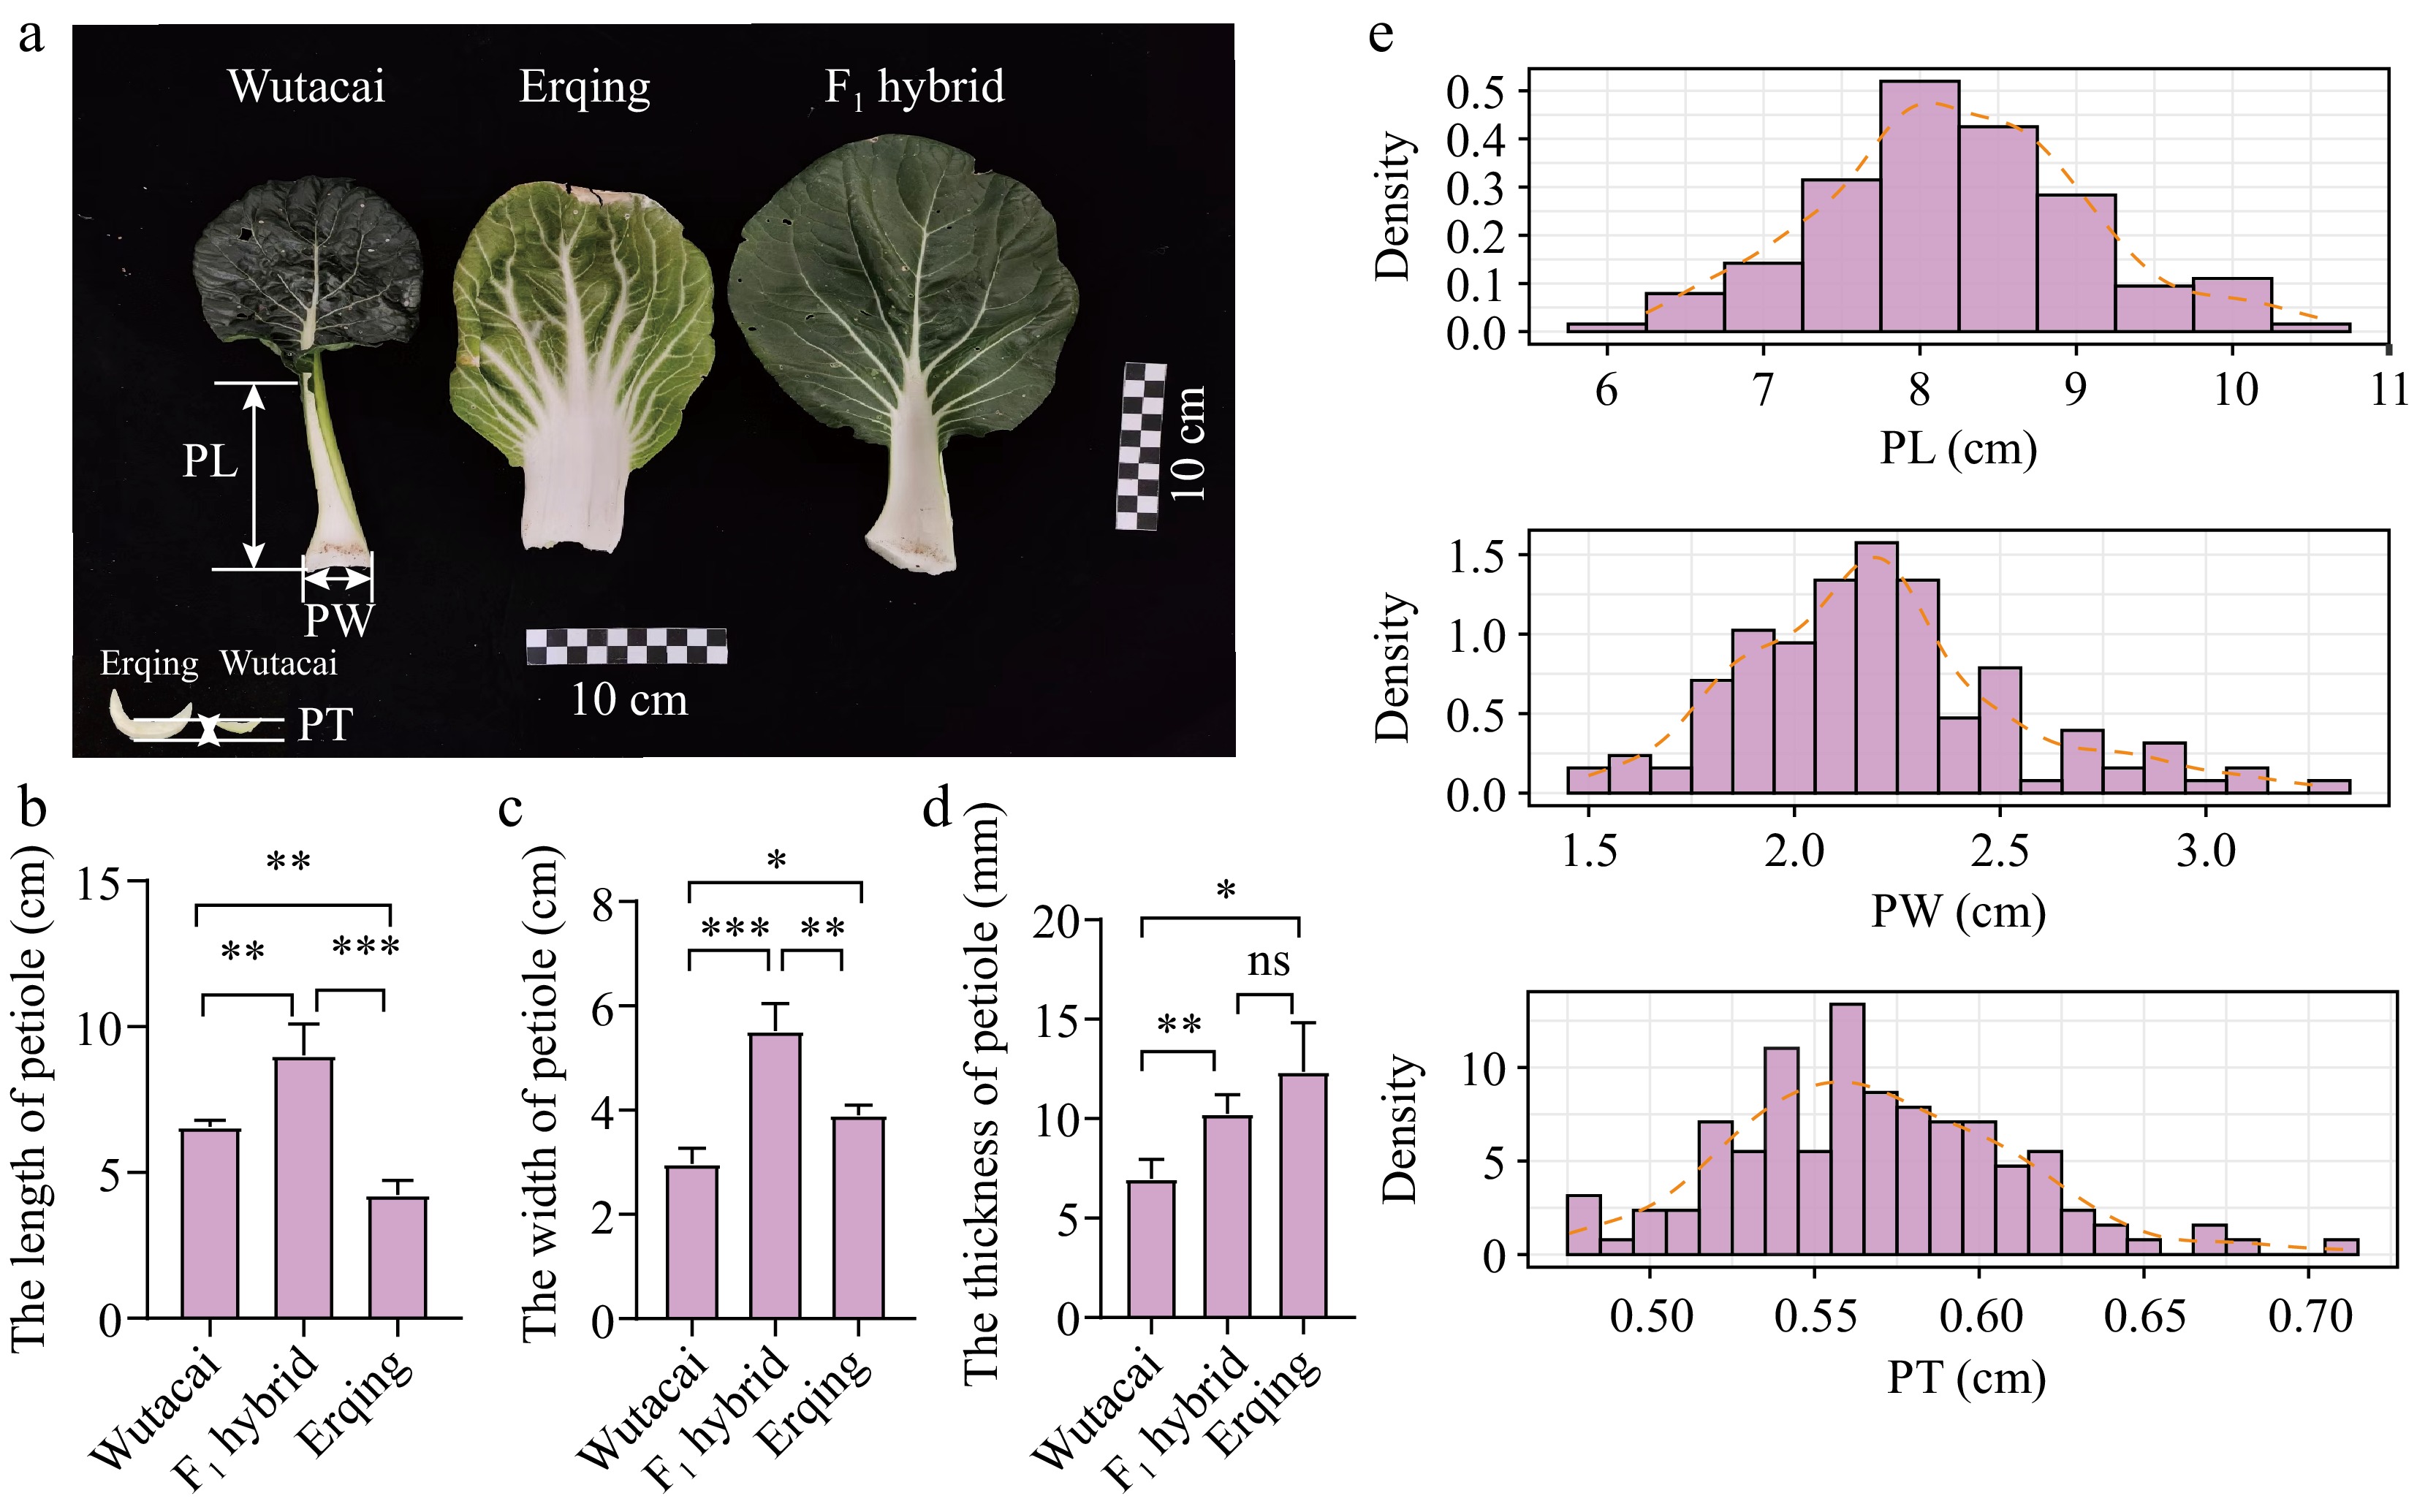
Figure 1.
The performances of Wutacai, Erqing, F1 hybrid, and RIL population. (a) The appearance of Wutacai, Erqing, and F1 hybrid. (b) Comparison of PL from Wutacai, Erqing, and F1 hybrid. (c) Comparison of PW from Wutacai, Erqing, and F1 hybrid. (d) Comparison of PT from Wutacai, Erqing, and F1 hybrid. ns indicates no significance. Asterisks(*, **, and ***) indicate p < 0.05, p < 0.01, and p < 0.001. (e) Distribution plots of BLUPs for PL, PW, and PT.
-
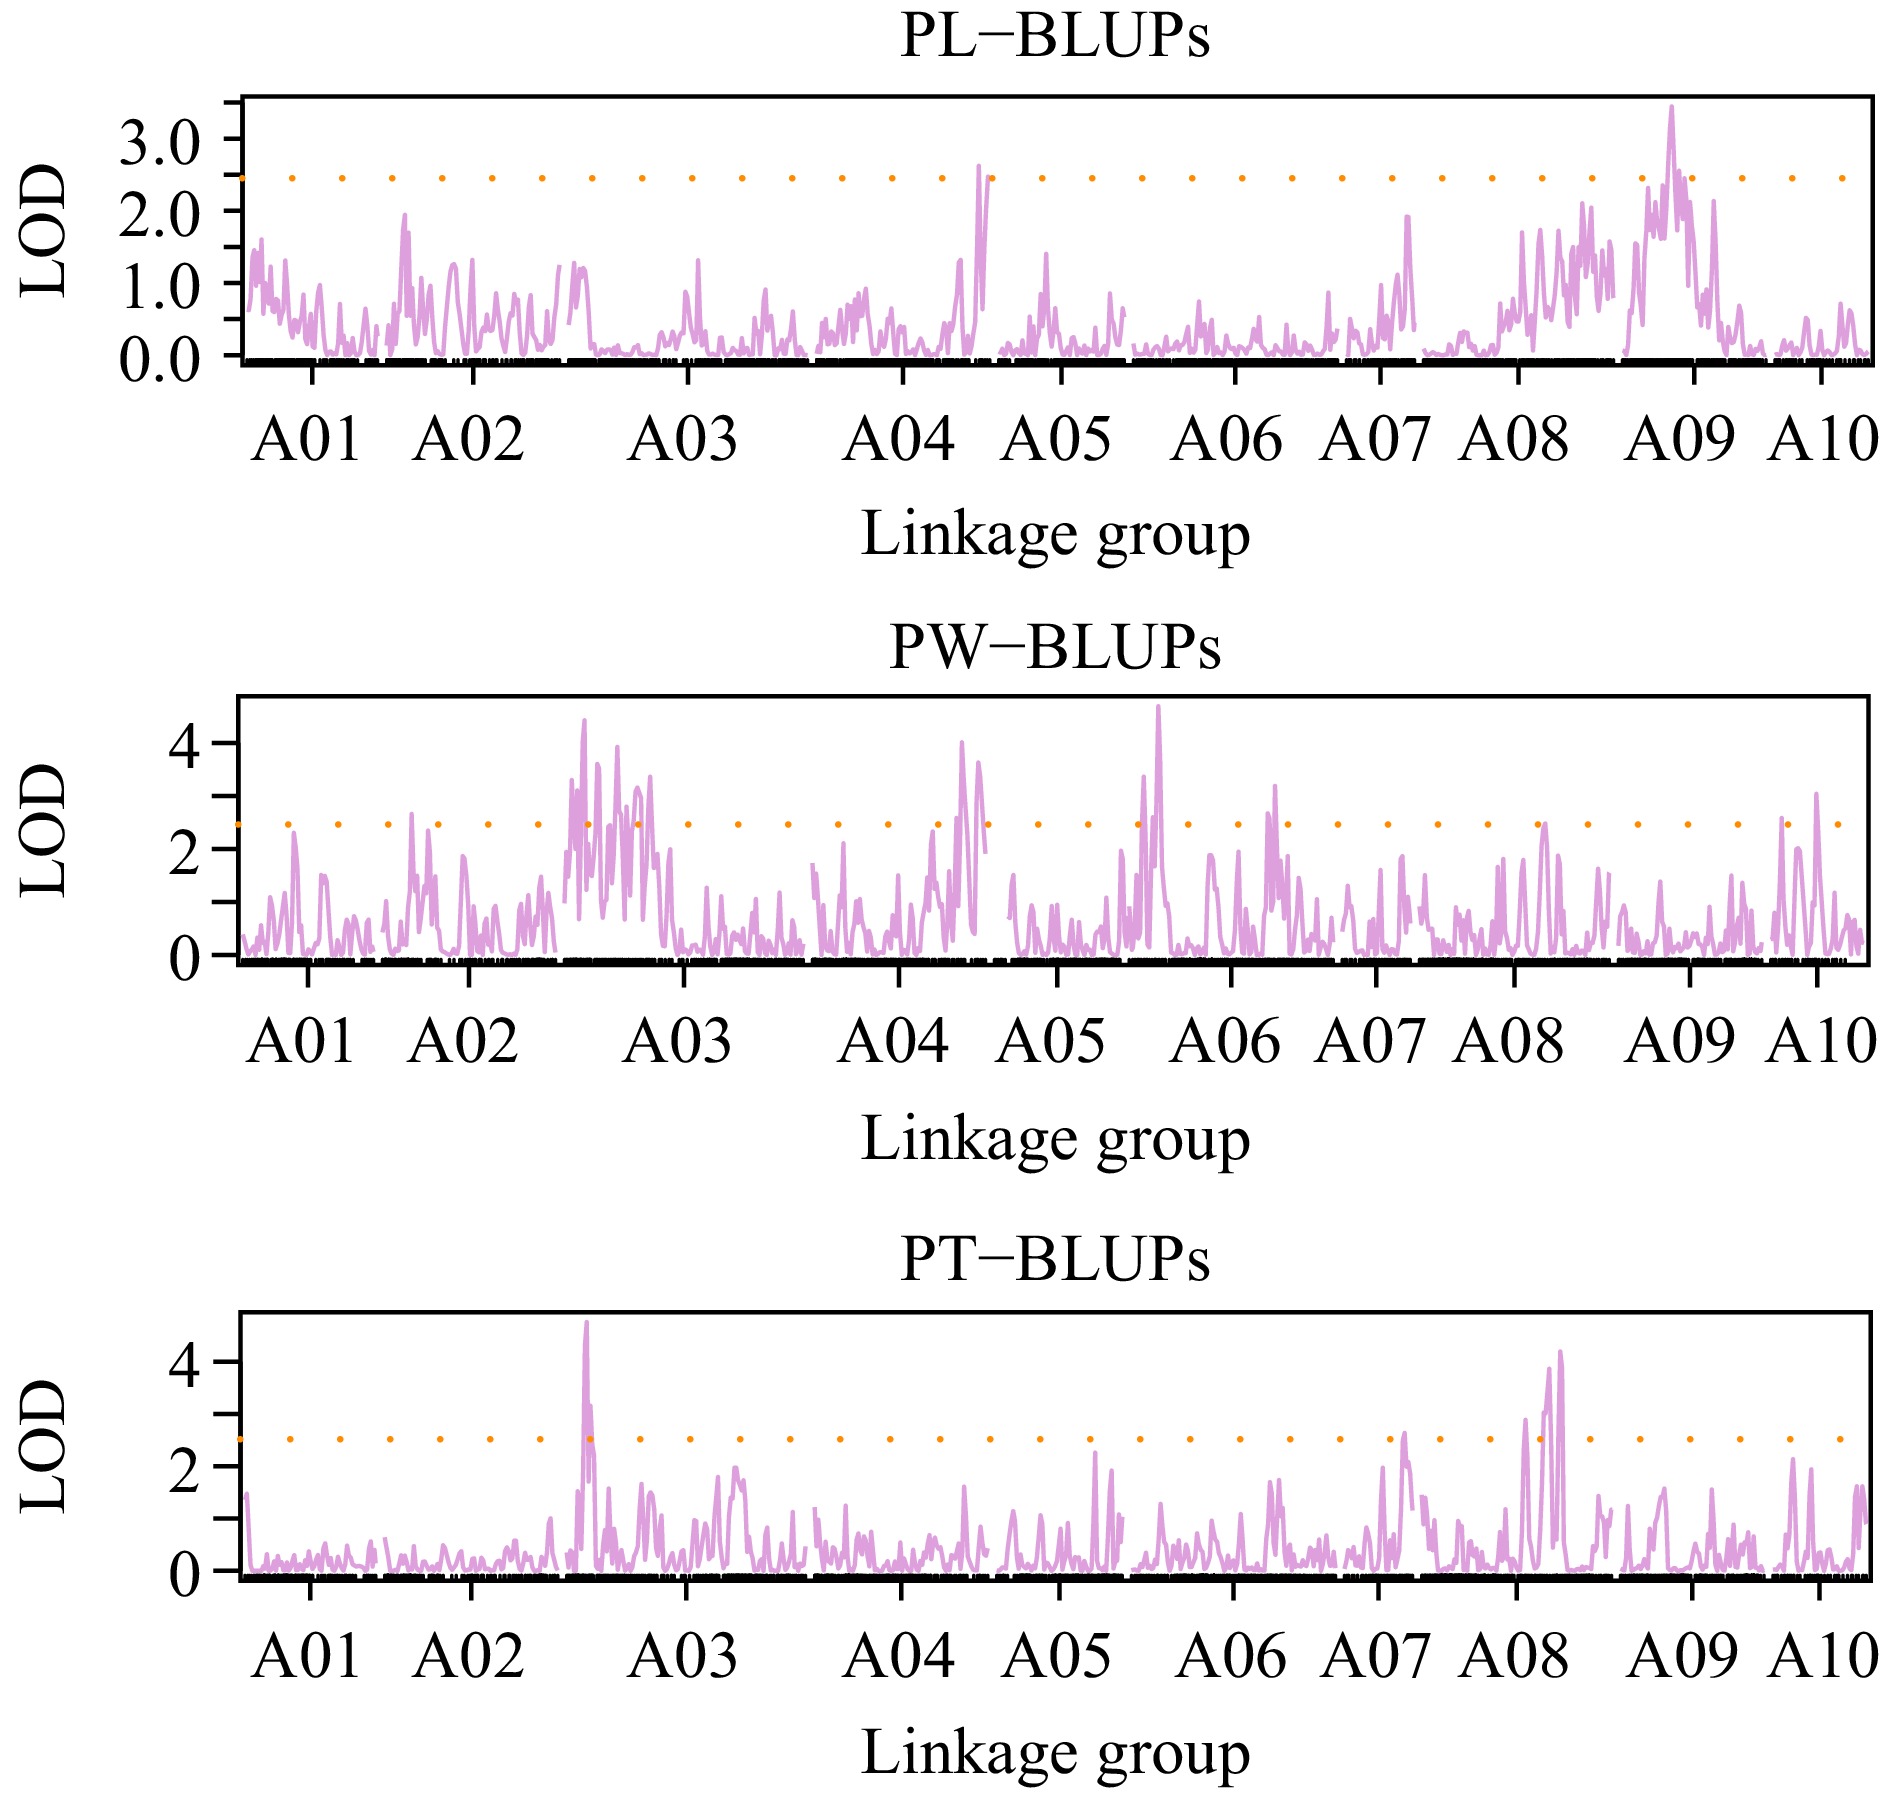
Figure 2.
QTL mapping for BLUP values in PL, PW, and PT.
-
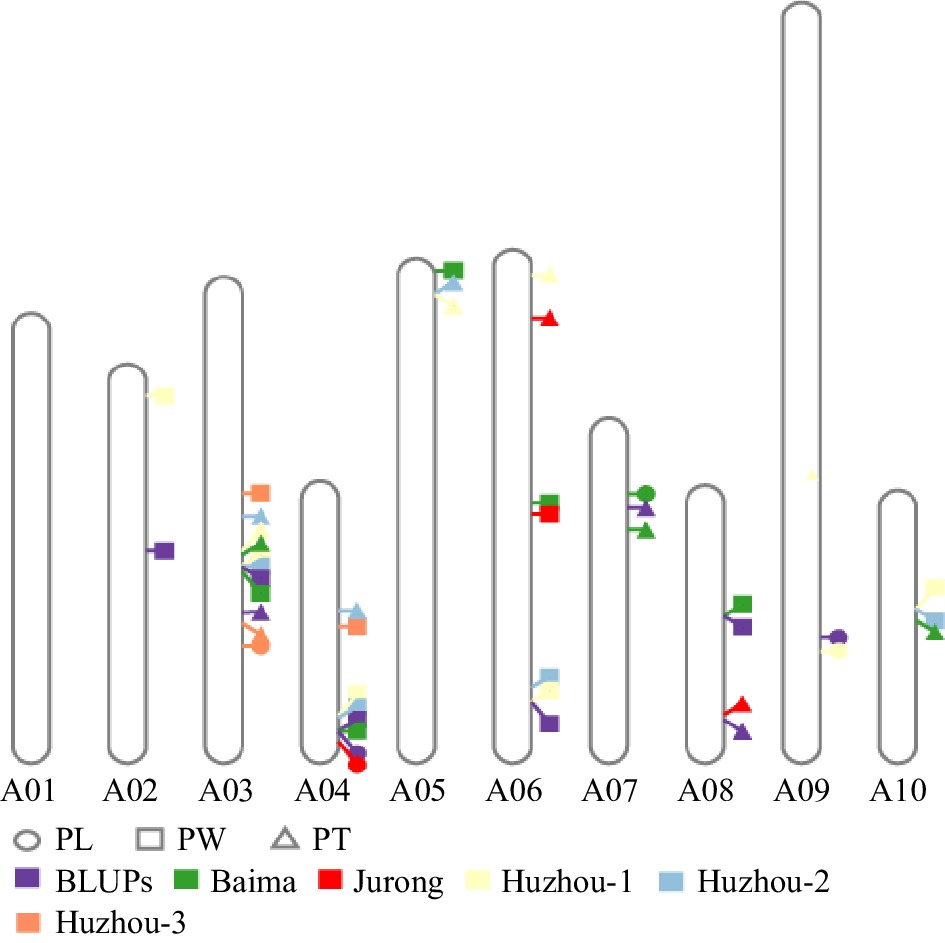
Figure 3.
Physical location of QTL for PL, PW, and PT.
-
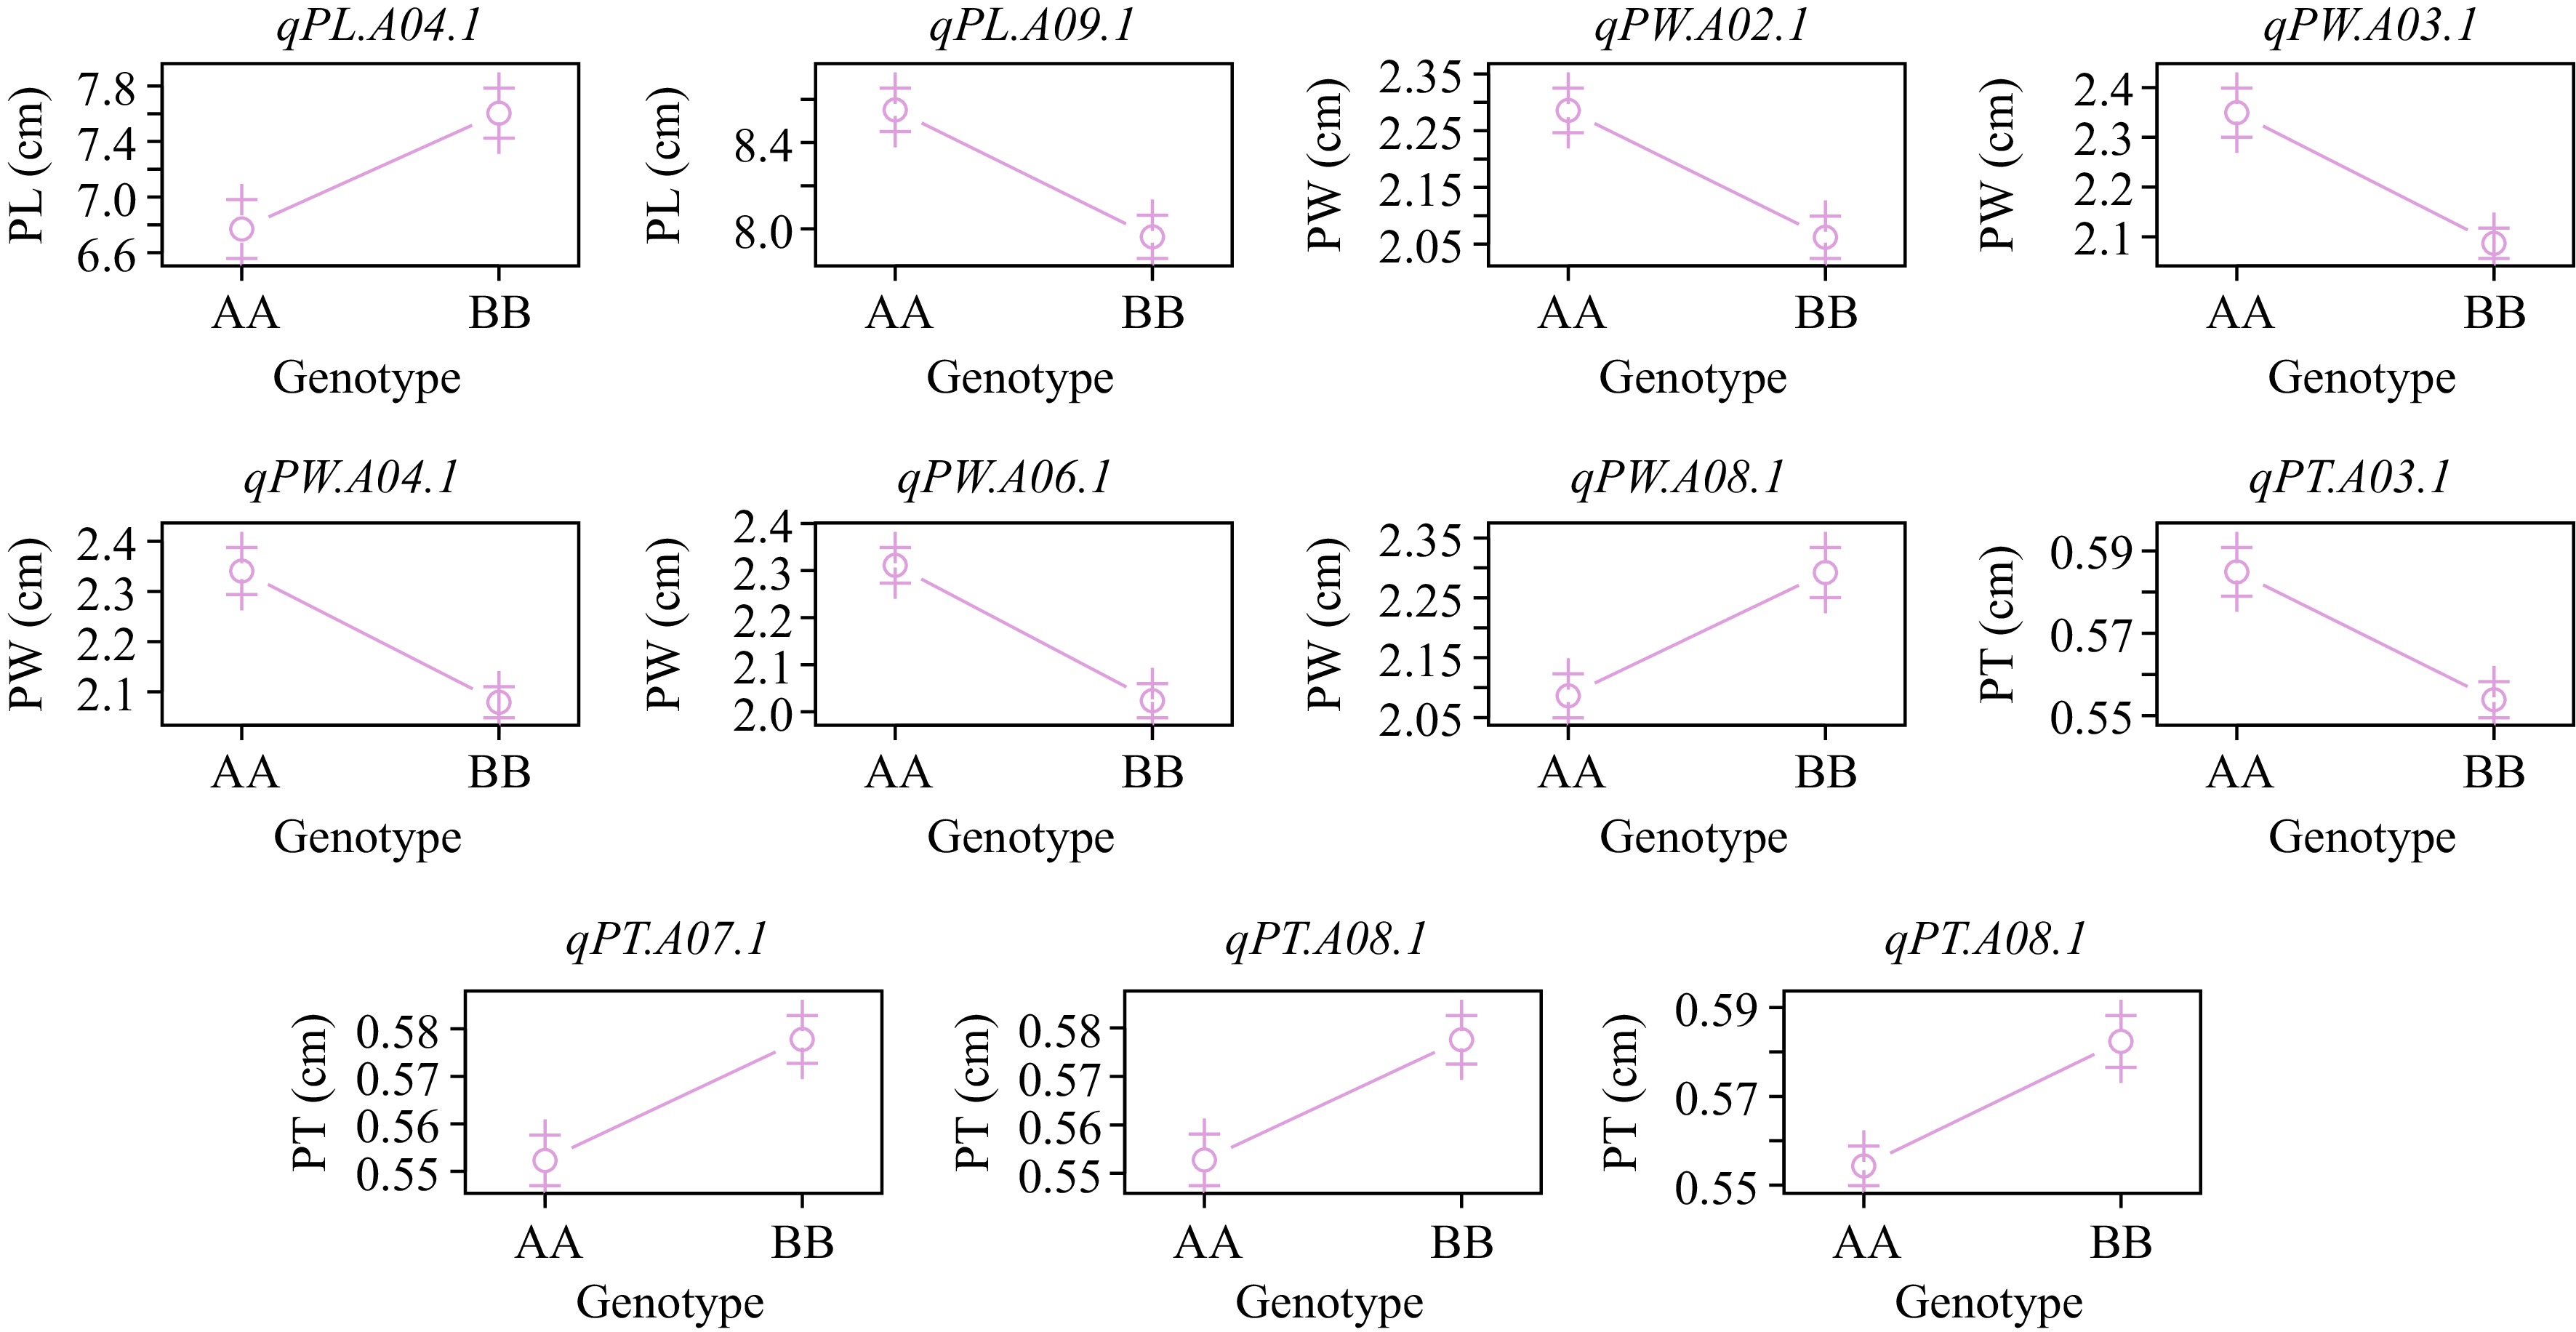
Figure 4.
The effect plot of QTL detected by BLUPs.
-
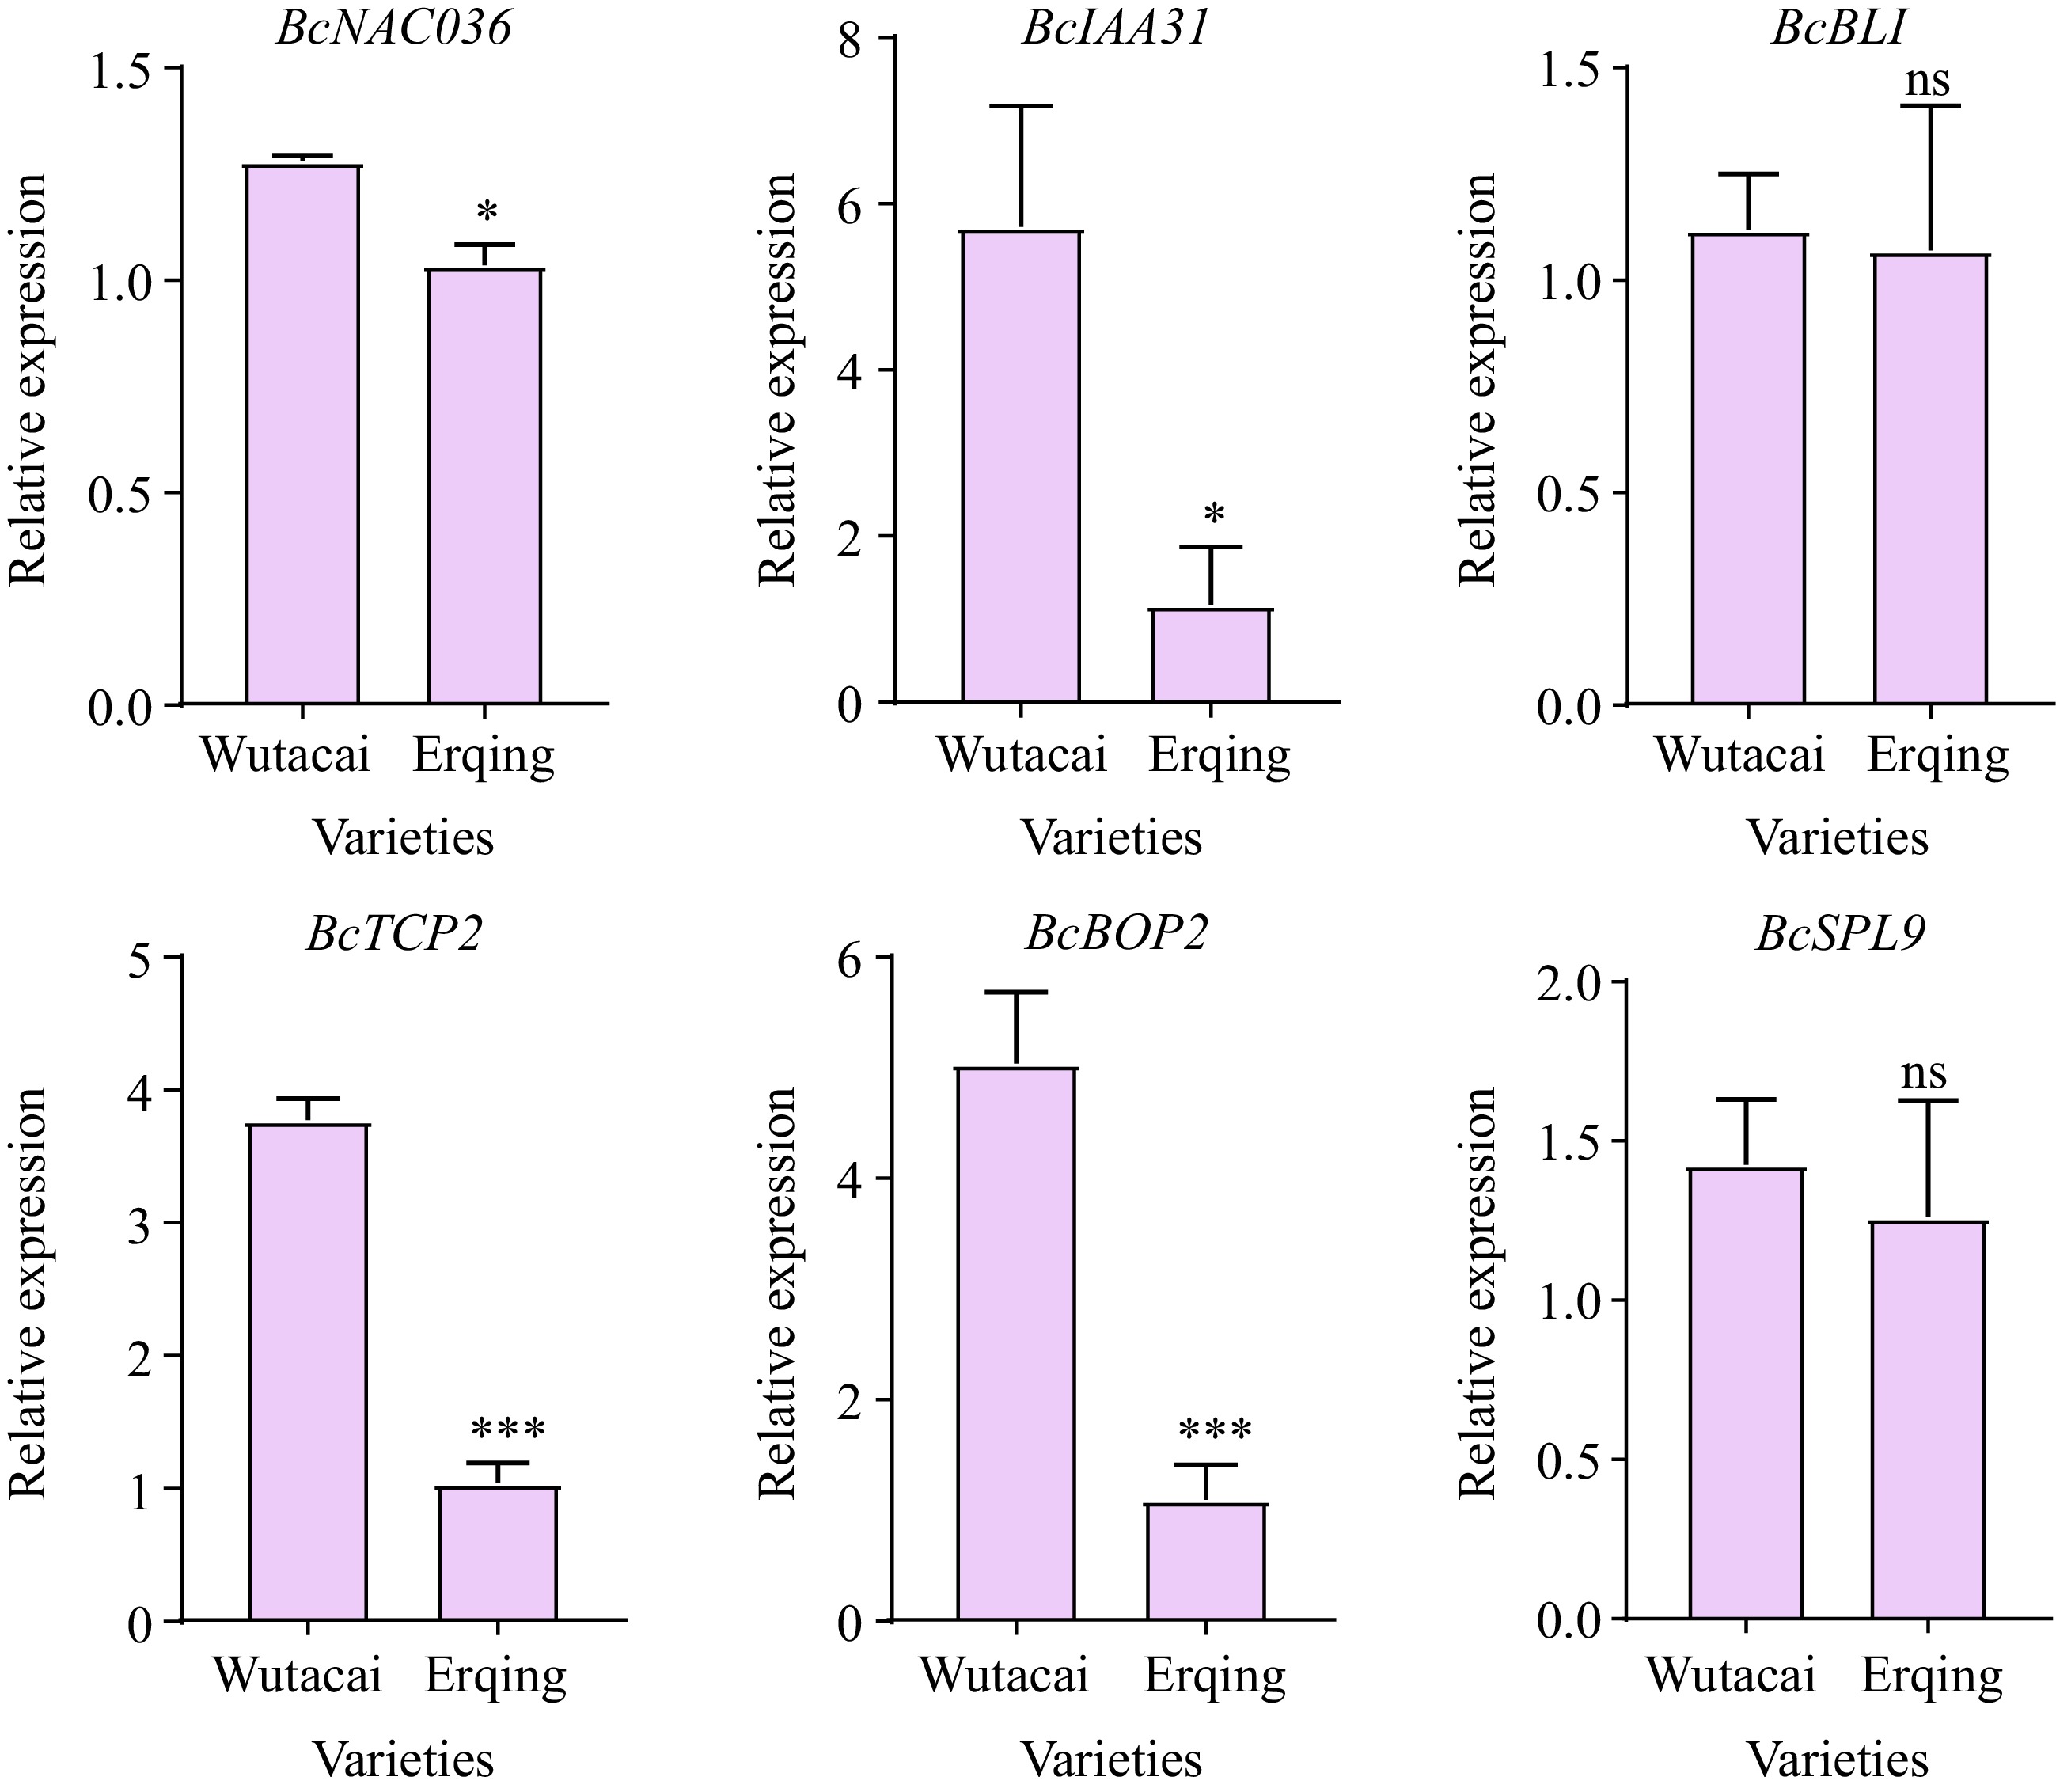
Figure 5.
qRT-PCR analysis of candidate genes in Wutacai and Erqing.
-
Components PL PW PT Genotype 1.17946 0.16256 0.00477 Environment 2.87536 0.48803 0.04405 Genotype:environment 0.99288 0.08294 0.01179 Blocks (rep in environment) 0.08763 0.04030 0.00078 Residual 1.37812 0.14696 0.01153 Heritability (H2) 0.66038 0.74026 0.43340 Table 1.
The variance of effect factor and heritability for PL, PW, and PT.
-
Traits Locations Linkage
groupLocus Peak LOD 1.5 LOD interval Additive effect Phenotypic variance explained (%) Marker right Marker left PL BLUPs A04 qPL.A04.1 2.62 A04_20389448 A04_22047361 0.23155 6.056 A09 qPL.A09.1 3.42 A09_58654691 A09_49099062 −0.26456 9.13 Baima A07 qPL.A07.1 2.81 A07_11058656 A07_1764887 0.1465 10.31459 Jurong A04 qPL.A04.1 2.77 A04_22095429 A04_22047361 1.0422 14.812217 Huzhou-1 A09 qPL.A09.1 2.73 A09_59798610 A09_50254249 −0.548 11.37389 Huzhou-3 A03 qPL.A03.1 3.15 A03_32044940 A03_30518078 −0.5585 10.97715 PW BLUPs A02 qPW.A02.1 2.66 A02_733009 A02_30883969 −0.06004 2.477 A03 qPW.A03.1 4.43 A03_31182238 A03_18015813 −0.07582 3.997 A04 qPW.A04.1 4.01 A04_20233219 A04_22047361 −0.0734 3.967 A06 qPW.A06.1 4.69 A06_40690069 A06_35966291 −0.09773 6.639 A08 qPW.A08.1 2.48 A08_517021 A08_21634479 0.05469 2.065 Baima A03 qPW.A03.1 4.11 A03_31182335 A03_18724031 −0.09117 5.642 A04 qPW.A04.1 4.20 A04_19732246 A04_22656727 −0.06587 3.099 A05 qPW.A05.1 3.76 A05_1222122 A05_815039 0.07976 4.678 A06 qPW.A06.1 4.55 A06_38372945 A06_4564281 −0.07796 4.141 A08 qPW.A08.1 2.90 A08_145893 A08_21920792 0.0713 3.862 Jurong A06 qPW.A06.1 3.23 A06_41497657 A06_3383035 −0.32253 15.489 Huzhou-1 A02 qPW.A02.1 2.69 A02_130169 A02_5193431 −0.1424 4.59 A03 qPW.A03.1 3.52 A03_30864524 A03_18015813 −0.10545 2.39 A04 qPW.A04.1 3.22 A04_17762563 A04_22047361 −0.12212 3.436 A06 qPW.A06.1 3.99 A06_40690069 A06_35966291 −0.1821 7.46 A10 qPW.A10.1 2.74 A10_1410956 A10_18769214 −0.1114 2.585 Huzhou-2 A03 qPW.A03.1 4.28 A03_24356778 A03_24682730 −0.14407 4.007 A04 qPW.A04.1 3.47 A04_17762563 A04_22312000 −0.15091 4.341 A06 qPW.A06.1 3.16 A06_38372945 A06_35966291 −0.12281 2.769 A10 qPW.A10.1 3.15 A10_1410956 A10_18769214 −0.15227 4.242 Huzhou-3 A03 qPW.A03.1 4.11 A03_18727114 A03_17930086 −0.19753 6.626 A04 qPW.A04.1 2.67 A04_2530871 A04_22047361 0.19091 5.66 PT BLUPs A03 qPT.A03.1 4.76 A03_30621834 A03_26249977 −0.01541 11.31 A07 qPT.A07.1 2.64 A07_14415306 A07_775788 0.010057 4.7 A08 qPT.A08.1 4.2 A08_18588344 A08_21214068 0.014503 10.21 Baima A03 qPT.A03.1 3.33 A03_30478585 A03_16647267 −0.02032 5.888 A07 qPT.A07.1 4.14 A07_14441999 A07_4436414 0.021074 5.974 A10 qPT.A10.1 2.52 A10_1739370 A10_20349334 0.014812 2.633 Jurong A06 qPT.A06.1 2.87 A06_7730815 A06_3882585 −0.07958 7.368 A08 qPT.A08.1 2.88 A08_17707535 A08_21175529 0.07518 6.907 Huzhou-1 A03 qPT.A03.1 3.19 A03_30864524 A03_15713701 −0.03759 6.163 A05 qPT.A05.1 4.10 A05_4097617 A05_1951585 −0.04991 9.805 A06 qPT.A06.2 2.93 A06_2453061 A06_1858366 0.03243 4.529 Huzhou-2 A03 qPT.A03.1 4.52 A03_21844186 A03_18724031 −0.05279 11.217 A04 qPT.A04.1 2.47 A04_1147833 A04_20772670 0.03016 3.228 A05 qPT.A05.1 3.26 A05_4097617 A05_1749785 −0.03566 5.048 Huzhou-3 A03 qPT.A03.1 7.38 A03_31182238 A03_27499477 −0.07229 19.834 Table 2.
The QTL detected by BLUPs.
-
ID Chromosomes Candidate genes Homologue in Arabidopsis Gene name Ref. P1 A03 BraC03g067590 AT1G62340.1 ALE1 [22] P2 A03 BraC03g044910 AT2G17040.1 NAC036 [23] P3 A03 BraC03g036830 AT3G13960.1 GRF5 [31] P4 A03 BraC03g064340 AT4G37740.1 GRF2 [32] P5 A03 BraC03g037400 AT3G15030.3 TCP4 [26] P6 A03 BraC03g038570 AT3G17600.1 IAA31 [27] P7 A03 BraC03g039350 AT3G19160.1 IPT8 [28] P8 A03 BraC03g042250 AT3G23980.1 BLI [34] P9 A03 BraC03g049640 AT4G18390.2 TCP2 [24] P10 A03 BraC03g050770 AT4G20270.1 BAM3 [30] P11 A03 BraC03g063060 AT4G36380.1 ROT3 [29] P12 A03 BraC03g045390 AT5G60970.1 TCP5 [25] P13 A04 BraC04g031470 AT2G41370.1 BOP2 [33] P14 A04 BraC04g031910 AT2G42200.1 SPL9 [33] Table 3.
The reliable candidate genes annotated in QTL on chromosomes A03 and A04.
Figures
(5)
Tables
(3)