-
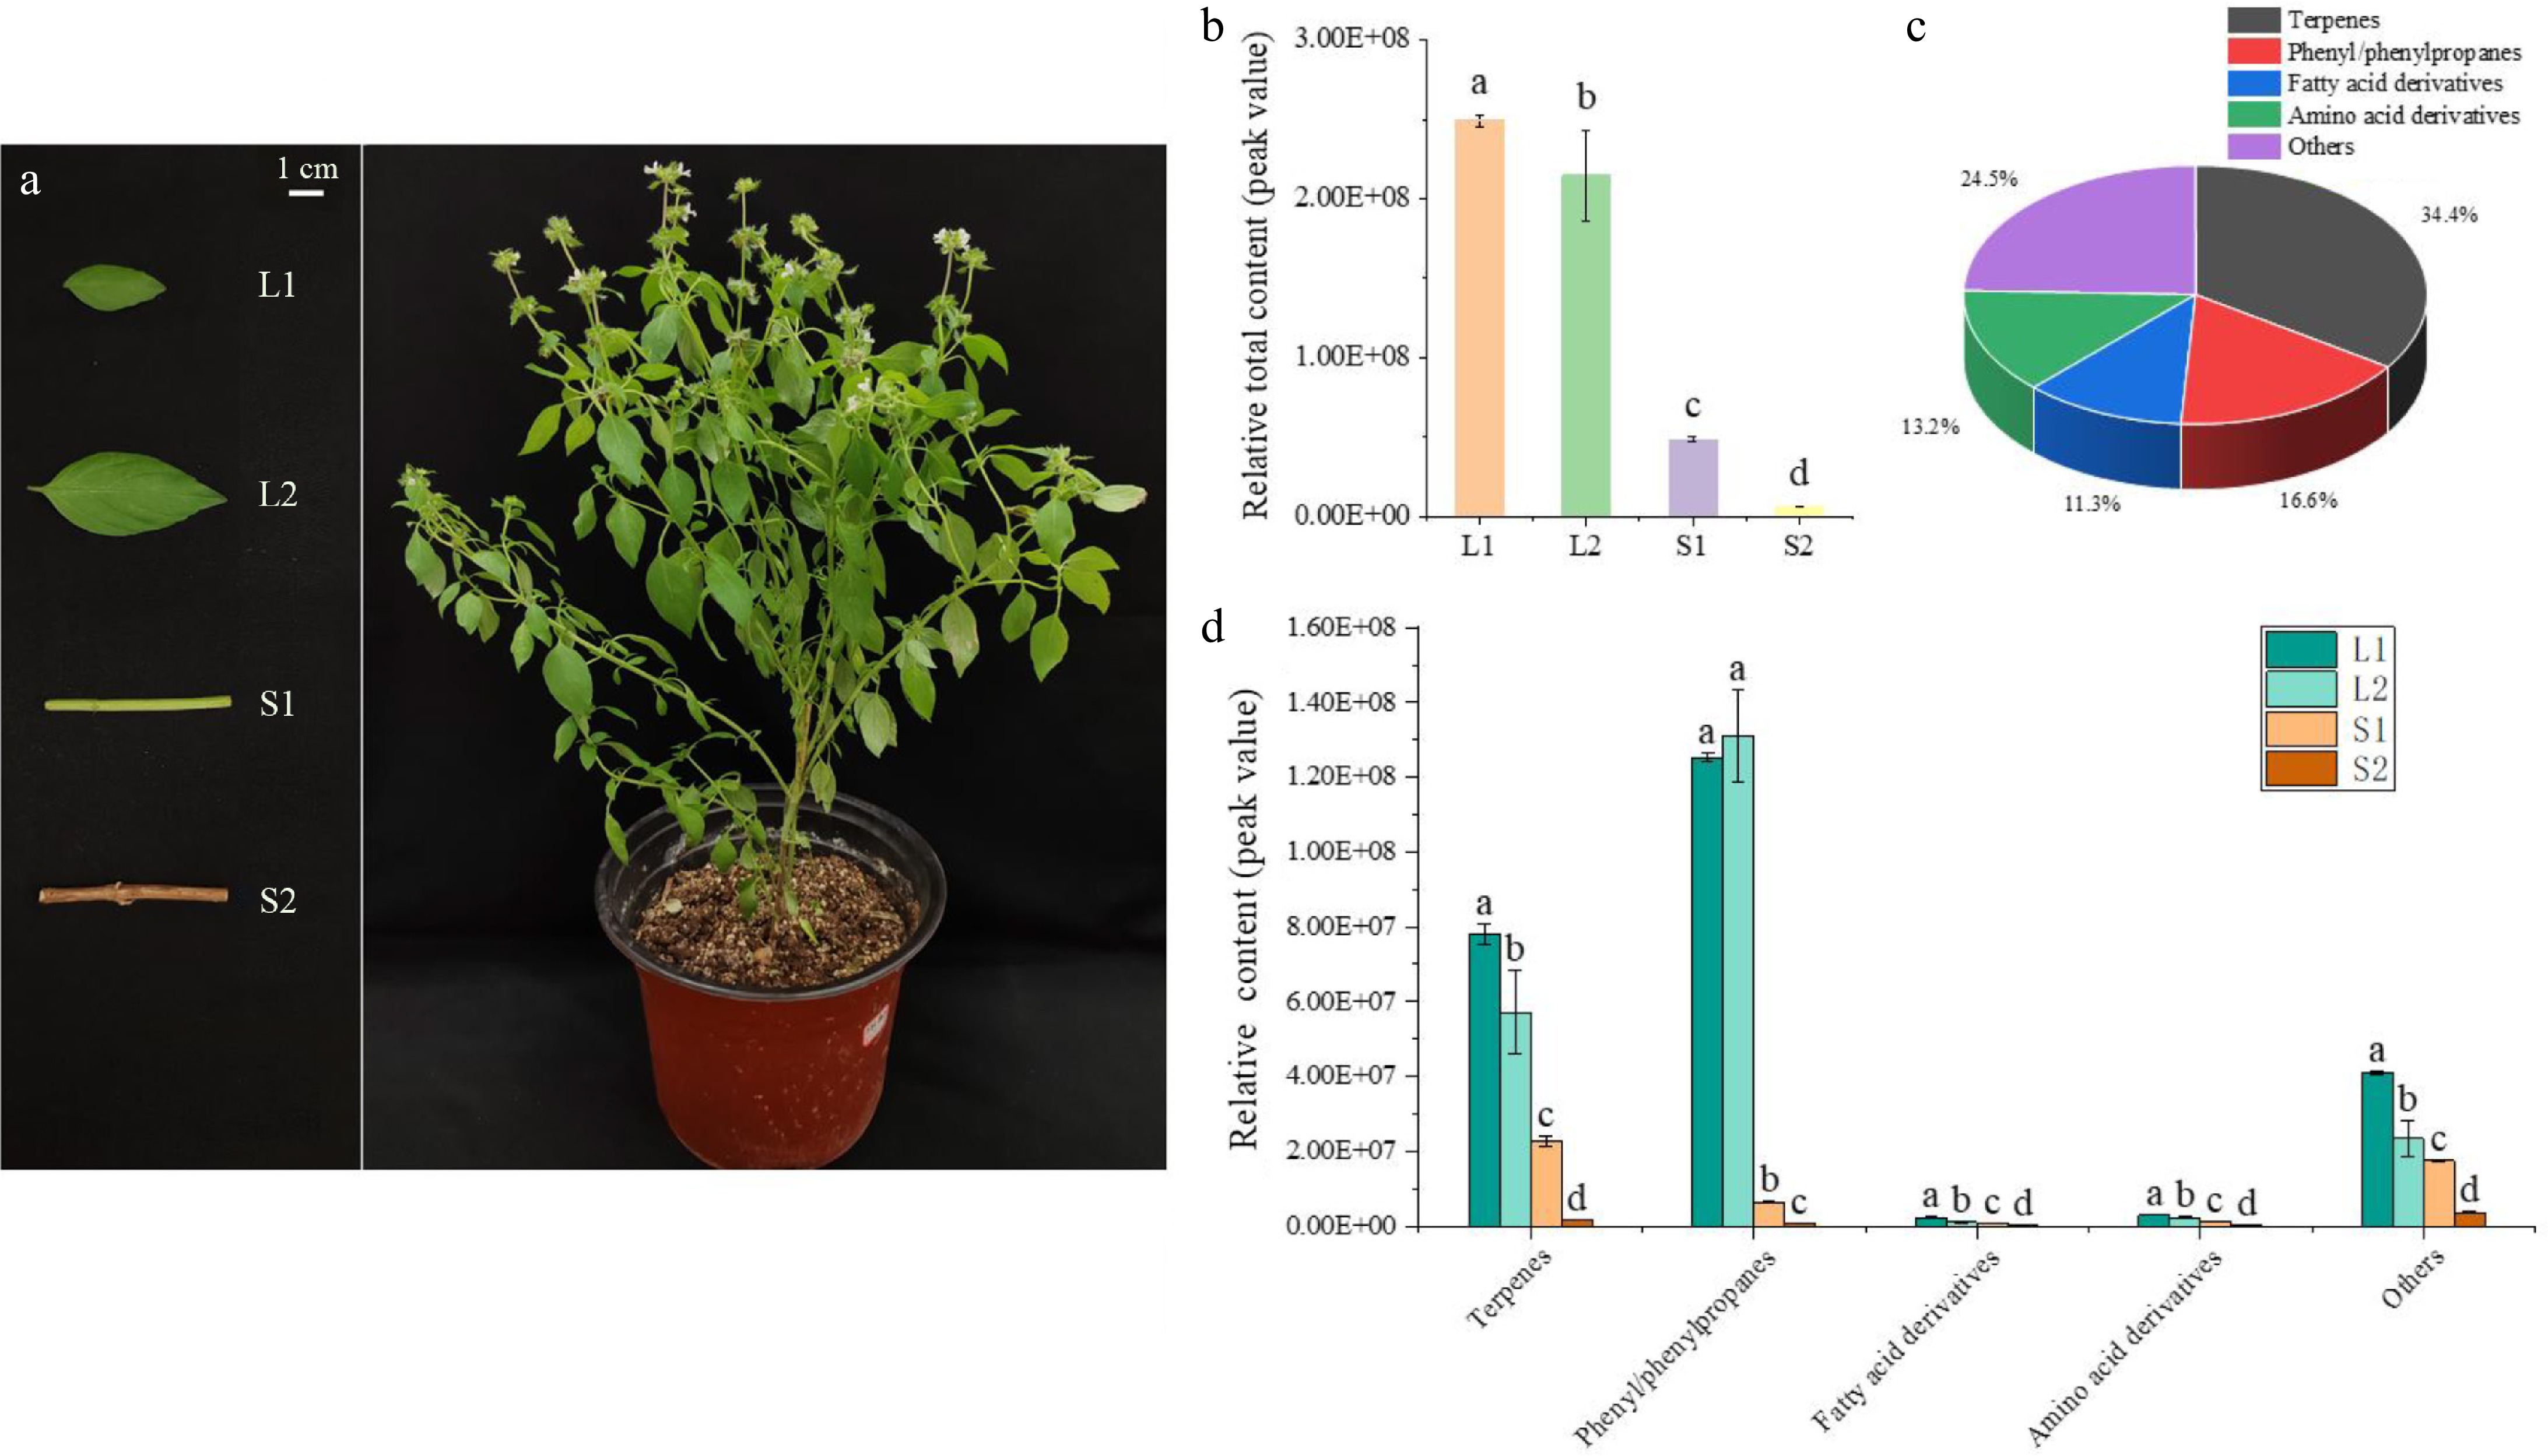
Figure 1.
Volatile compound analysis in developing basil leaves and stems. (a) Basil stems and leaves at various developmental stages selected for volatile compound analysis. (b) Relative content of volatile compounds in basil, comparing stems and leaves. (c) Classification and statistical analysis of volatile compounds. (d) Comparative content of compound groups, including terpenes, phenylpropanes, fatty acid derivatives, amino acid derivatives, and others in basil stems and leaves. Different lowercase letters indicate significant differences, while the same letters indicate no significant differences (p < 0.05). One-way analysis of variance and q-test were used for data analysis.
-
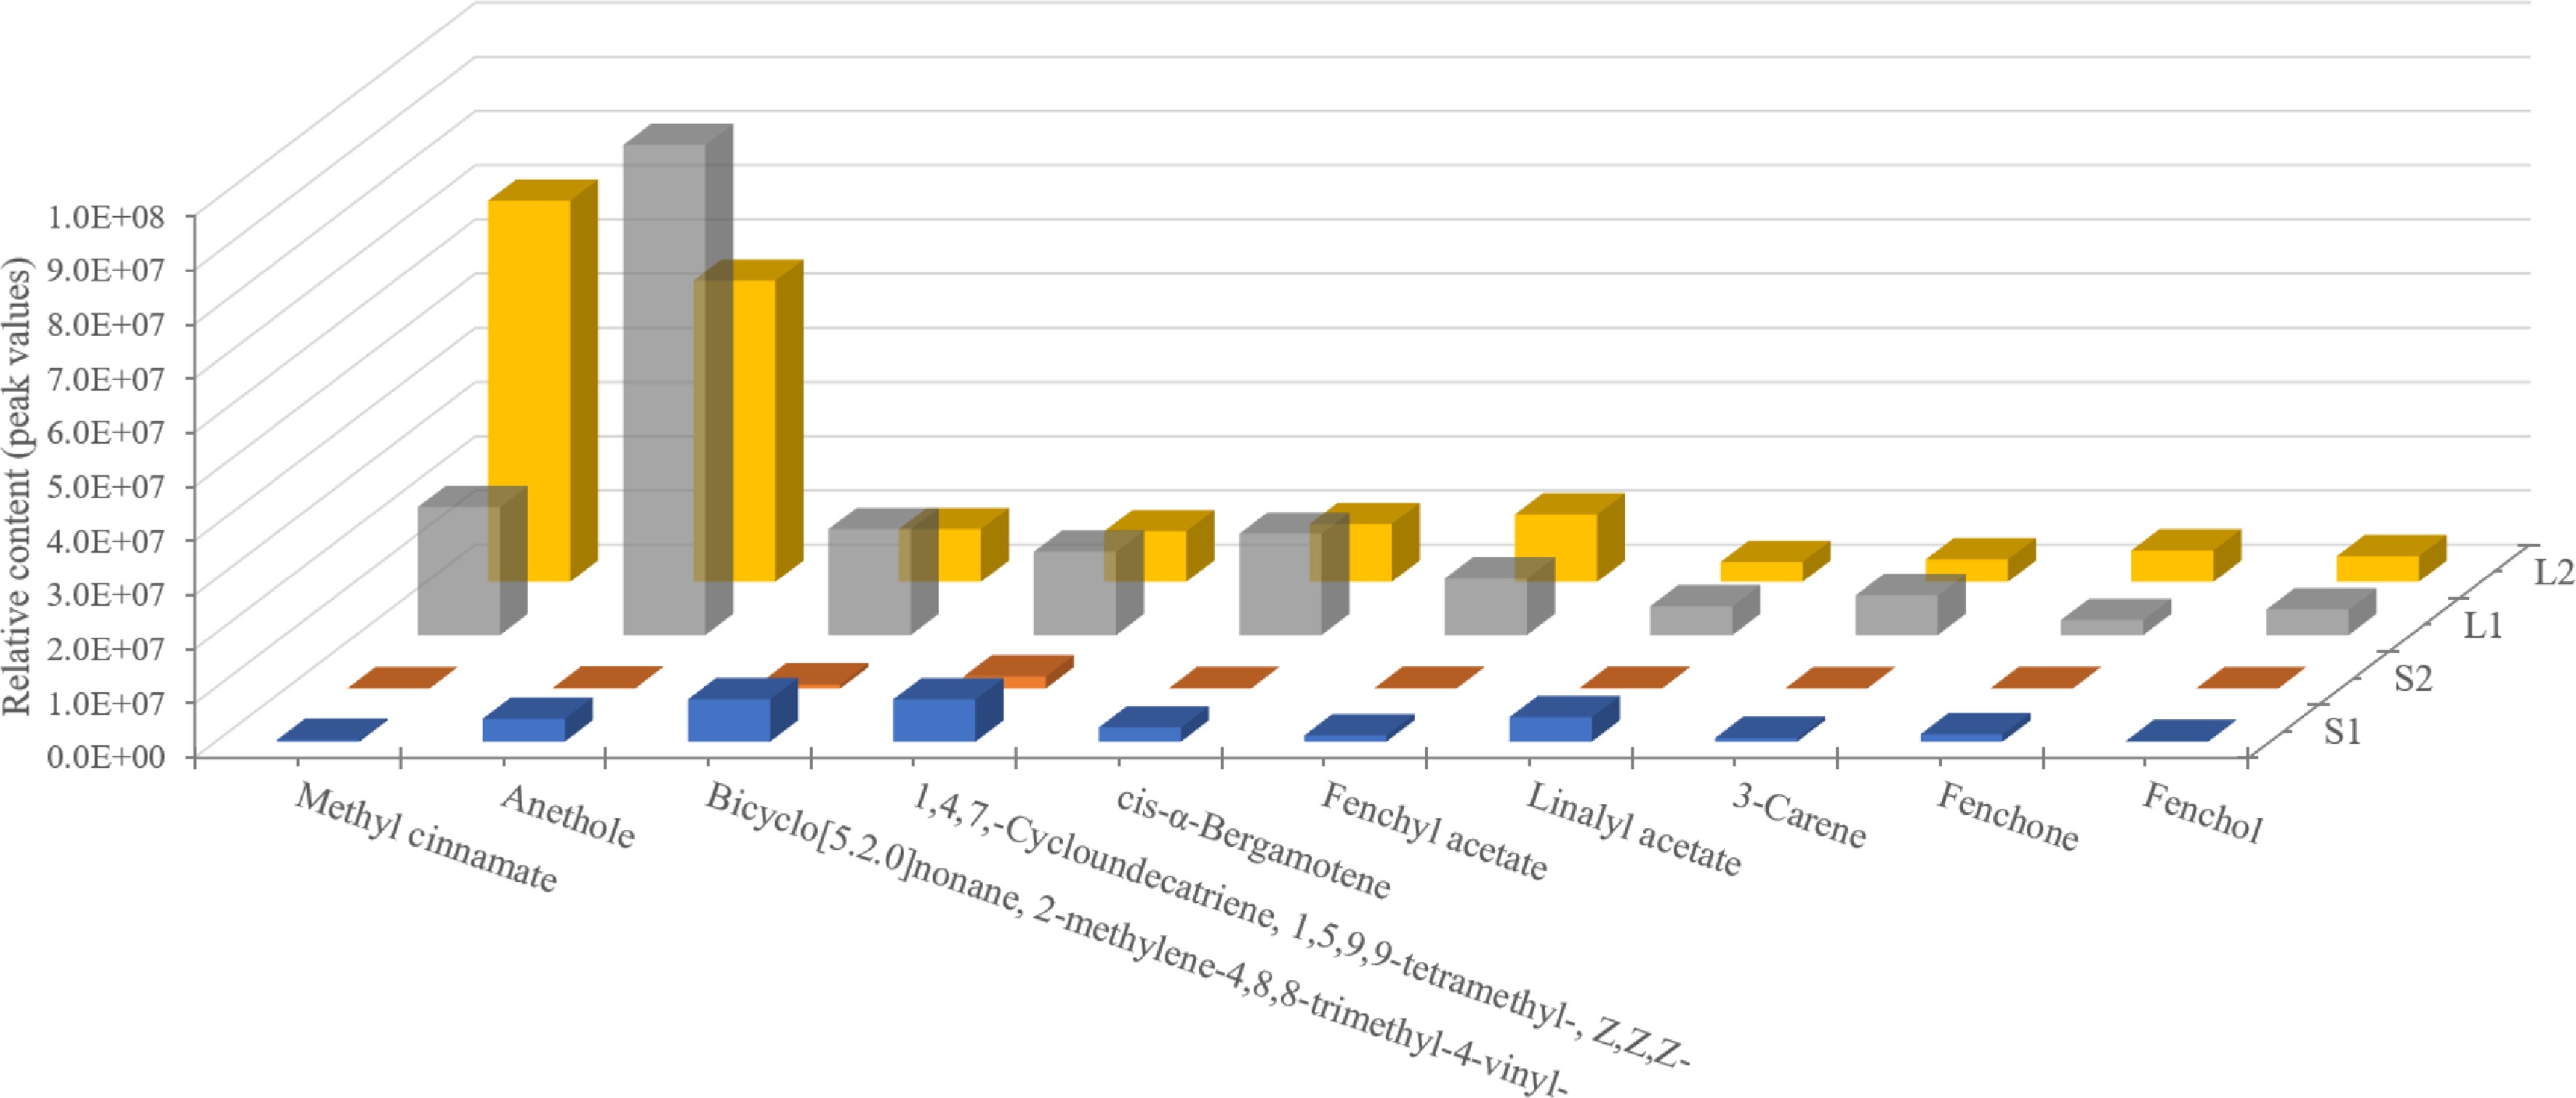
Figure 2.
The content analysis of the top ten volatile compounds in basil leaves and stems at various developmental stages. Methyl cinnamate and anethole (phenyl/phenylpropanes) are the predominant components of the essential oil.
-
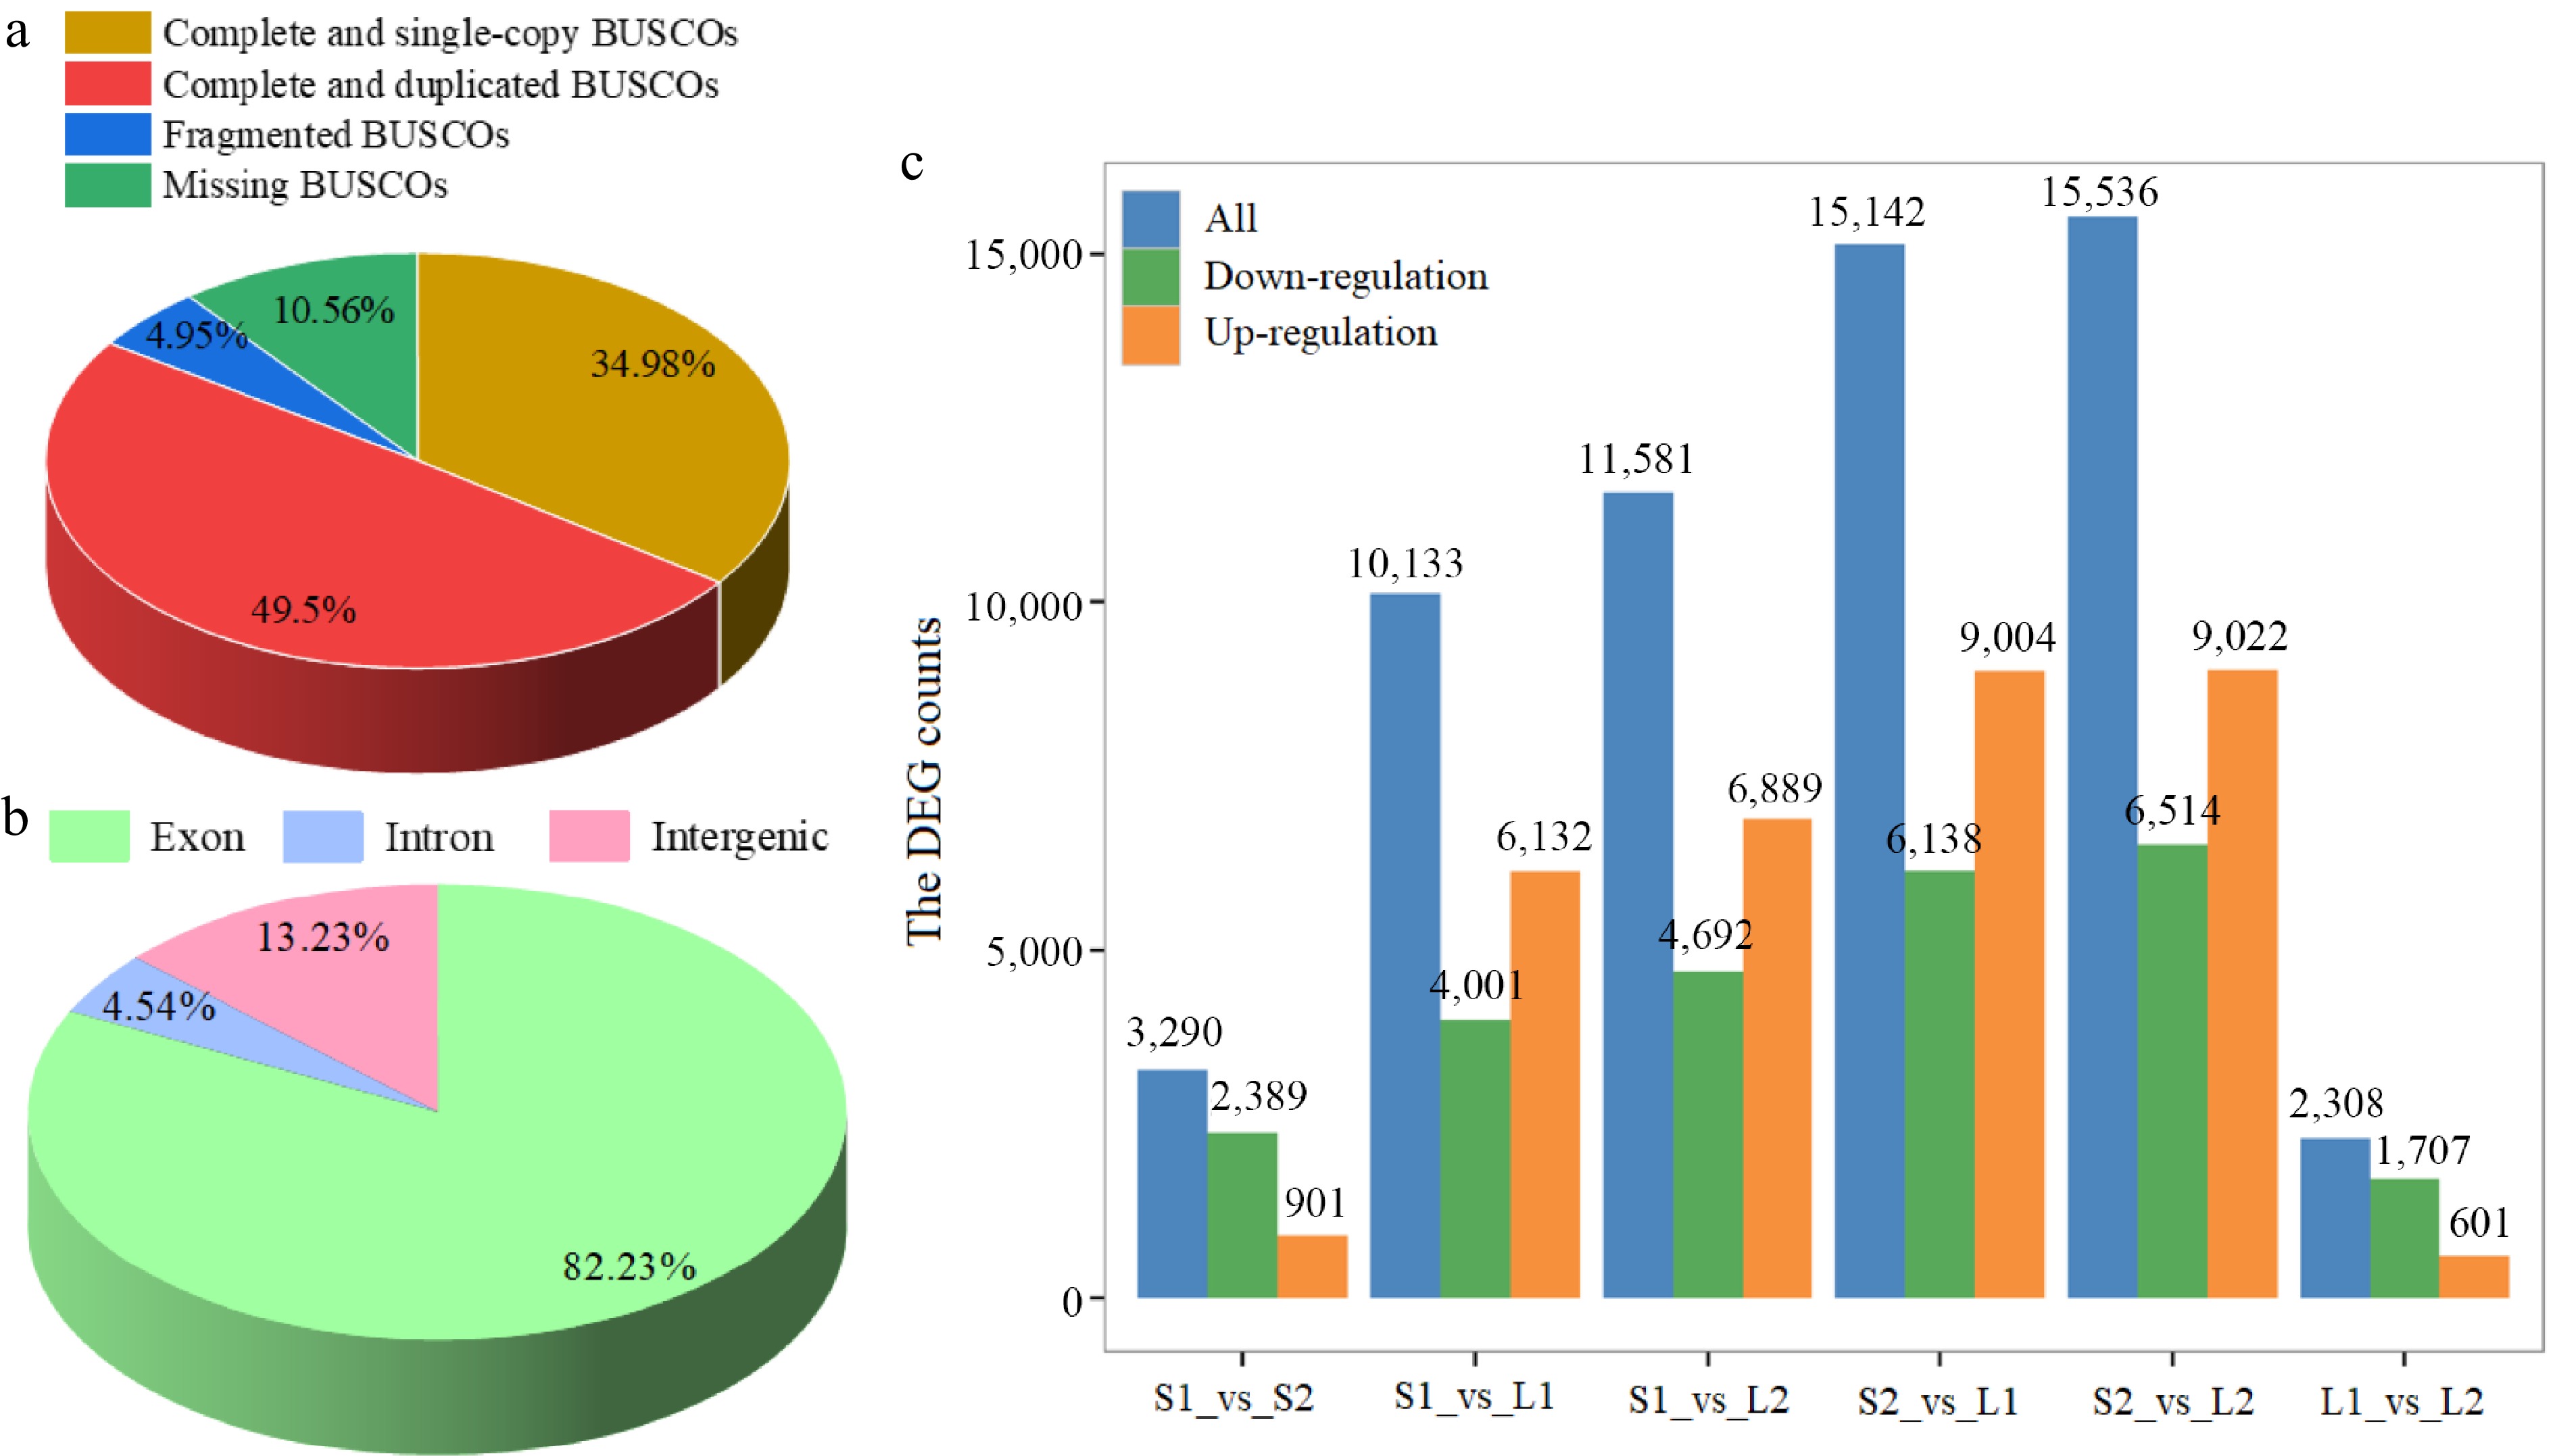
Figure 3.
Statistical analysis of transcriptome data. (a) BUSCO tool quality assessment categorized proportions as complete and single-copy (dark yellow), complete and duplicated (red), fragmented (blue), and missing (green). (b) Distribution of reads across various genome regions. (c) Differential expression analysis. Normalization and differential expression analysis was performed using DESeq2.
-
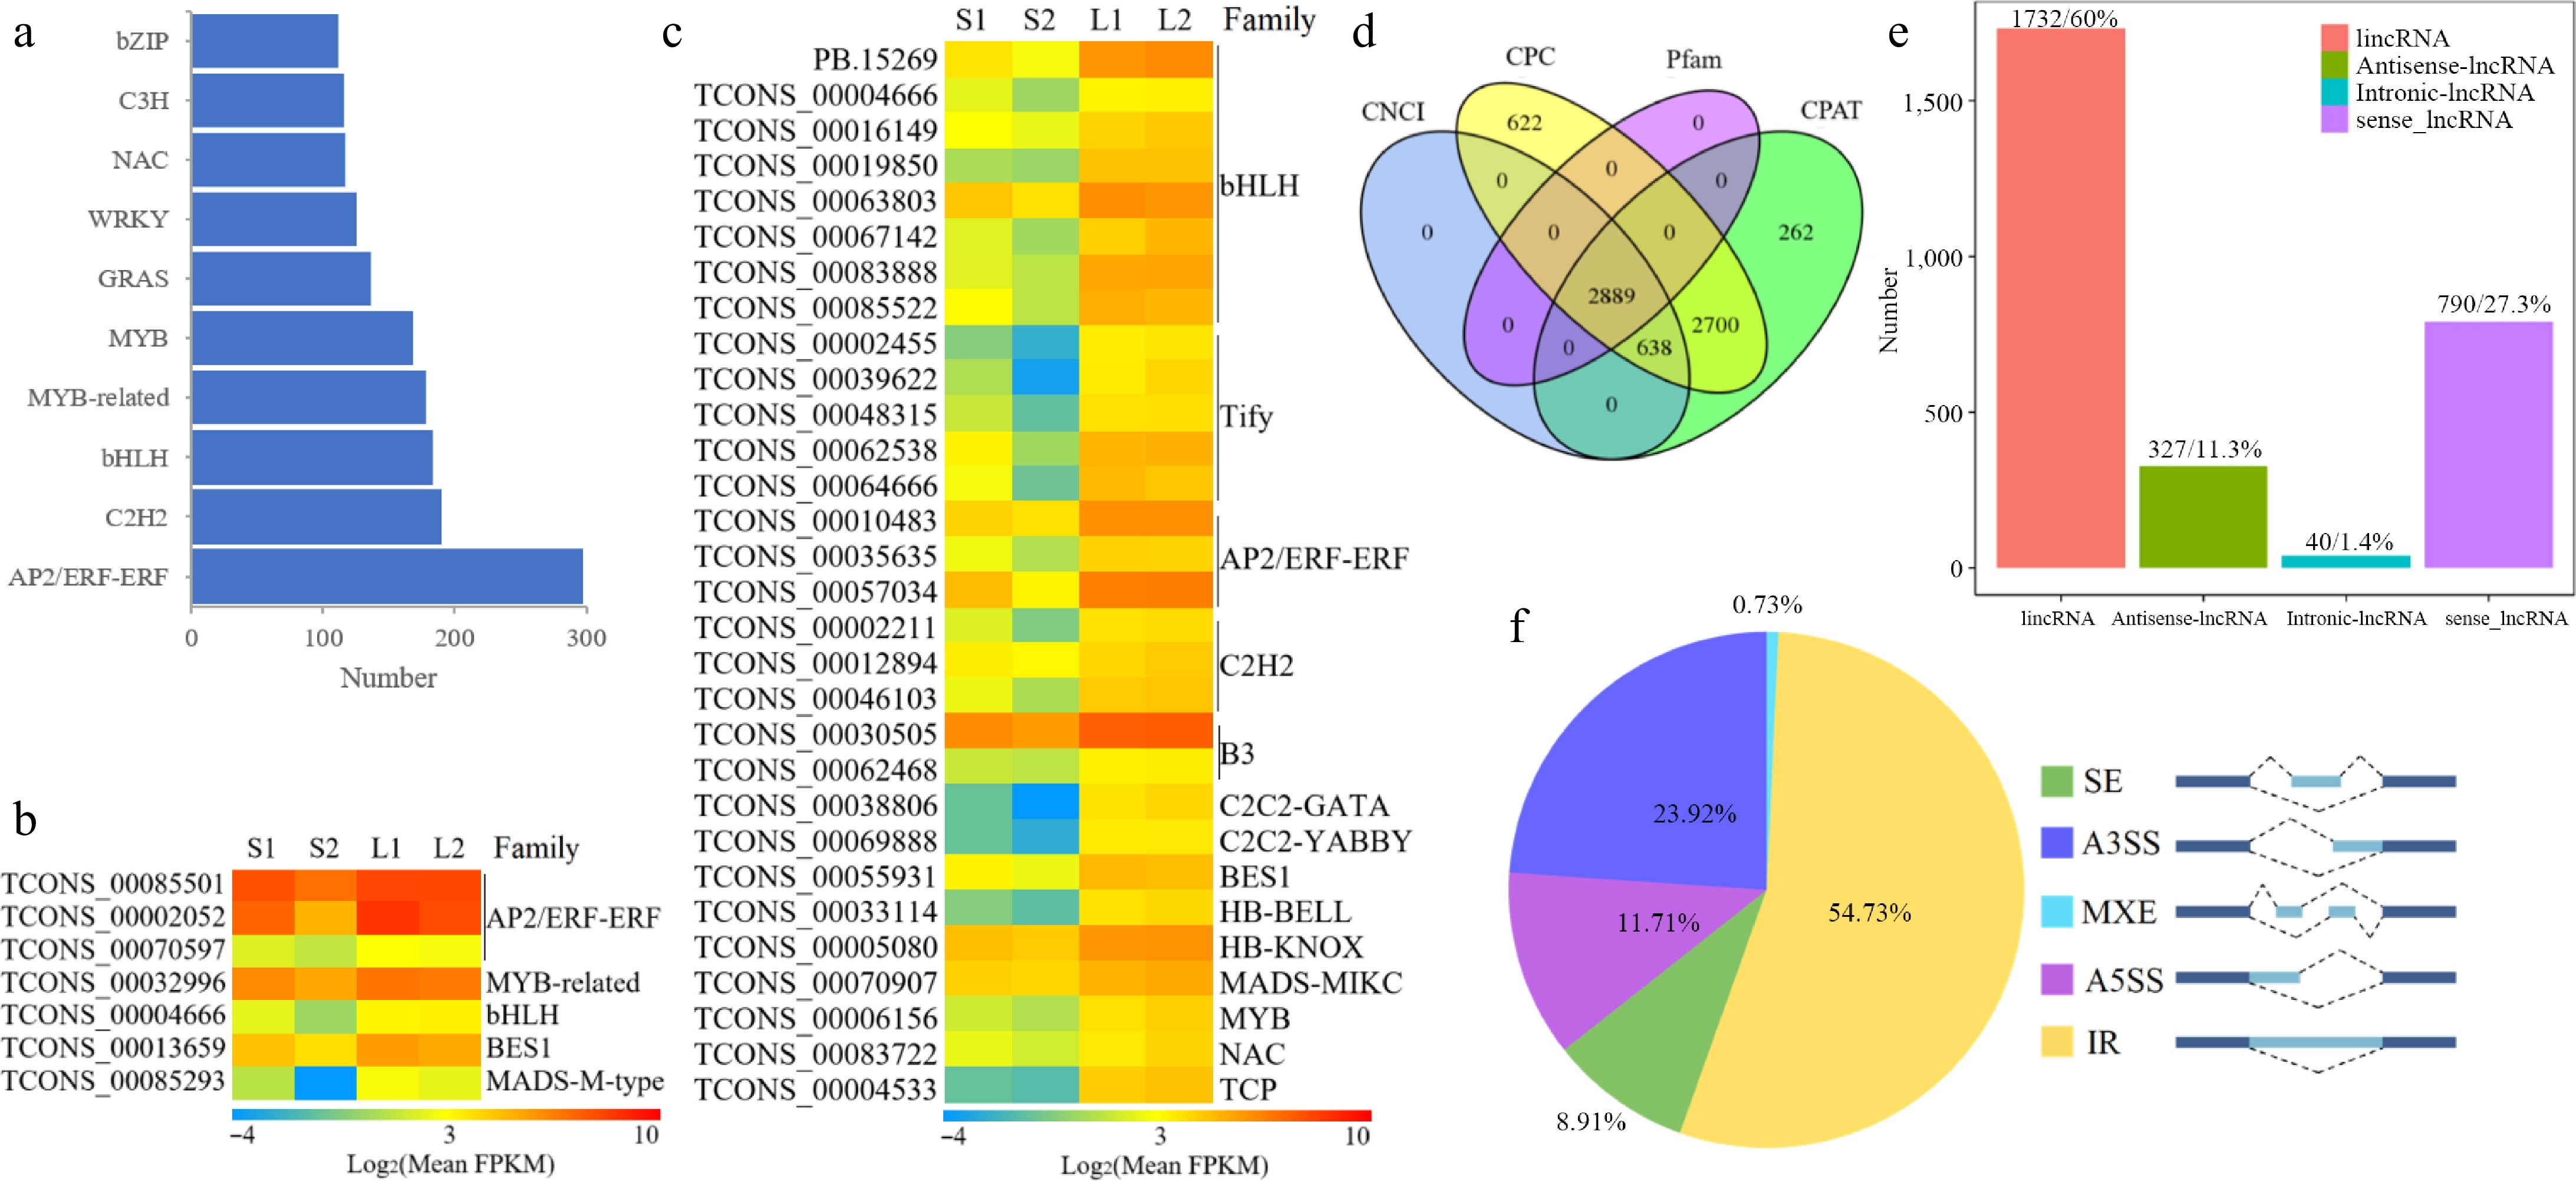
Figure 4.
Transcriptomic structure analysis in O. basilicum var. pilosum. (a) Ranking and distribution of the top ten TF families. (b), (c) Heatmaps of TFs with extremely positive correlations to anethole and methyl cinnamate content, respectively. The FPKM data were log2 transformed with a pseudocount (FPKM + 0.01). Red indicates the highest value, green the lowest, and yellow the median on the heatmap. (d) A Venn diagram displaying the lncRNA outcomes of four screening methods. (e) Classification of lncRNAs based on their genomic locations. (f) Statistical overview of AS events. A3SS: Alternative 3' Splice Site; A5SS: Alternative 5' Splice Site; MXE: Mutually Exclusive Exon; IR: Intron Retention; SE: Skipped Exon.
-
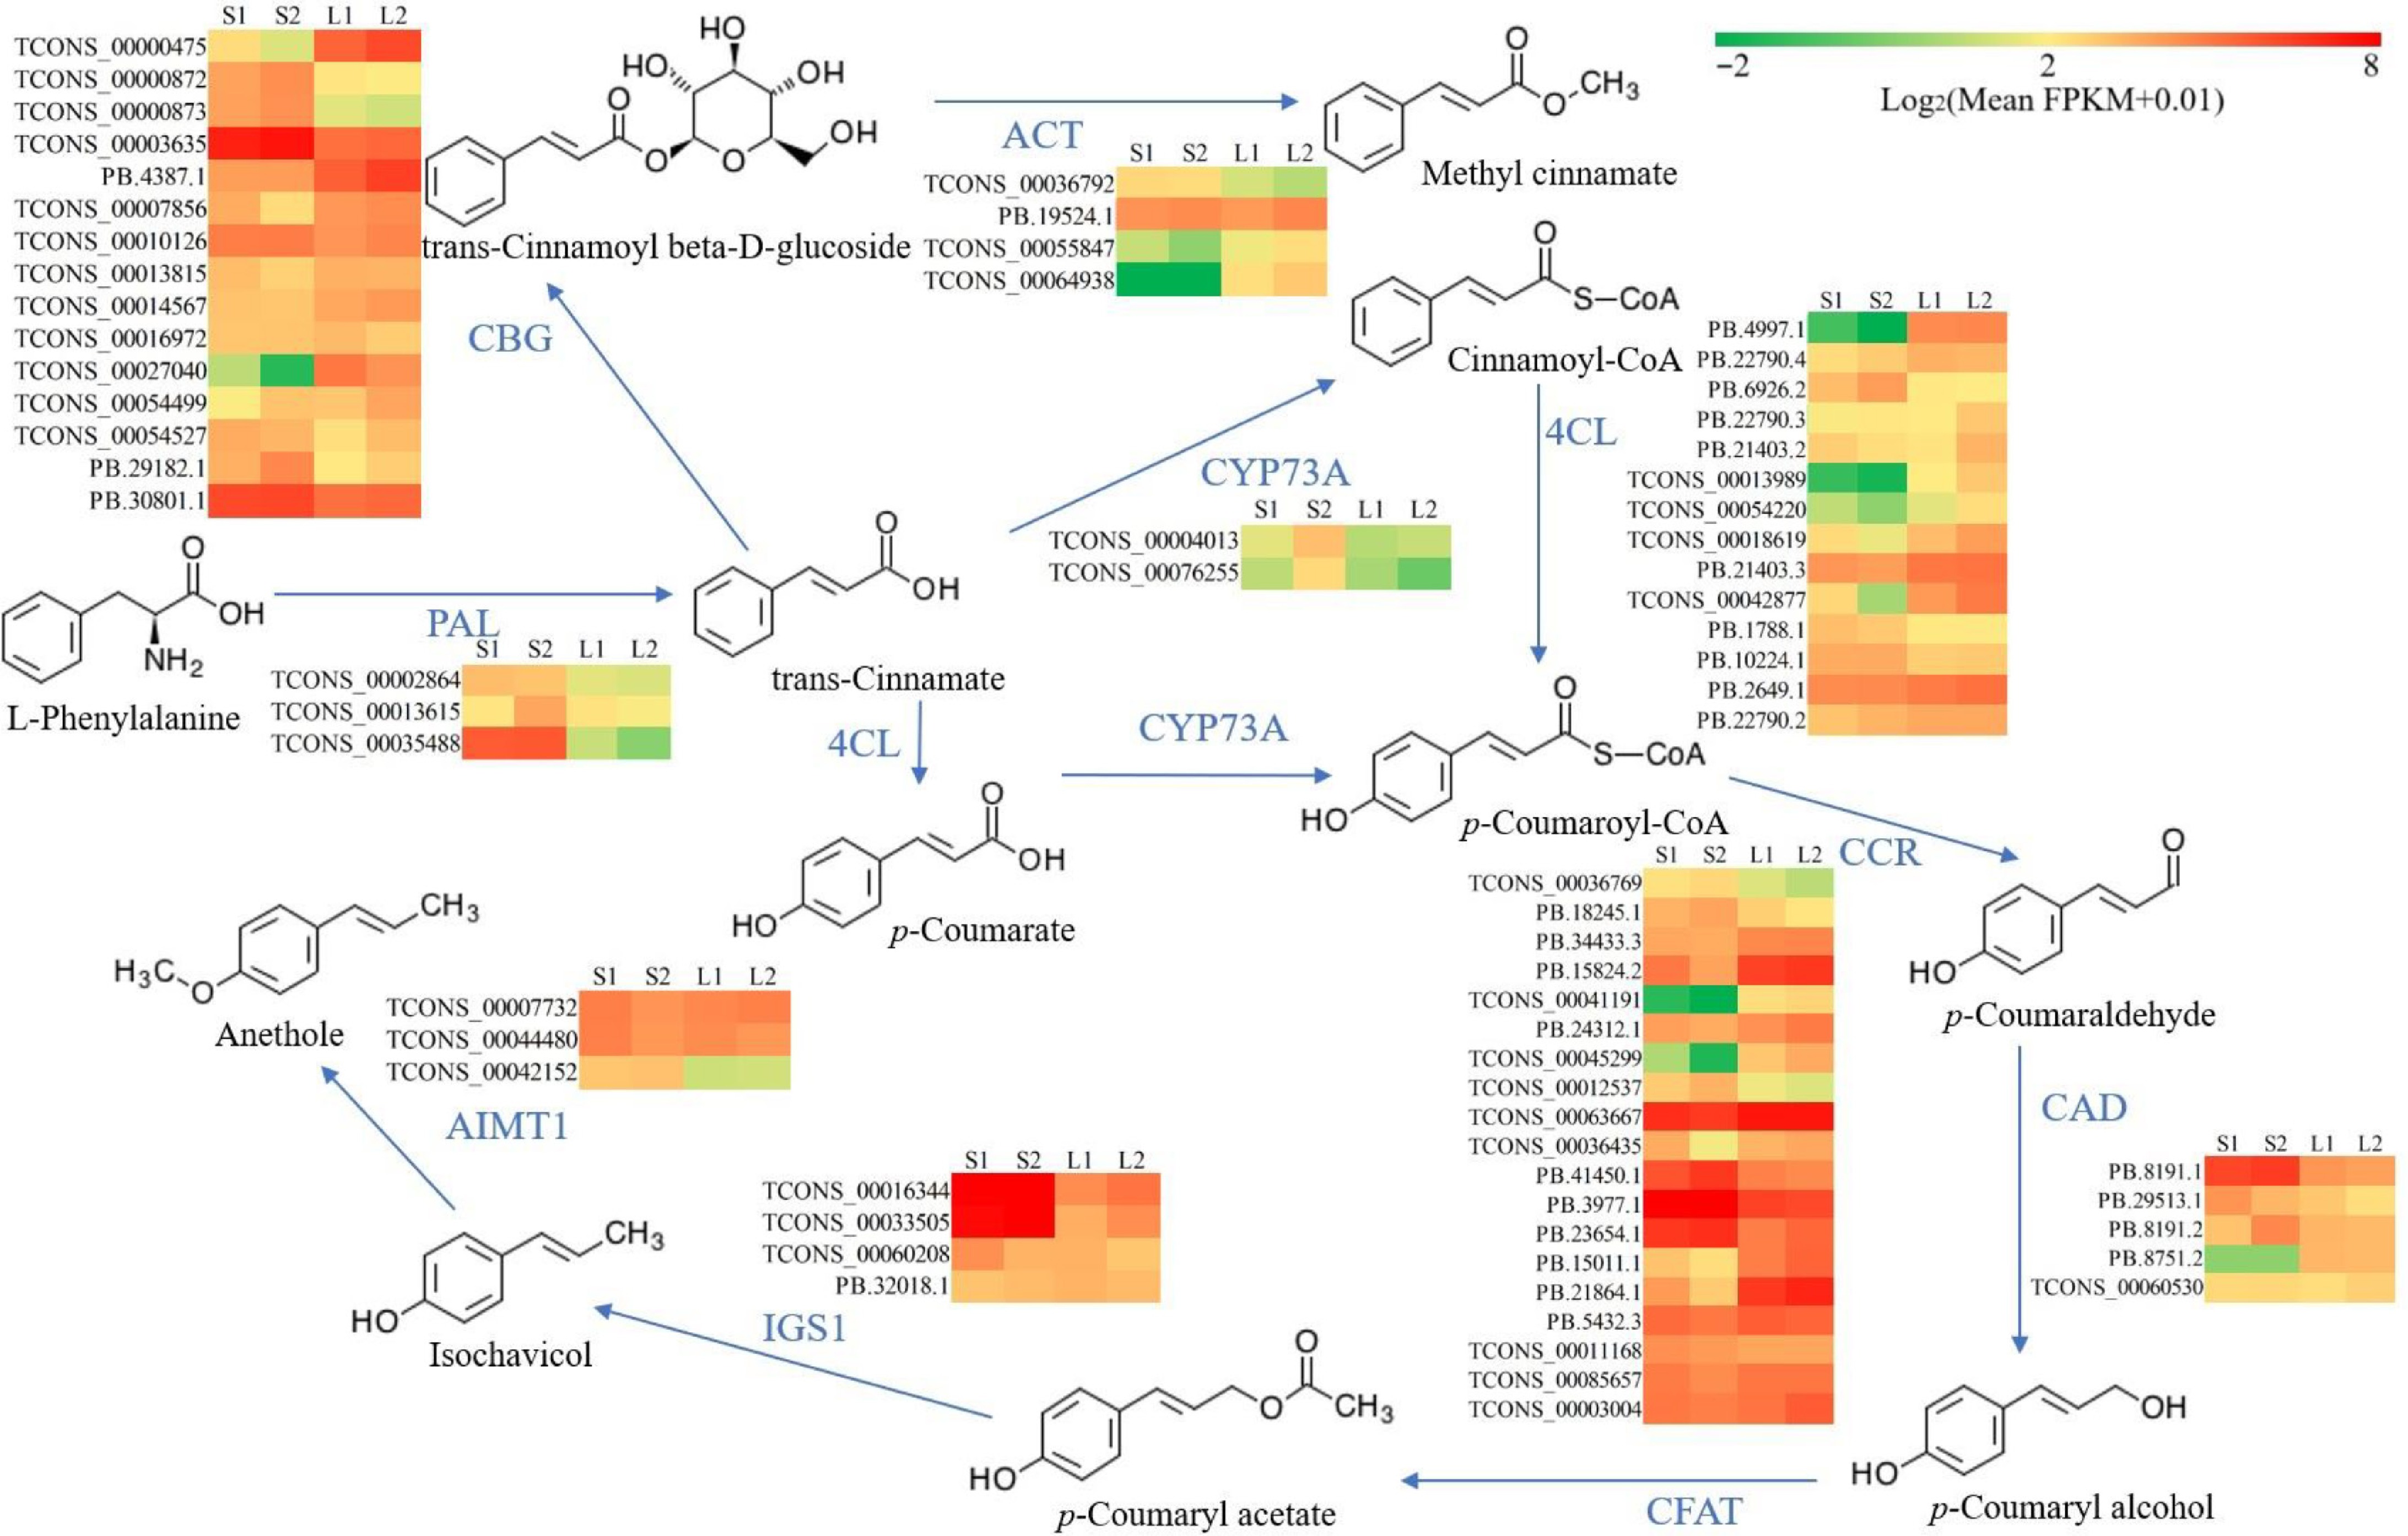
Figure 5.
Reconstruction of the biosynthetic pathway for methyl cinnamate and anethole. Color coding in the pathway indicates relative expression levels, with red for the highest FPKM values, green for moderate levels, and yellow for median values. 4CL, 4-coumarate--CoA ligase; ACT, alcohol O-cinnamoyltransferase; AIMT1, trans-anol O-methyltransferase; CAD, cinnamyl-alcohol dehydrogenase; CBG, cinnamate beta-D-glucosyltransferase; CCR, cinnamoyl-CoA reductase; CFAT, coniferyl alcohol acyltransferase; CYP73A, trans-cinnamate 4-monooxygenase; PAL, phenylalanine ammonia-lyase; IGS1, isoeugenol synthase.
-
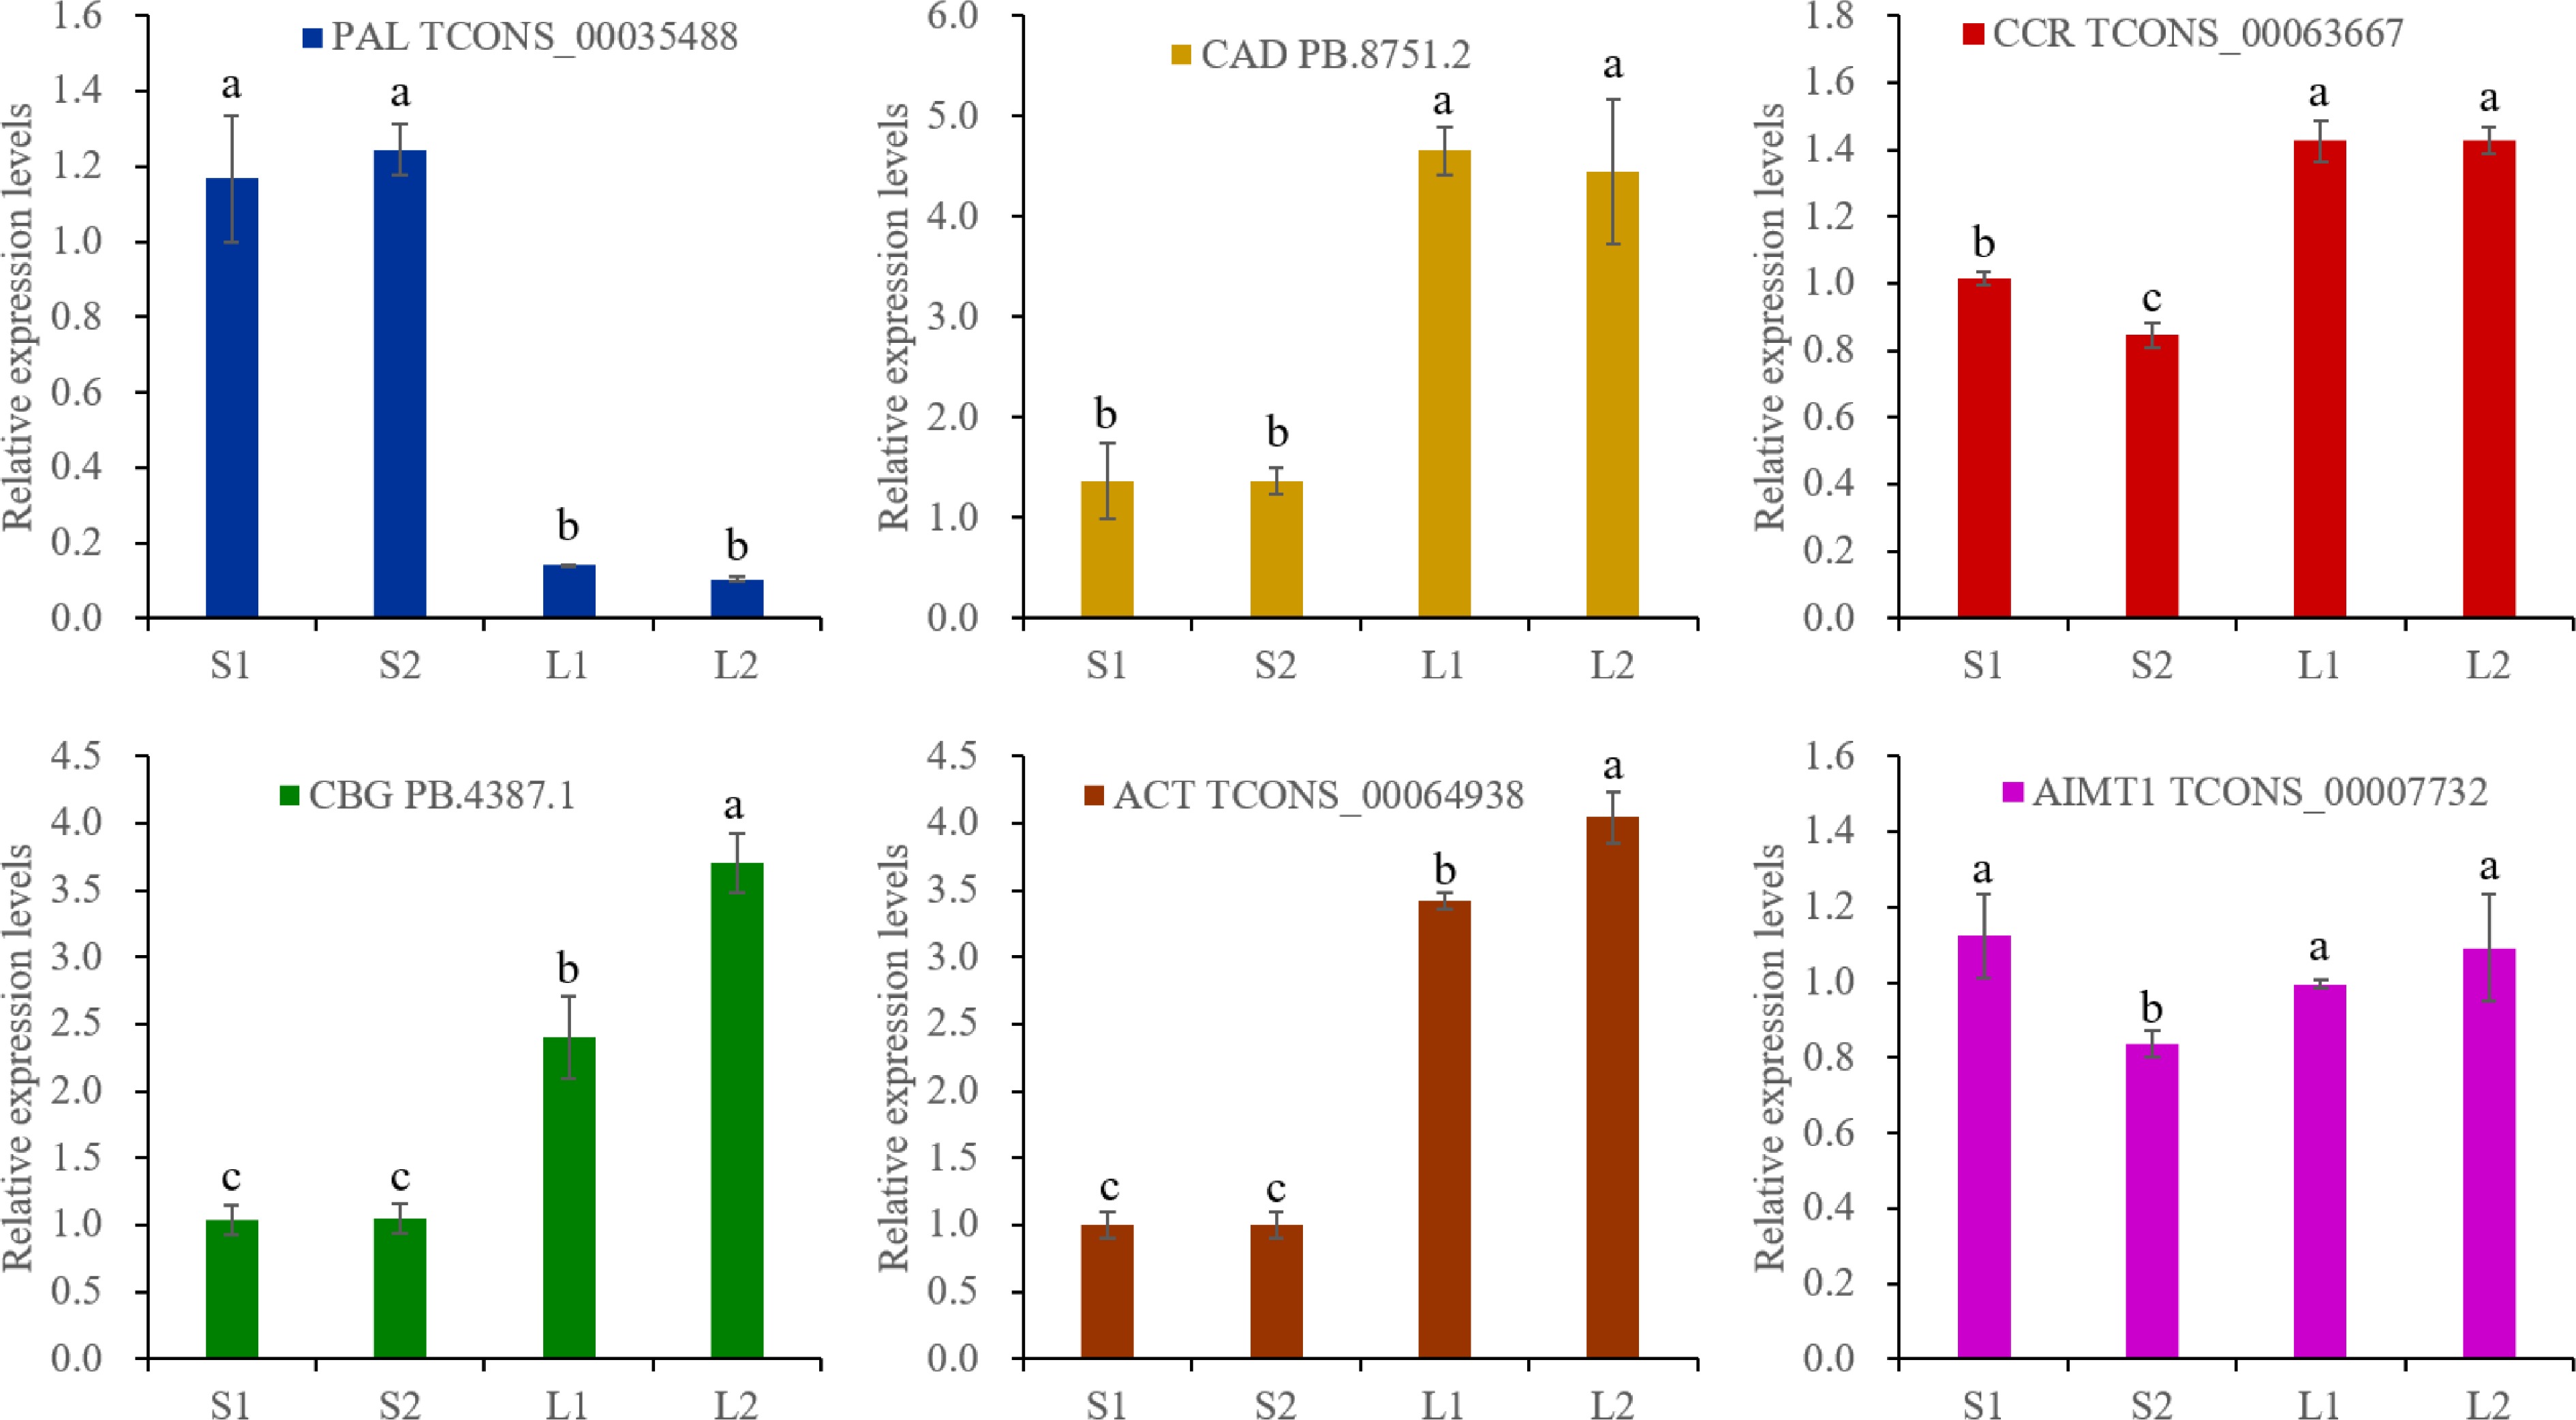
Figure 6.
RT-qPCR analysis. The actin gene was selected as an reference gene. The expression levels were calculated by 2−ΔΔCᴛ. Different lowercase letters represent significant differences, and the same lowercase letters represent no significant differences (p < 0.05). One-way analysis of variance and q-test were used for data analysis.
Figures
(6)
Tables
(0)