-
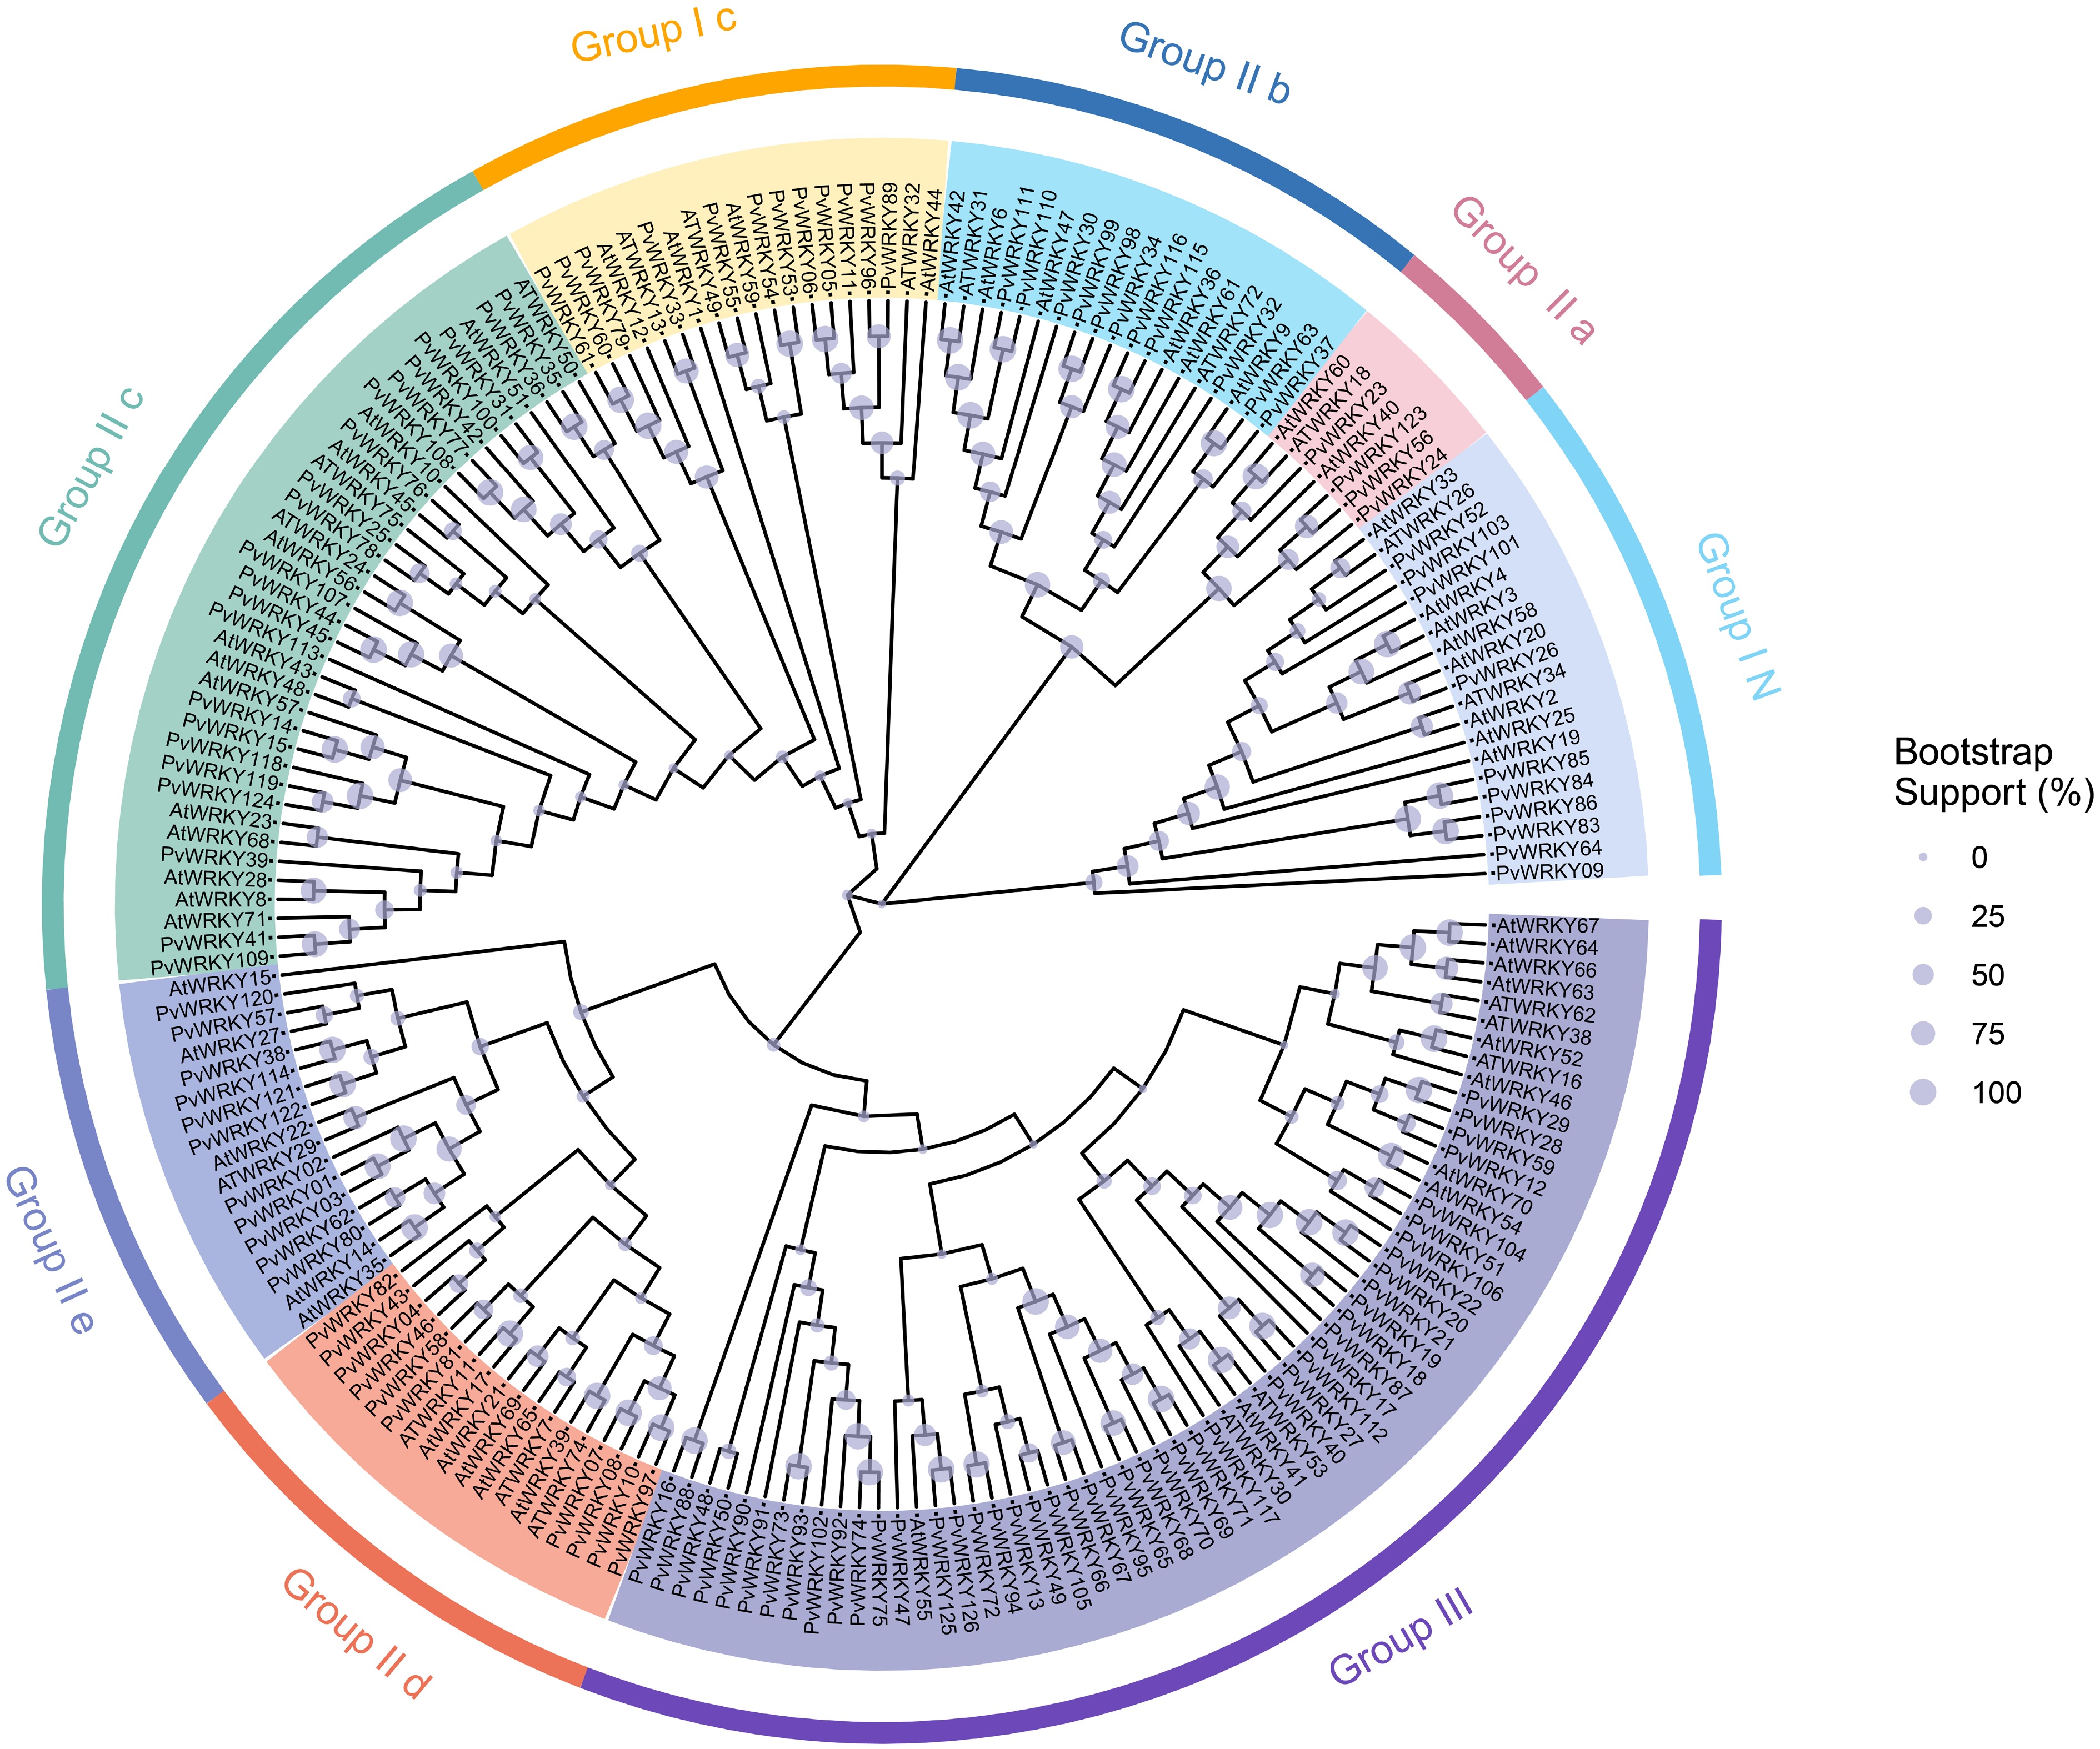
Figure 1.
Phylogenetic clustering analysis of the 126 identified WRKY proteins from seashore paspalum. Different colors represent distinct subfamilies. The purple sections on the branches indicate bootstrap values, with larger bootstrap values corresponding to larger purple sections.
-
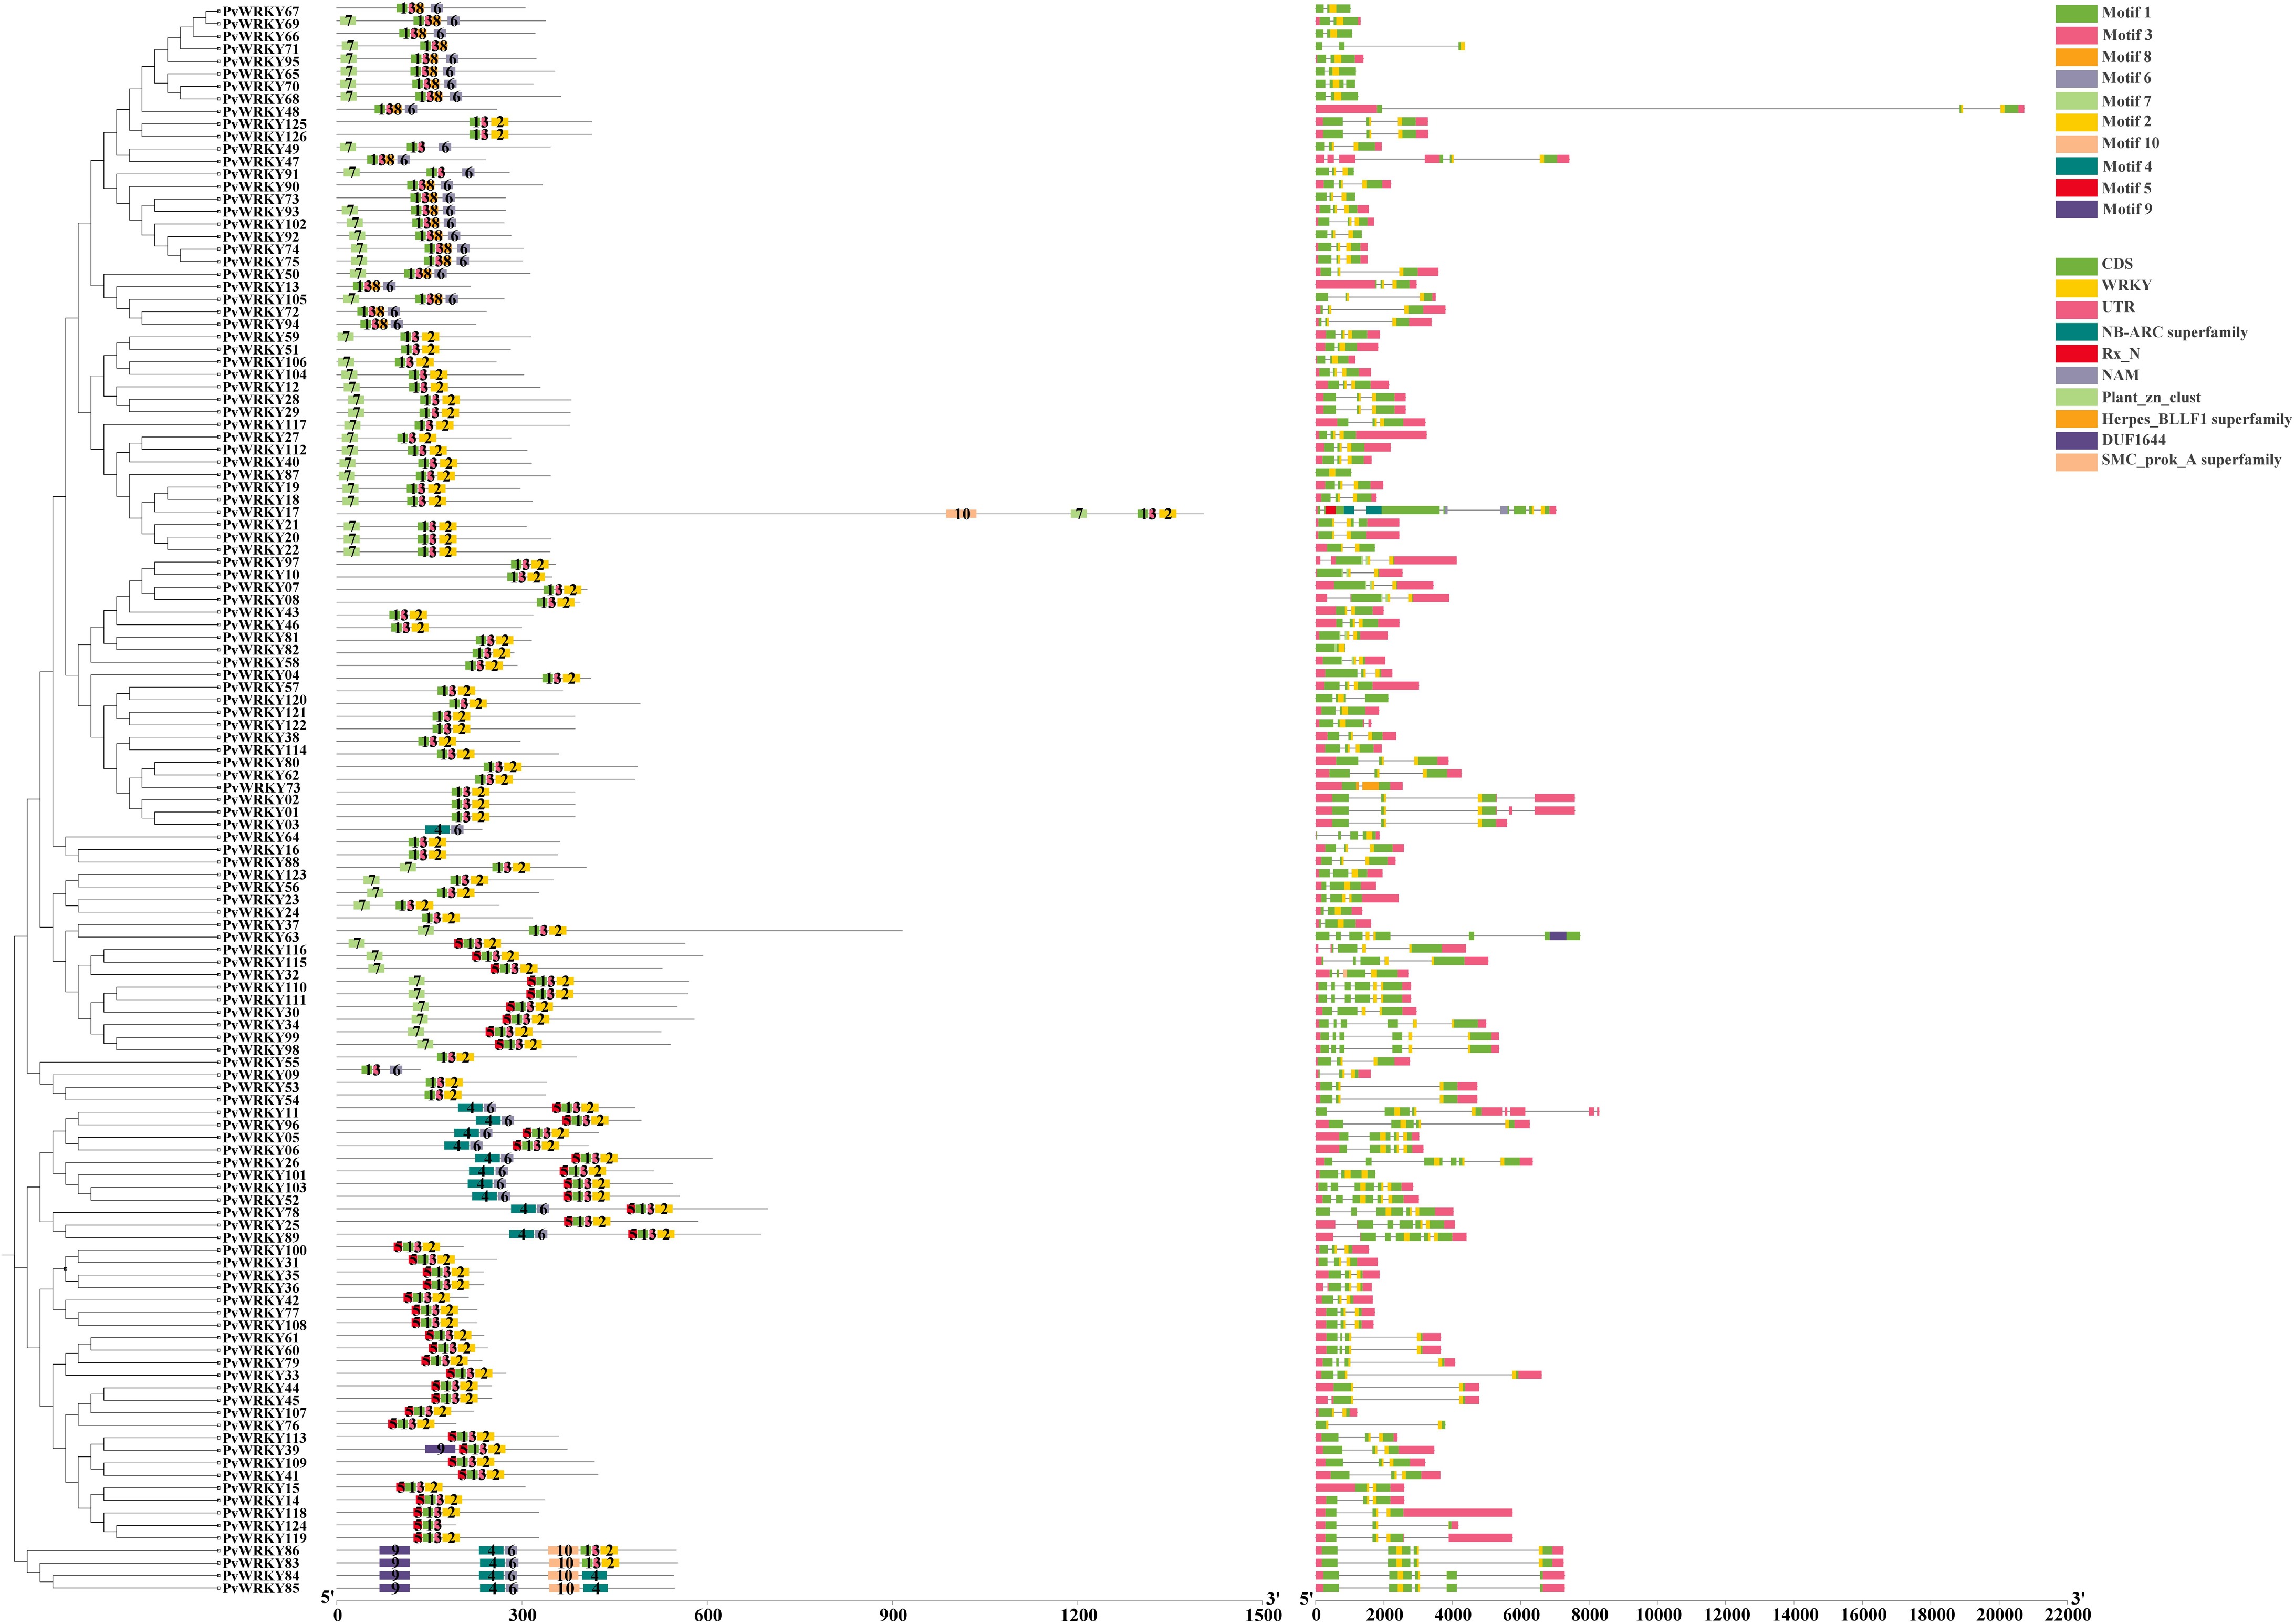
Figure 2.
Analysis of motifs and gene structure in PvWRKYs. (a) Motif analysis of WRKYs in seashore paspalum. (b) WRKY gene structure in seashore paspalum.
-
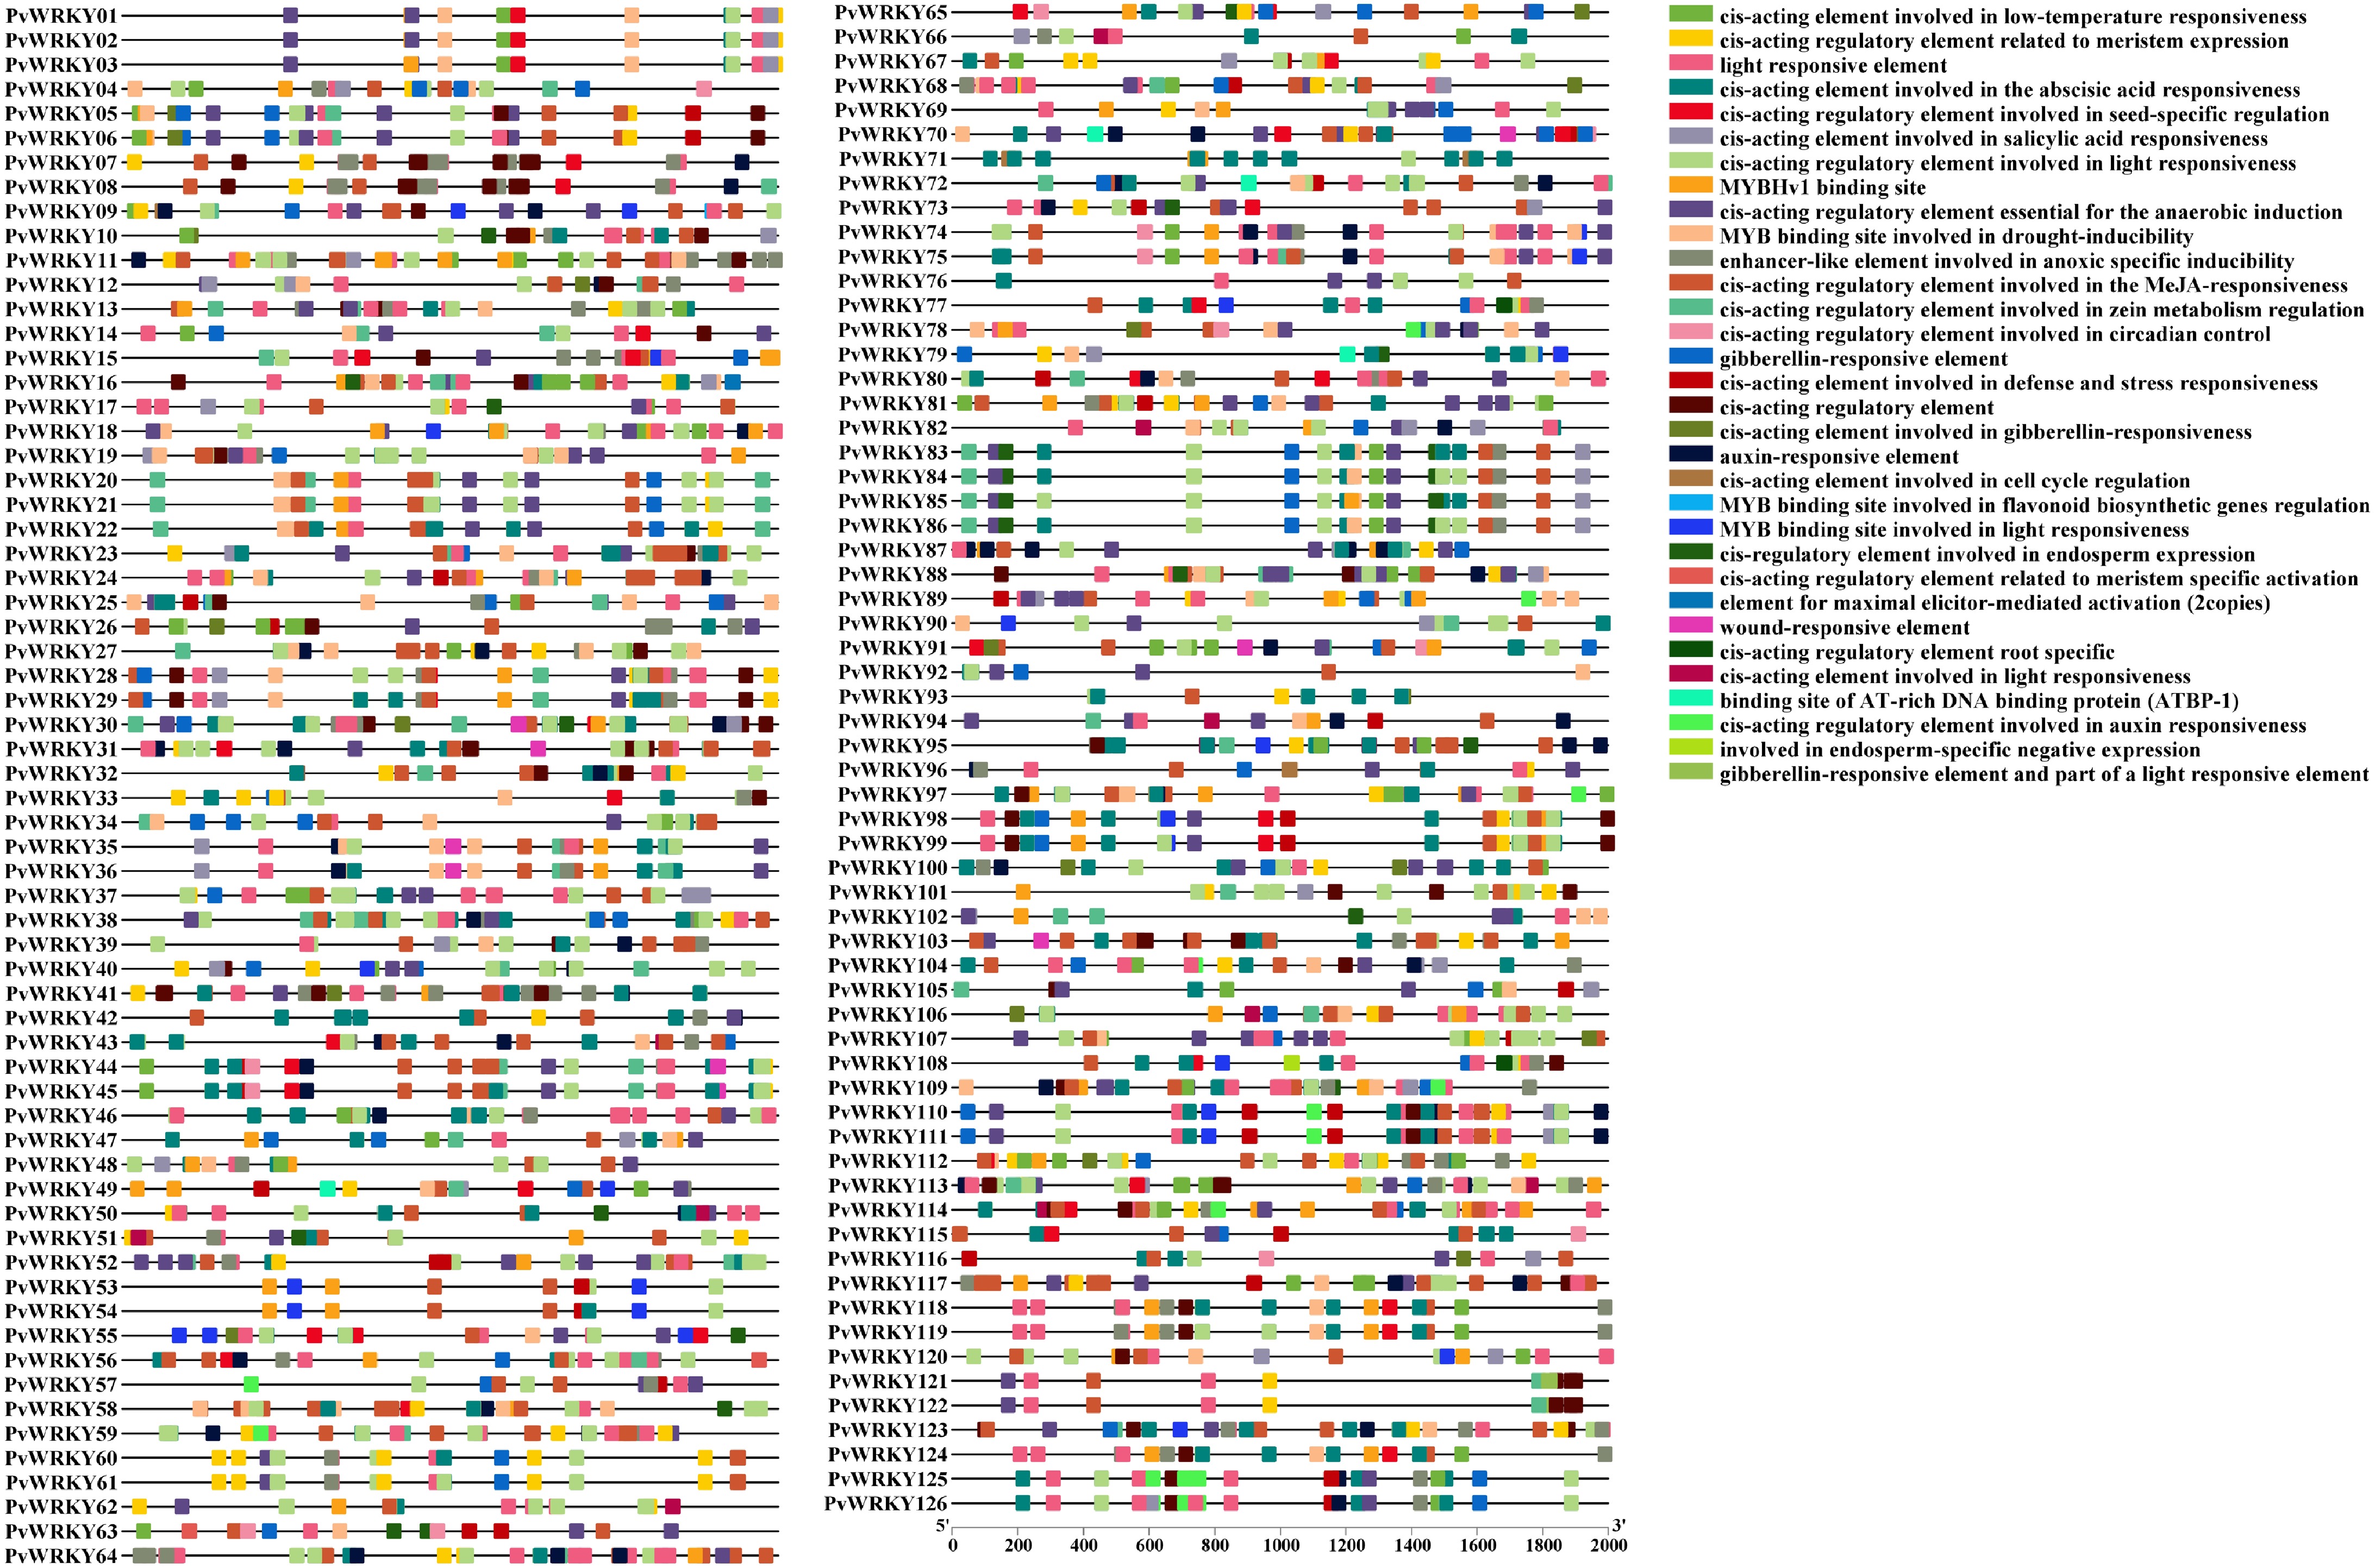
Figure 3.
Analysis of cis-elements in PvWRKY TFs. Cis-elements related to various environmental stress responses or hormonal interactions are displayed in different colors.
-
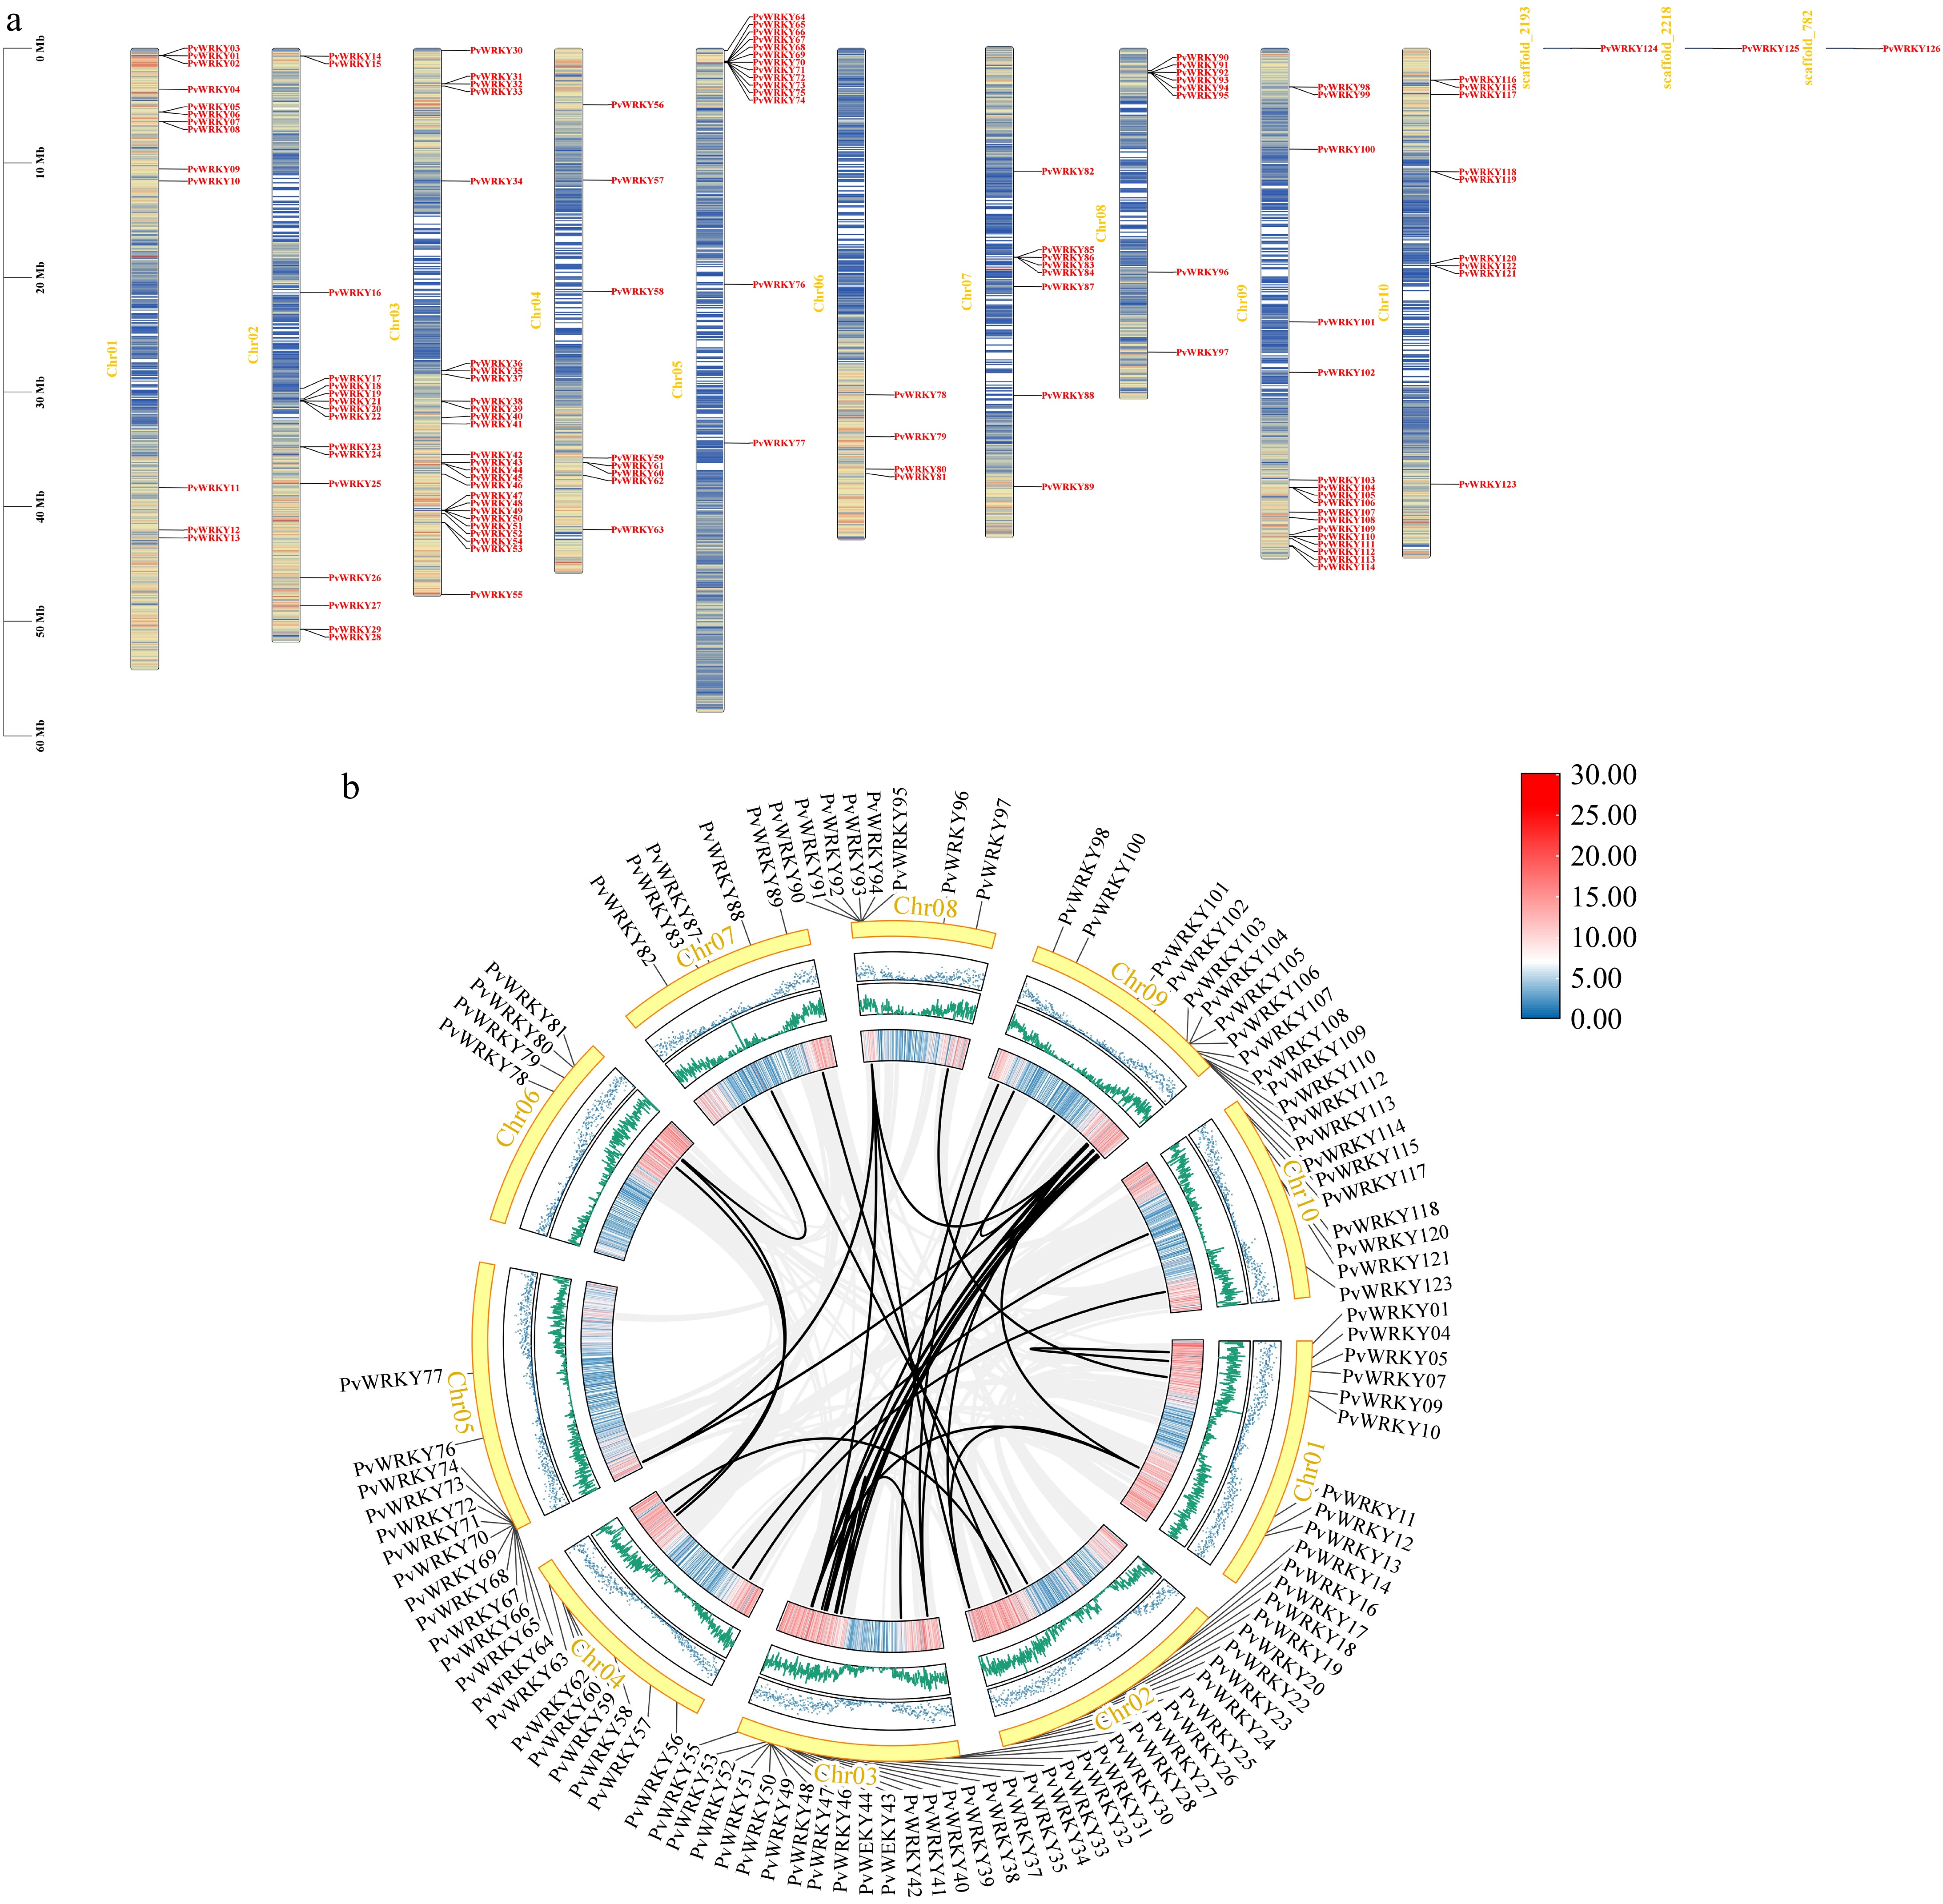
Figure 4.
Chromosomal mapping and syntenic relationships of PvWRKY genes. (a) The physical distribution of the 126 identified PvWRKY genes across the seashore paspalum chromosomes is shown, with locus IDs labeled according to their genomic positions. (b) Synteny networks are displayed, where homologous gene pairs connected by black lines indicate segmental duplication events contributing to WRKY family expansion. Gray background linkages outline conserved syntenic blocks, while black-highlighted pairs represent duplicated WRKY genes.
-
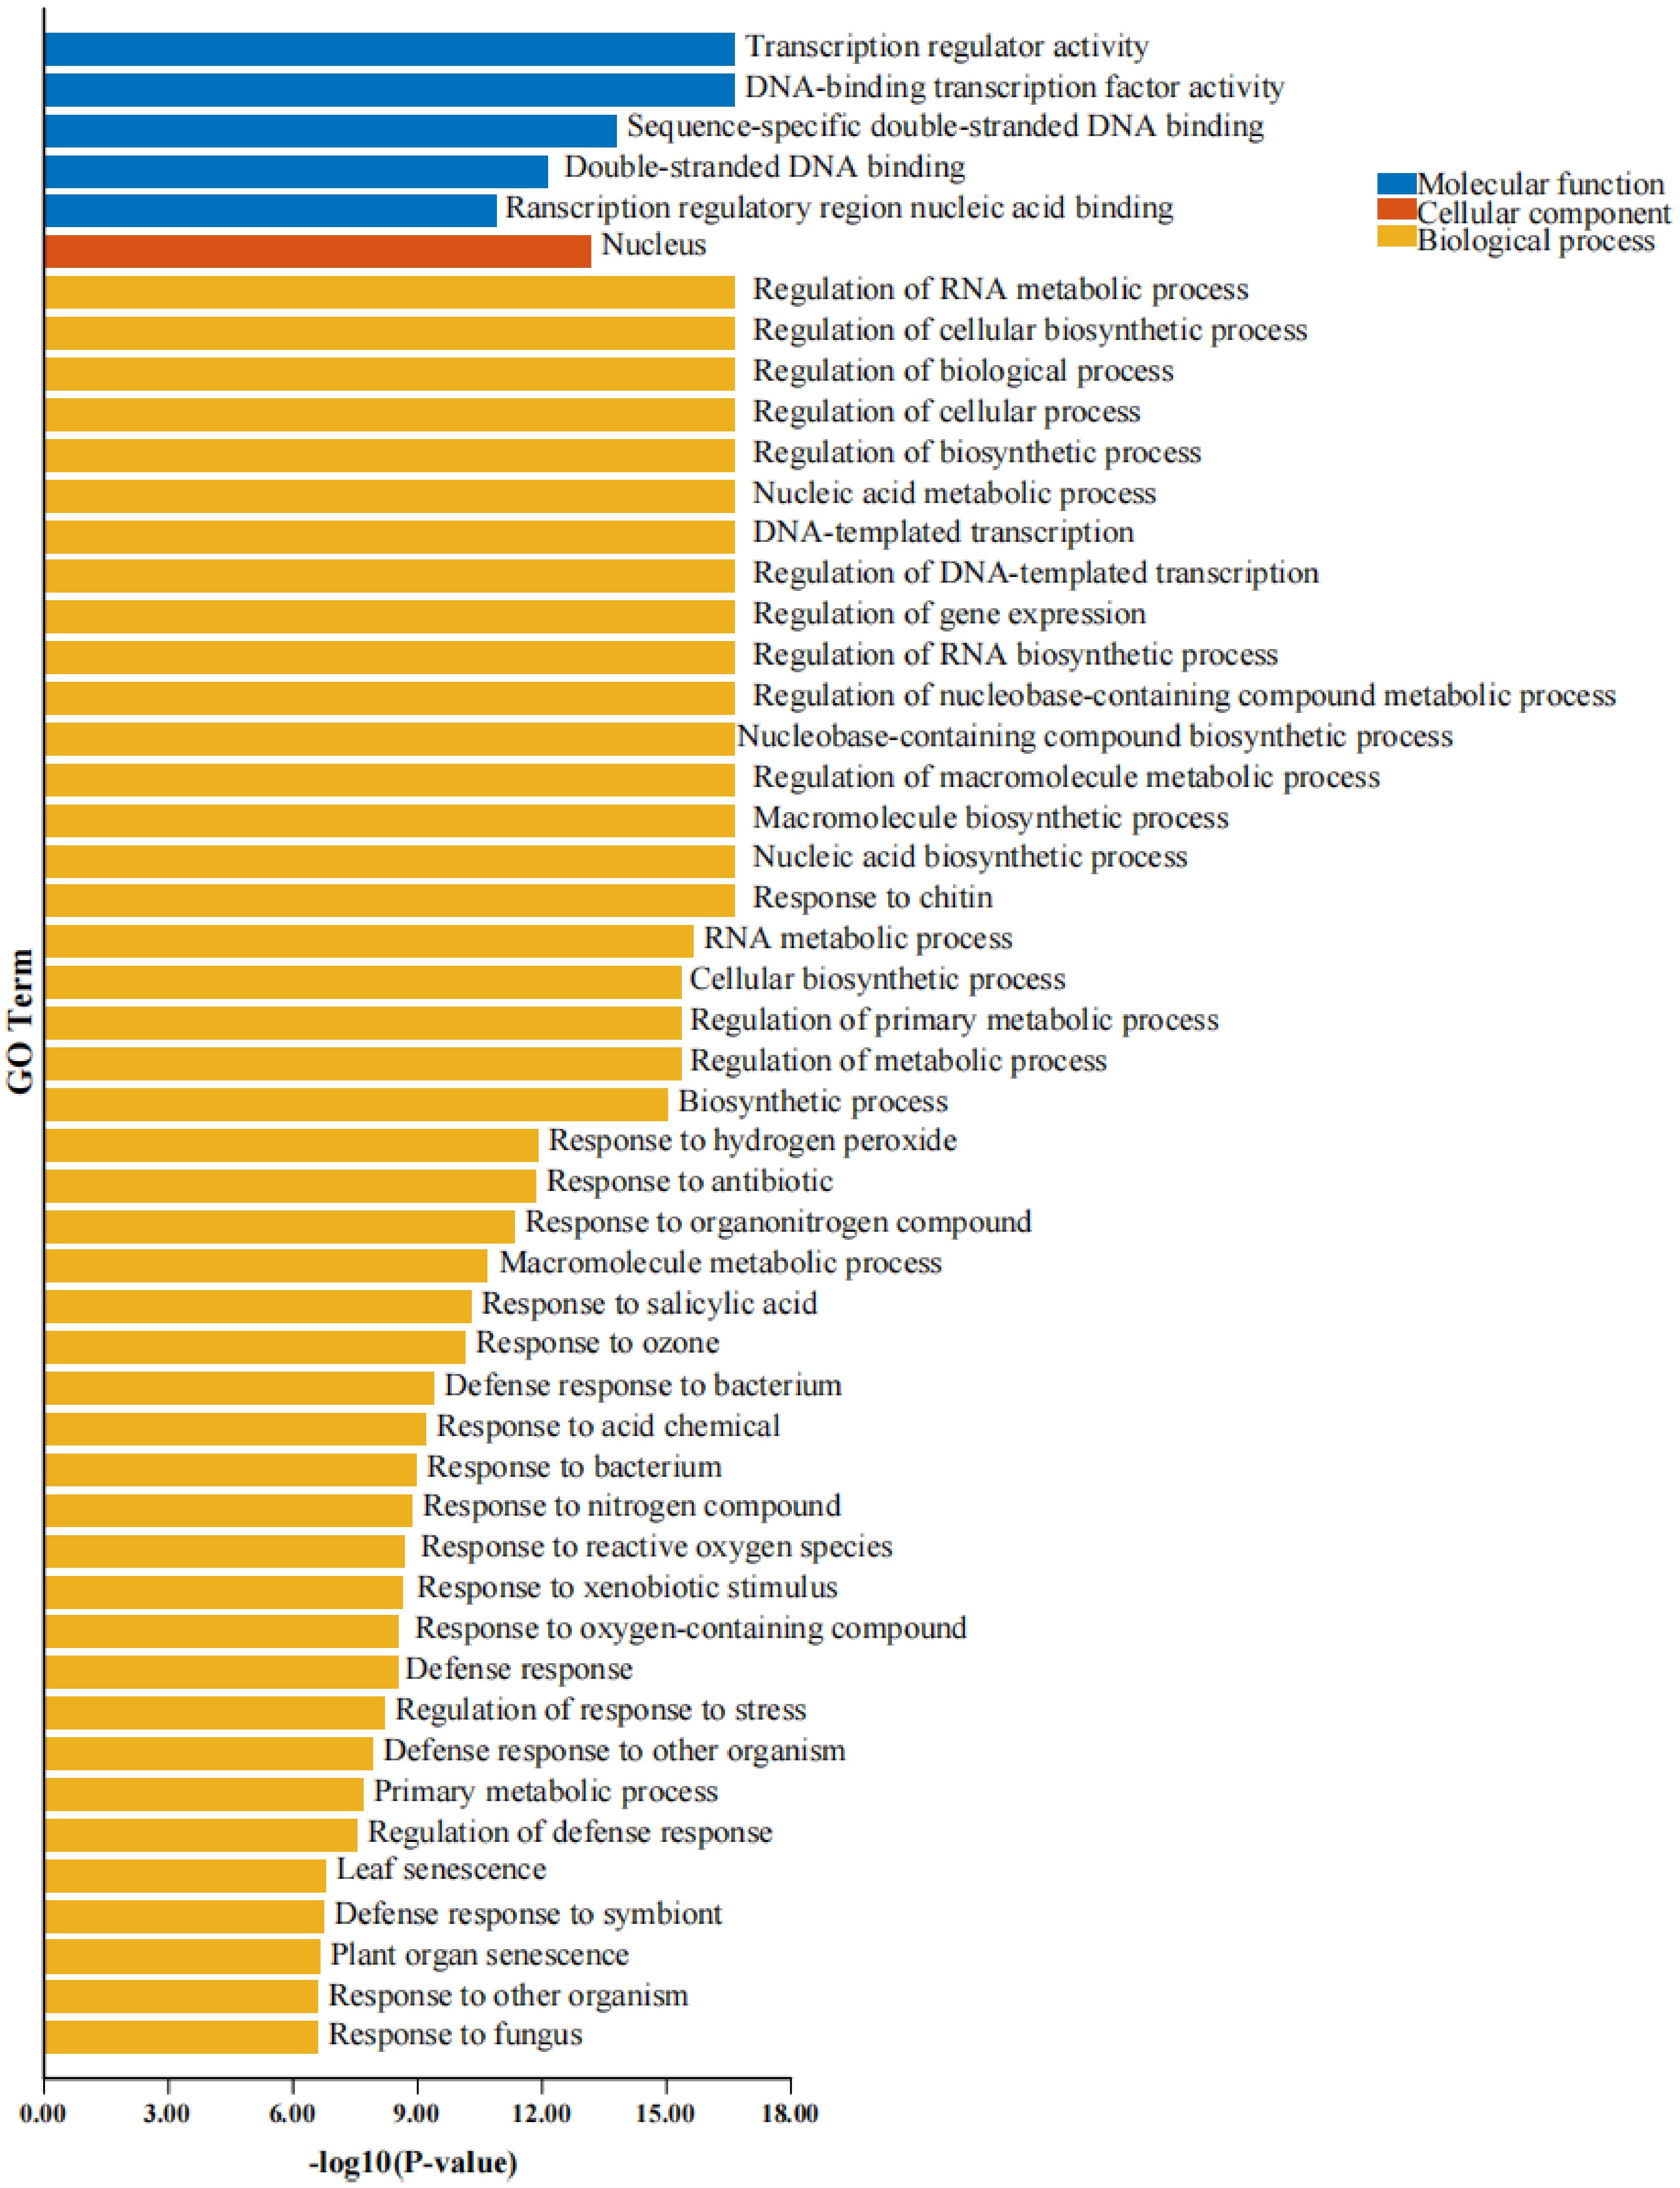
Figure 5.
GO enrichment analysis of WRKY proteins. Blue indicates molecular function (MF), orange represents biological process (BP), and yellow corresponds to cellular component (CC). The x-axis displays −log10(p-value), which reflects the statistical significance of the enriched GO terms for WRKY proteins. A higher value indicates greater enrichment significance.
-
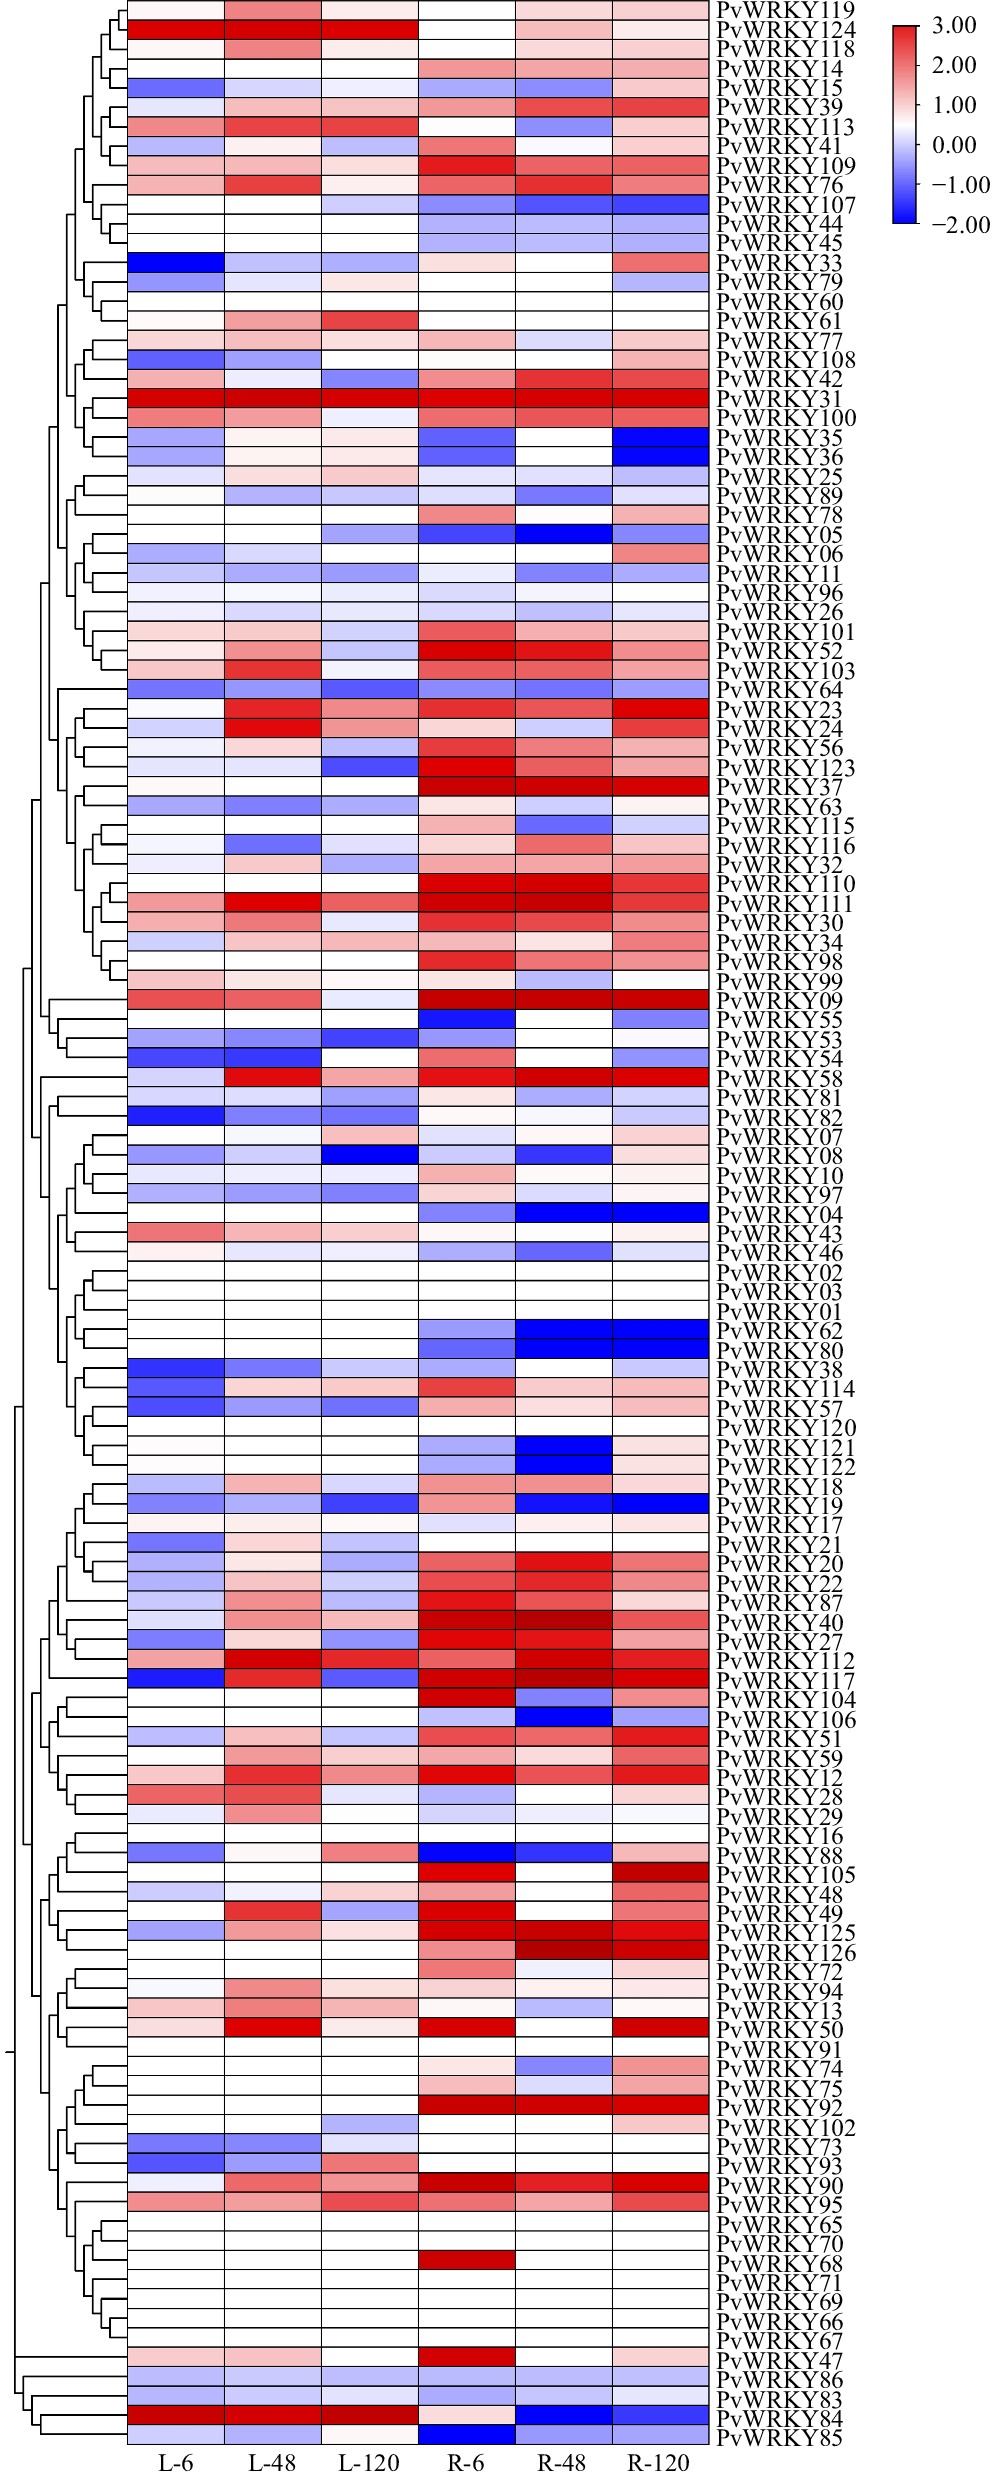
Figure 6.
Heatmap of PvWRKY gene expression under 0.2 mol/L NaCl salt stress. The heatmap illustrates the expression levels of PvWRKY genes in leaves and roots. This heatmap displays the expression levels of PvWRKY genes in leaf (L) and root (R) tissues under salt stress at different time points. The time points, labeled as L-6, L-48, and L-120 for leaves, and R-6, R-48, and R-120 for roots, represent gene expression at 6, 48, and 120 h post-salt treatment, respectively. Red shading indicates high gene expression levels, while blue shading represents low gene expression levels. The heatmap was created using TBtools software, with the intensity of red and blue providing an indication of gene expression variation across the conditions.
-
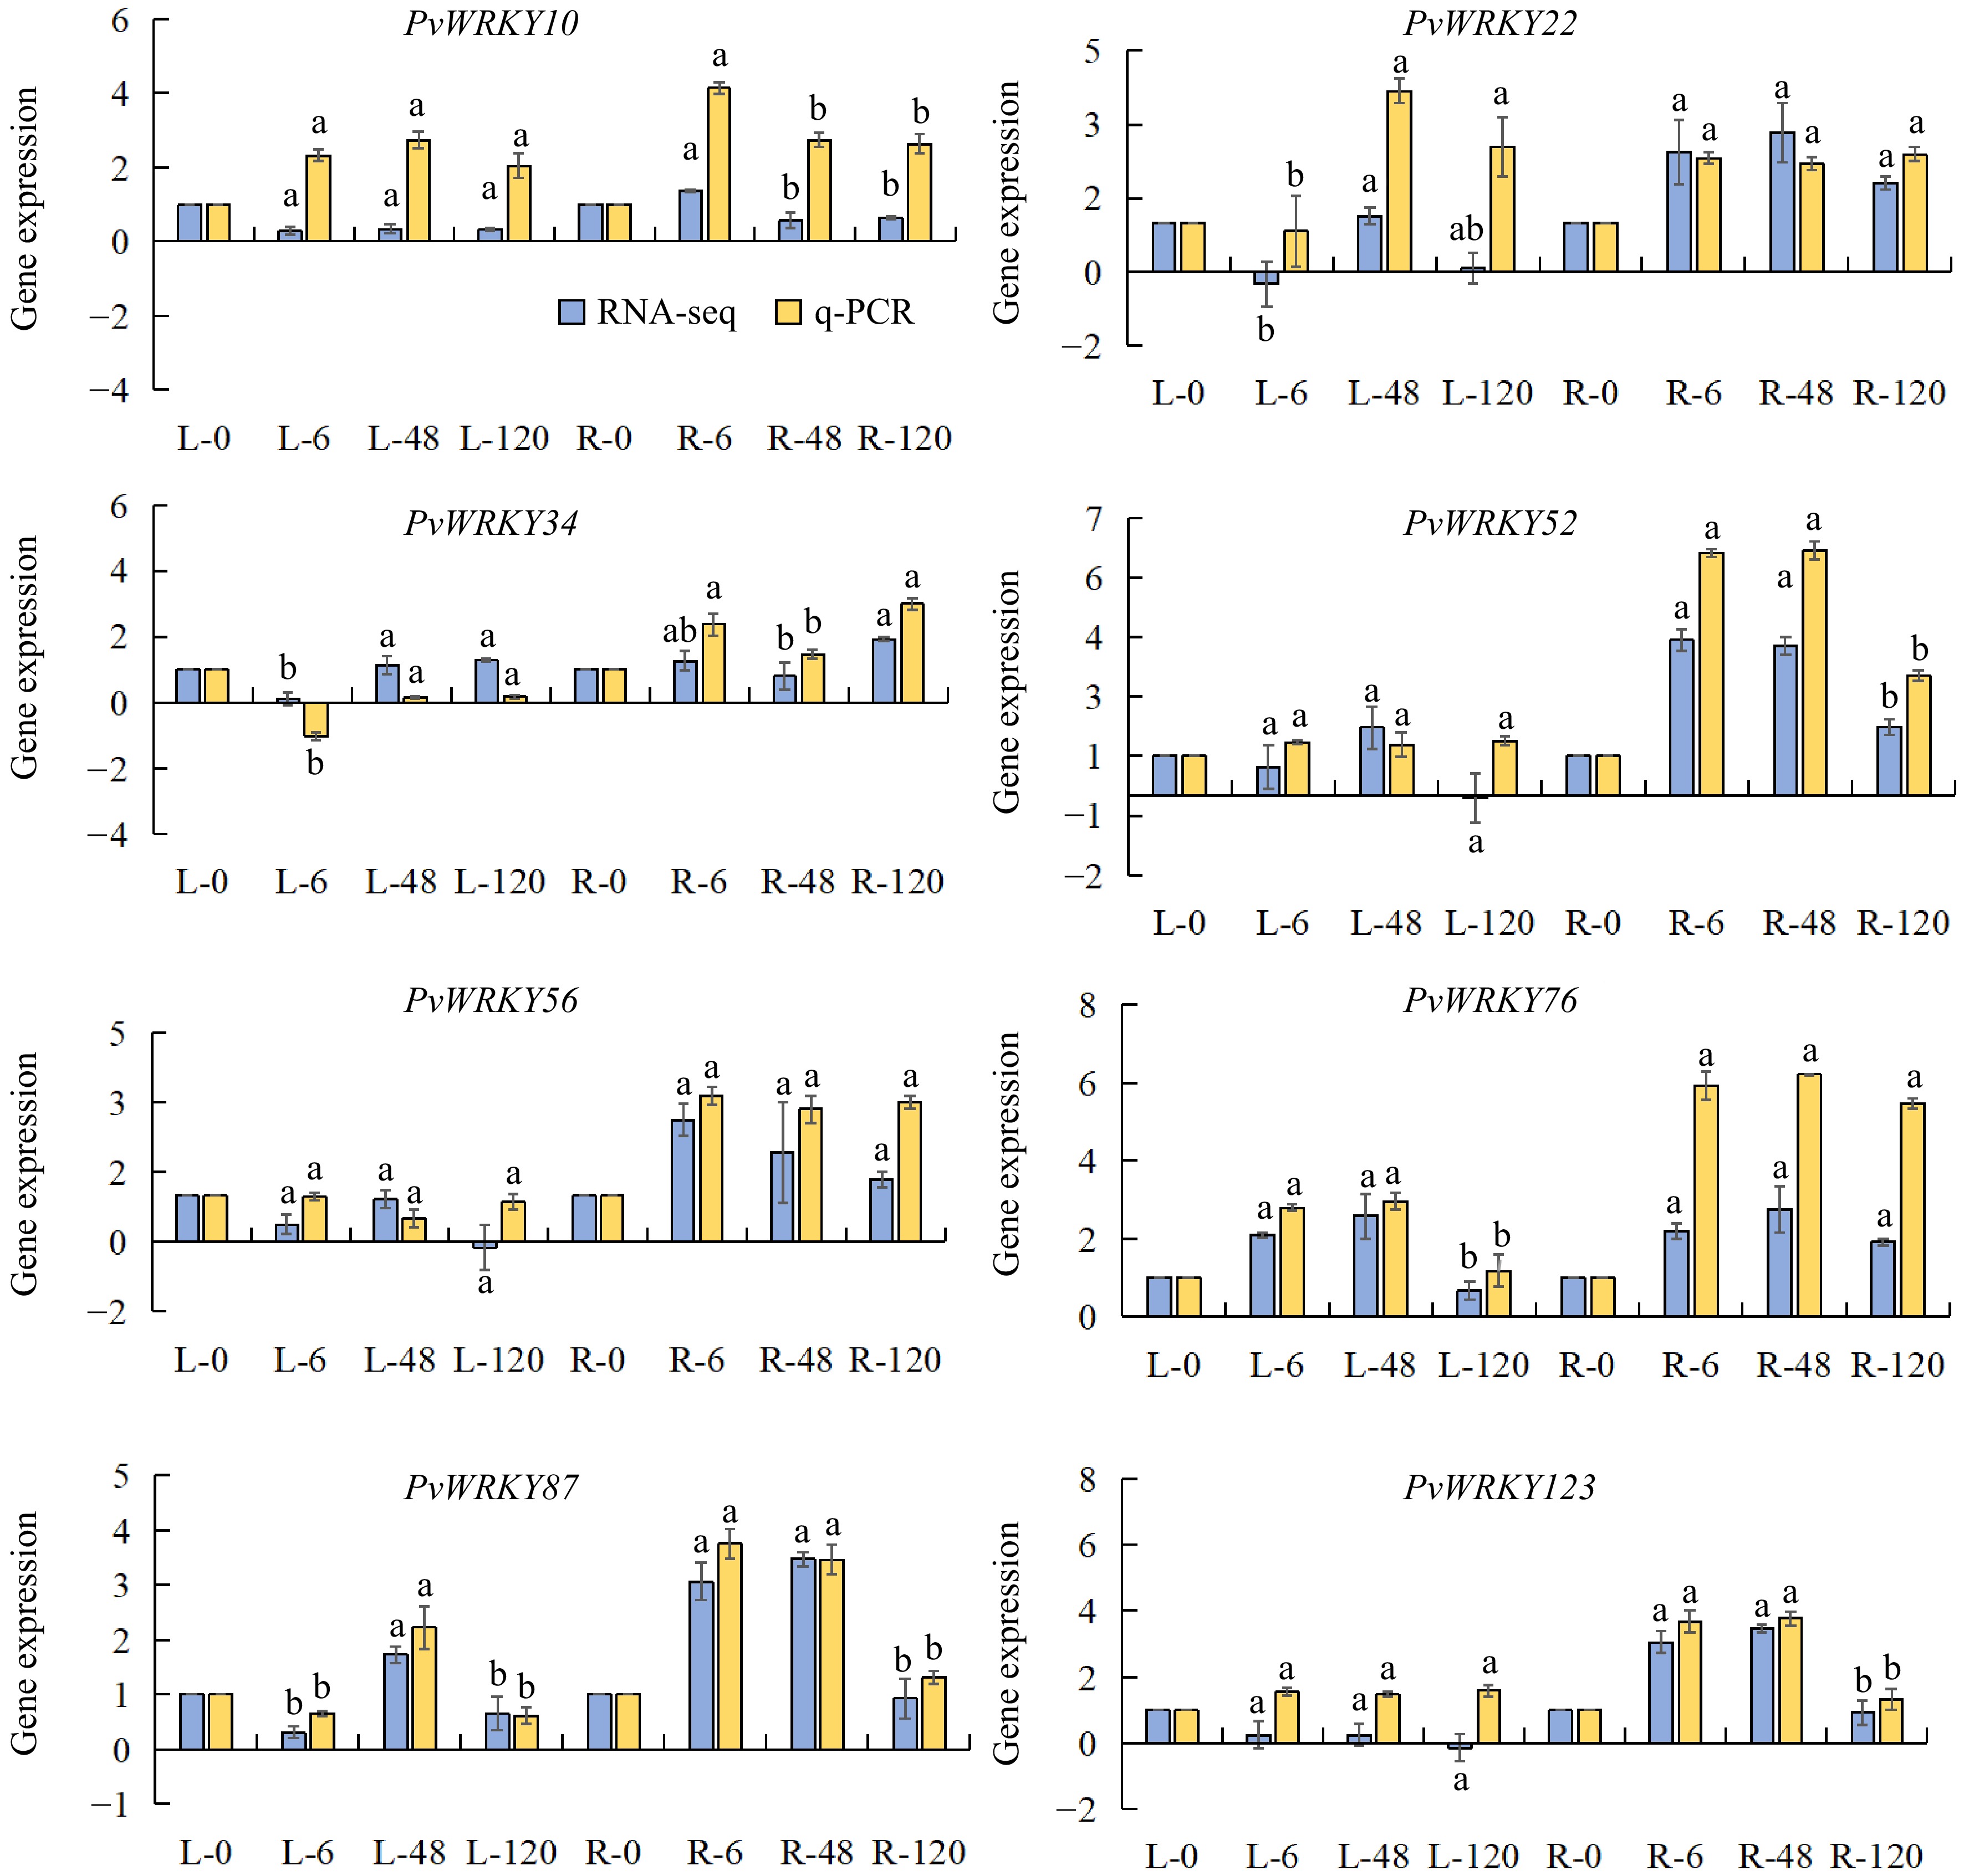
Figure 7.
Expression levels of PvWRKY genes in roots and leaves under salt stress. Error bars represent the standard error of three biological replicates, as calculated from qRT-PCR analysis. Letters indicate no statistically significant differences between means, as determined by ANOVA (p > 0.05). 'L' denotes leaf expression levels, and 'R' denotes root expression levels.
-
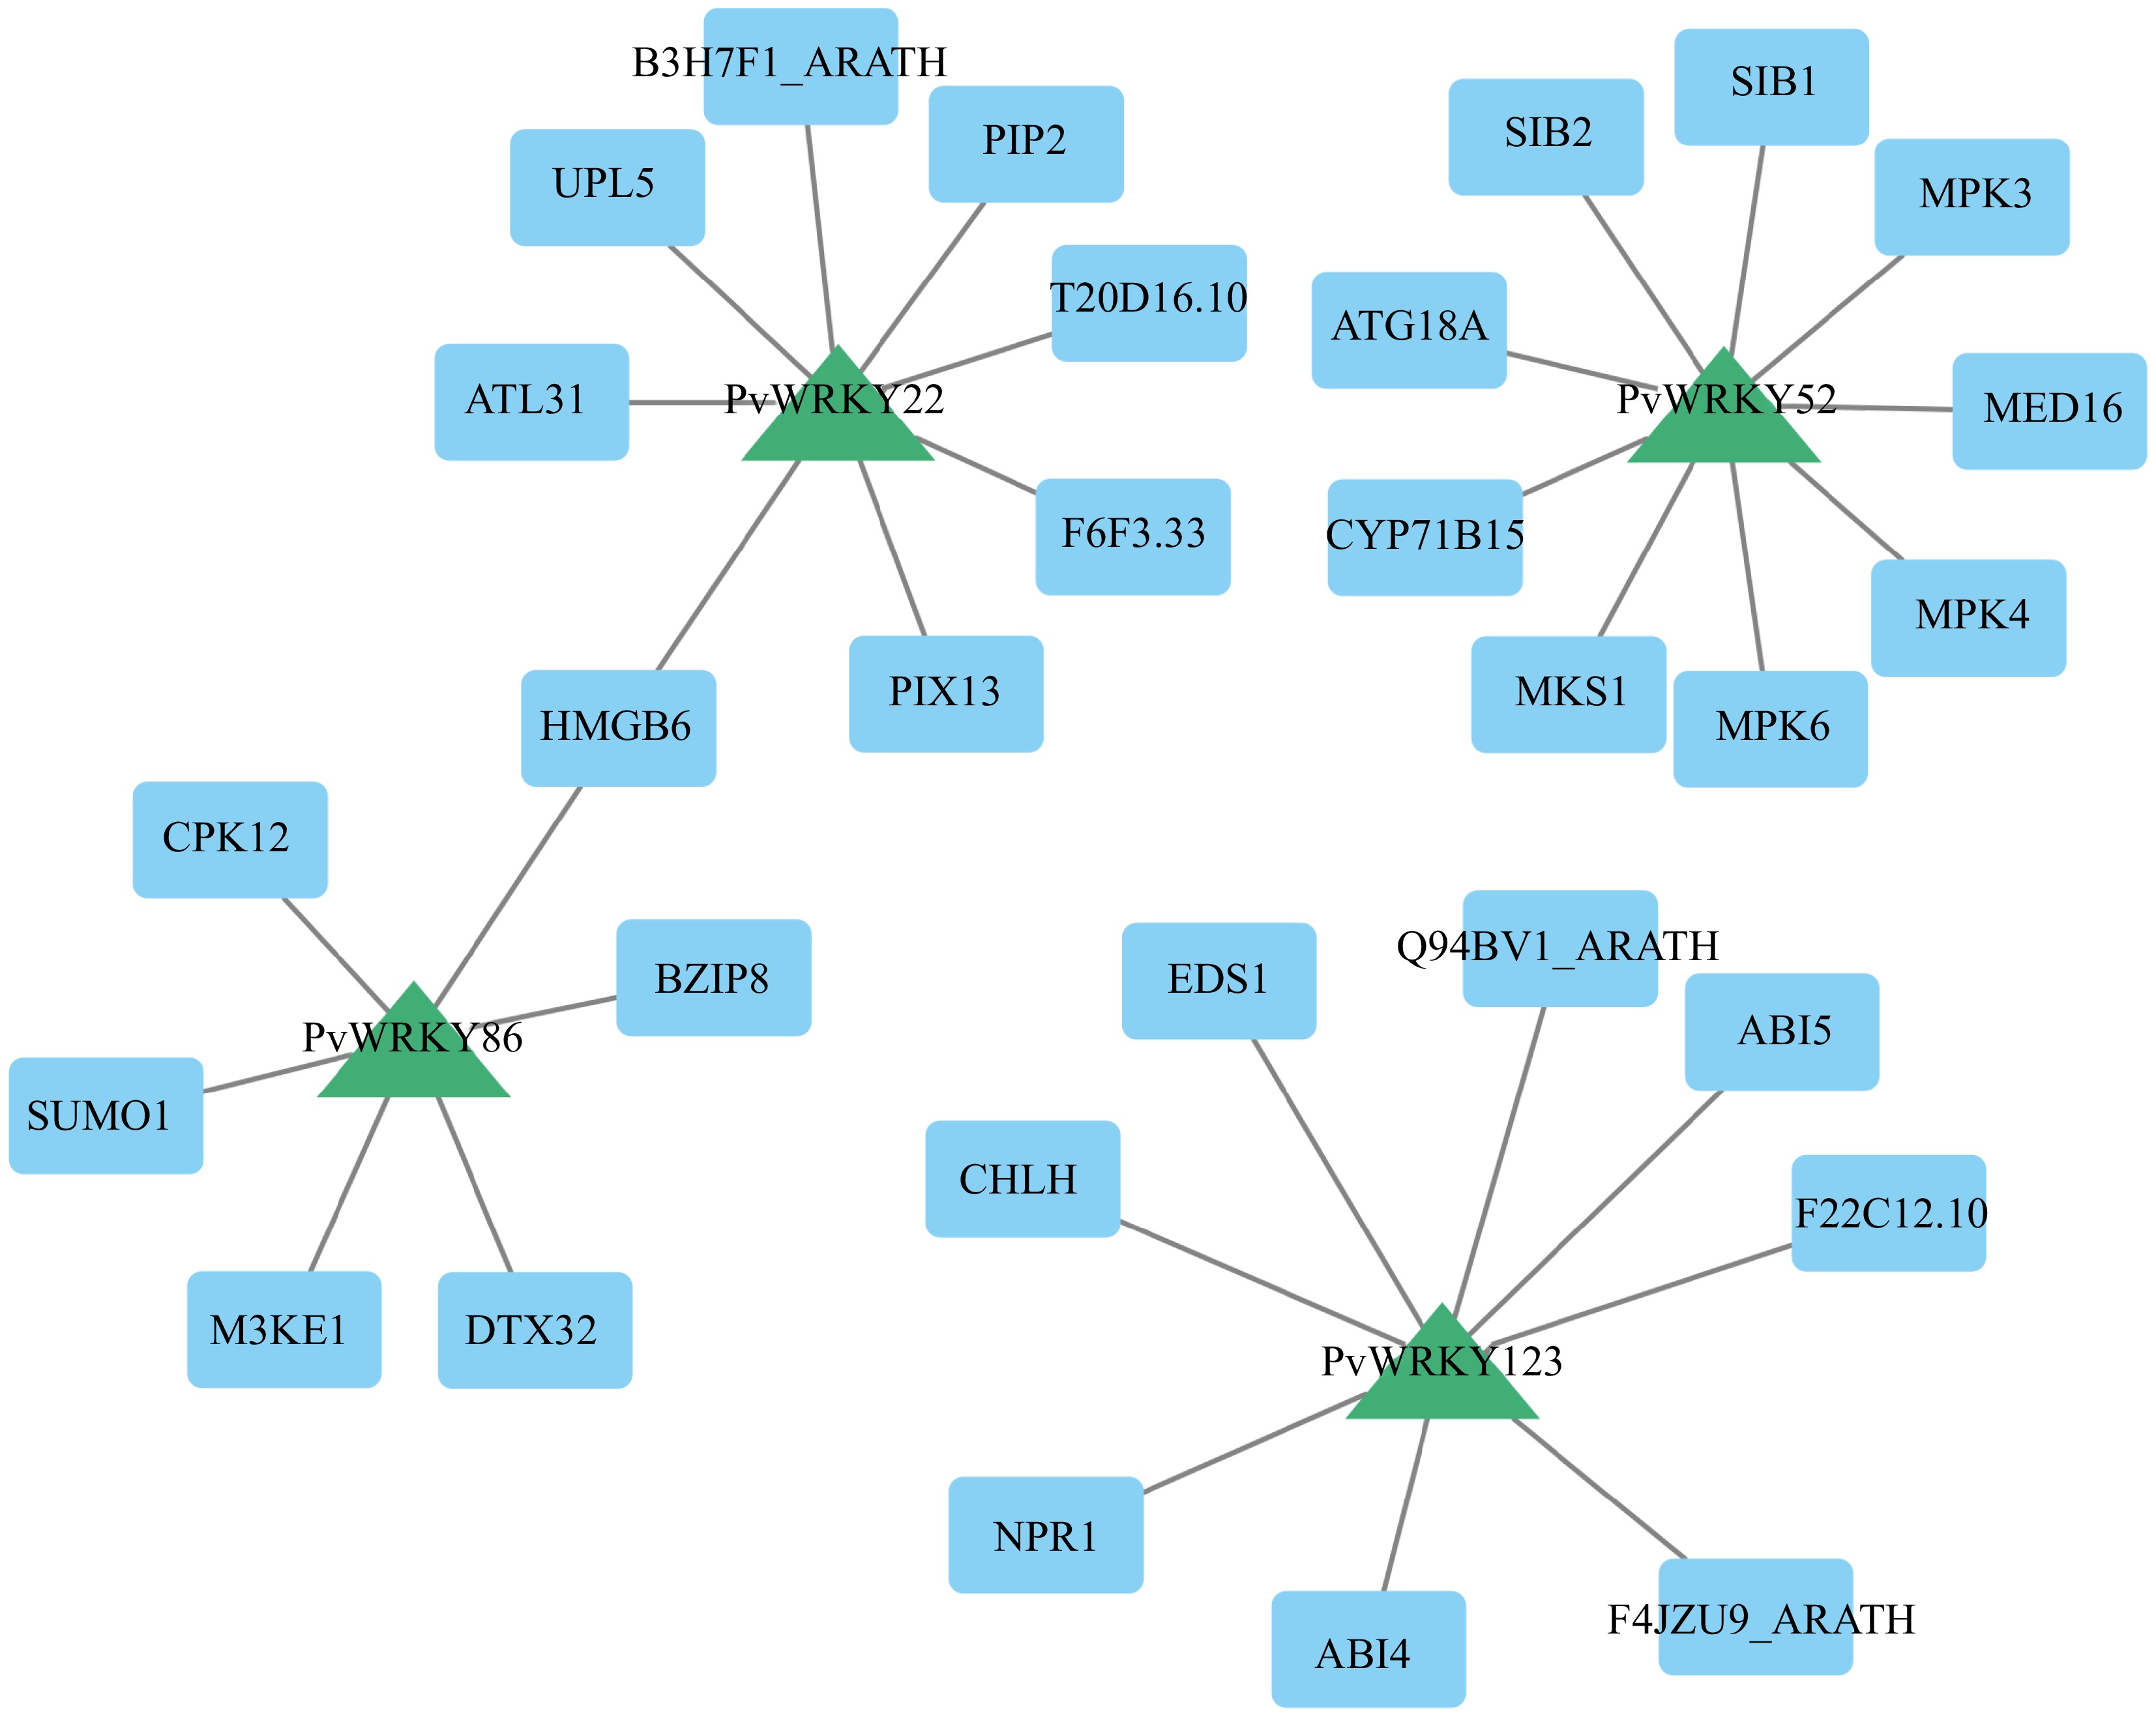
Figure 8.
The PPI network demonstrates the interactions among various PvWRKY proteins. The diagram was created using a medium confidence threshold of 0.4, with the intensity of node color corresponding to degree values; darker colors represent higher Degree values. Blue rectangles represent PvWRKY proteins, while red circles indicate other interacting proteins.
Figures
(8)
Tables
(0)