-
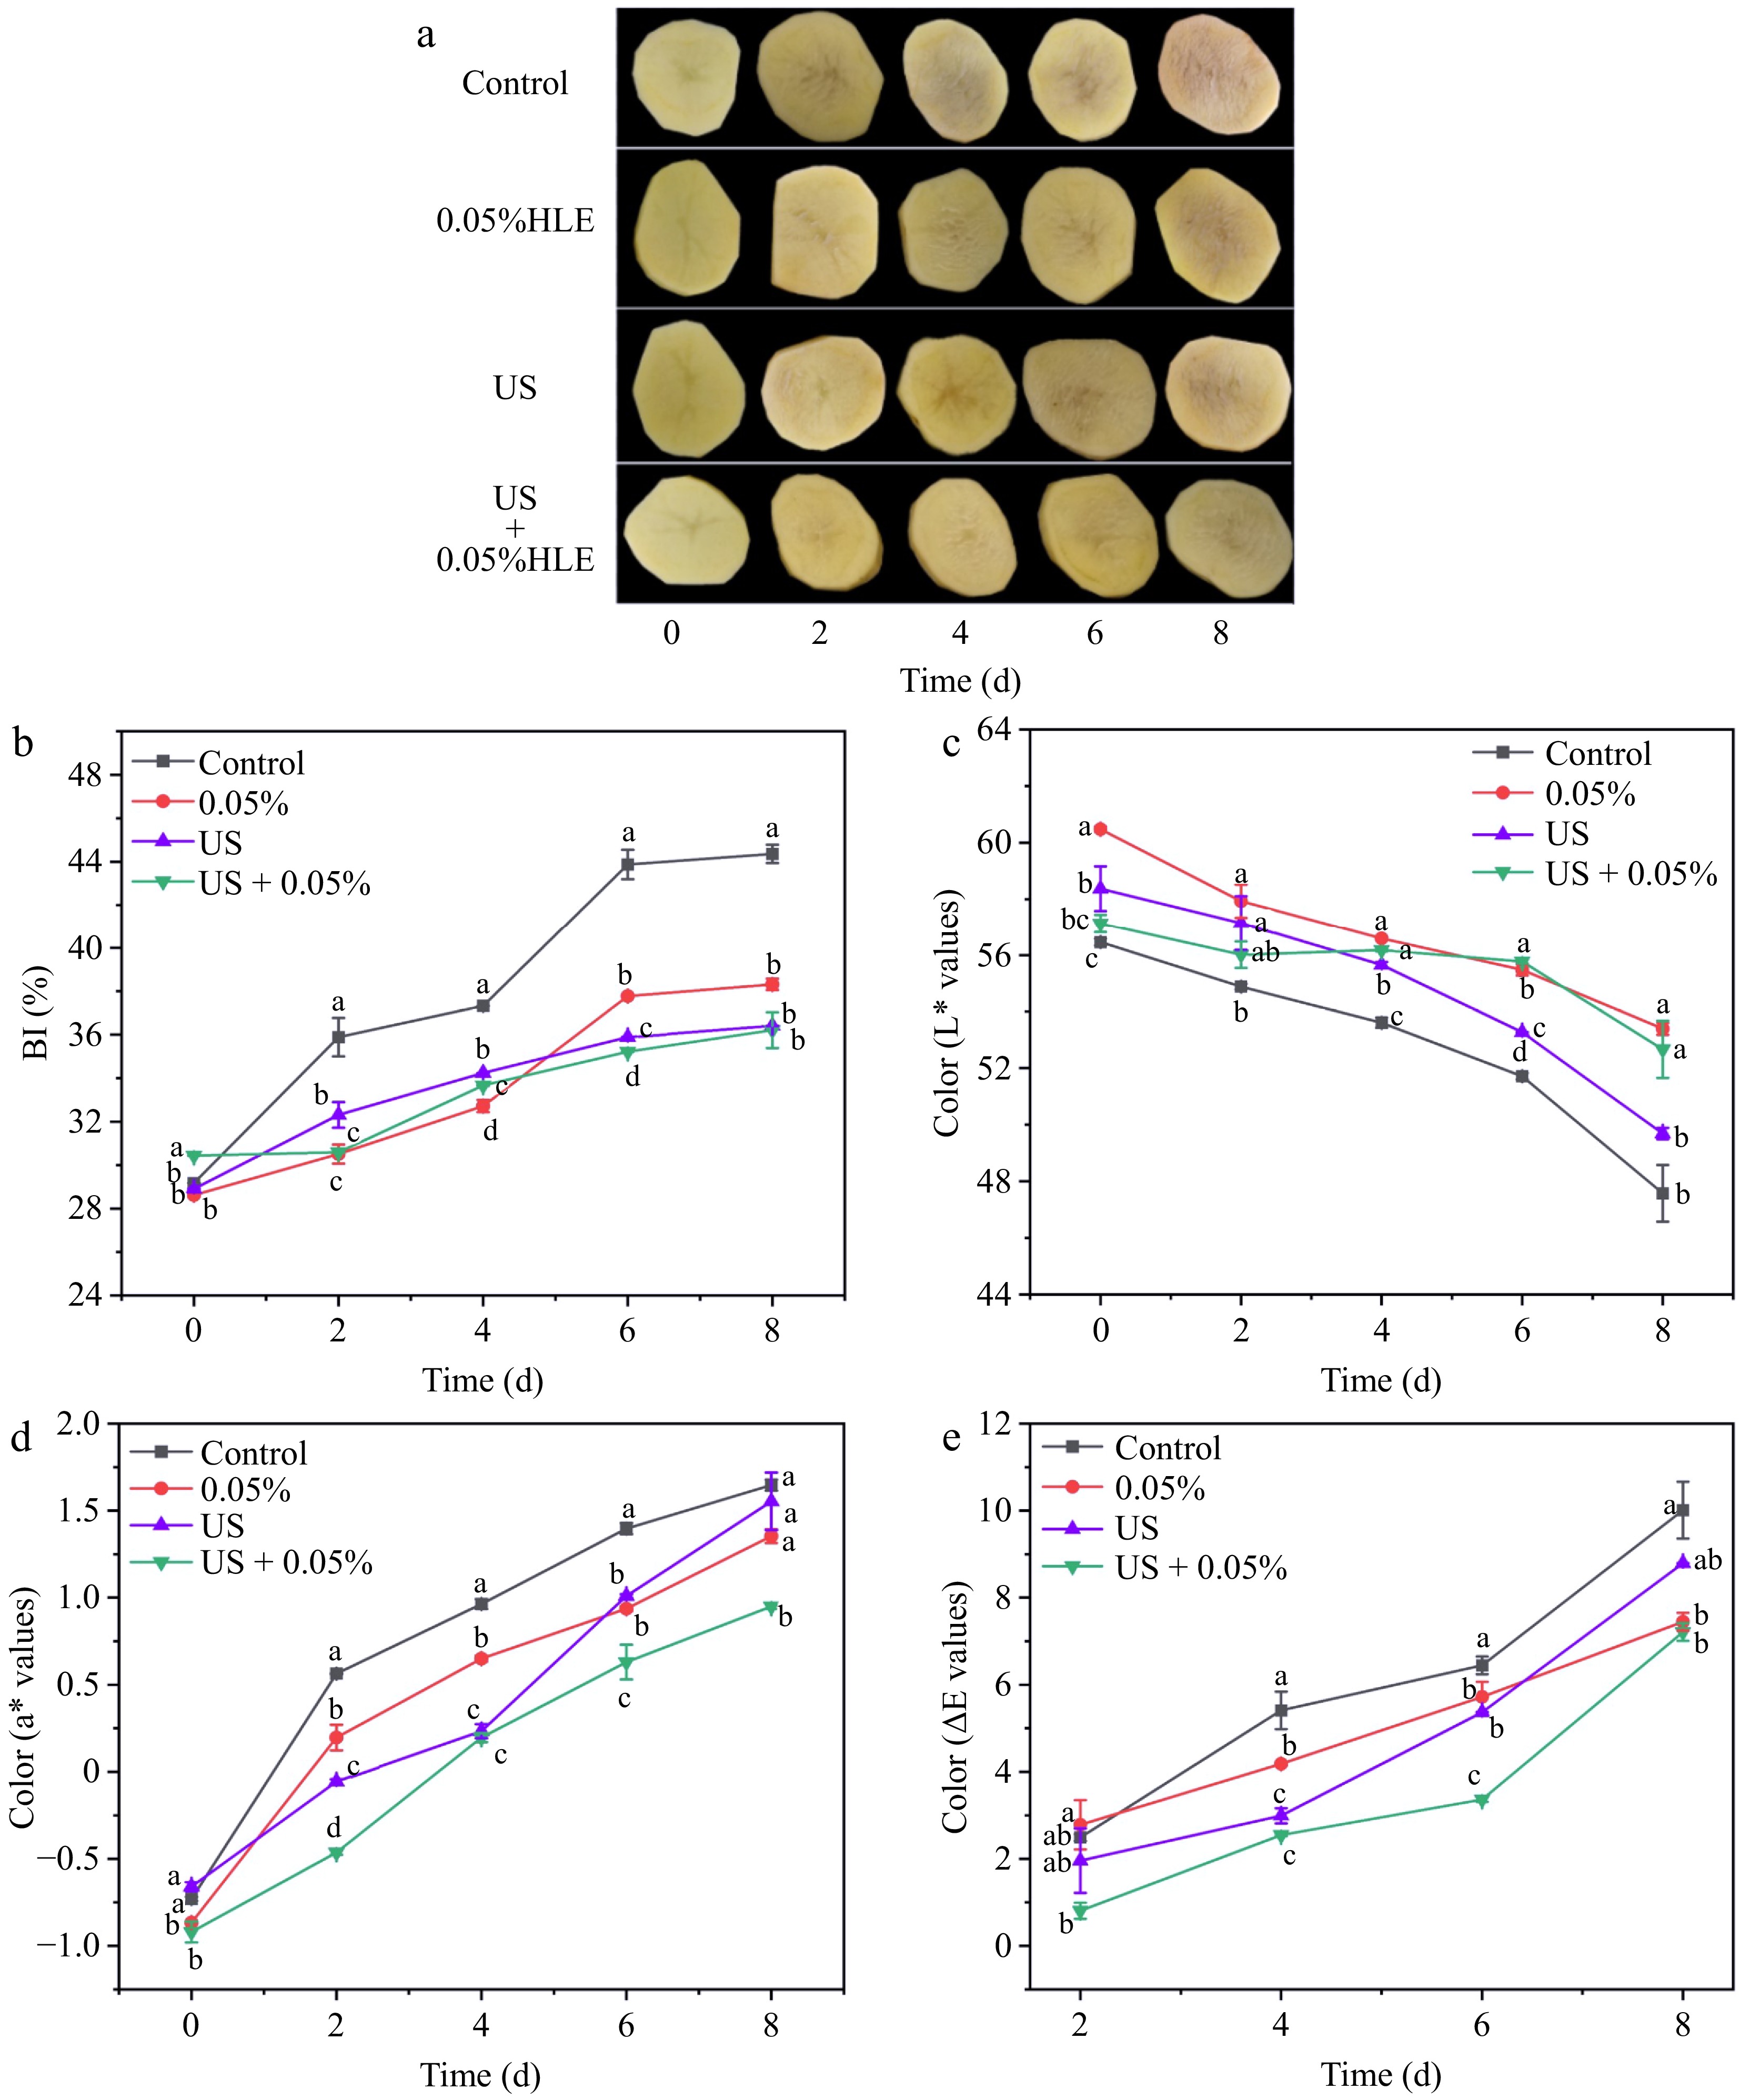
Figure 1.
(a) Effect of different treatments (Control: distilled water, HLE: hawthorn leaf extract, US: ultrasound, US + 0.05% HLE: the combination of ultrasound and hawthorn leaf) on appearance, (b) BI value, (c) L* value, (d) a* value, and (e) ΔE* of fresh-cut potato during storage at 4 °C for 8 d. Data are express as the mean ± standard error (n = 3). Different letters indicate significant differences between groups (p < 0.05).
-
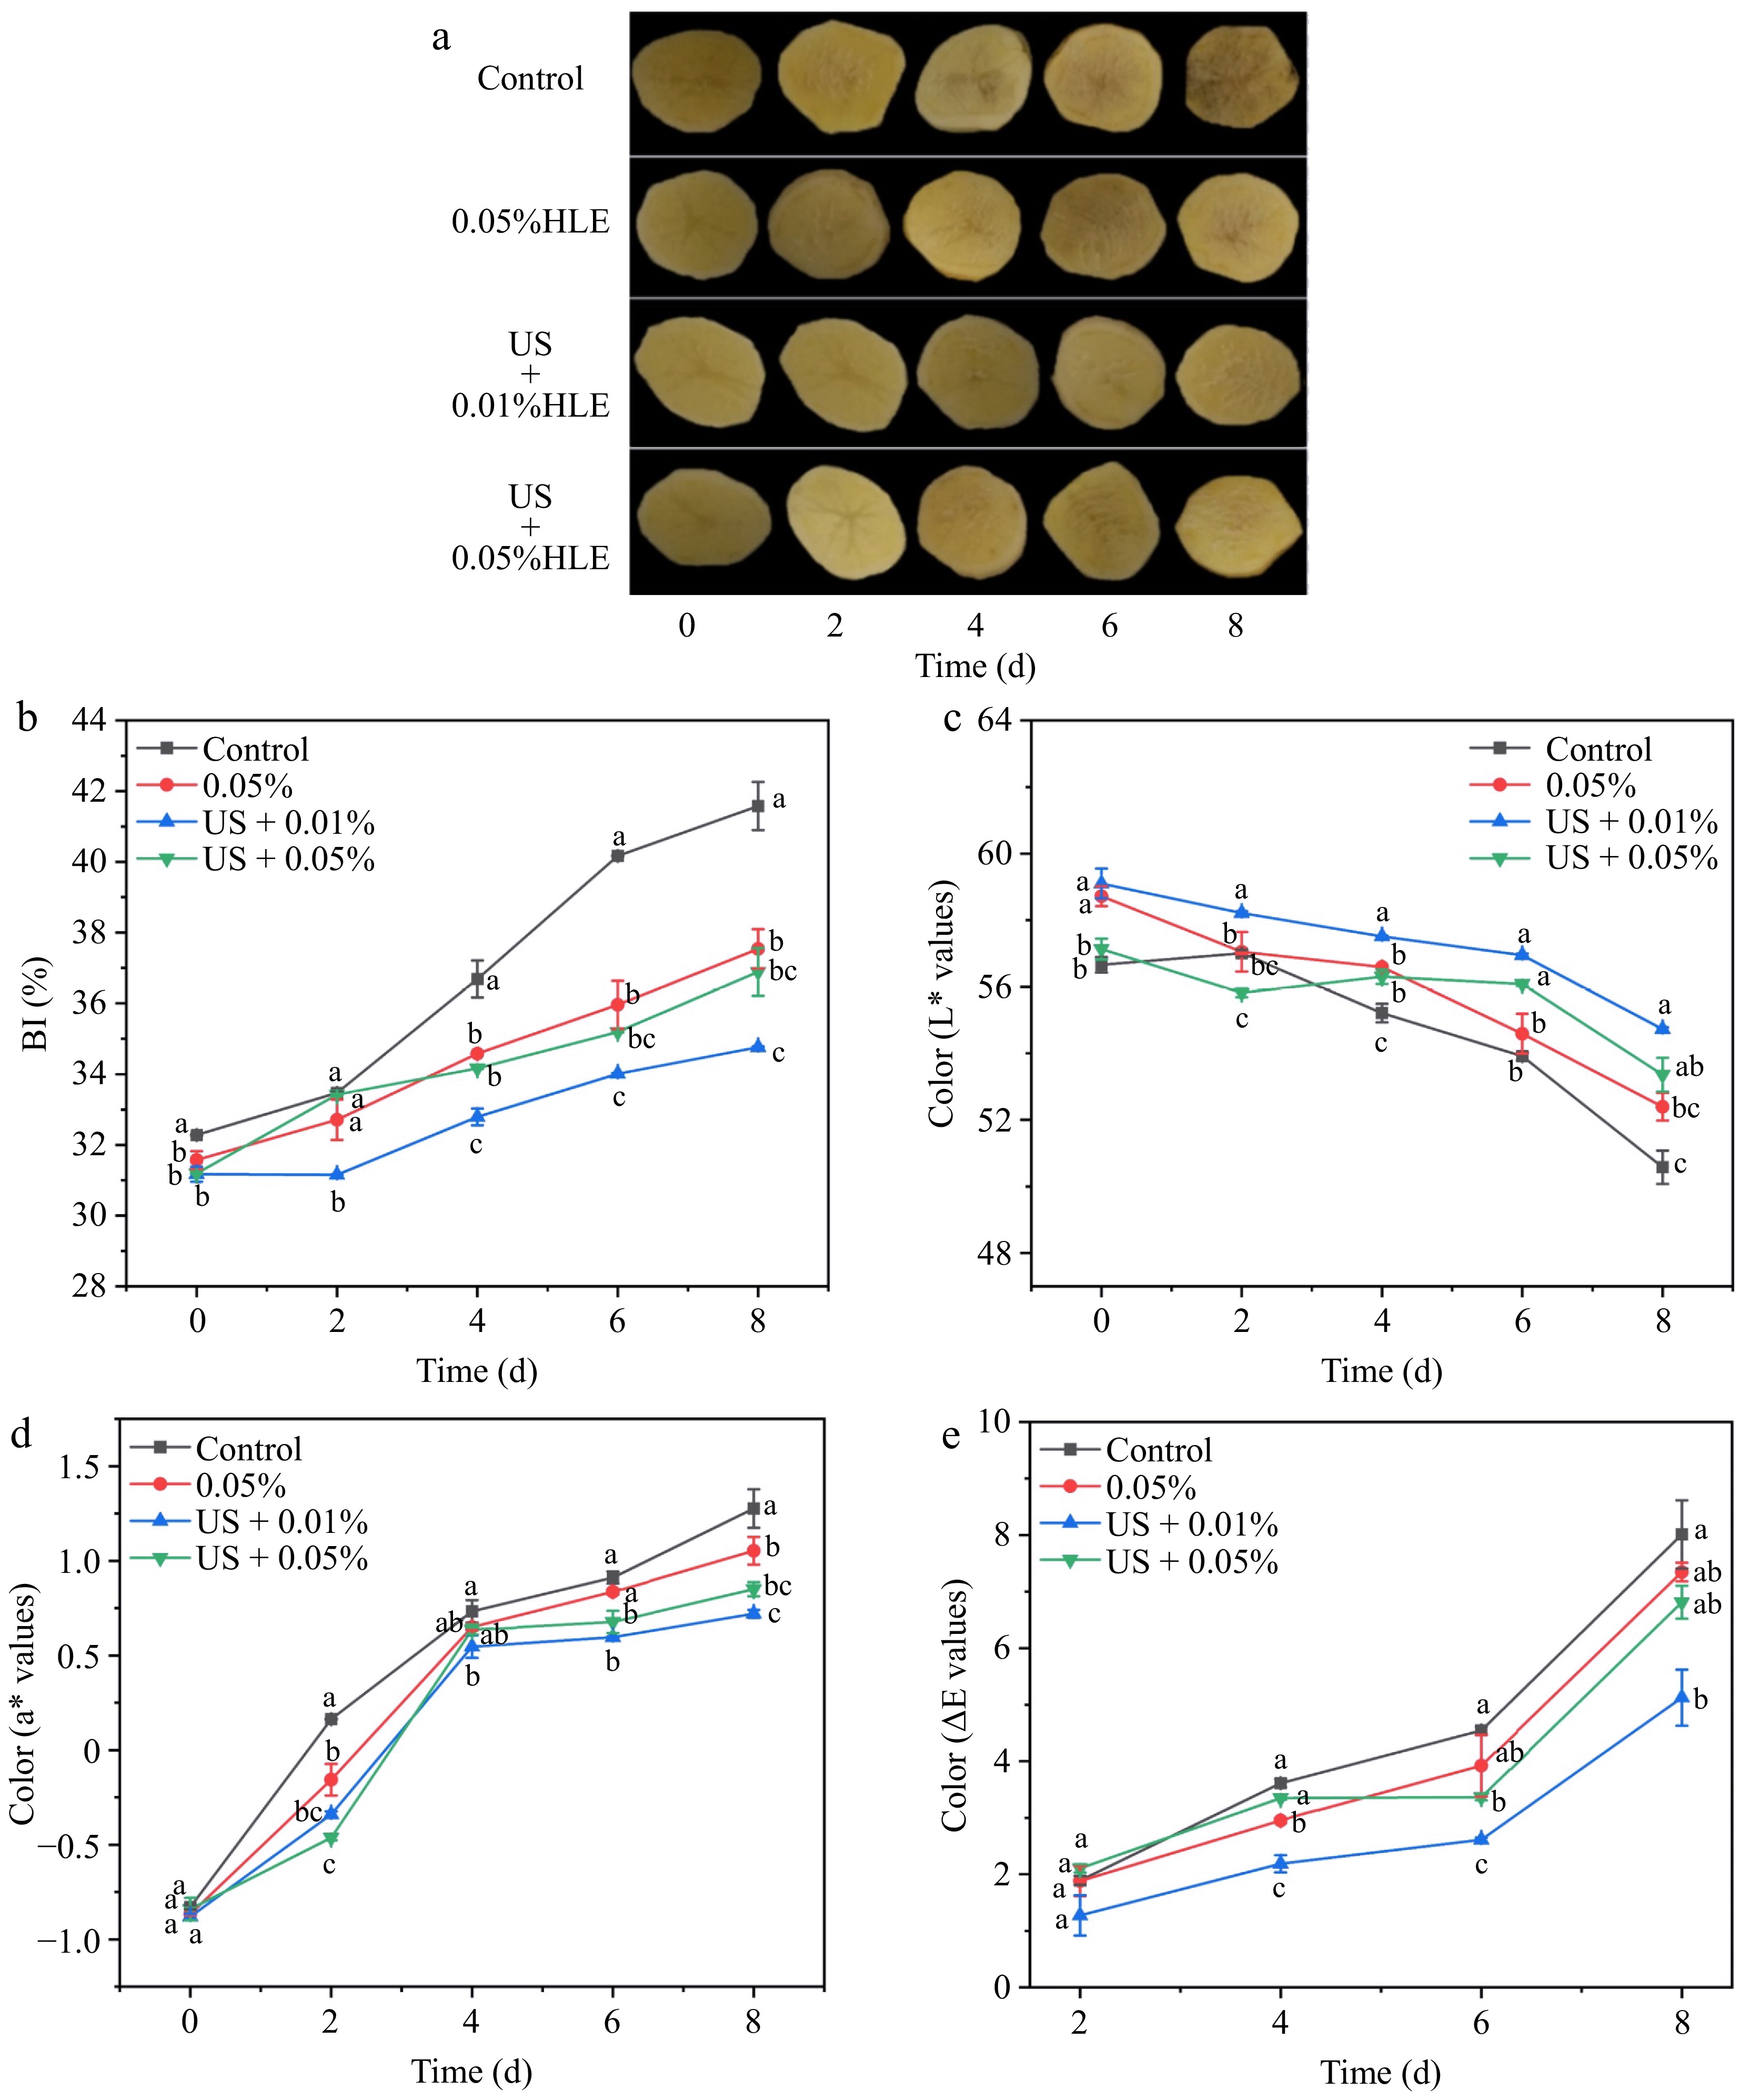
Figure 2.
(a) Effect of different treatments (Control: distilled water, 0.05% HLE: only hawthorn leaf extract (0.05%) and ultrasound coupling two concentrations of hawthorn leaf extract (0.01%, 0.05%)) on appearance, (b) BI value, (c) L* value, (d) a* value, and (e) ΔE* of fresh-cut potato during storage at 4 °C for 8 d. Data are expressed as the mean ± standard error (n = 3). Different letters indicate significant differences between groups (p < 0.05).
-
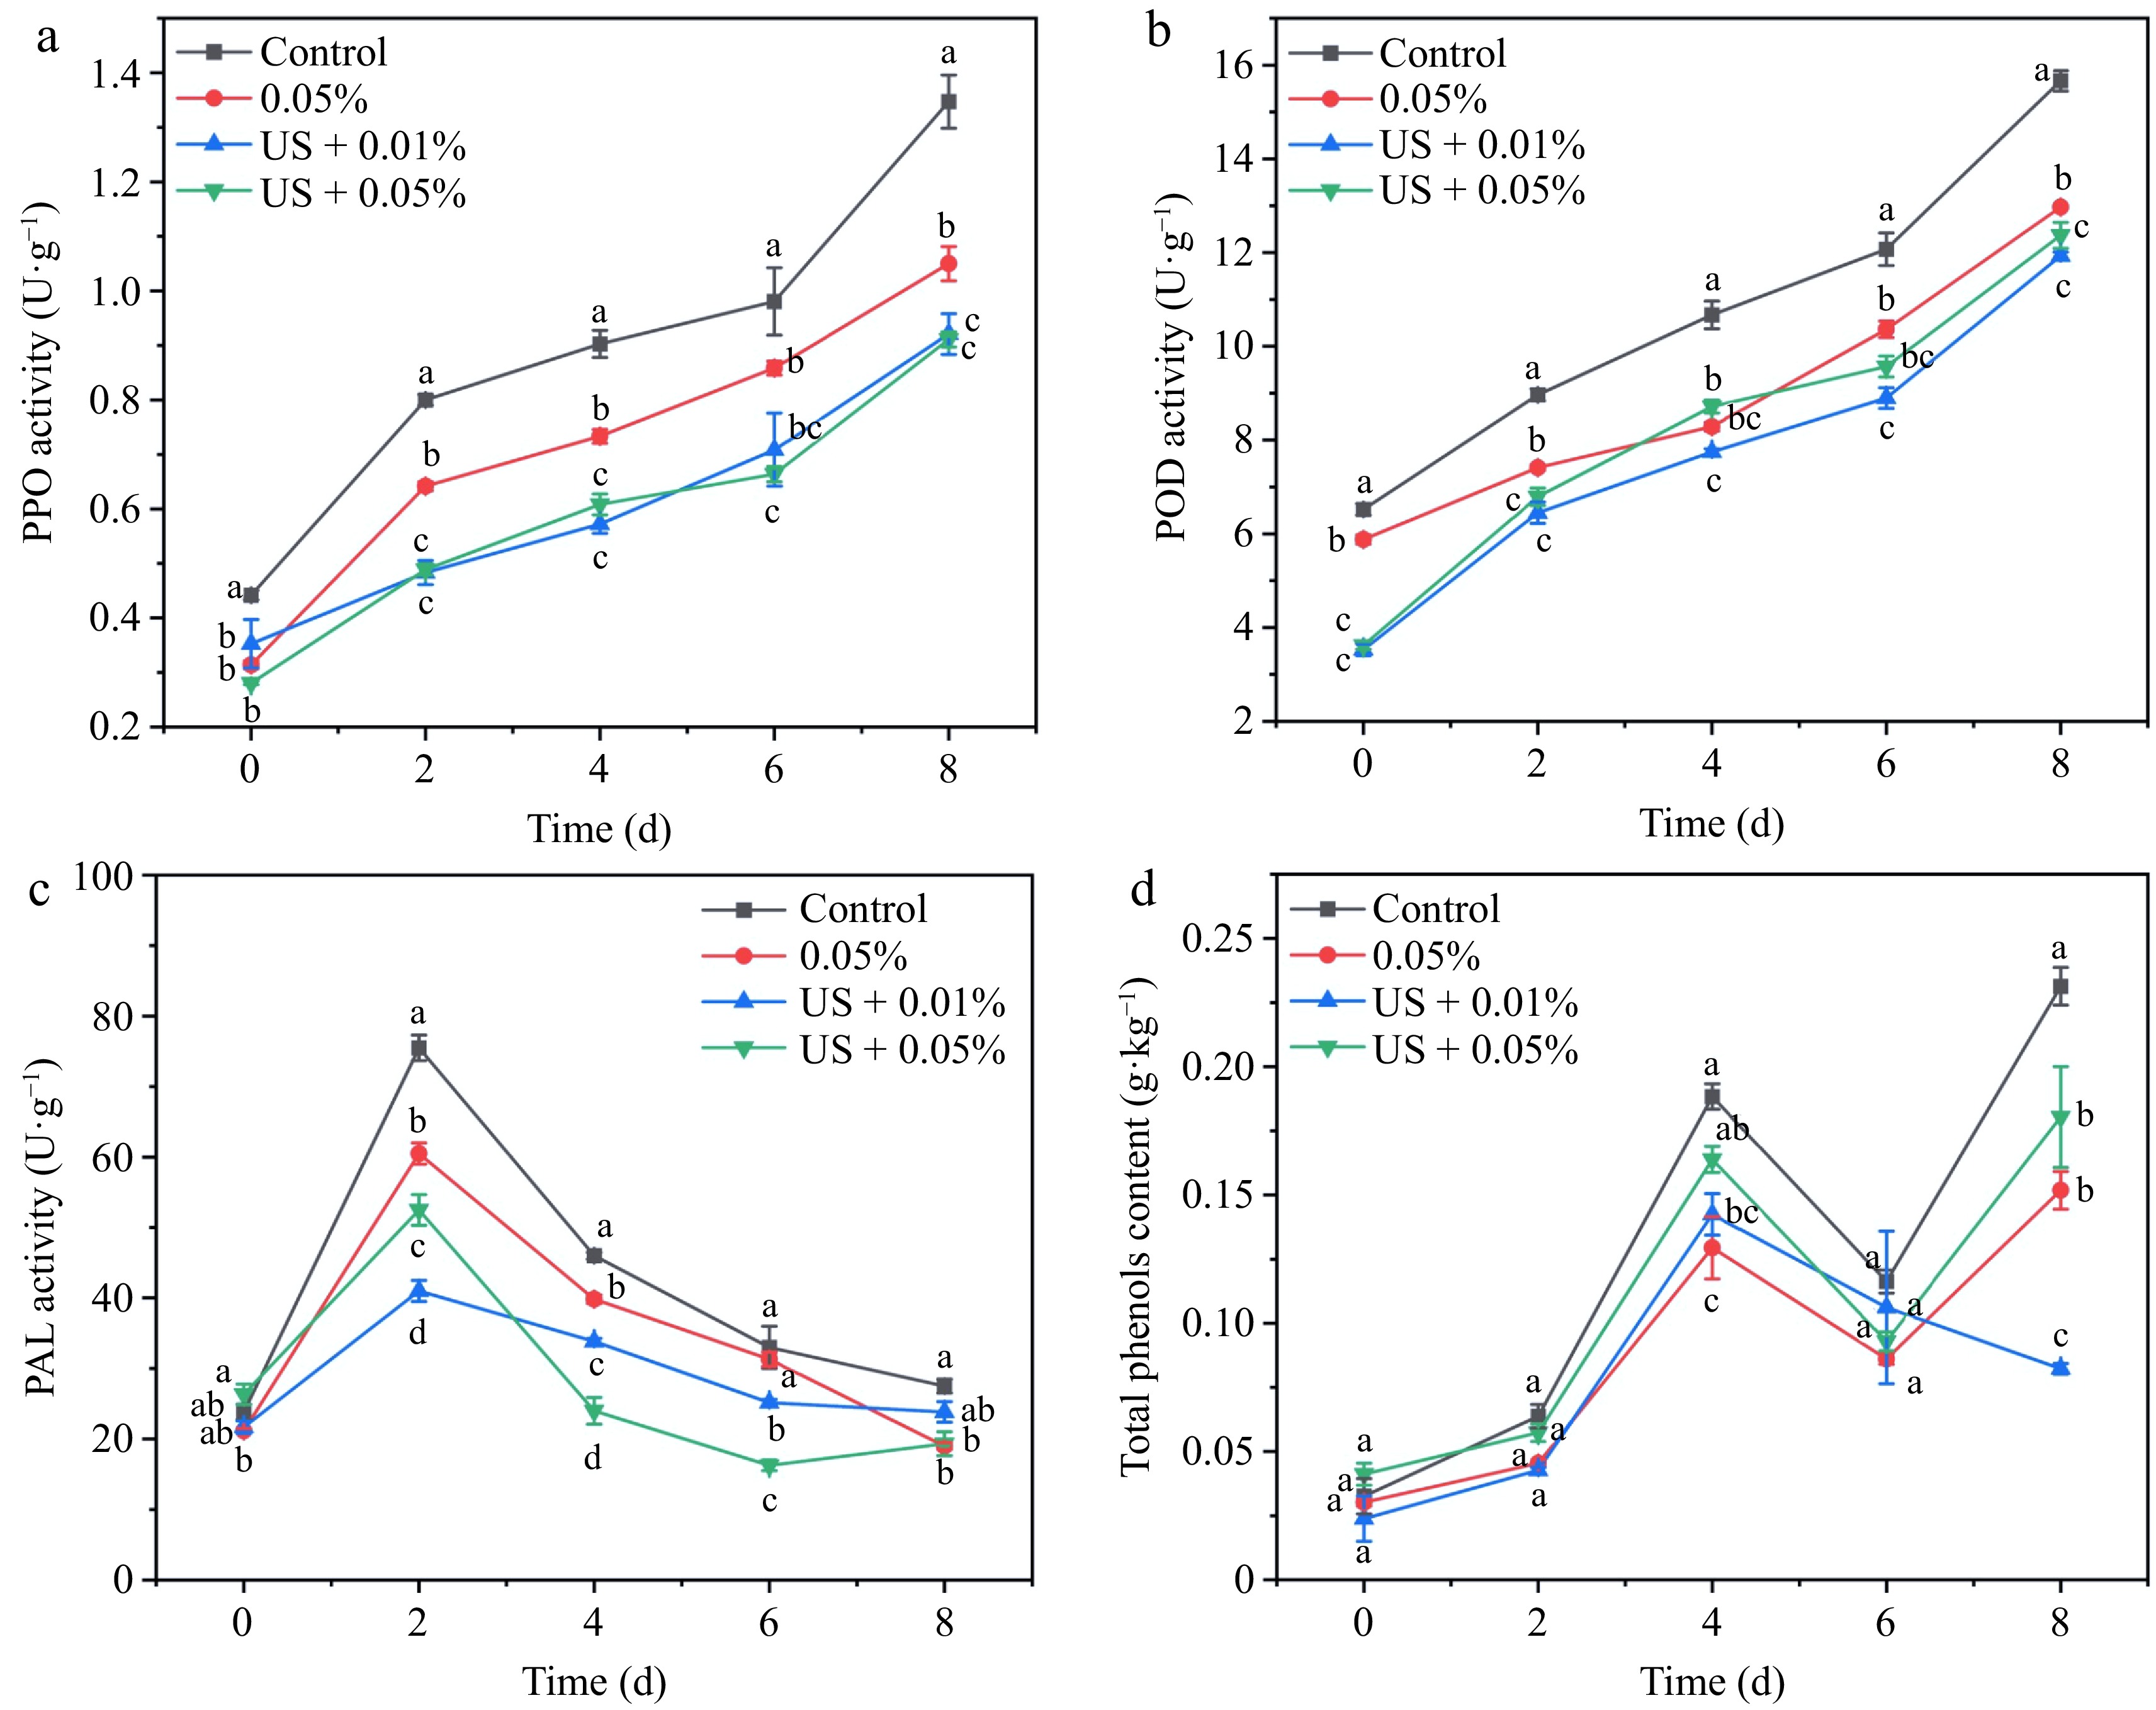
Figure 3.
Effect of different treatments (Control: distilled water, 0.05% HLE: only hawthorn leaf extract (0.05%) and ultrasound coupling two concentrations of hawthorn leaf extract (0.01%, 0.05%)) on activities of (a) PPO, (b) POD, (c) PAL, and (d) total phenol content of fresh-cut potato during storage at 4 °C for 8 d. Data are expressed as the mean ± standard error (n = 3). Different letters indicate significant differences between groups (p < 0.05).
-
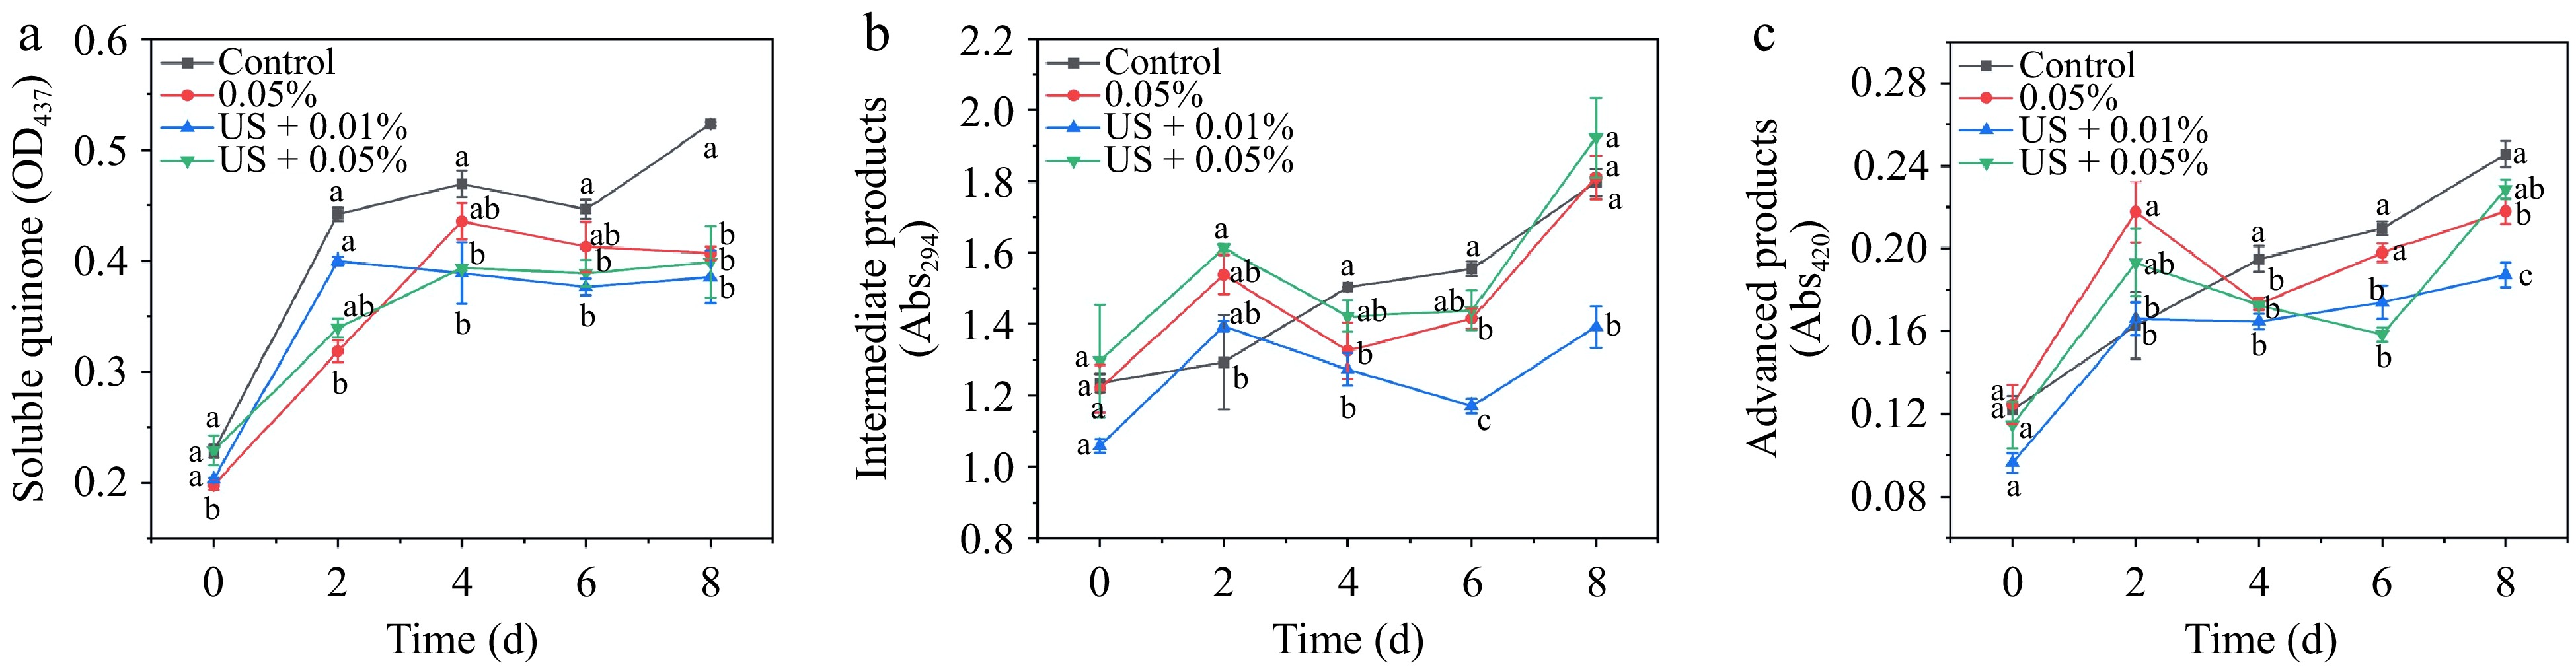
Figure 4.
Effect of different treatments (Control: distilled water, 0.05% HLE: only hawthorn leaf extract (0.05%) and ultrasound coupling two concentrations of hawthorn leaf extract (0.01%, 0.05%)) on (a) soluble quinone, (b) intermediate products, and (c) advanced products of fresh-cut potato during storage at 4 °C for 8 d. Data are expressed as the mean ± standard error (n = 3). Different letters indicate significant differences between groups (p < 0.05).
-
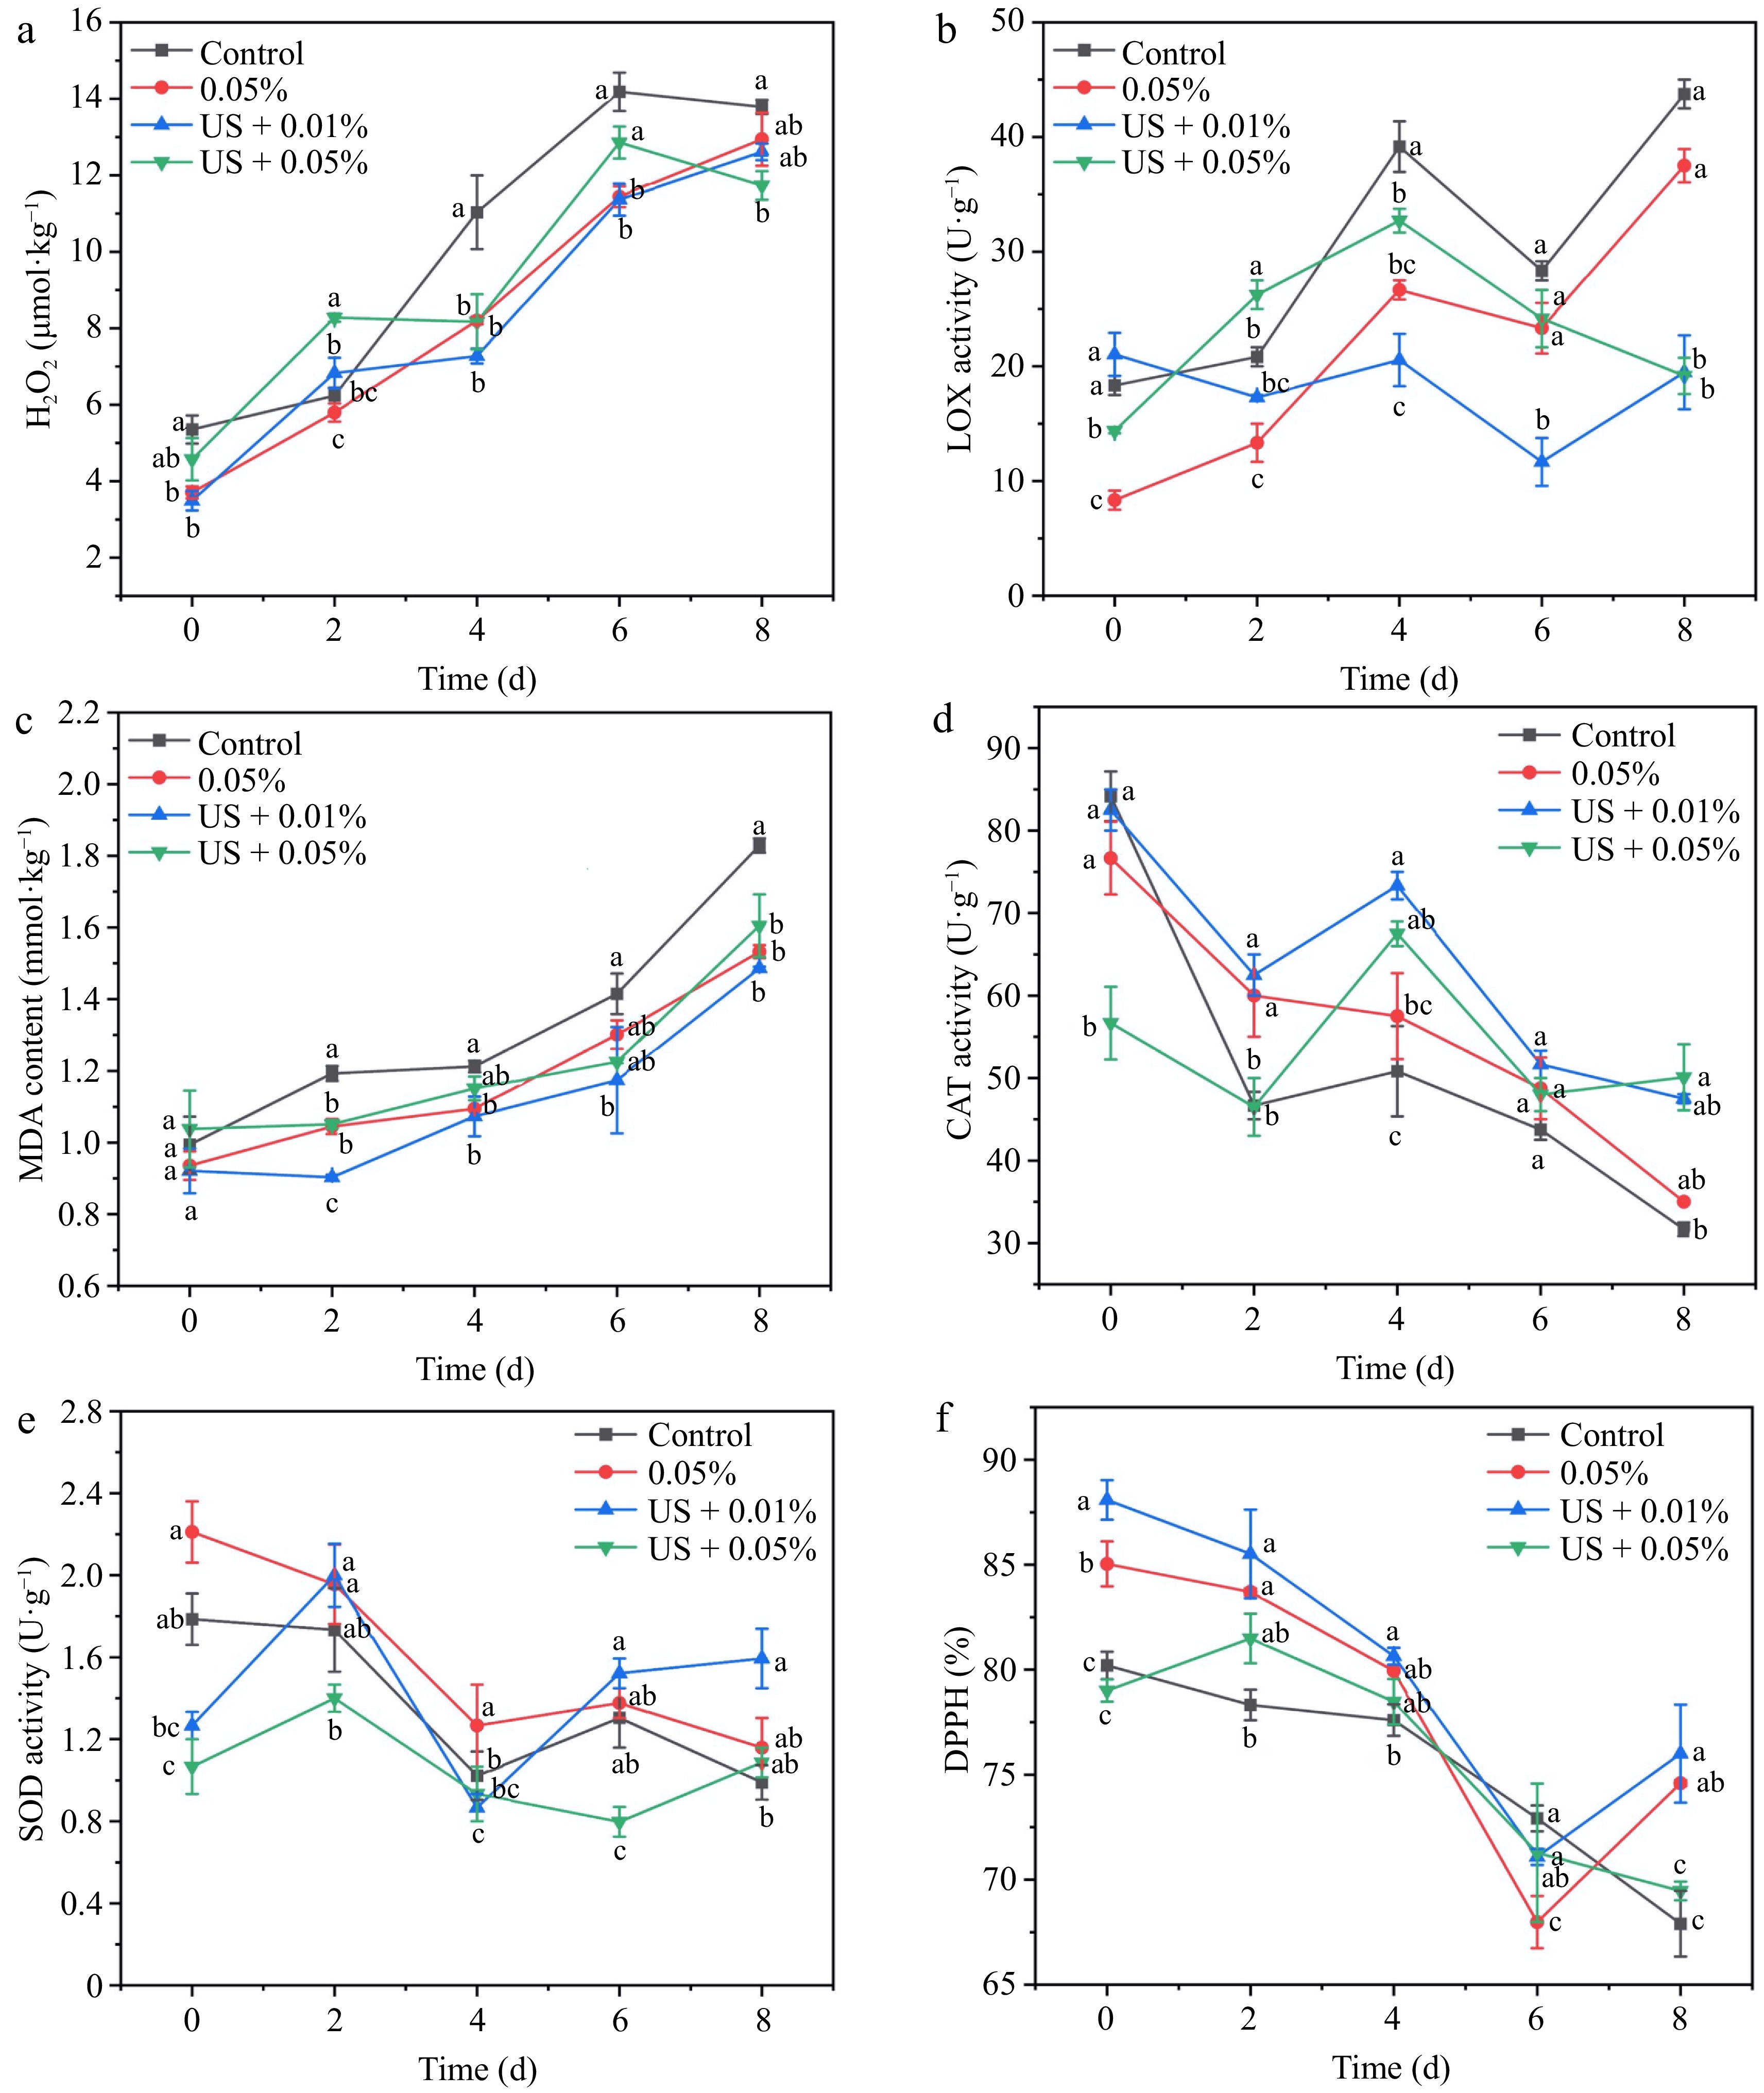
Figure 5.
Effect of different treatments (Control: distilled water, 0.05% HLE: only hawthorn leaf extract (0.05%) and ultrasound coupling two concentrations of hawthorn leaf extract (0.01%, 0.05%)) on activities of (a) H2O2 content, (b) LOX activity, (c) MDA content, (d) CAT activity, (e) SOD activity, and (f) DPPH of fresh-cut potato during storage at 4 °C for 8 d. Data are expressed as the mean ± standard error (n = 3). Different letters indicate significant differences between groups (p < 0.05).
-
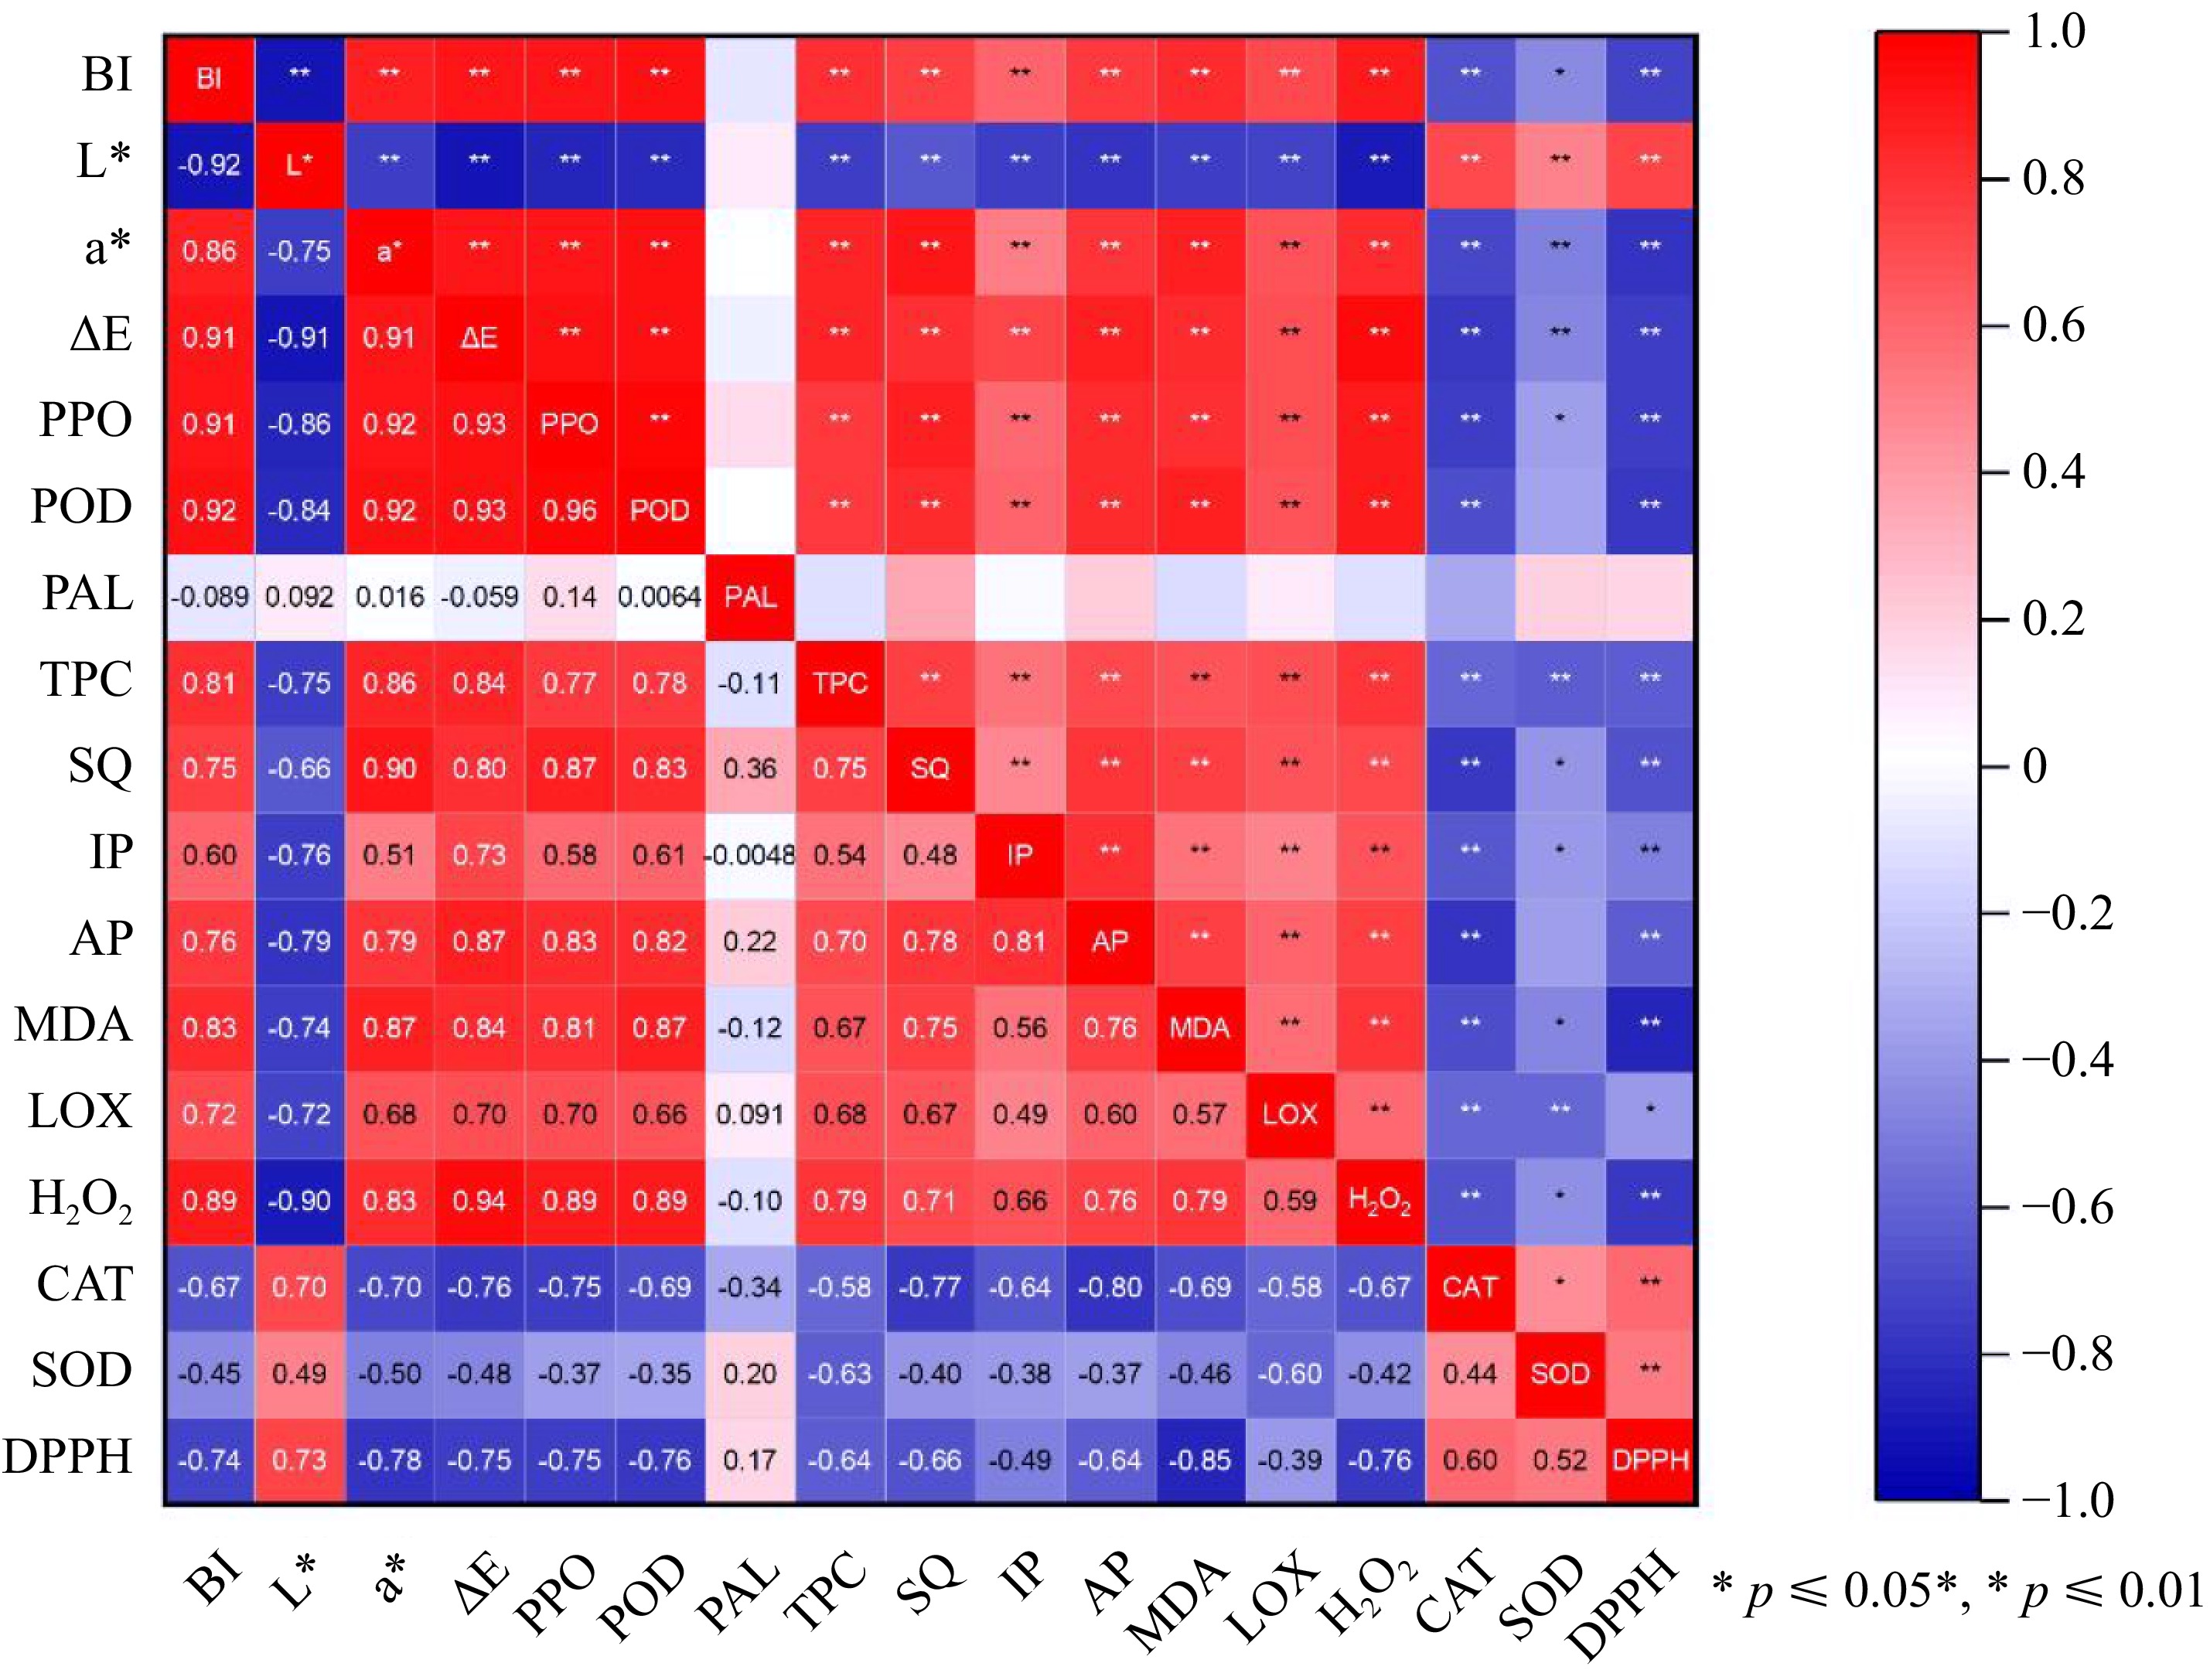
Figure 6.
Pearson correlation matrix of browning index (BI), color (L*, a*, ΔE*), enzymes (PAL, PPO, POD), total phenol content (TPC), browning products (soluble quinone (SQ), intermediate product (IP), advanced product (AP)), related membrane peroxides (LOX, MDA, H2O2), antioxidant enzymes (CAT, SOD), and antioxidant activity (DPPH). Different asterisks indicate different levels of significance (* p ≤ 0.05; ** p ≤ 0.01).
-
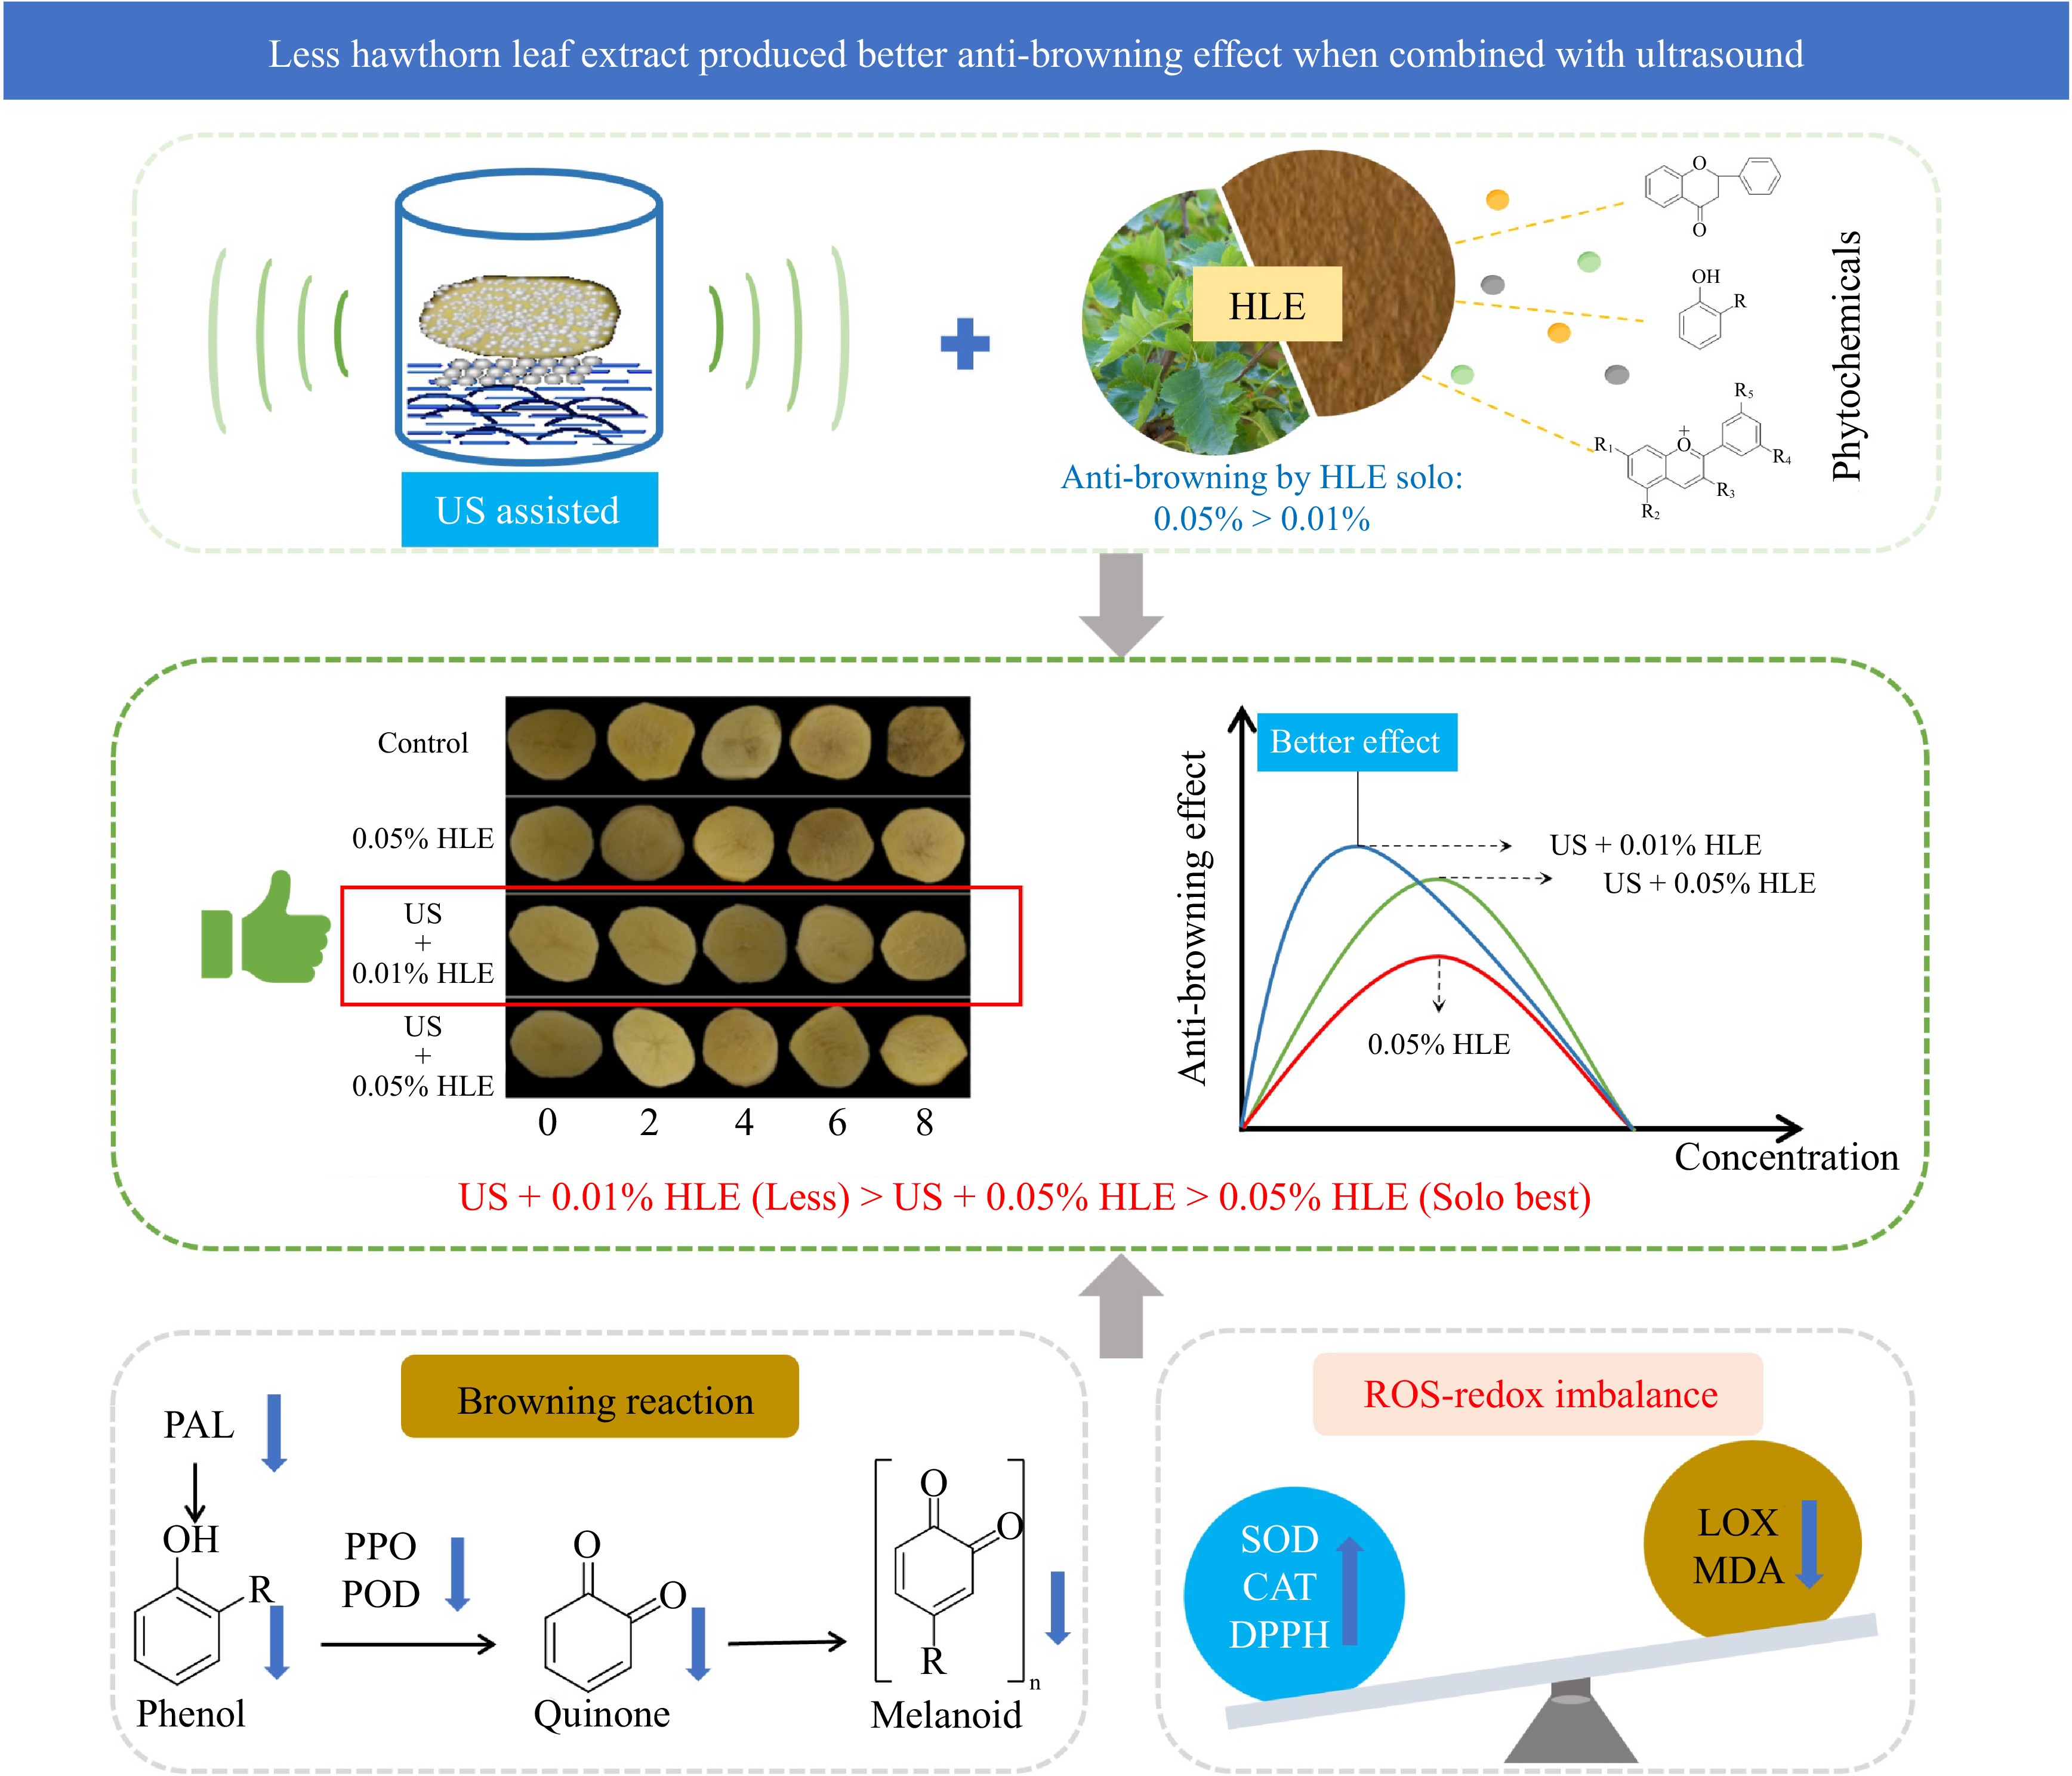
Figure 7.
The possible mechanism whereby treatments of US coupled with hawthorn leaf extract as an effective combination technology alleviate the development of browning.
Figures
(7)
Tables
(0)