-
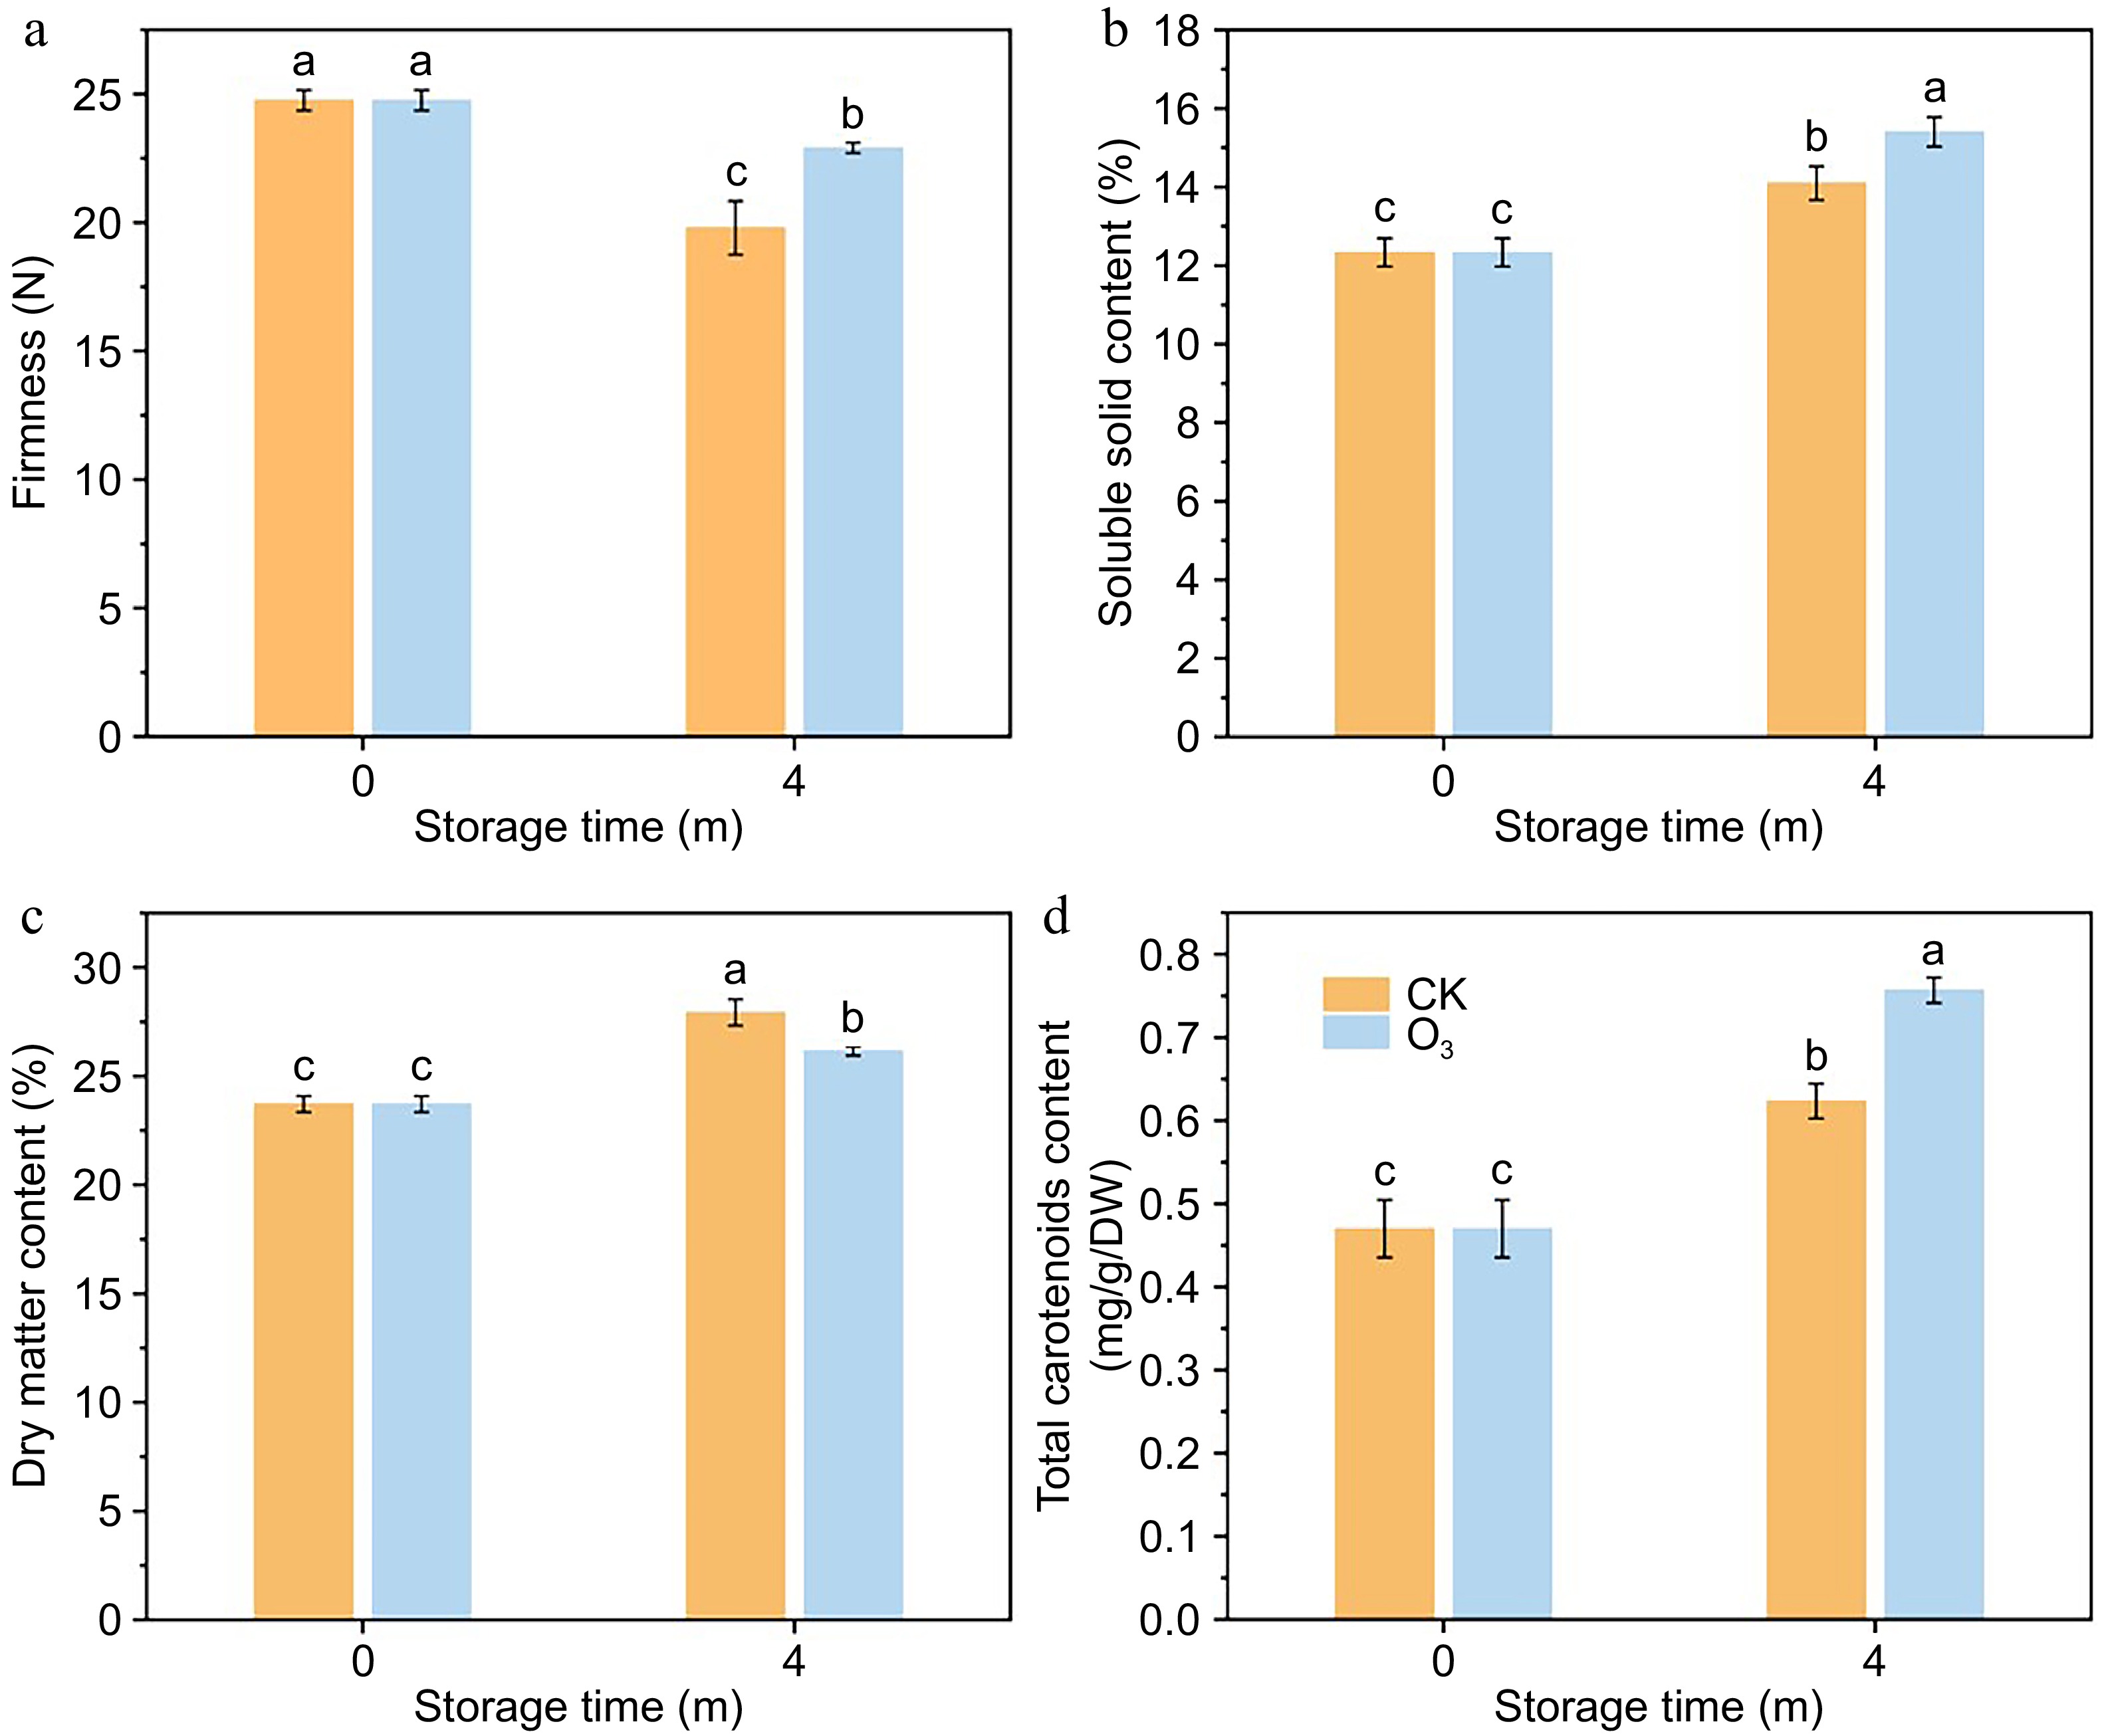
Figure 1.
Effect of O3 treatment on physiological quality of sweet potato. (a) Firmness. (b) SSC content. (c) DMC content. (d) TCC content.
-
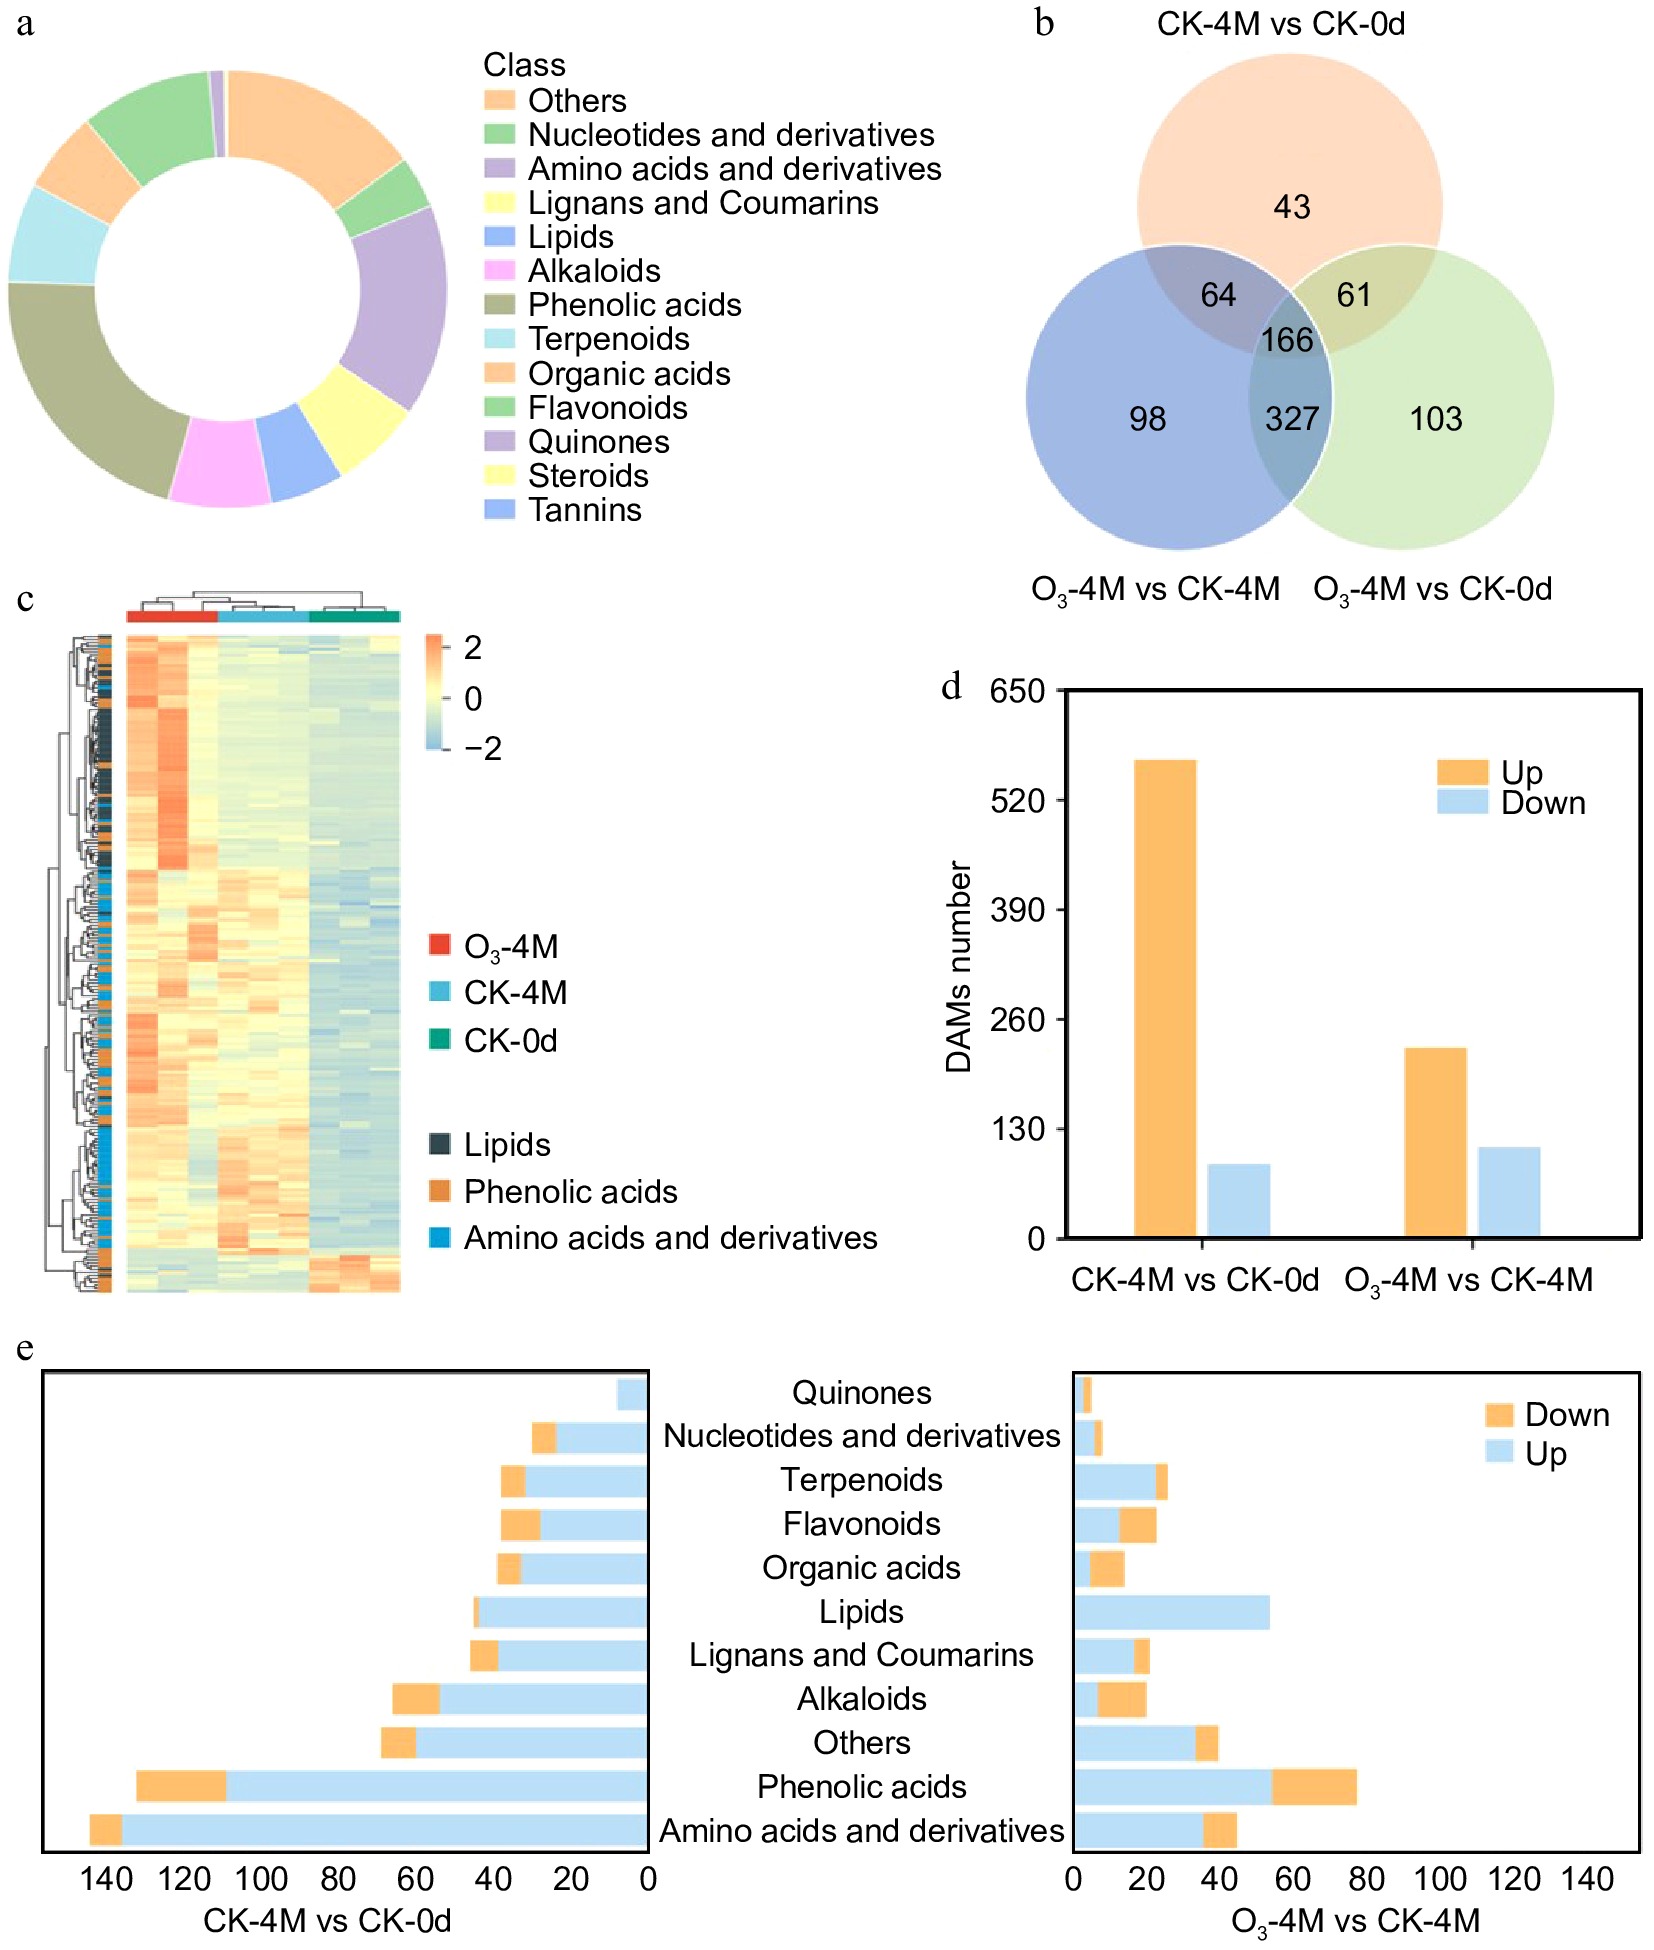
Figure 2.
Metabolome data analysis. (a) DAMs classification statistics. (b) The quantity of different metabolites in three comparative groups. (c) Heat map of clustering of lipids, phenolic acids, and amino acids and derivatives in the comparison of the three groups. (d) Number of upregulated and downregulated DAMs in two comparison groups. (e) Classification and quantity of DAMs in the two comparison groups.
-
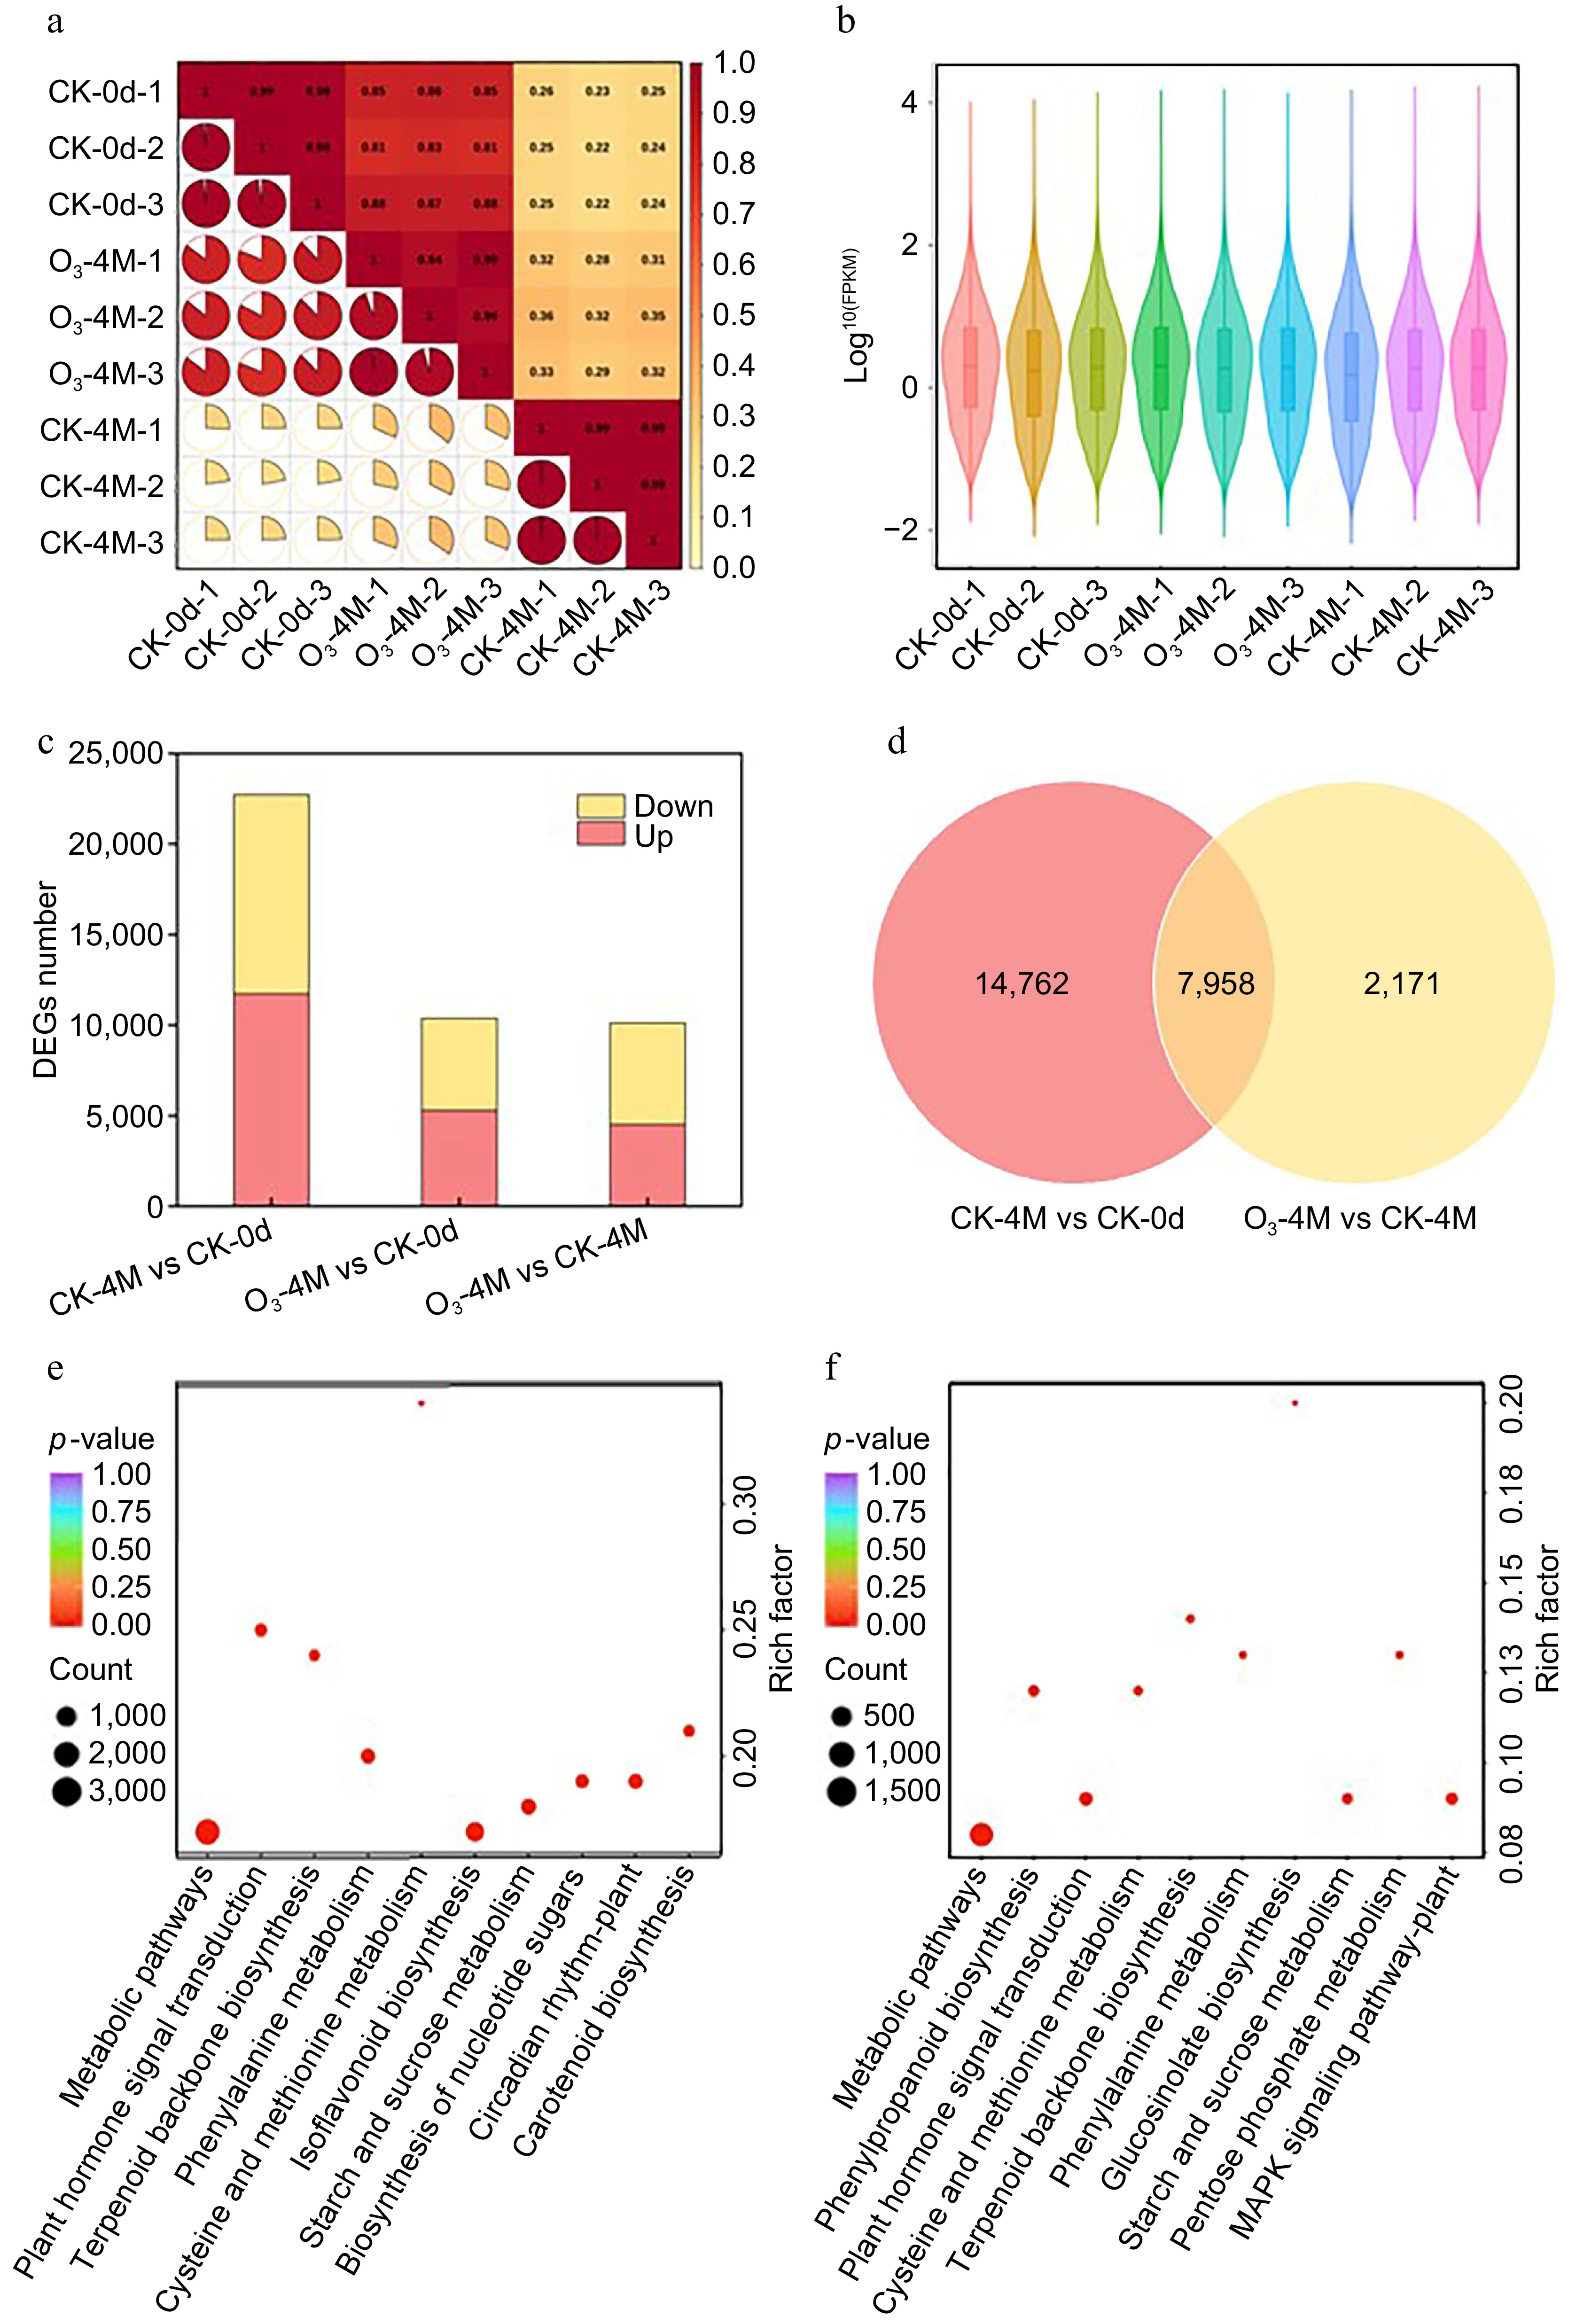
Figure 3.
Transcriptome data analysis. (a) Correlation diagram. (b) Gene expression of nine samples. (c) Number of DEGs up and downregulated in the three comparison groups. (d) Number of duplicate DEGs between the two groups. KEGG enrichment maps of DEGs in (e) CK-4M vs CK-0d, and (f) O3-4M vs CK-0d.
-
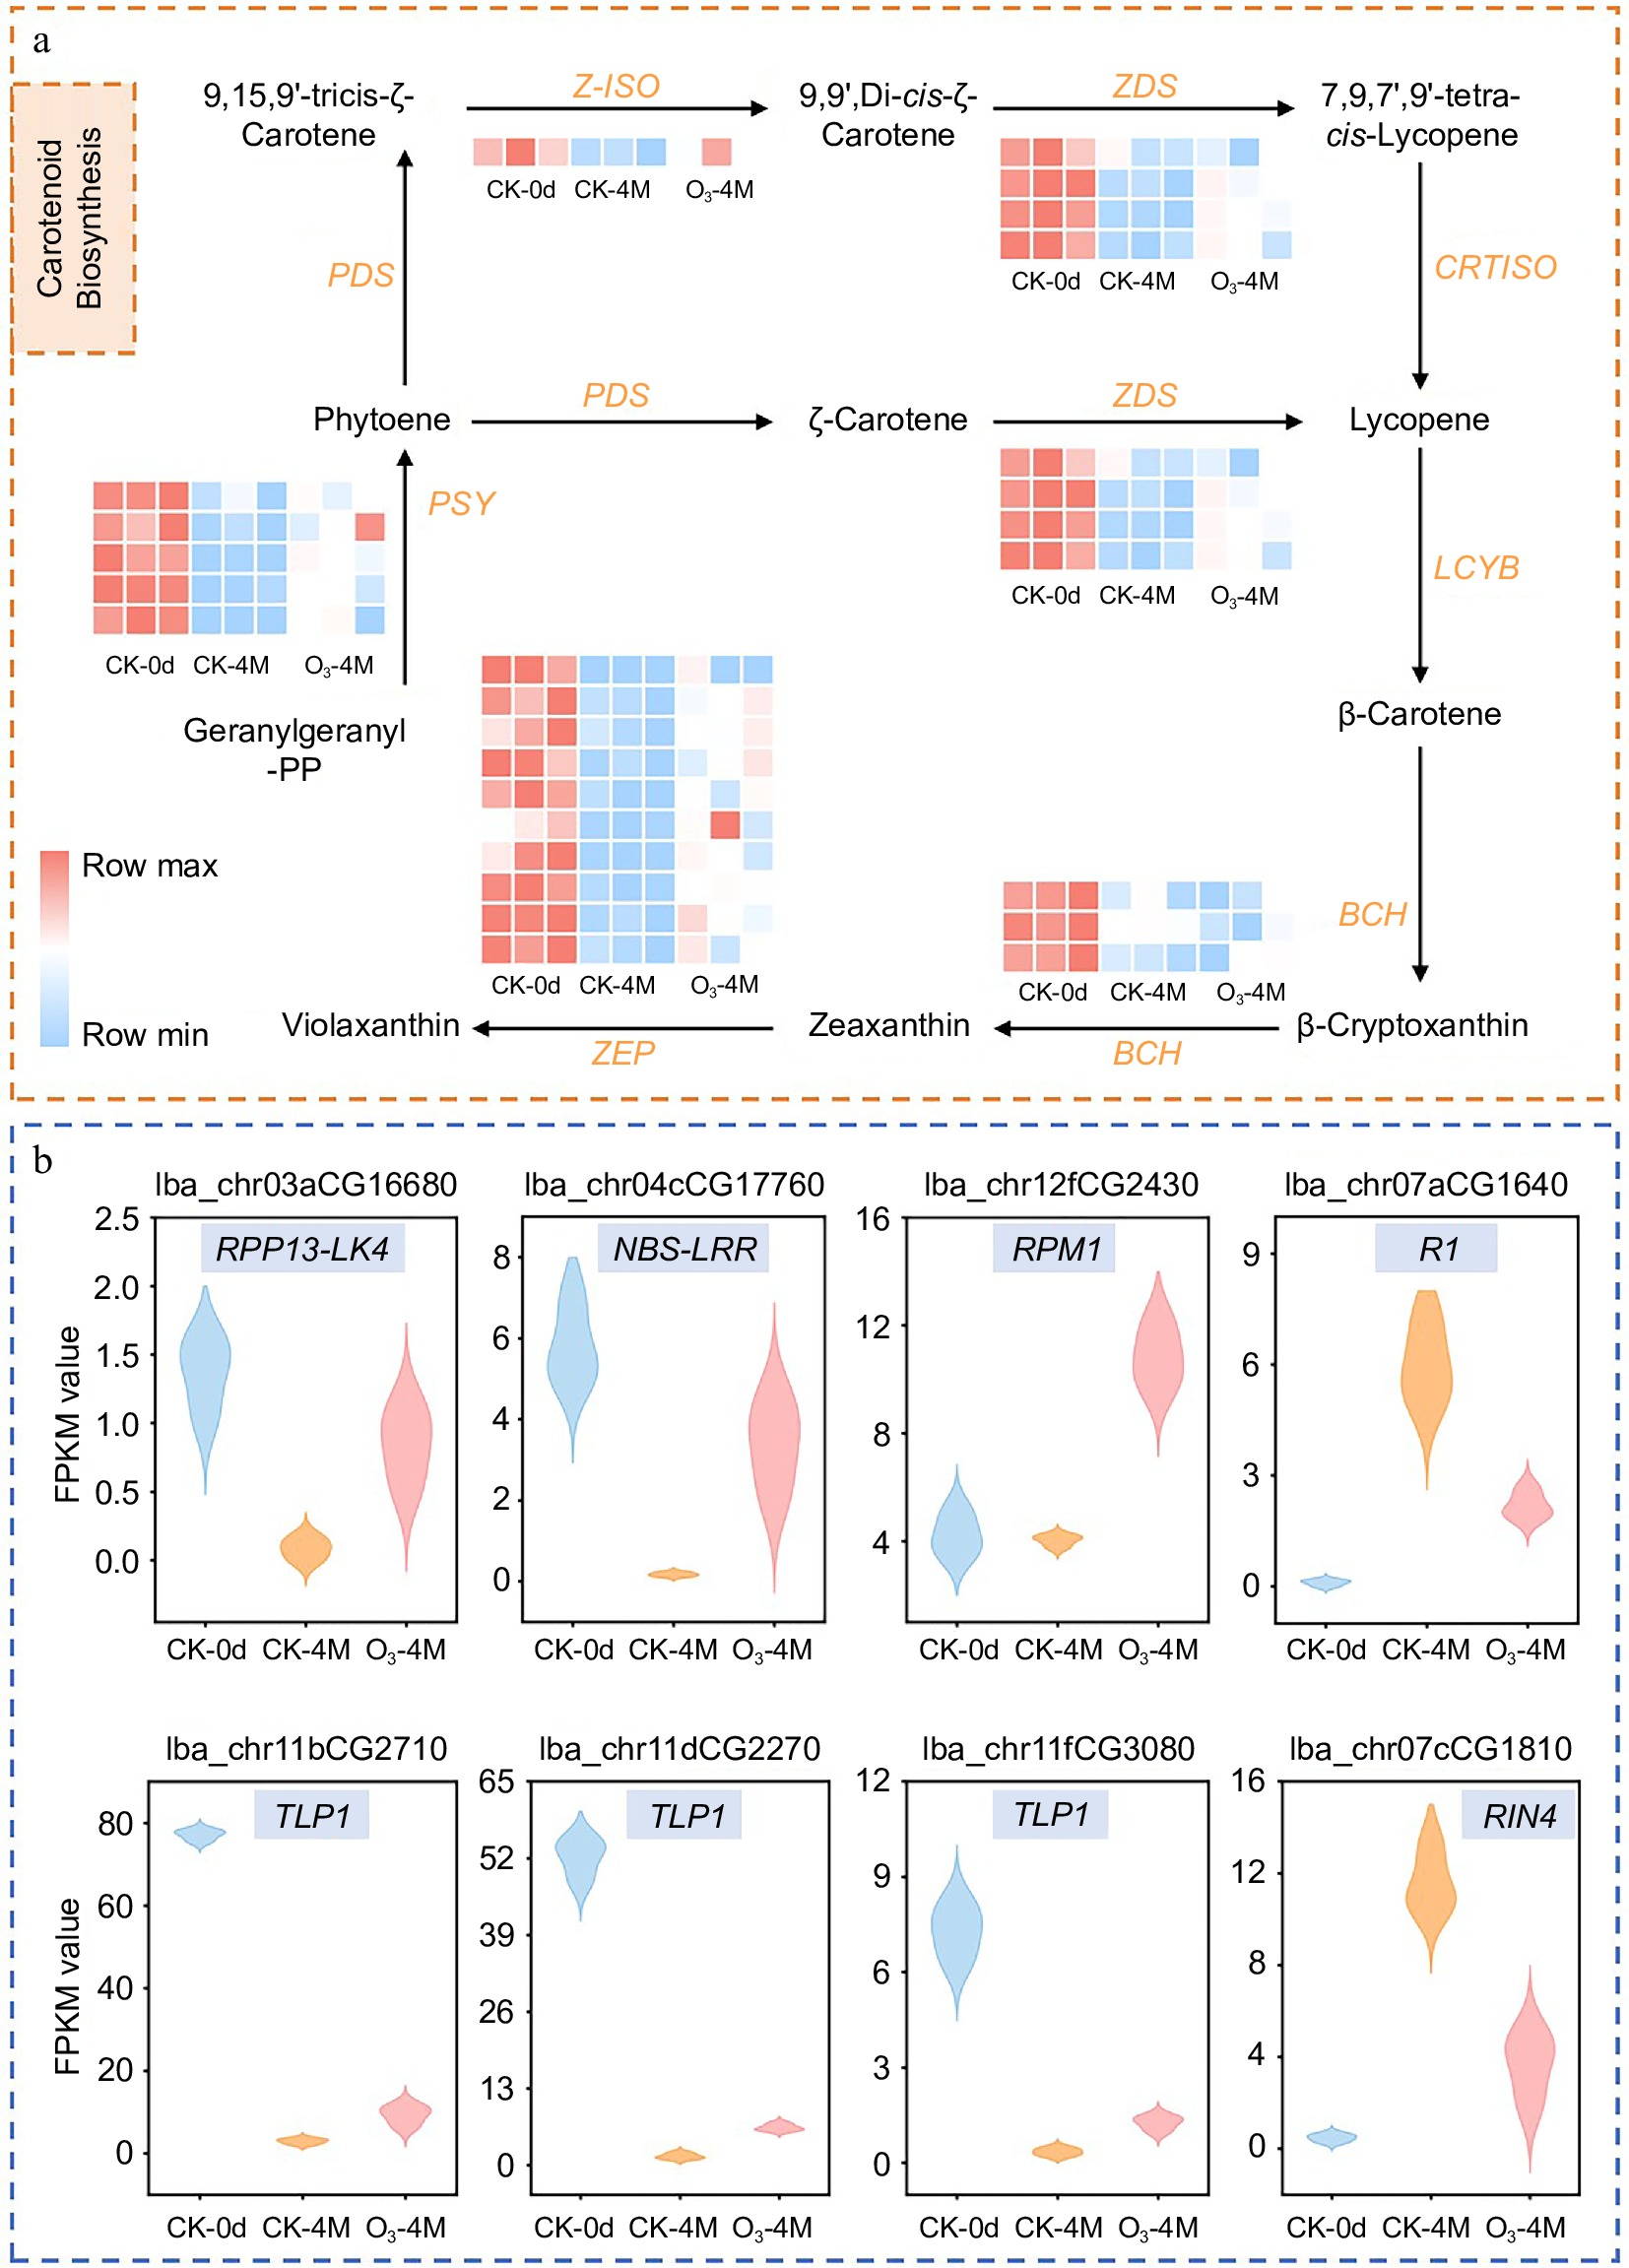
Figure 4.
(a) Carotenoid synthesis map of sweet potato. Heatmaps represent gene expression; heatmaps are plotted using FPKM values, with colors ranging from blue to red indicating a gradual increase in gene expression. (b) Relative expression of disease resistance-related genes in different groups, including disease resistance RPP13-like protein 4 (RPP13-LK4), NBS-NBS-LRR type disease resistance protein (NBS-LRR), disease resistance protein RPM1 (RPM1), late blight resistance protein R1 (R1), thaumatin-like protein 1 (TLP1), RPM1-interacting protein 4 (RIN4).
-
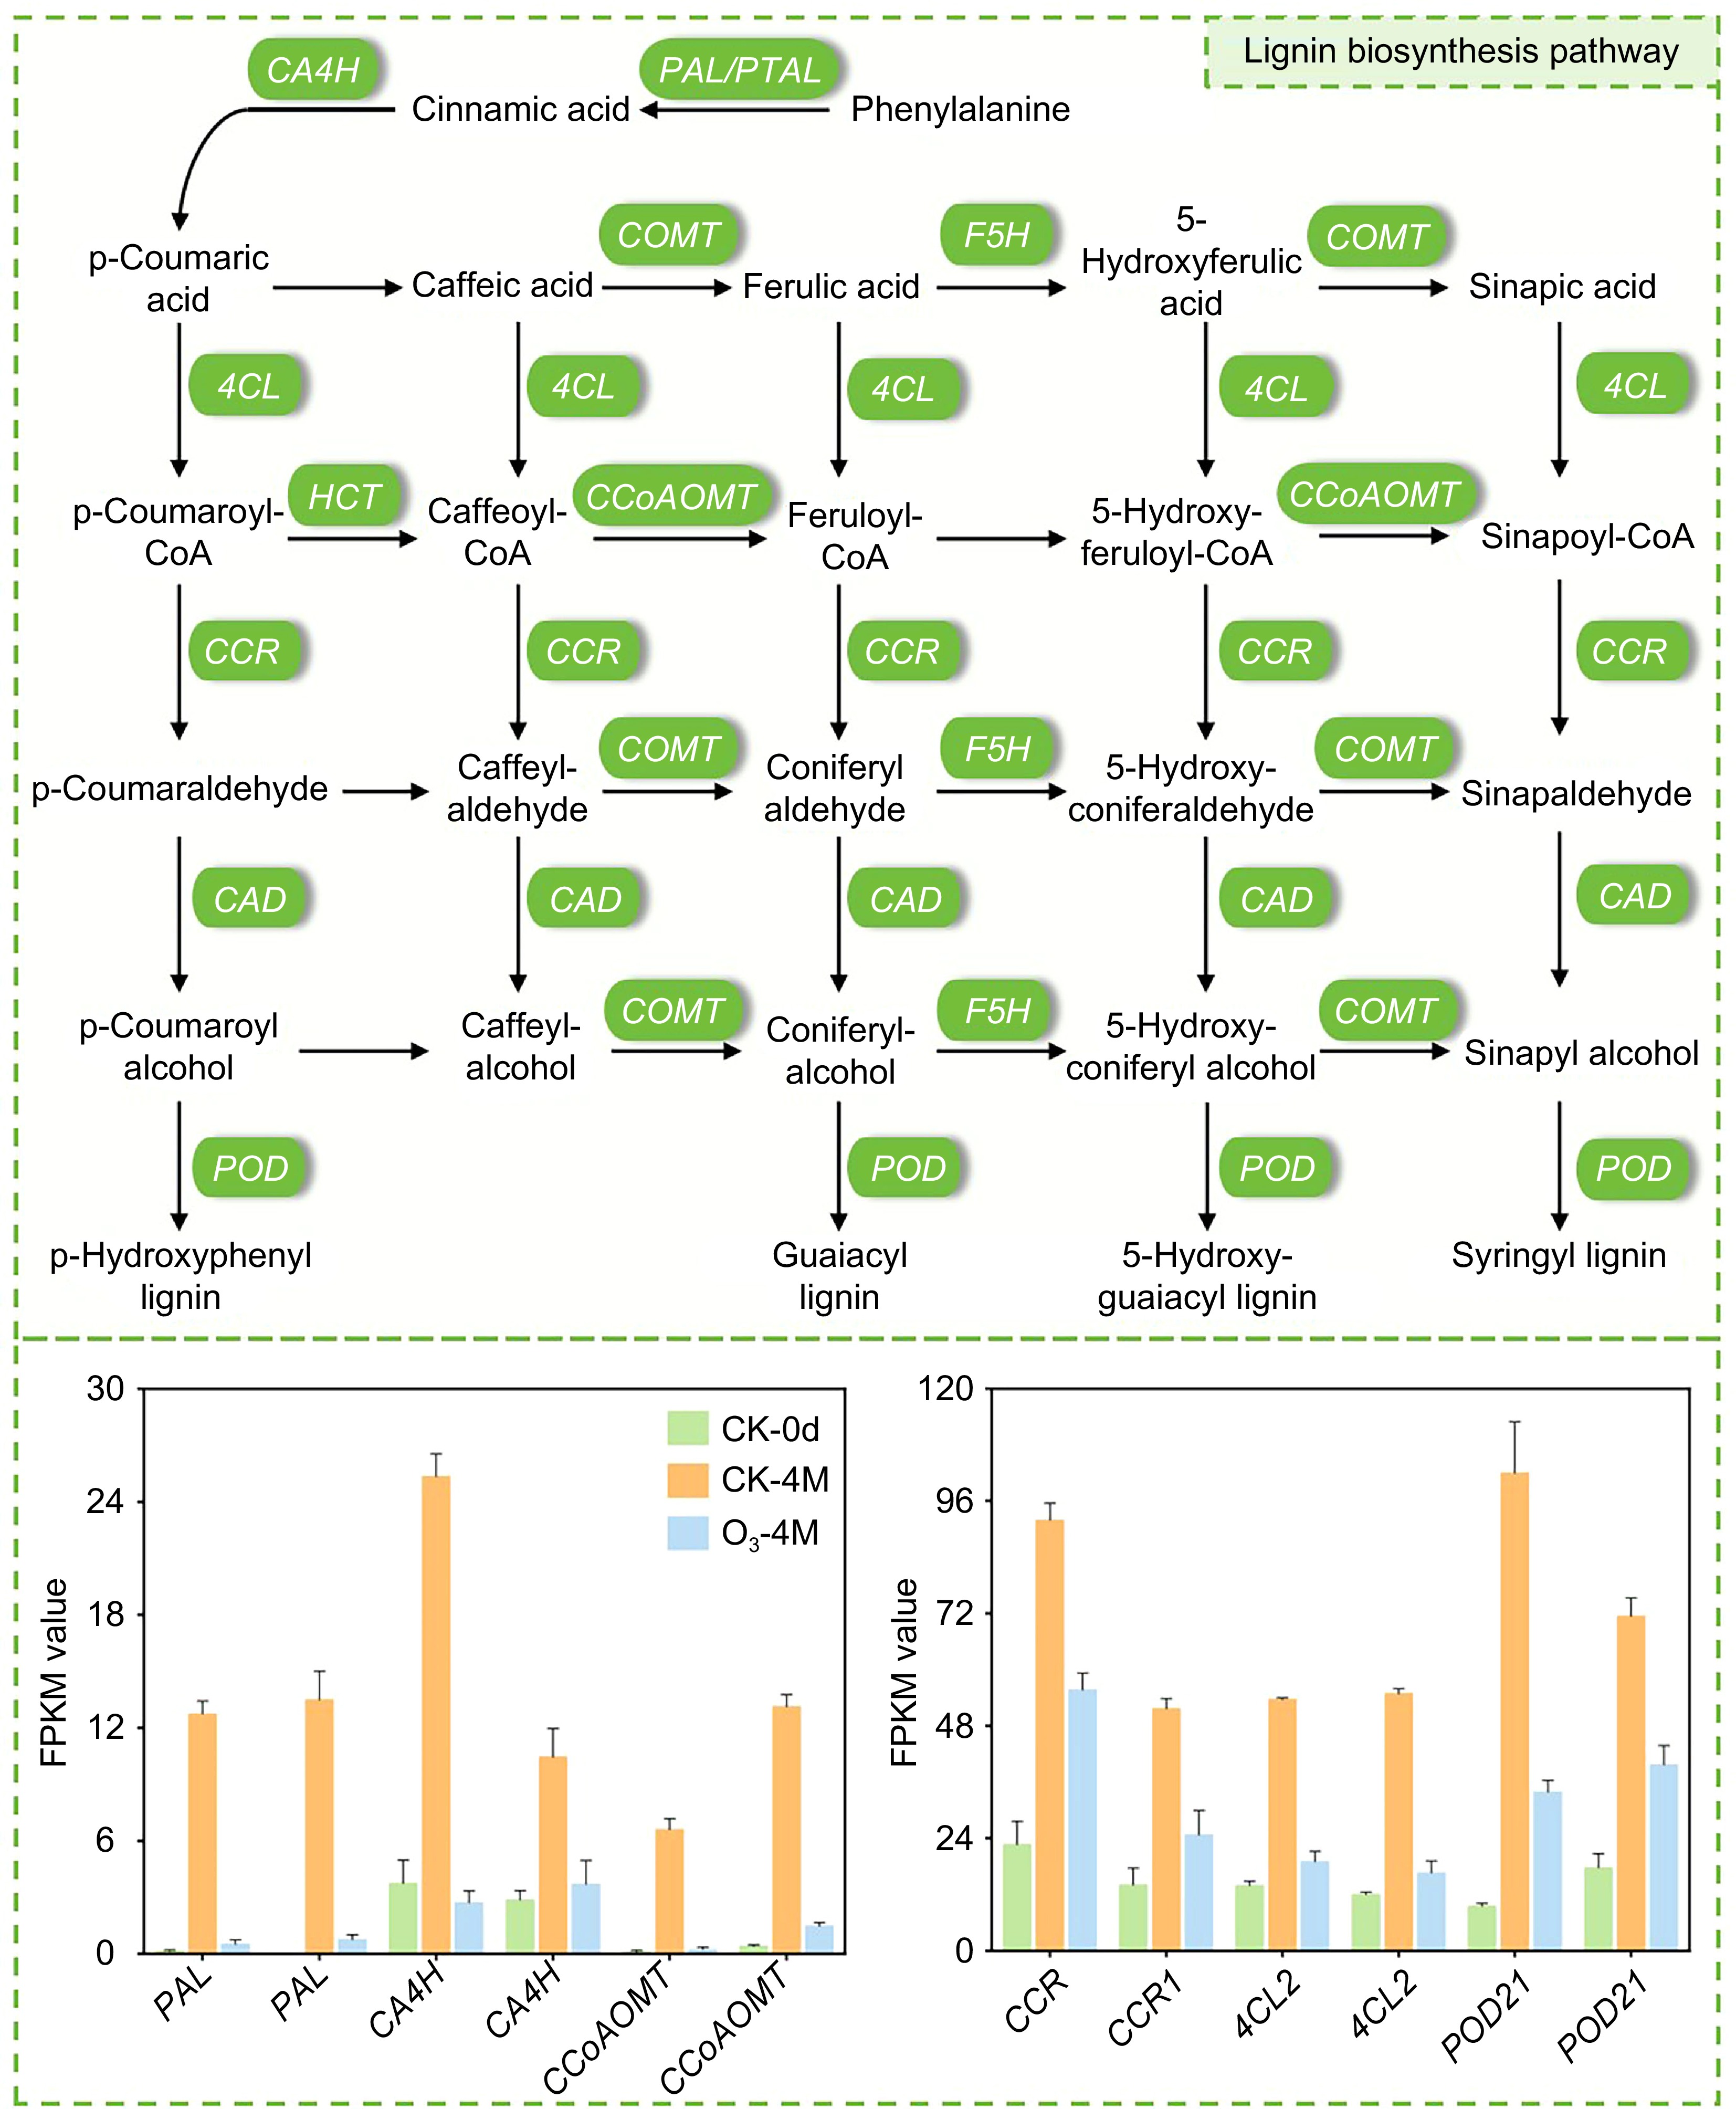
Figure 5.
Map of the lignin synthesis pathway in sweet potato. Bar graphs indicate the relative expression of DEGs, and data are expressed as FPKM values.
-
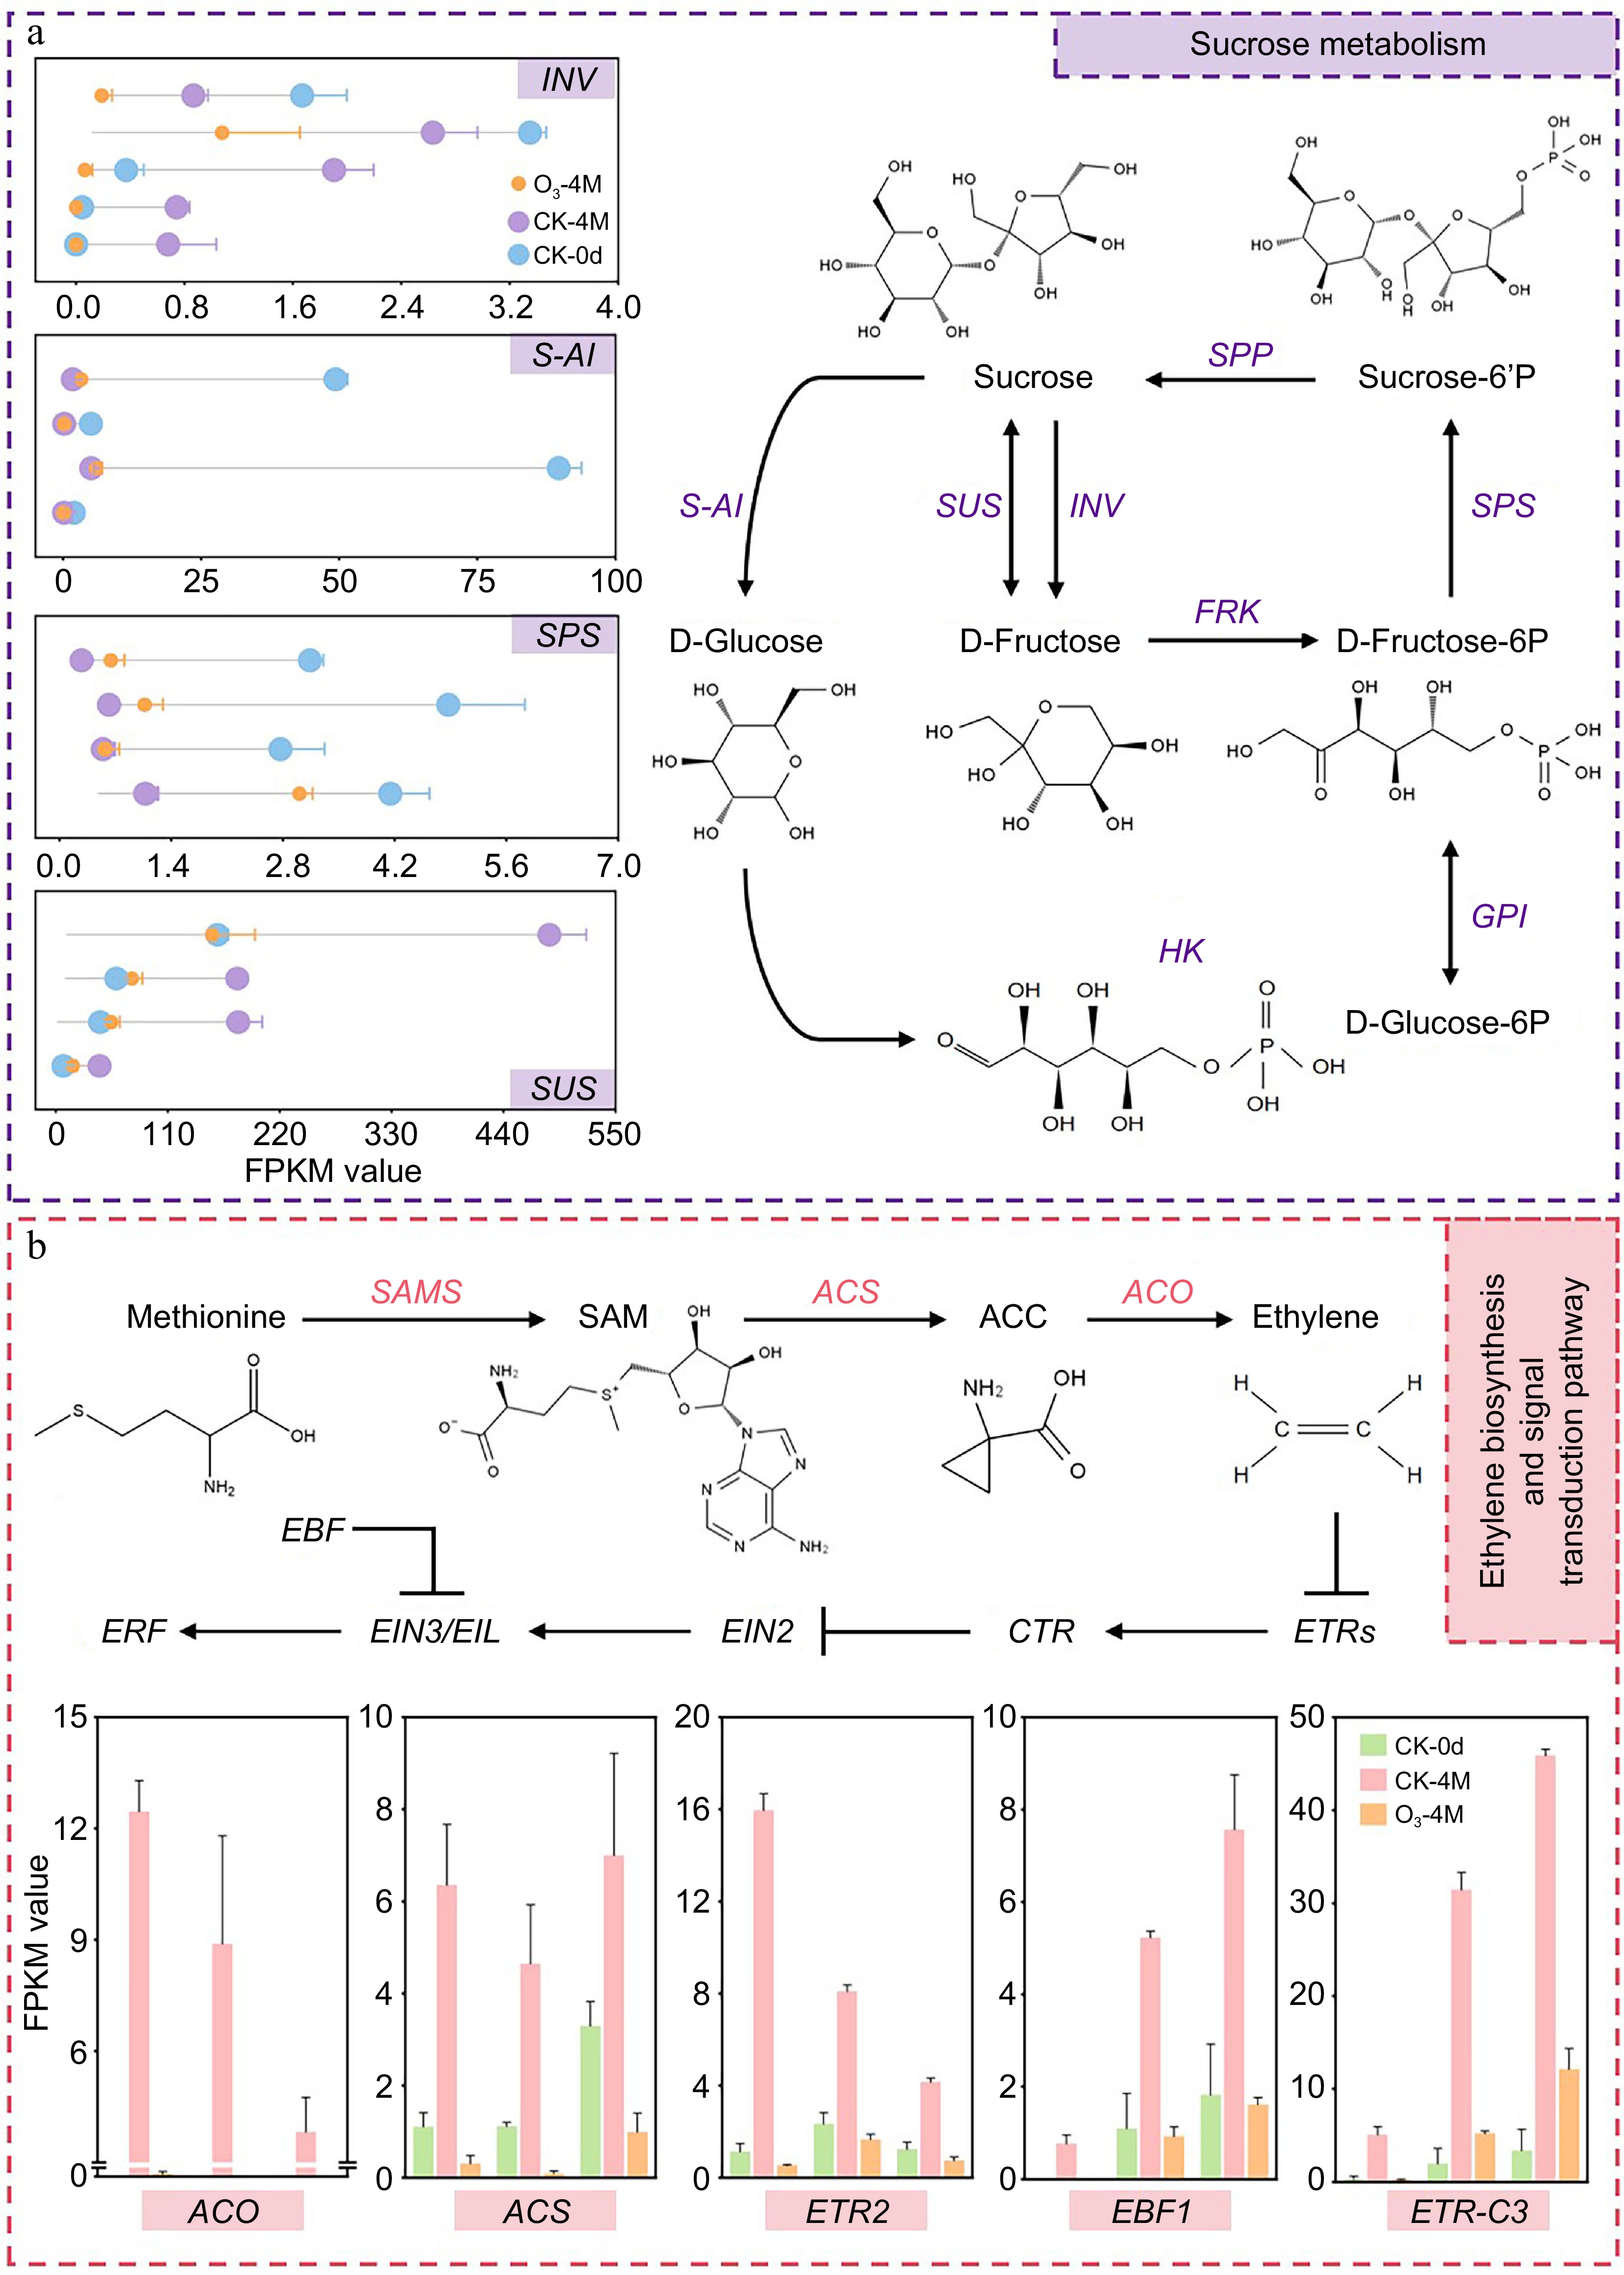
Figure 6.
(a) Diagram of the pathway of sucrose metabolism in sweet potato. Lollipop plots indicate the relative expression of DEGs, and data are expressed as FPKM values. (b) Map of sweet potato ethylene biosynthesis and signal transduction pathway. Bar graphs indicate the relative expression of DEGs, and data are expressed as FPKM values.
-
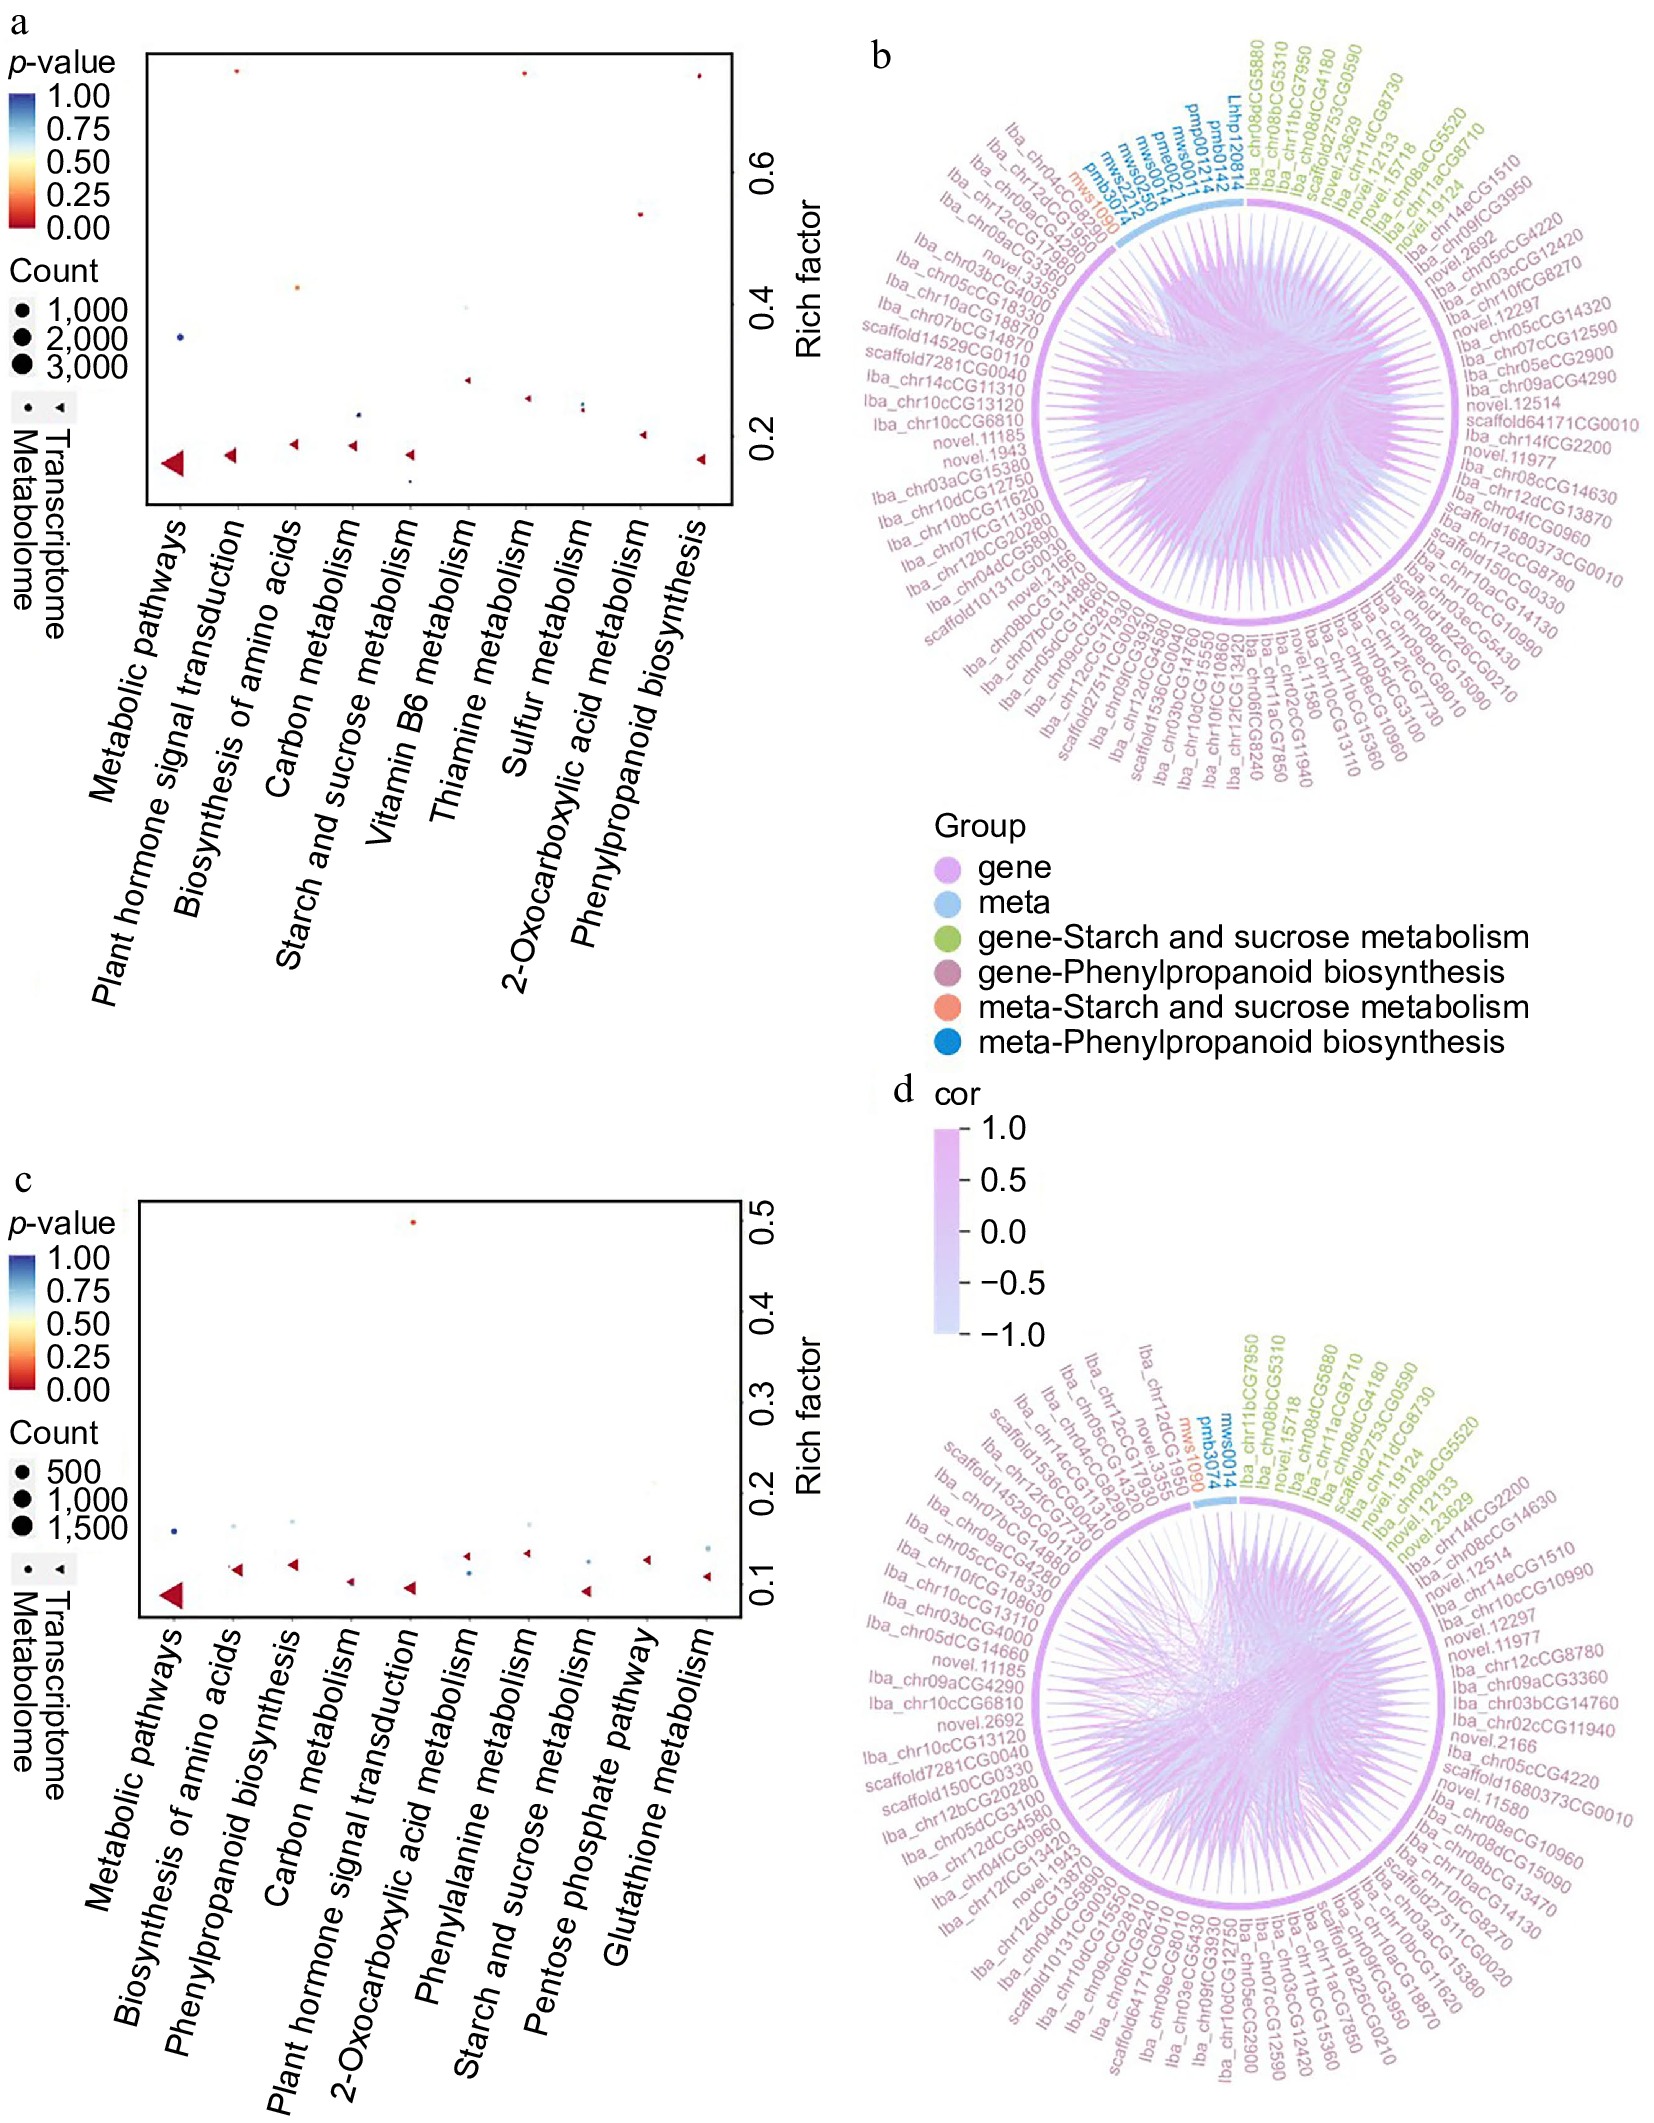
Figure 7.
KEGG enrichment pathways for DEGs and DAMs in (a) CK-4M vs CK-0d, and (c) O3-4M vs CK-4M. Correlation and chord plots of DAMs and DEGs enriched for phenylpropanoid biosynthesis and starch and sucrose metabolism in (b) CK-4M vs CK-0d, and (d) O3-4M vs CK-4M.
-
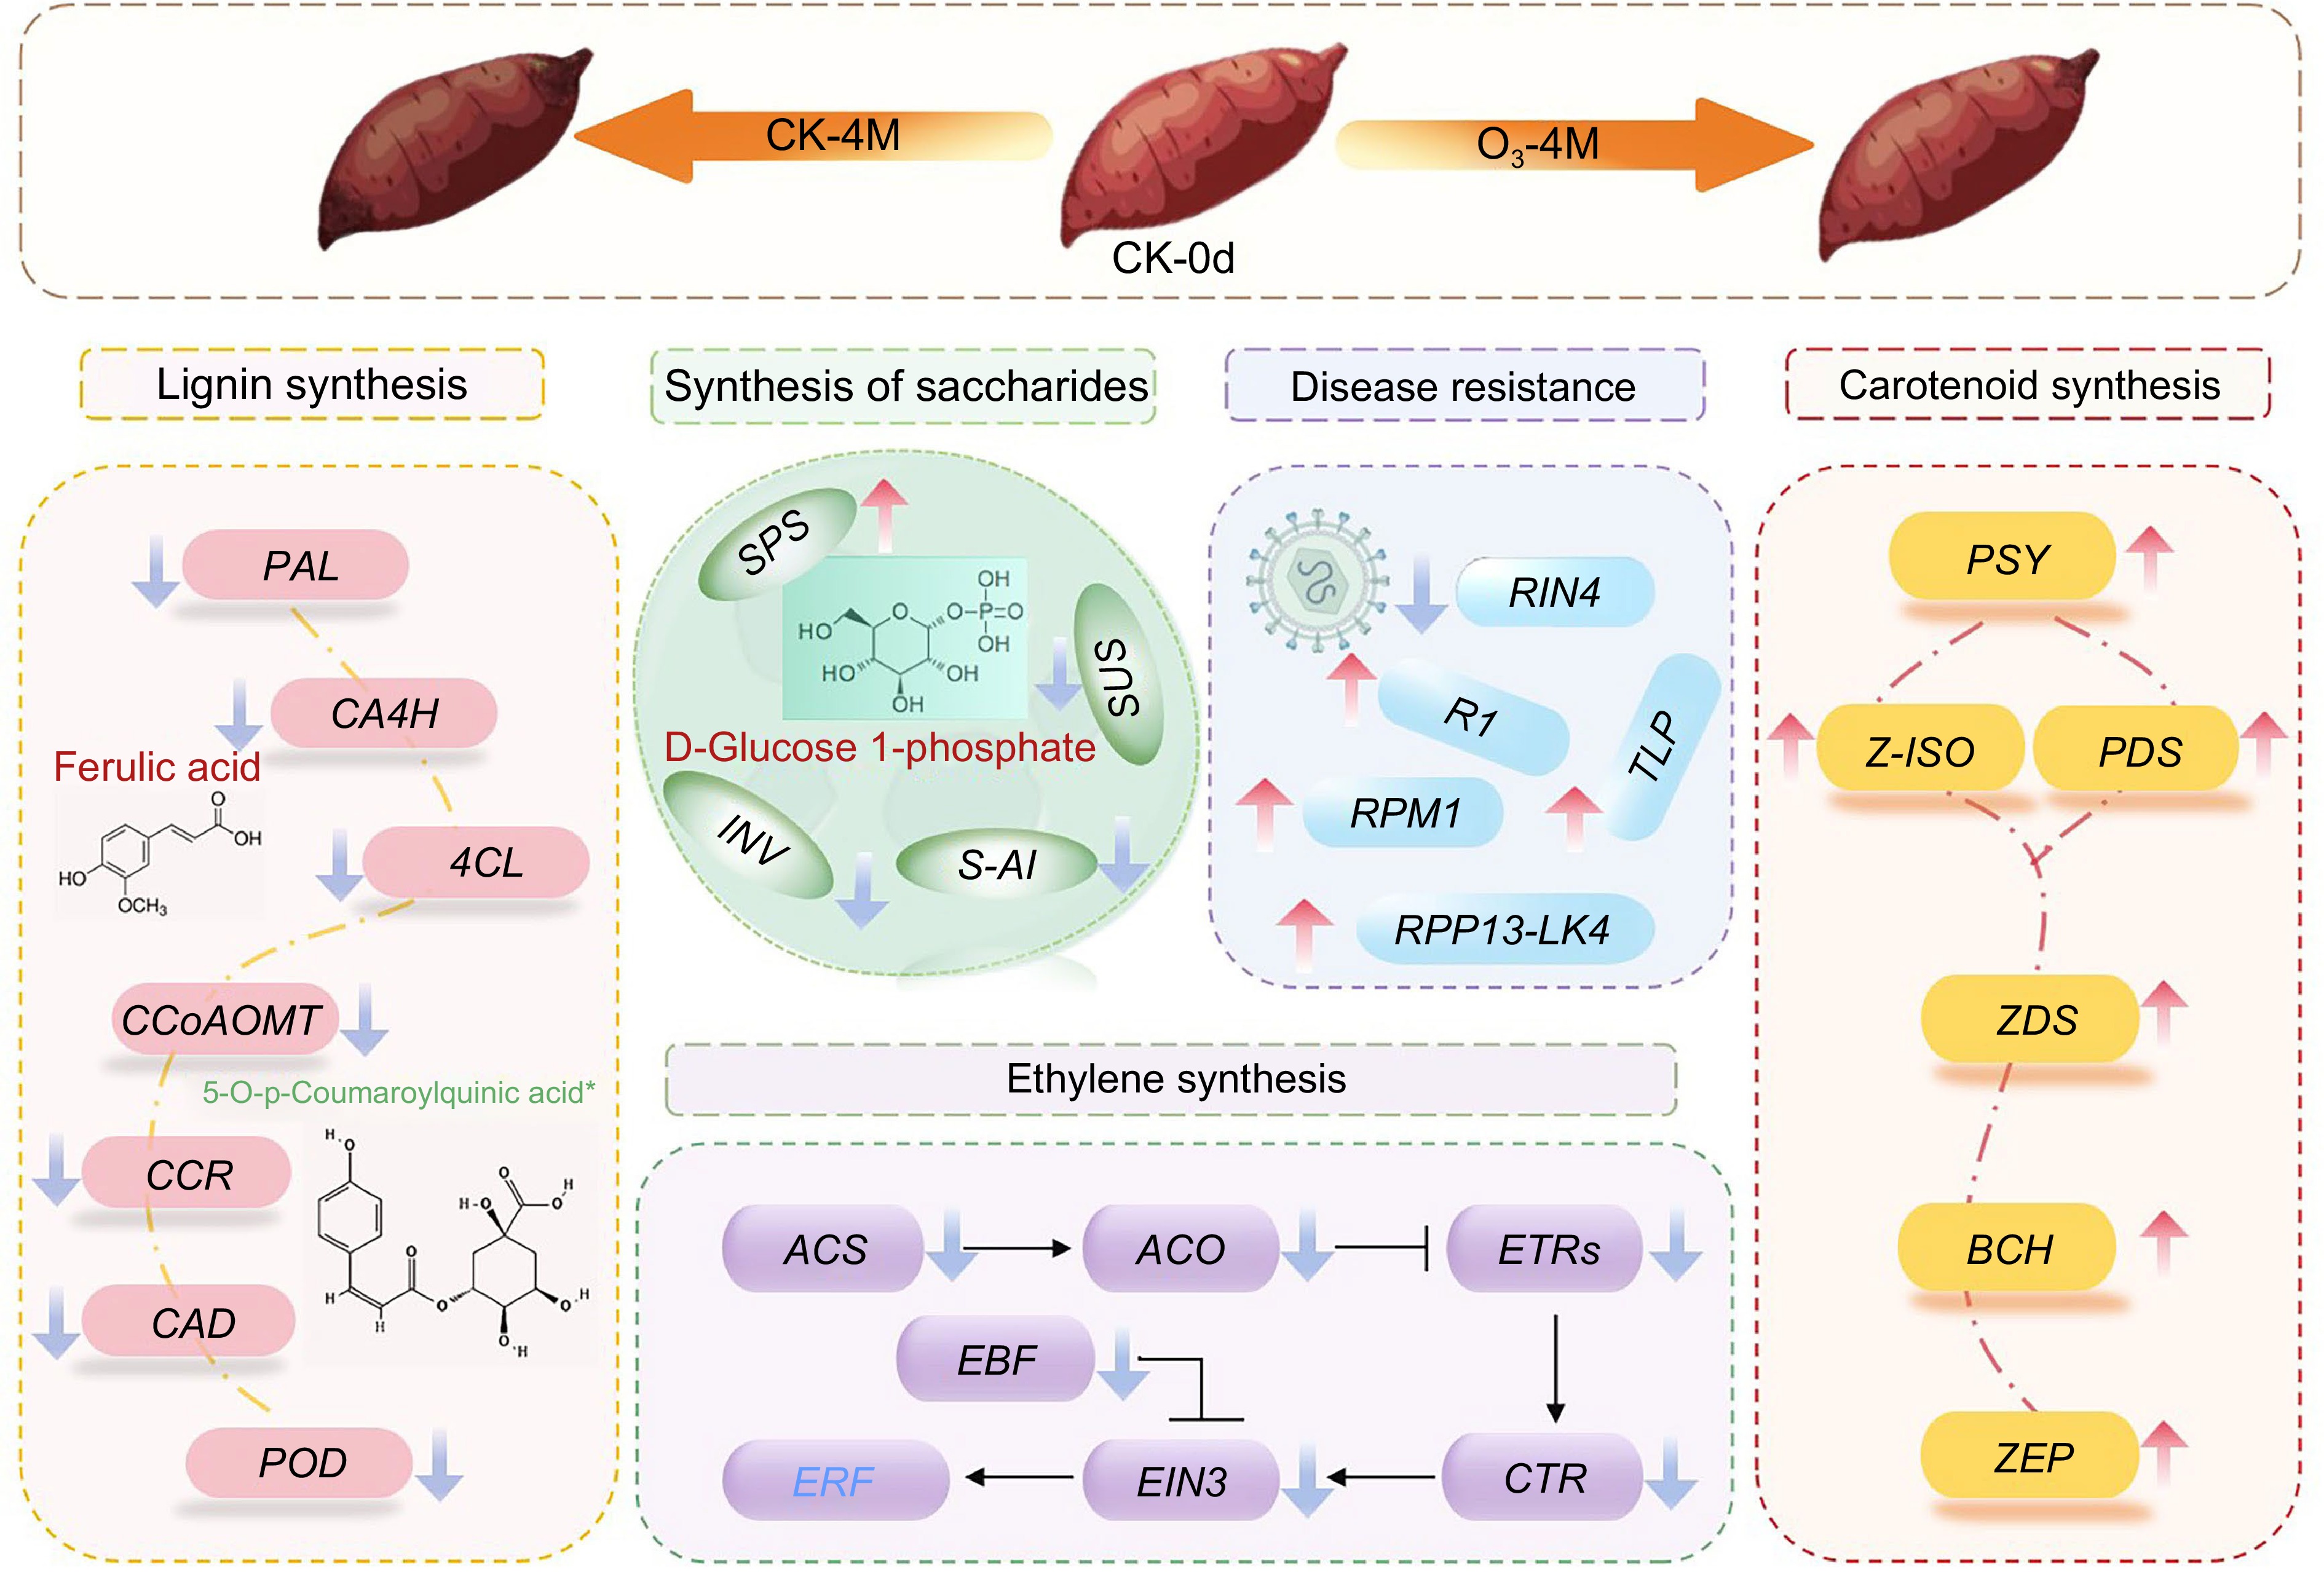
Figure 8.
Mechanistic model diagram of postharvest senescence mechanisms in O3 treated sweet potato. Genes are indicated in italics. Upward arrows indicate upregulation of genes and downward arrows indicate downregulation of genes. Metabolites are represented by red or green characters, with red representing increased levels, and green representing decreased levels.
Figures
(8)
Tables
(0)