-
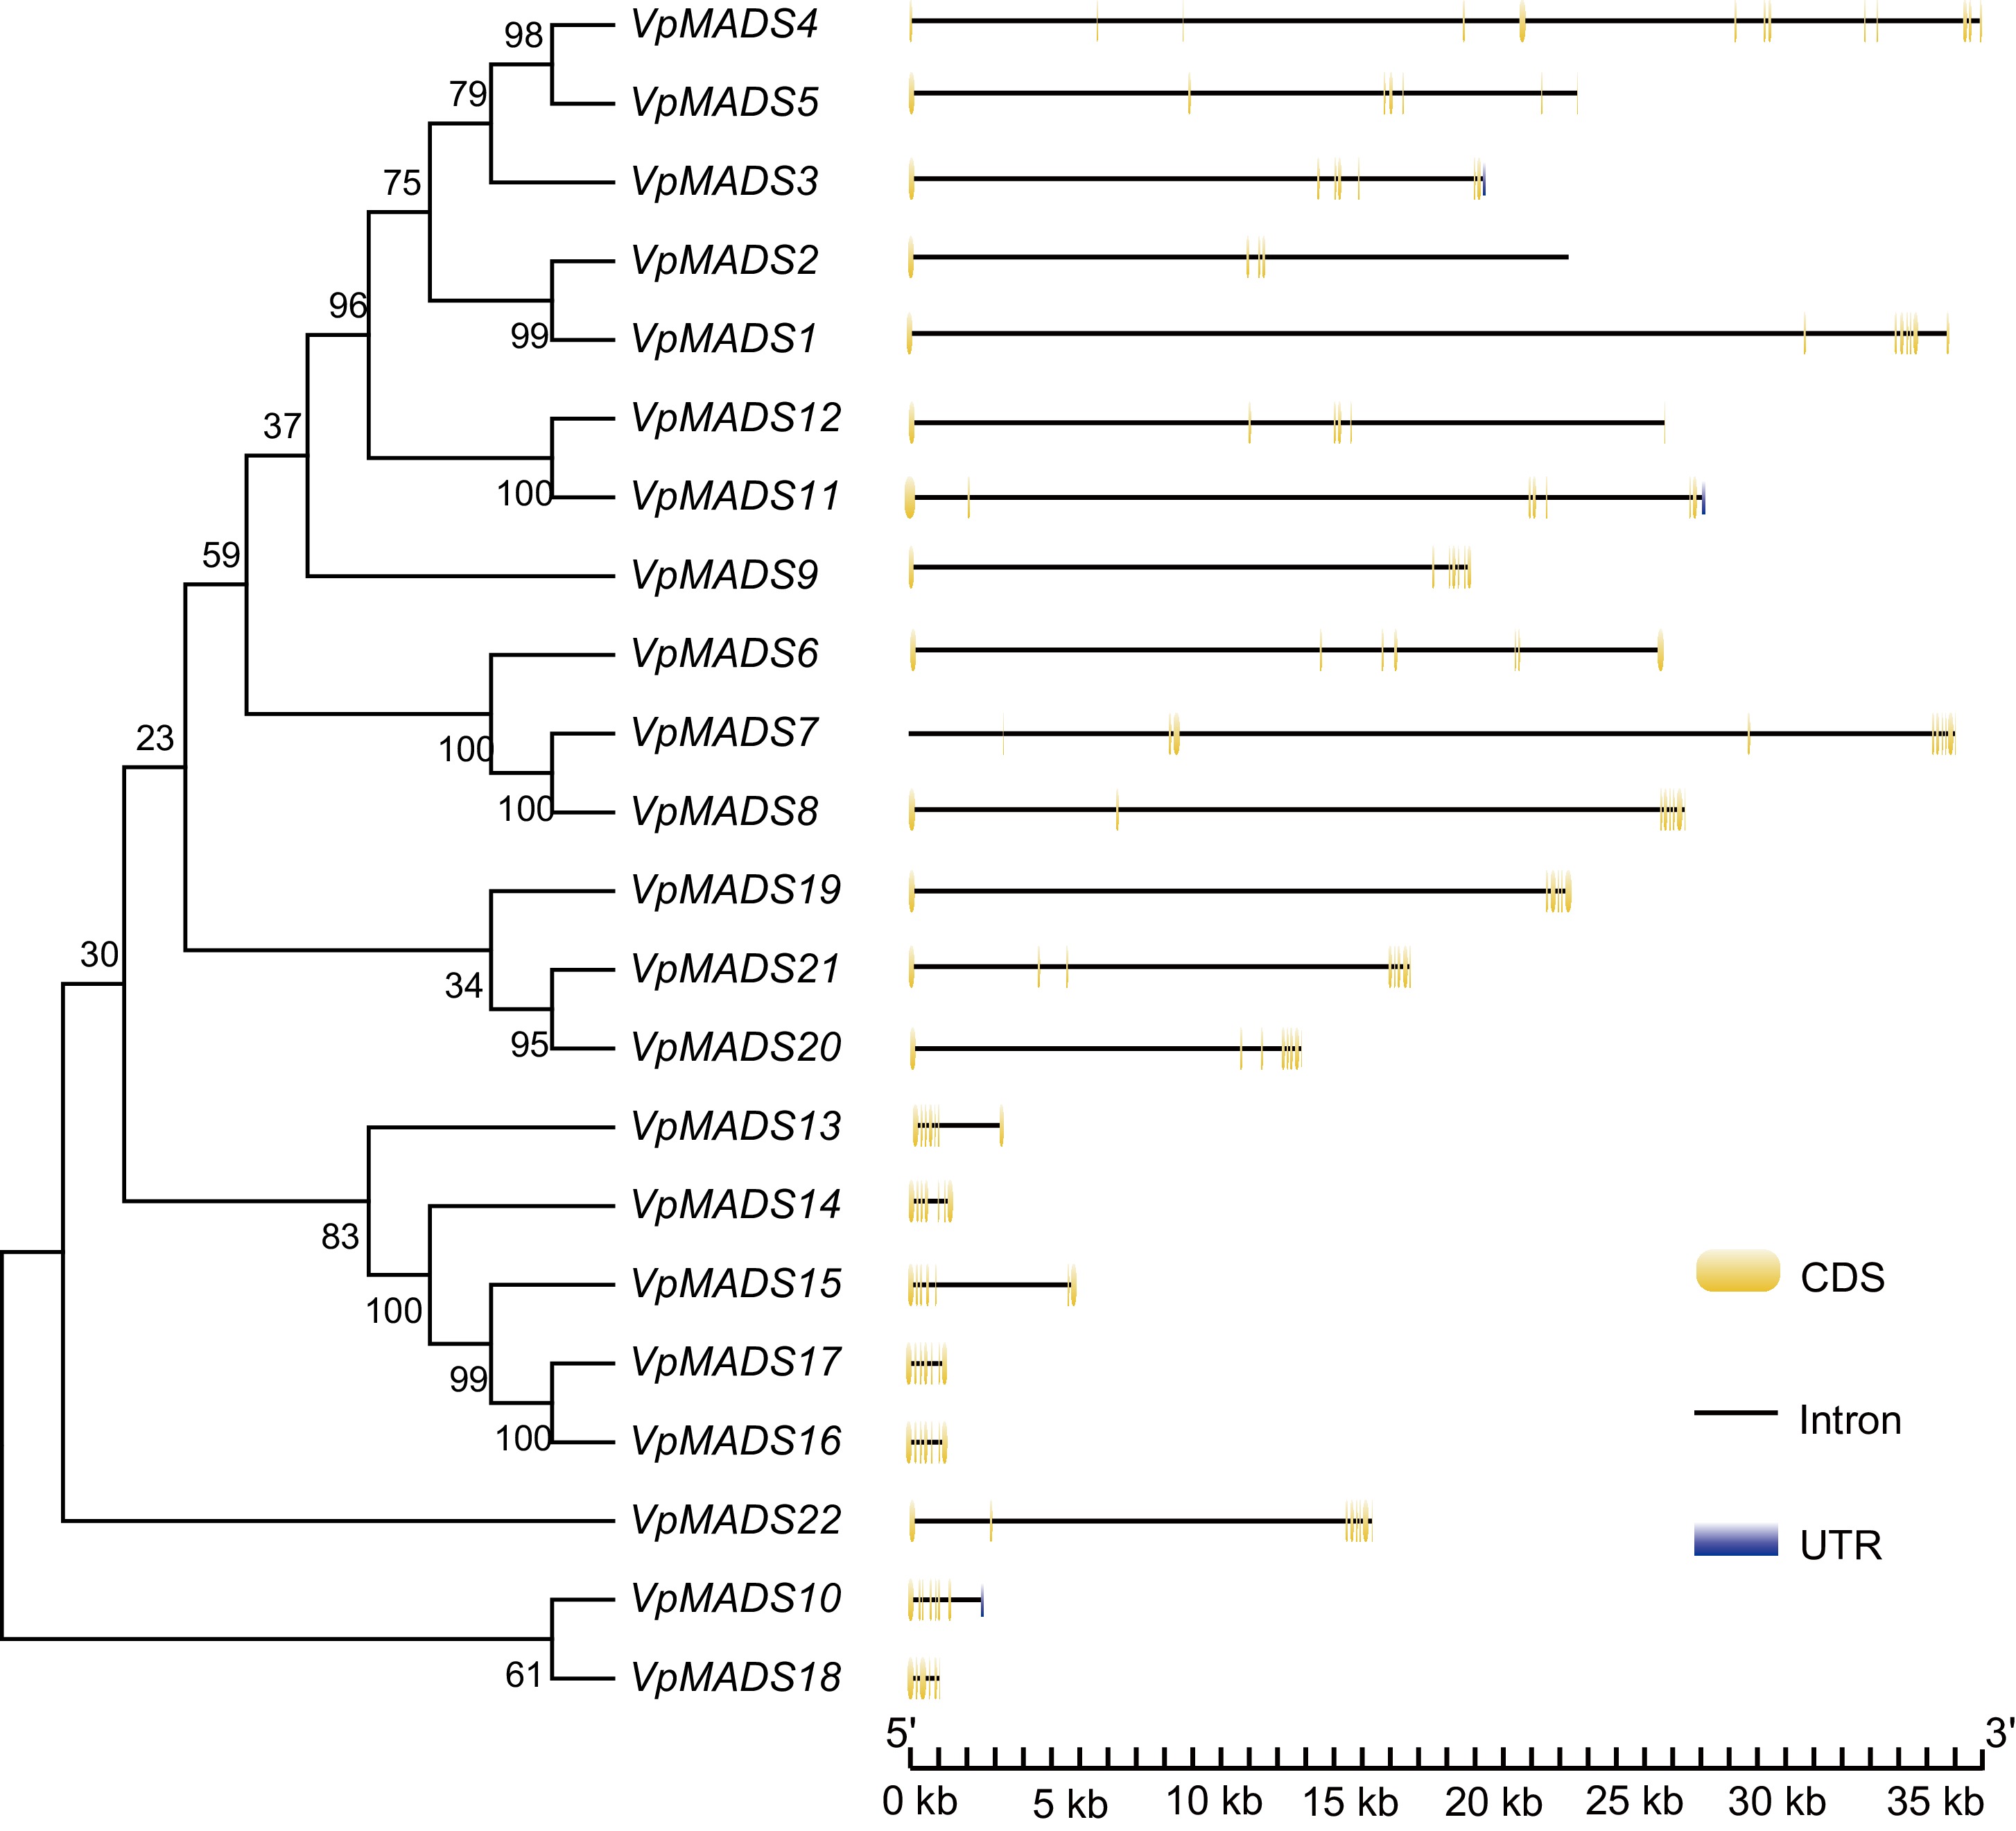
Figure 1.
Gene structures of MIKCC-type VpMADS genes with exons, introns, and UTRs.
-
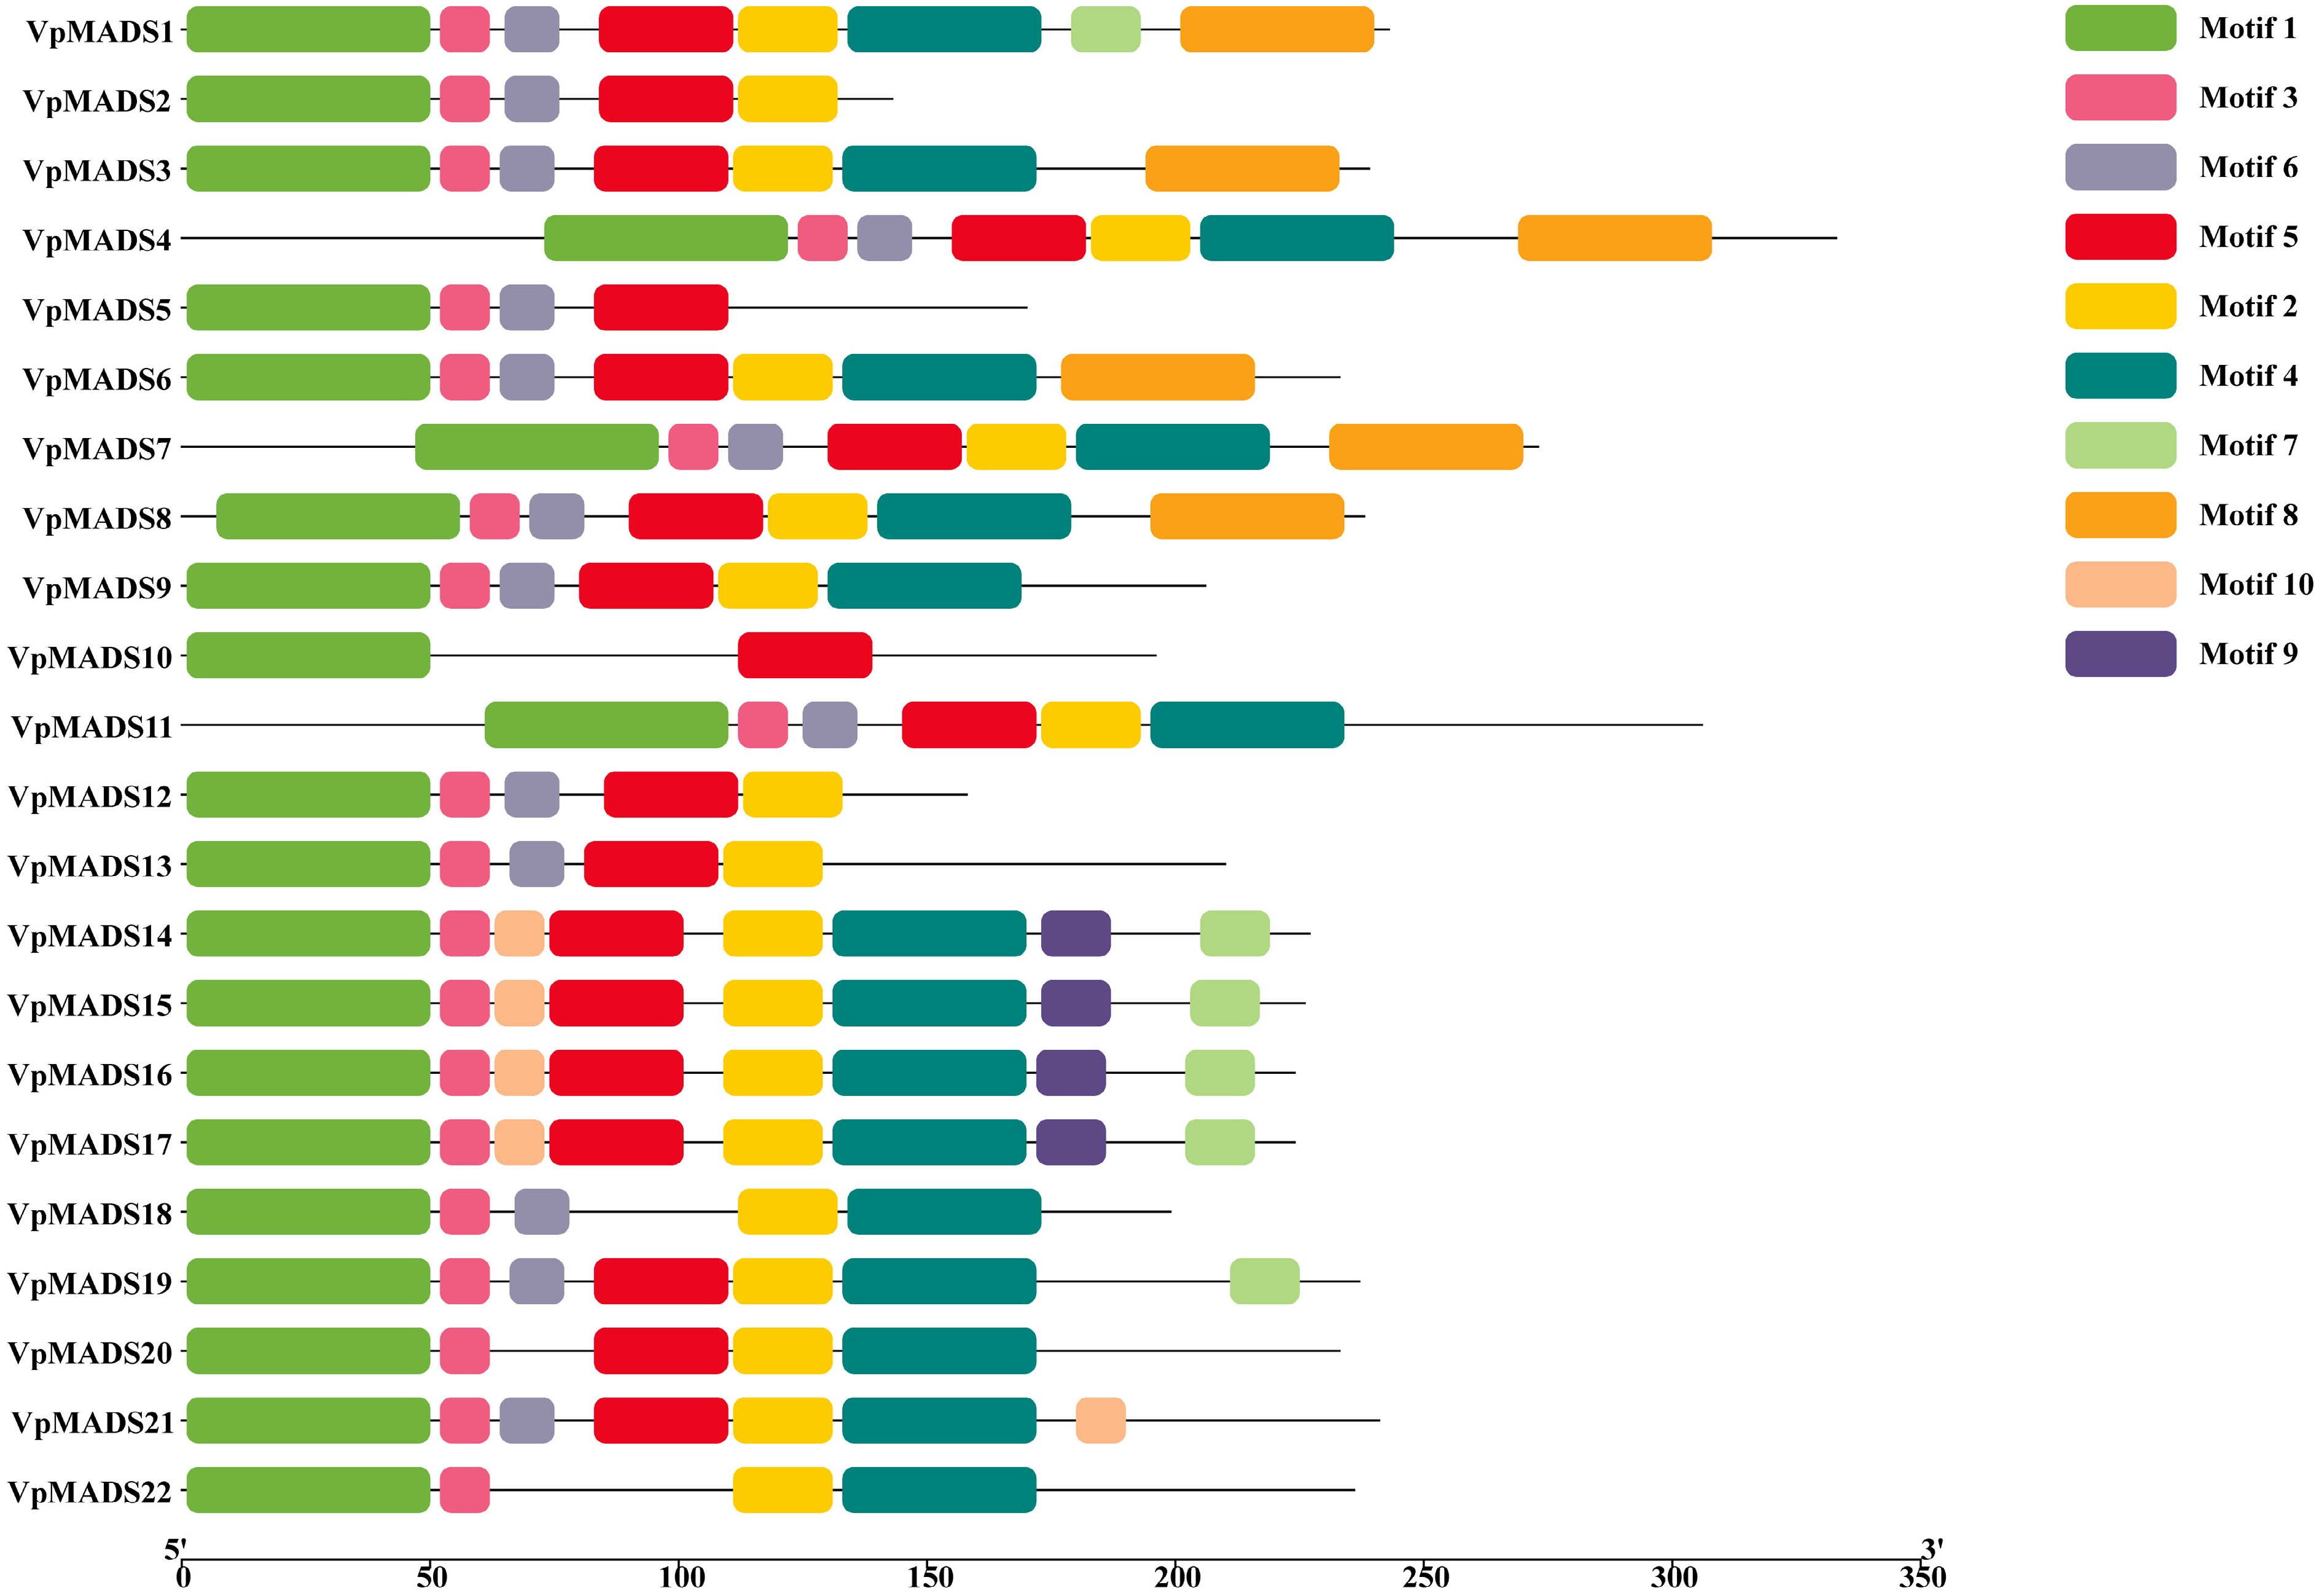
Figure 2.
Conserved motif analyisis of MIKCC-type VpMADSs.
-
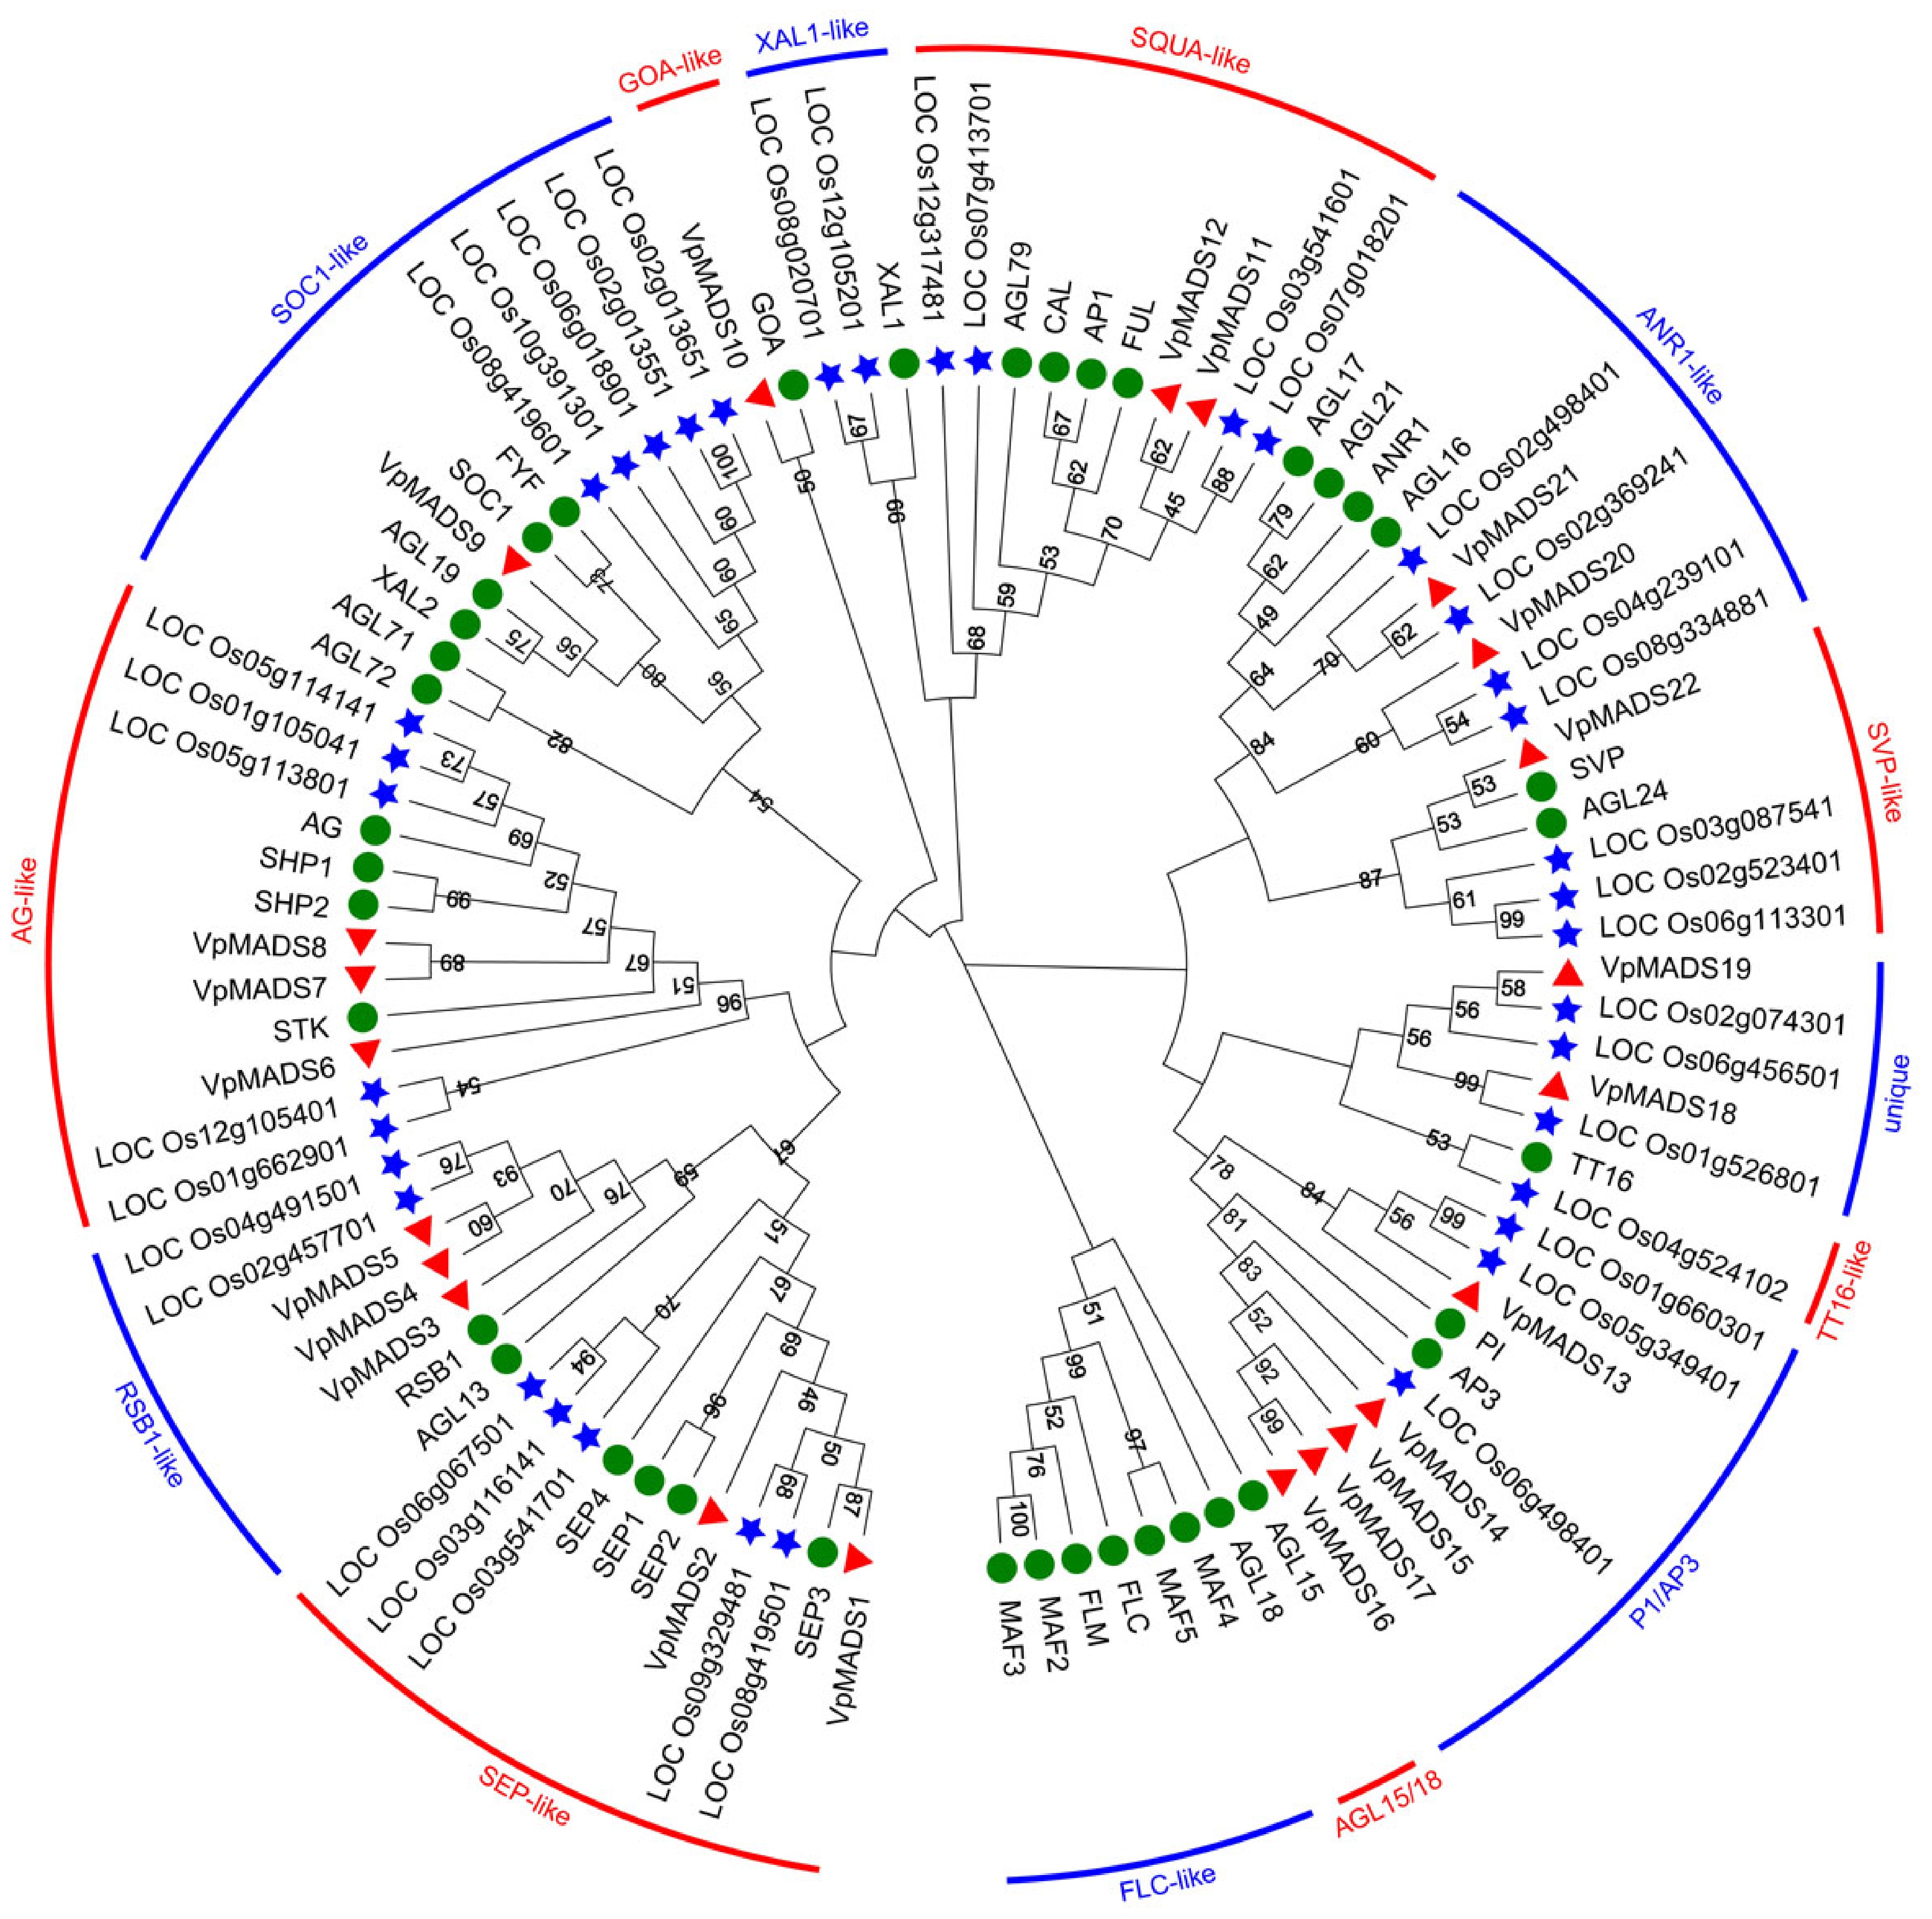
Figure 3.
The phylogenetic tree of MIKCC-type MADS-box proteins in V. planifolia, A. thaliana, and O. sativa. The red triangles referred to VpMADSs, green circles referred to AtMADSs, and blue stars referred to OsMADSs. Two adjacent groups were alternately distinguished by bands of two colors.
-
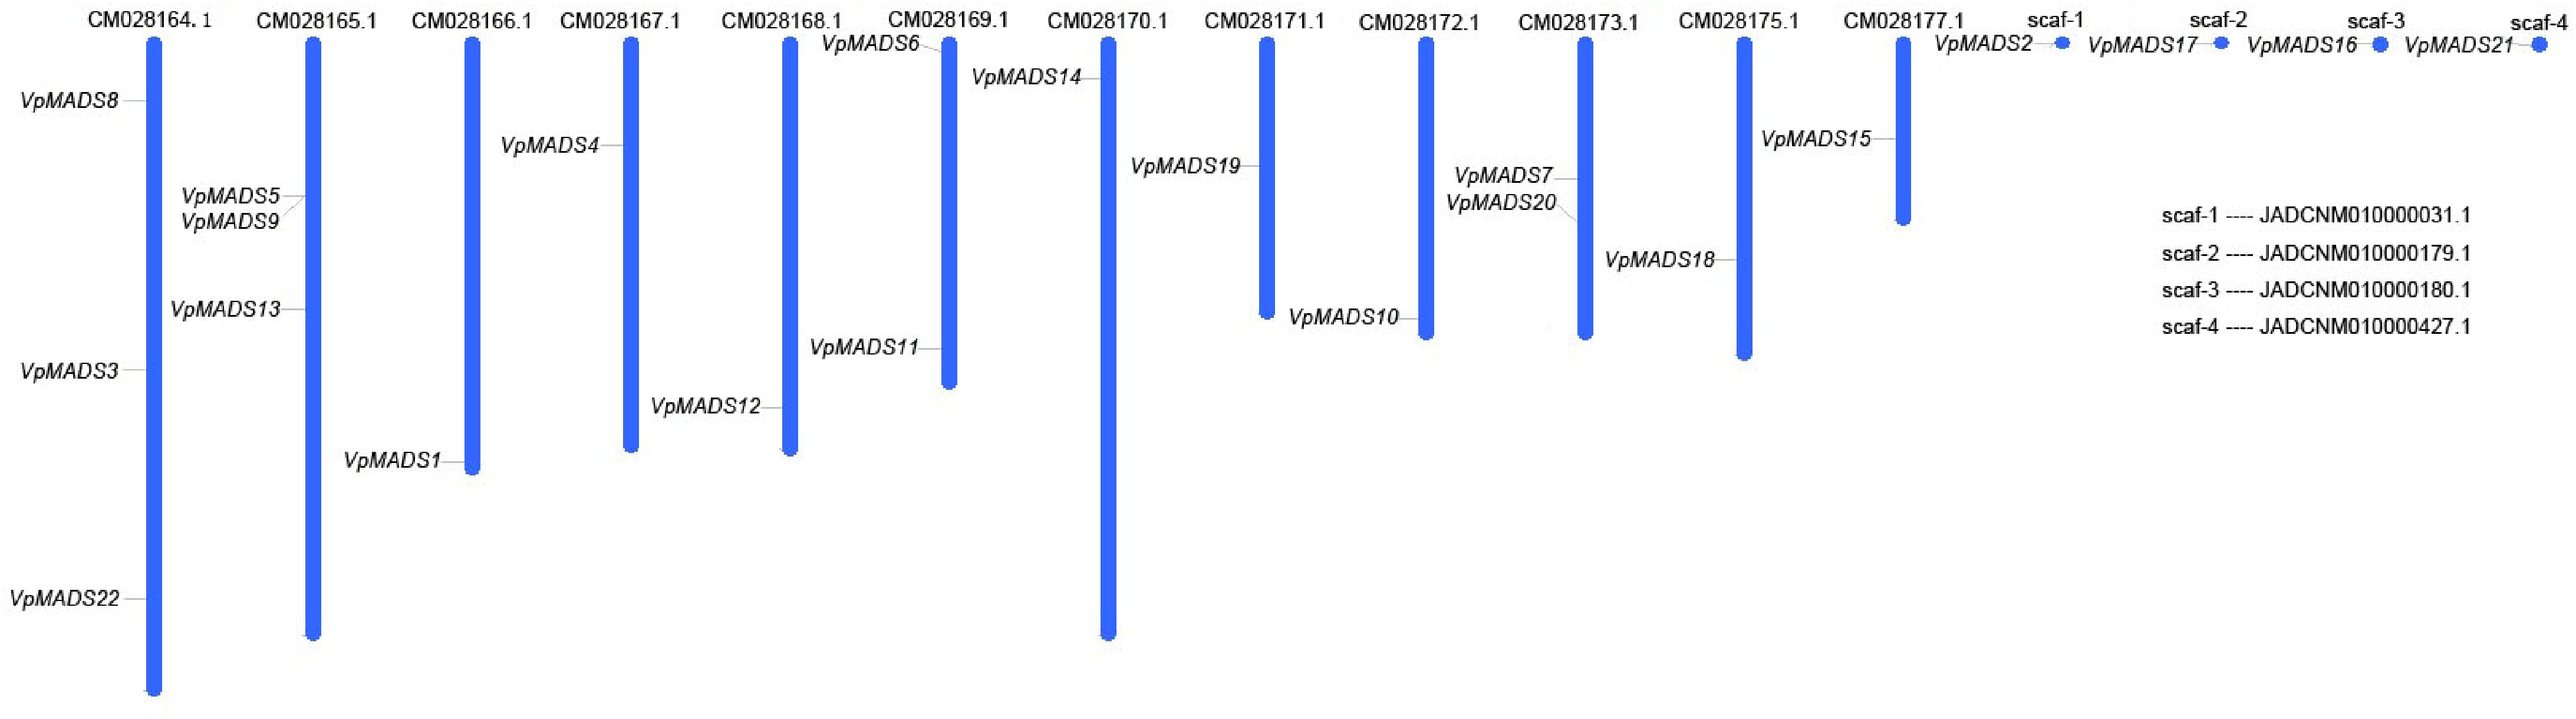
Figure 4.
Gene distributions of MIKCC type VpMADSs in V. planifolia.
-
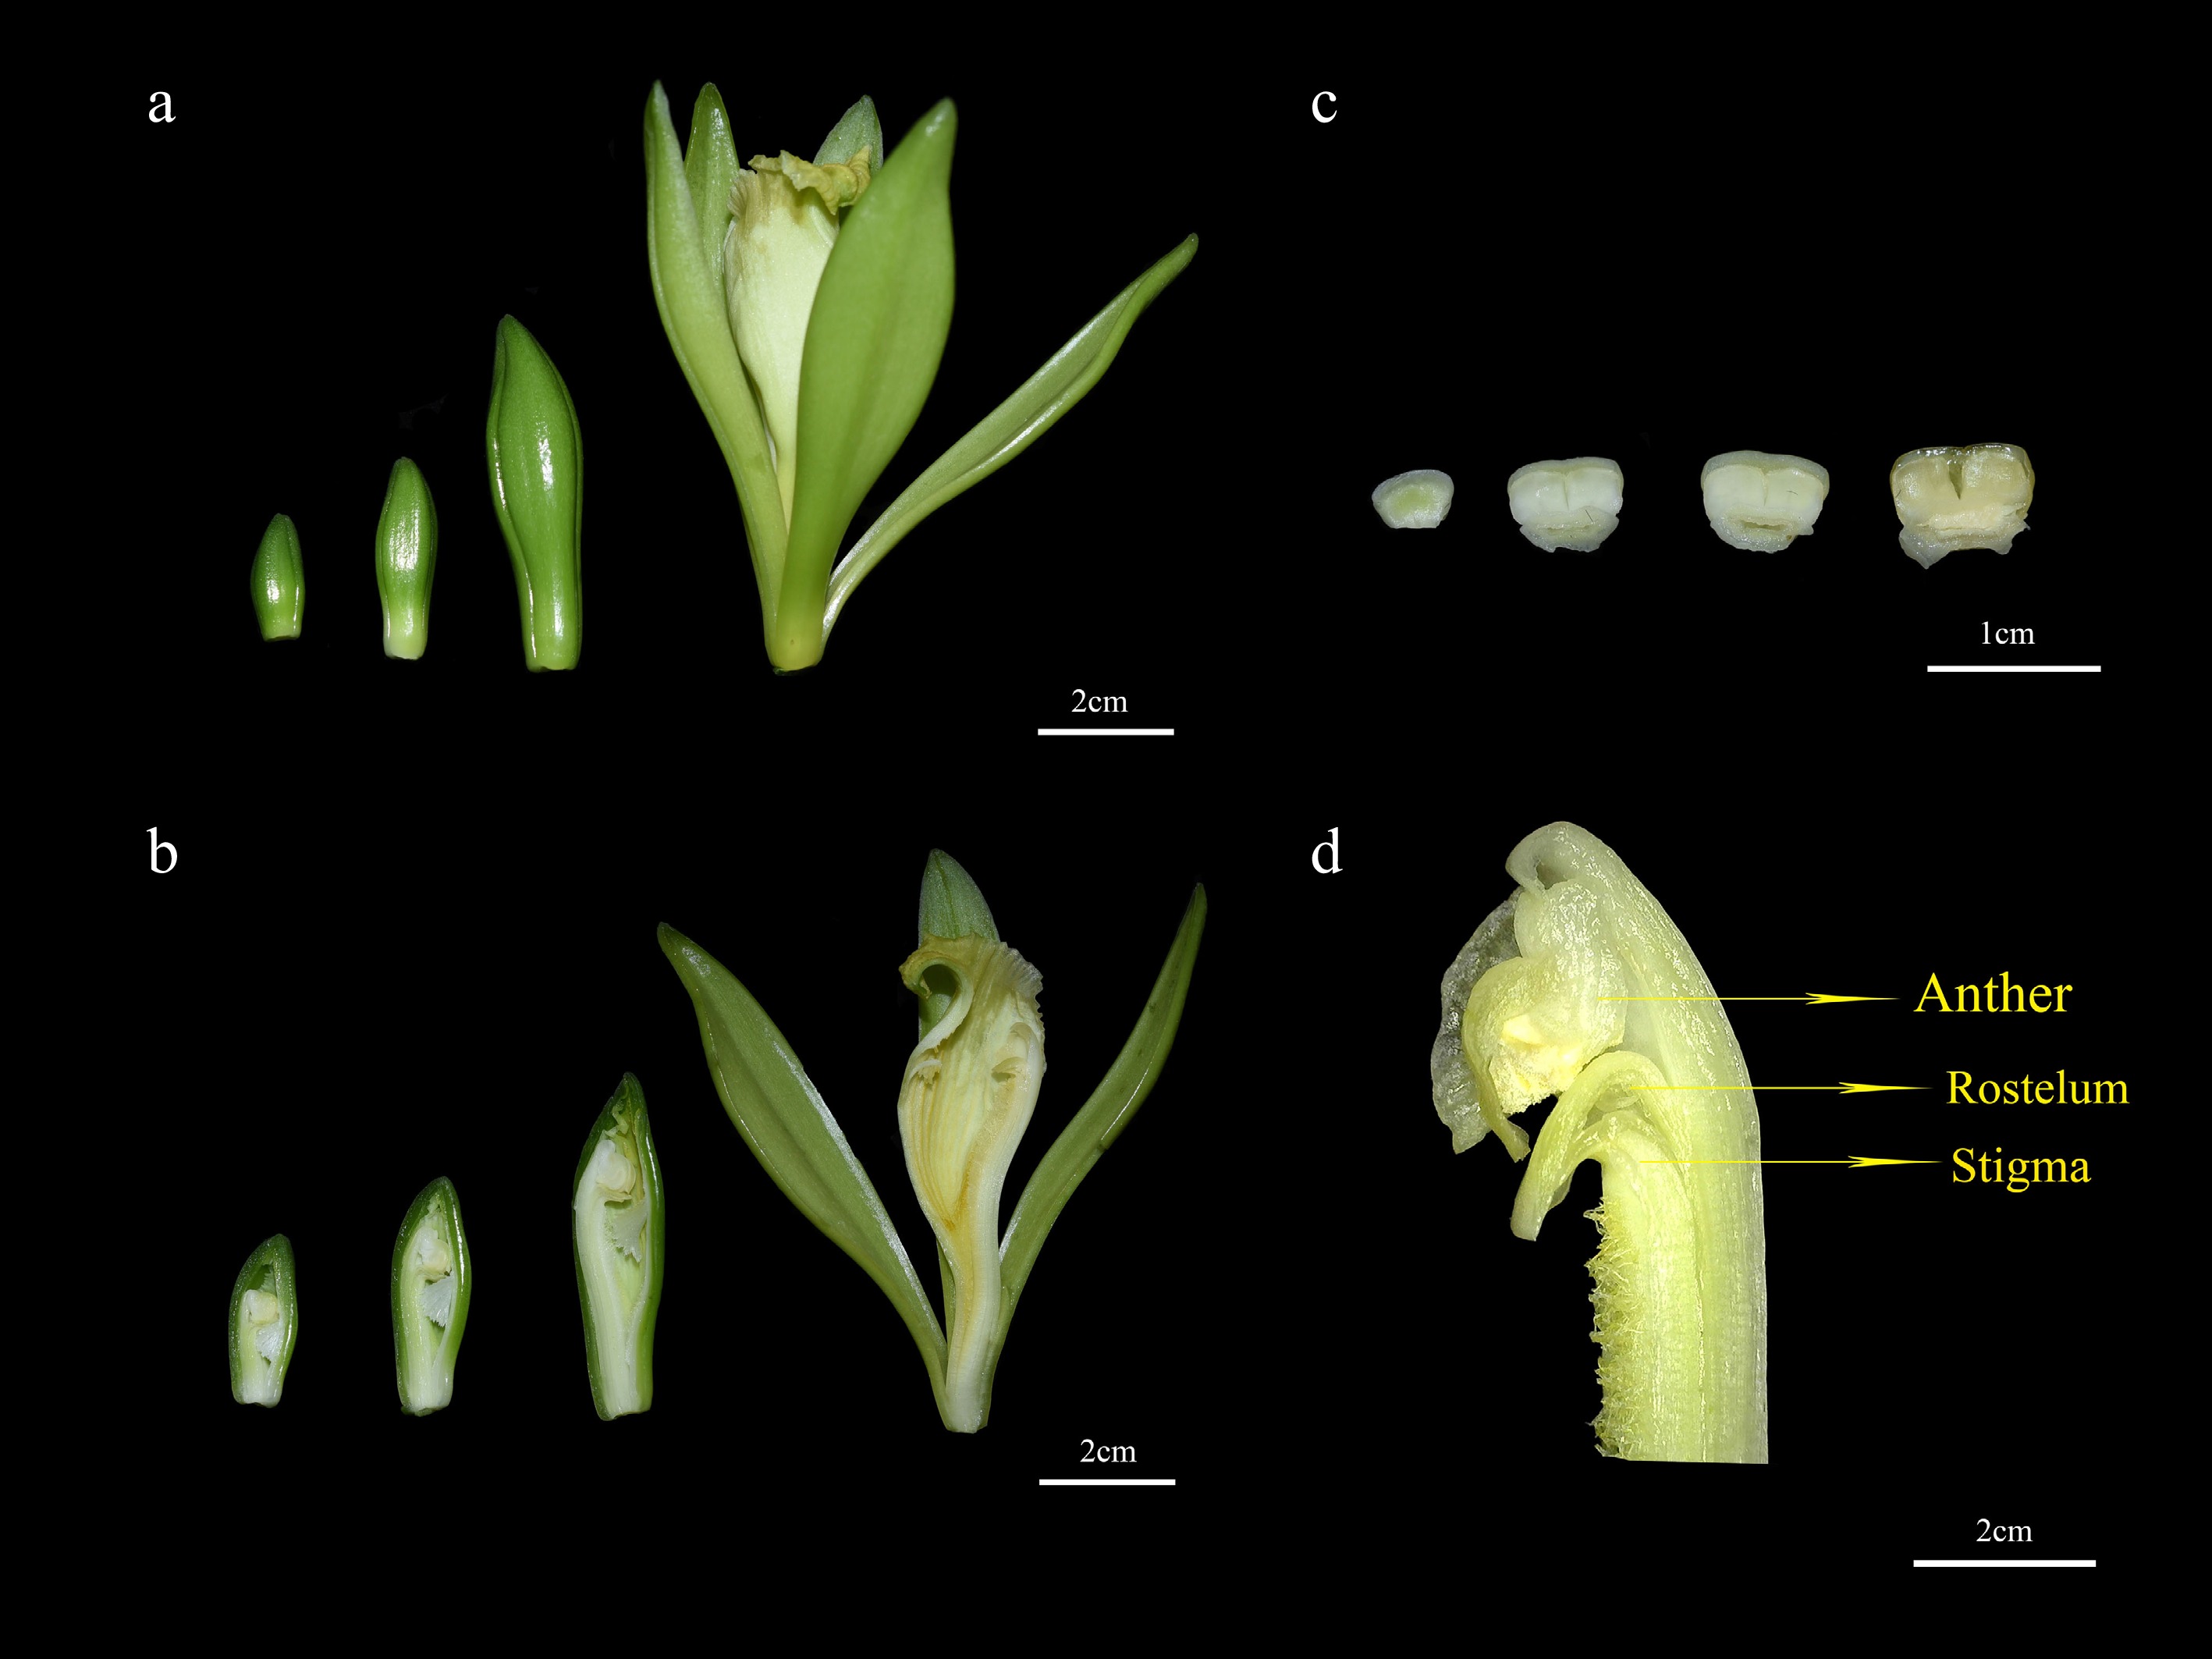
Figure 5.
Different periods and structures of V. planifolia flowers. (a) Whole flower in four stages S1 to S4 (from left to right); (b) flower internal structure S1 to S4 (from left to right); (c) rostellum S1 to S4 (from left to right); (d) magnified view of flower internal structure.
-
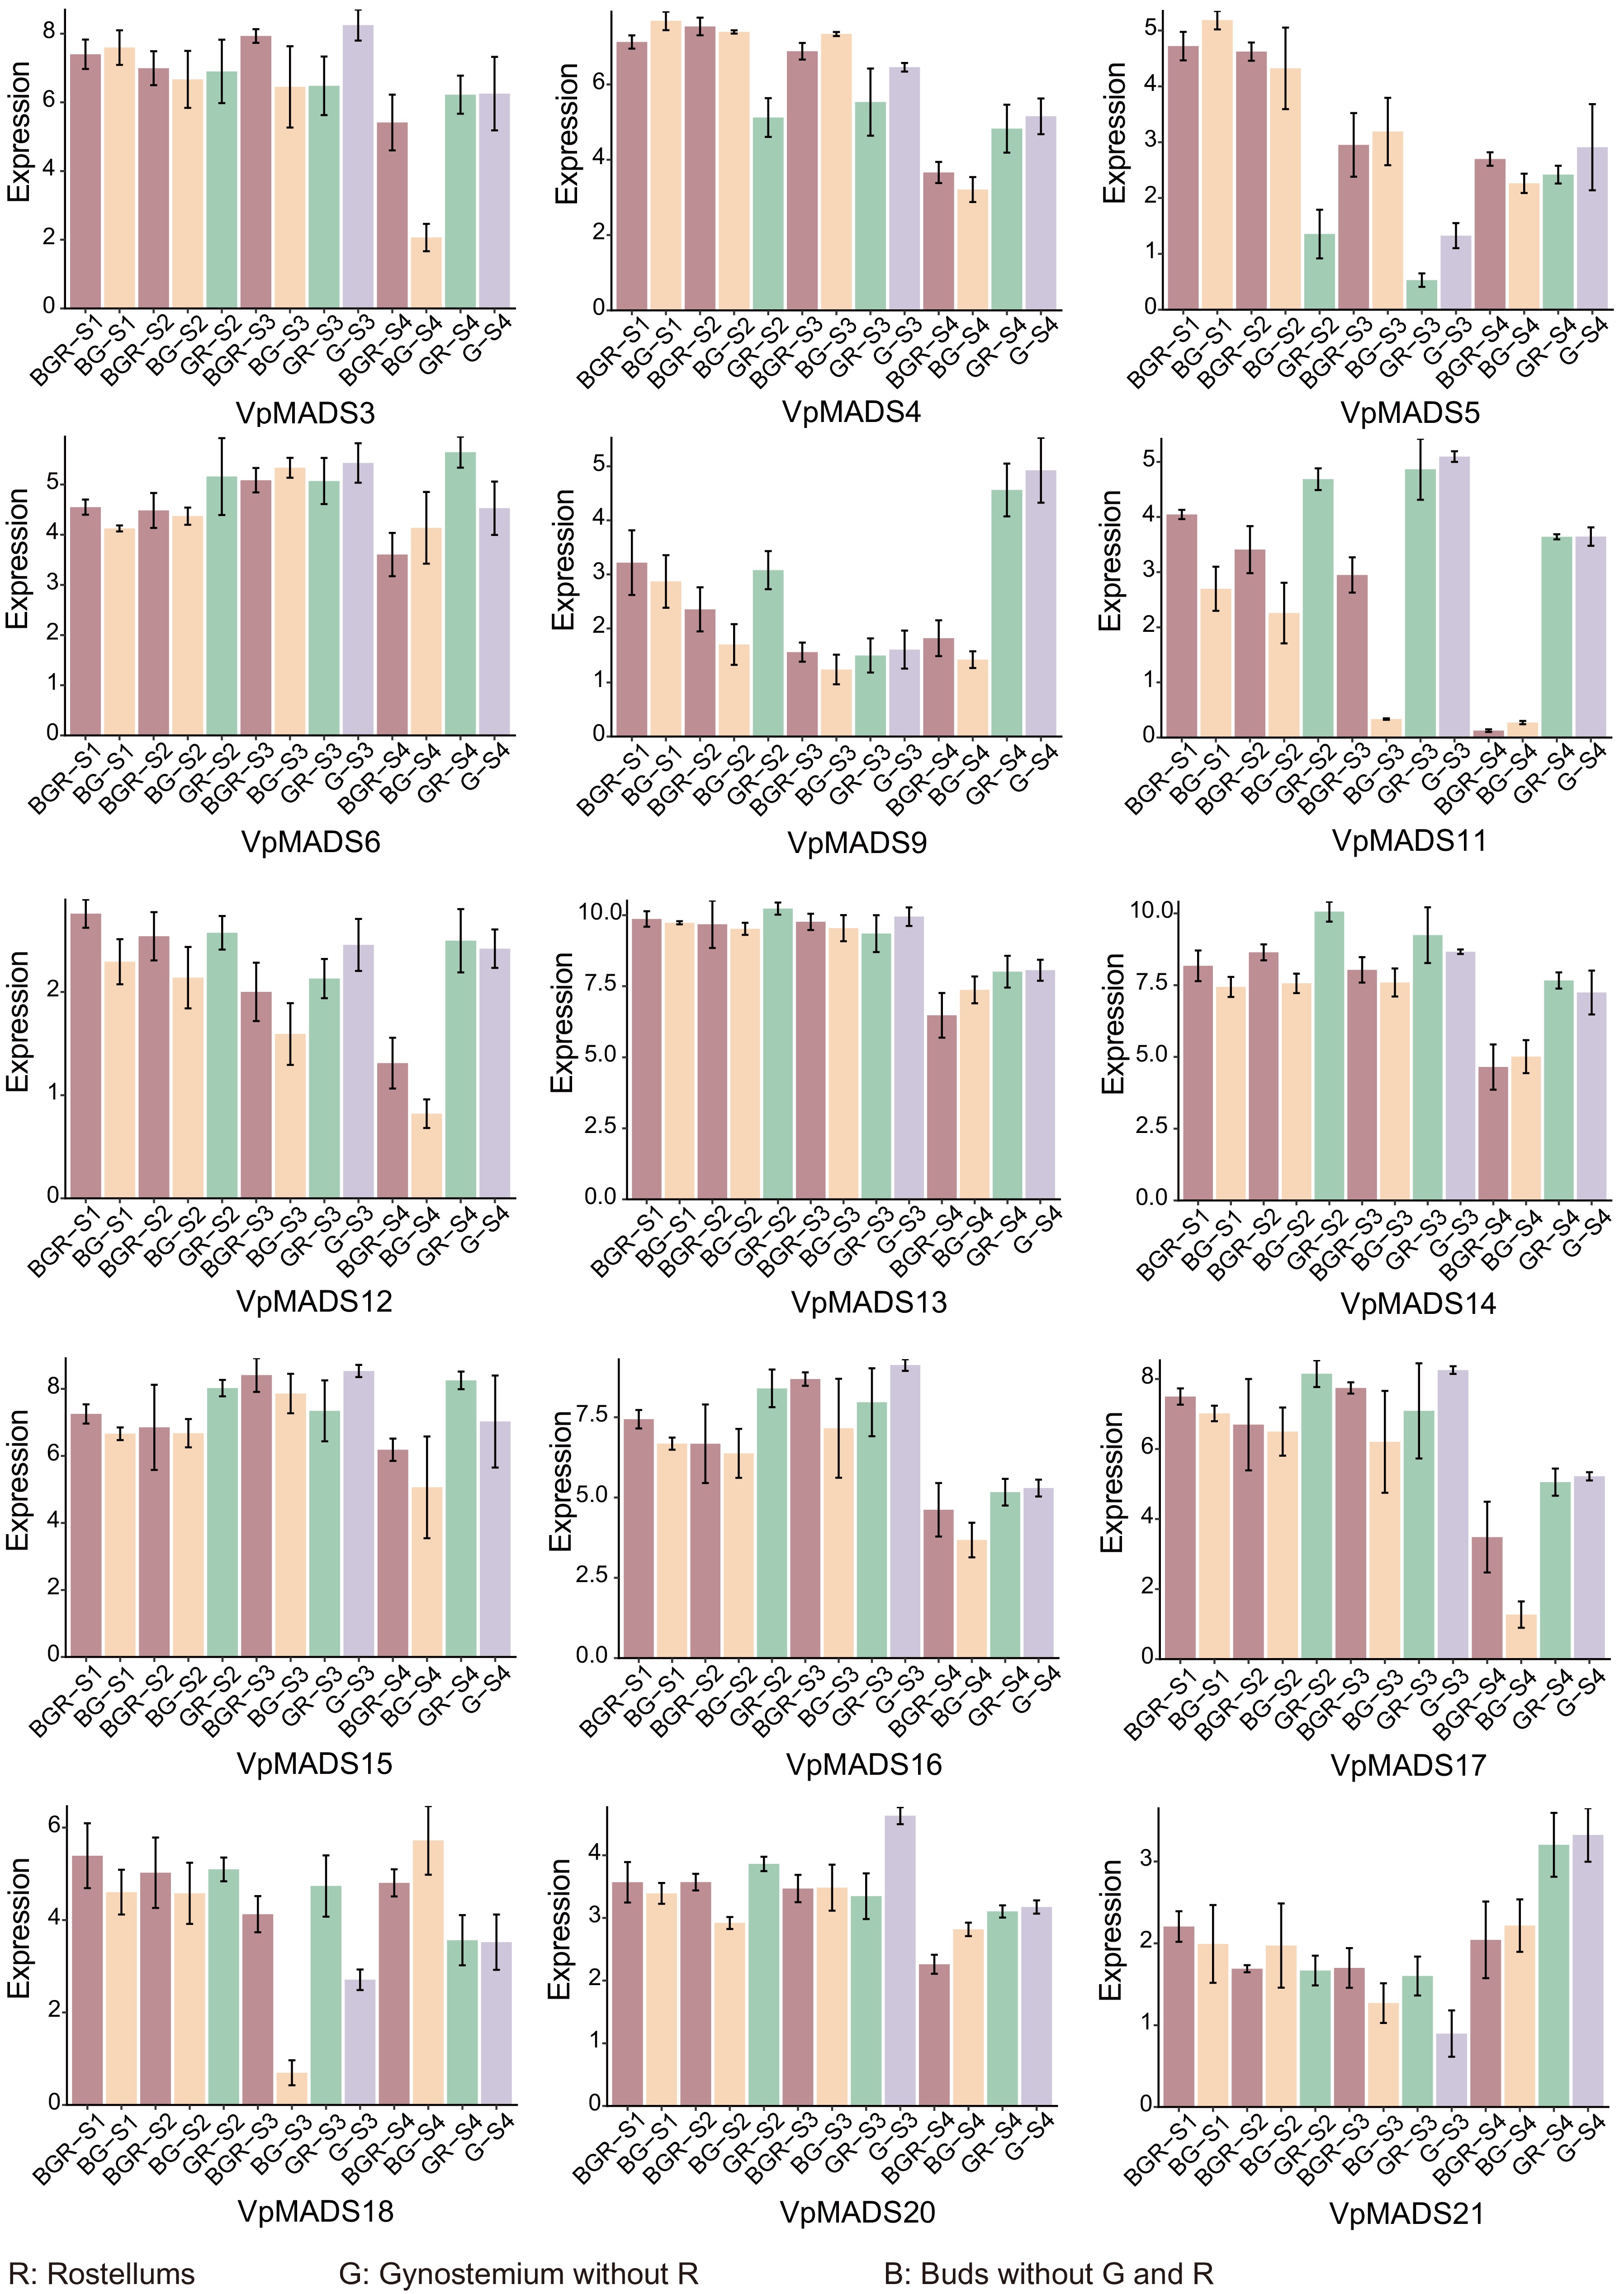
Figure 6.
The expression profiles of VpMADSs from RNA-seq data. The X-axis represented tissues including R (rostellum), G (gynostemiums without rostellums), and B (buds without gynostemium and rostellum). S1−S4 refer to the four stages displayed in Fig. 5. The Y-axis represented expression values after being standardized.
-
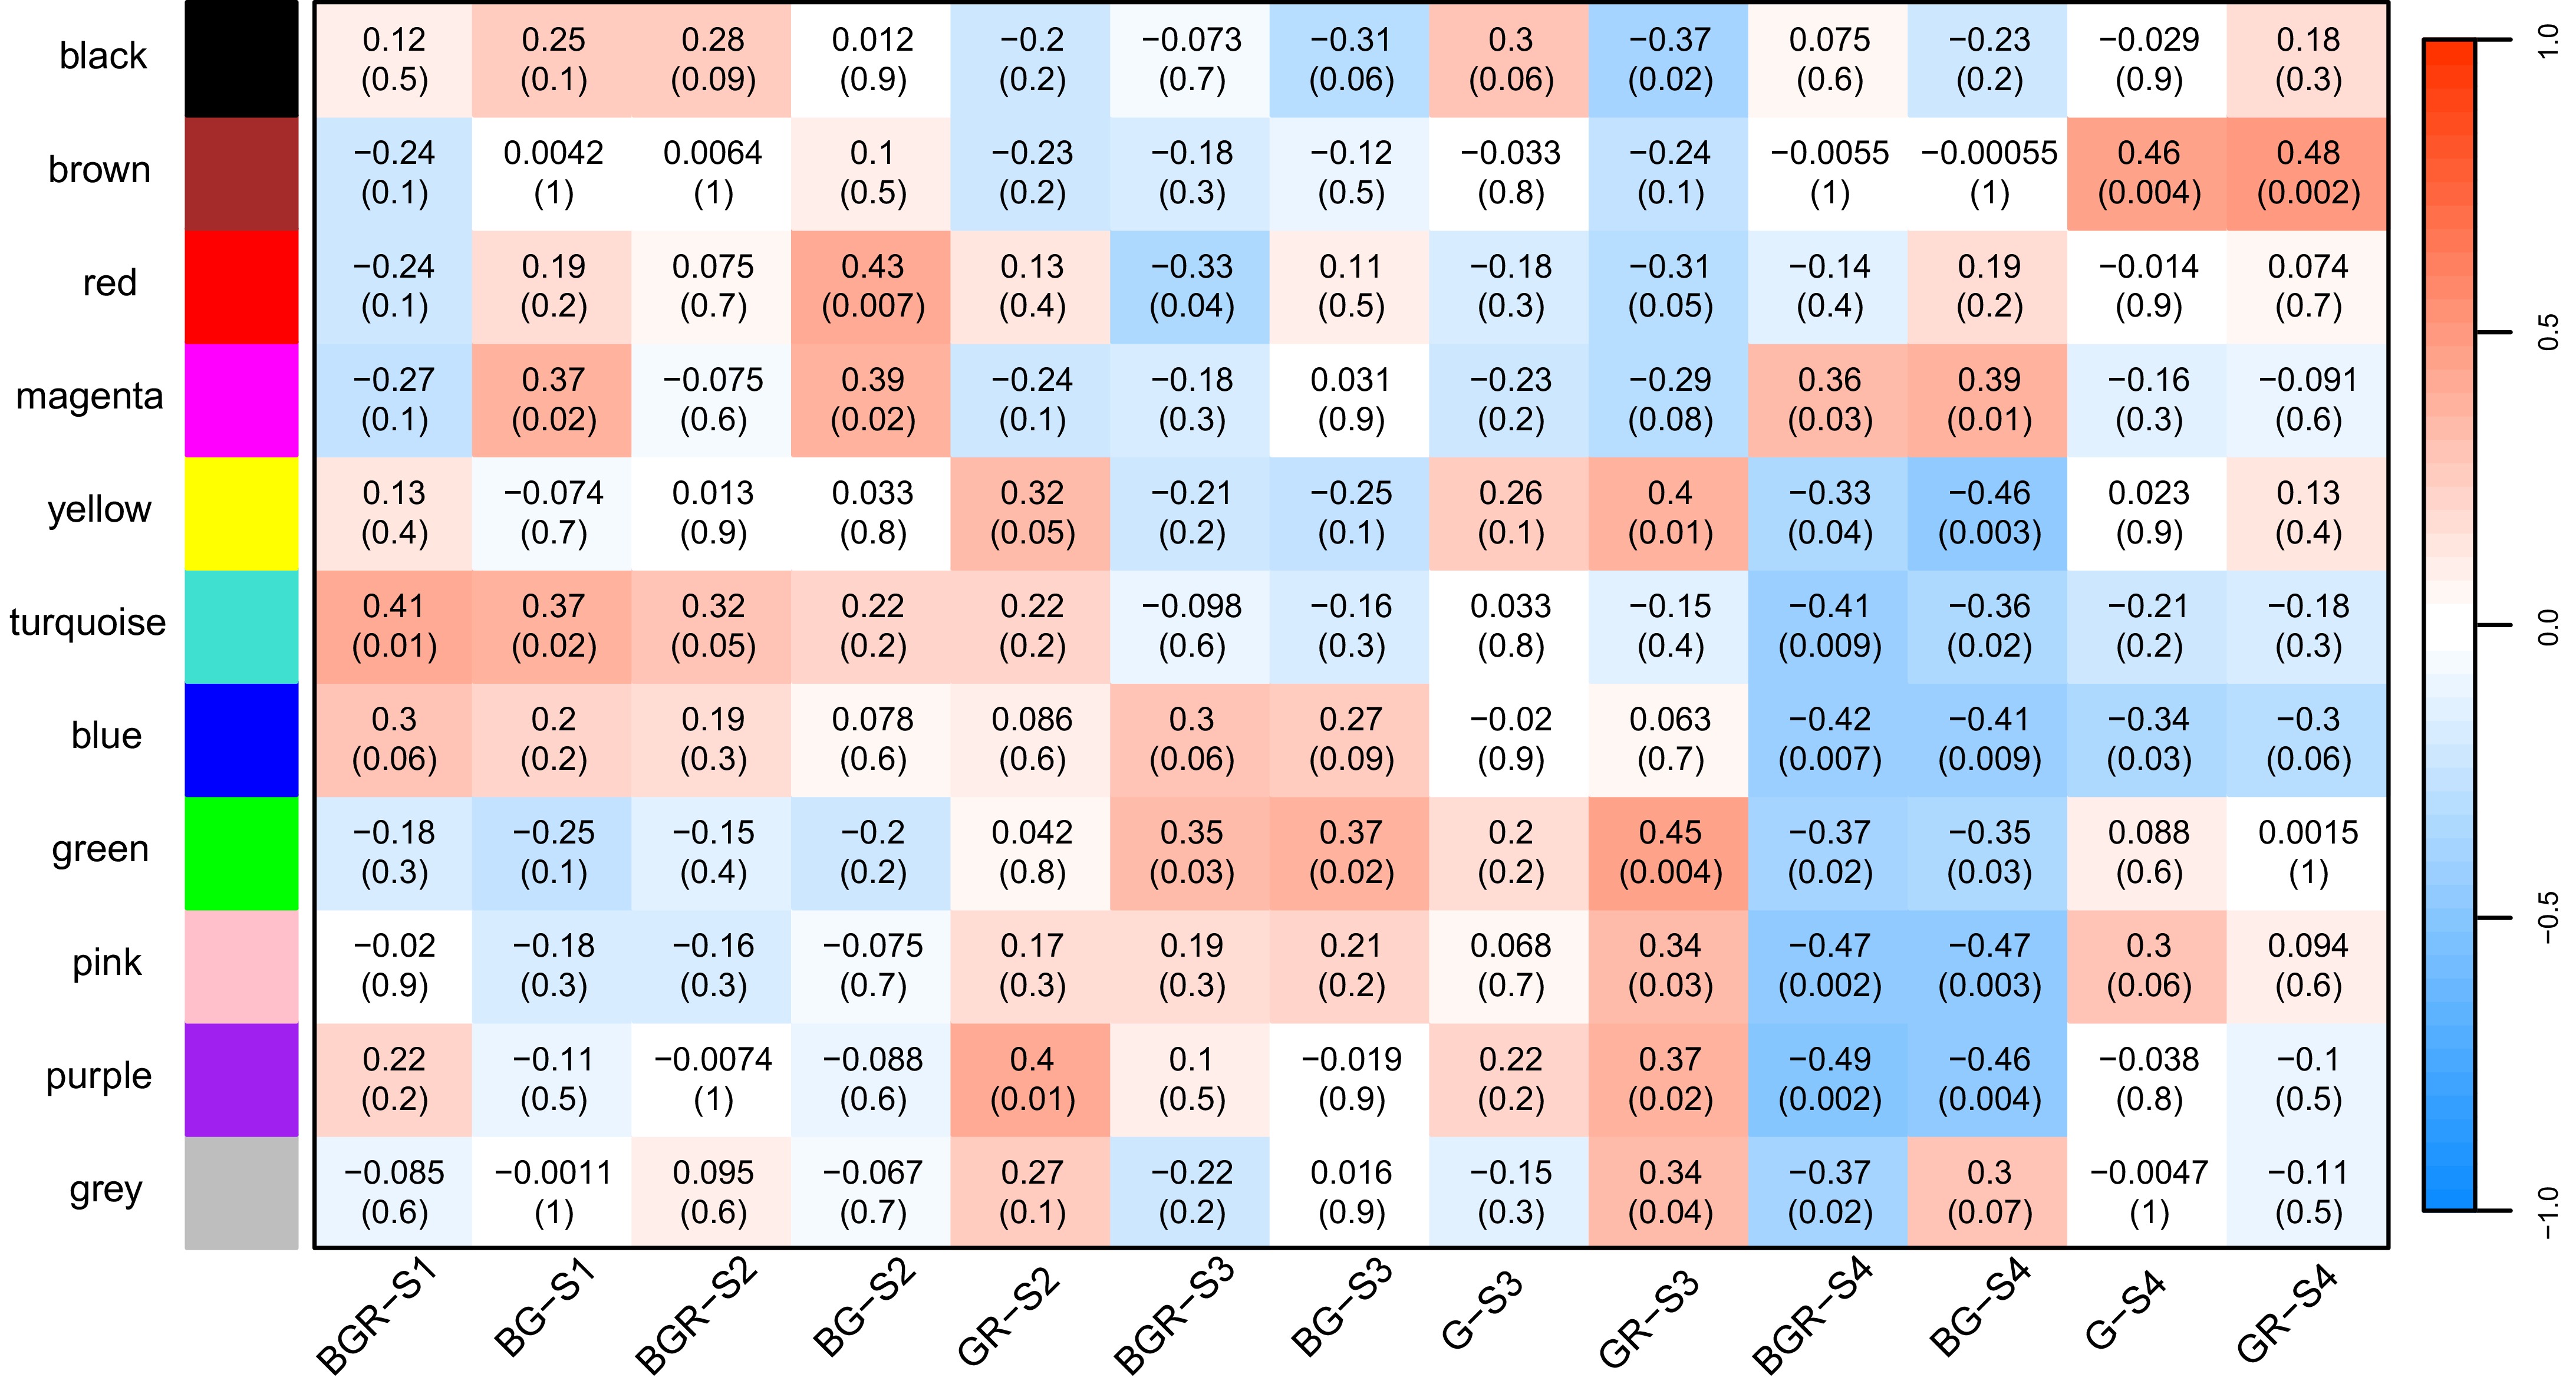
Figure 7.
The correlations between gene modules and tissues from WGCNA results. Each gene module was assigned a particular color. Greater than zero was a positive correlation, and less than zero was a negative correlation. The values in the module represent the magnitude of the correlation, and the values in parentheses denote the p-value.
-
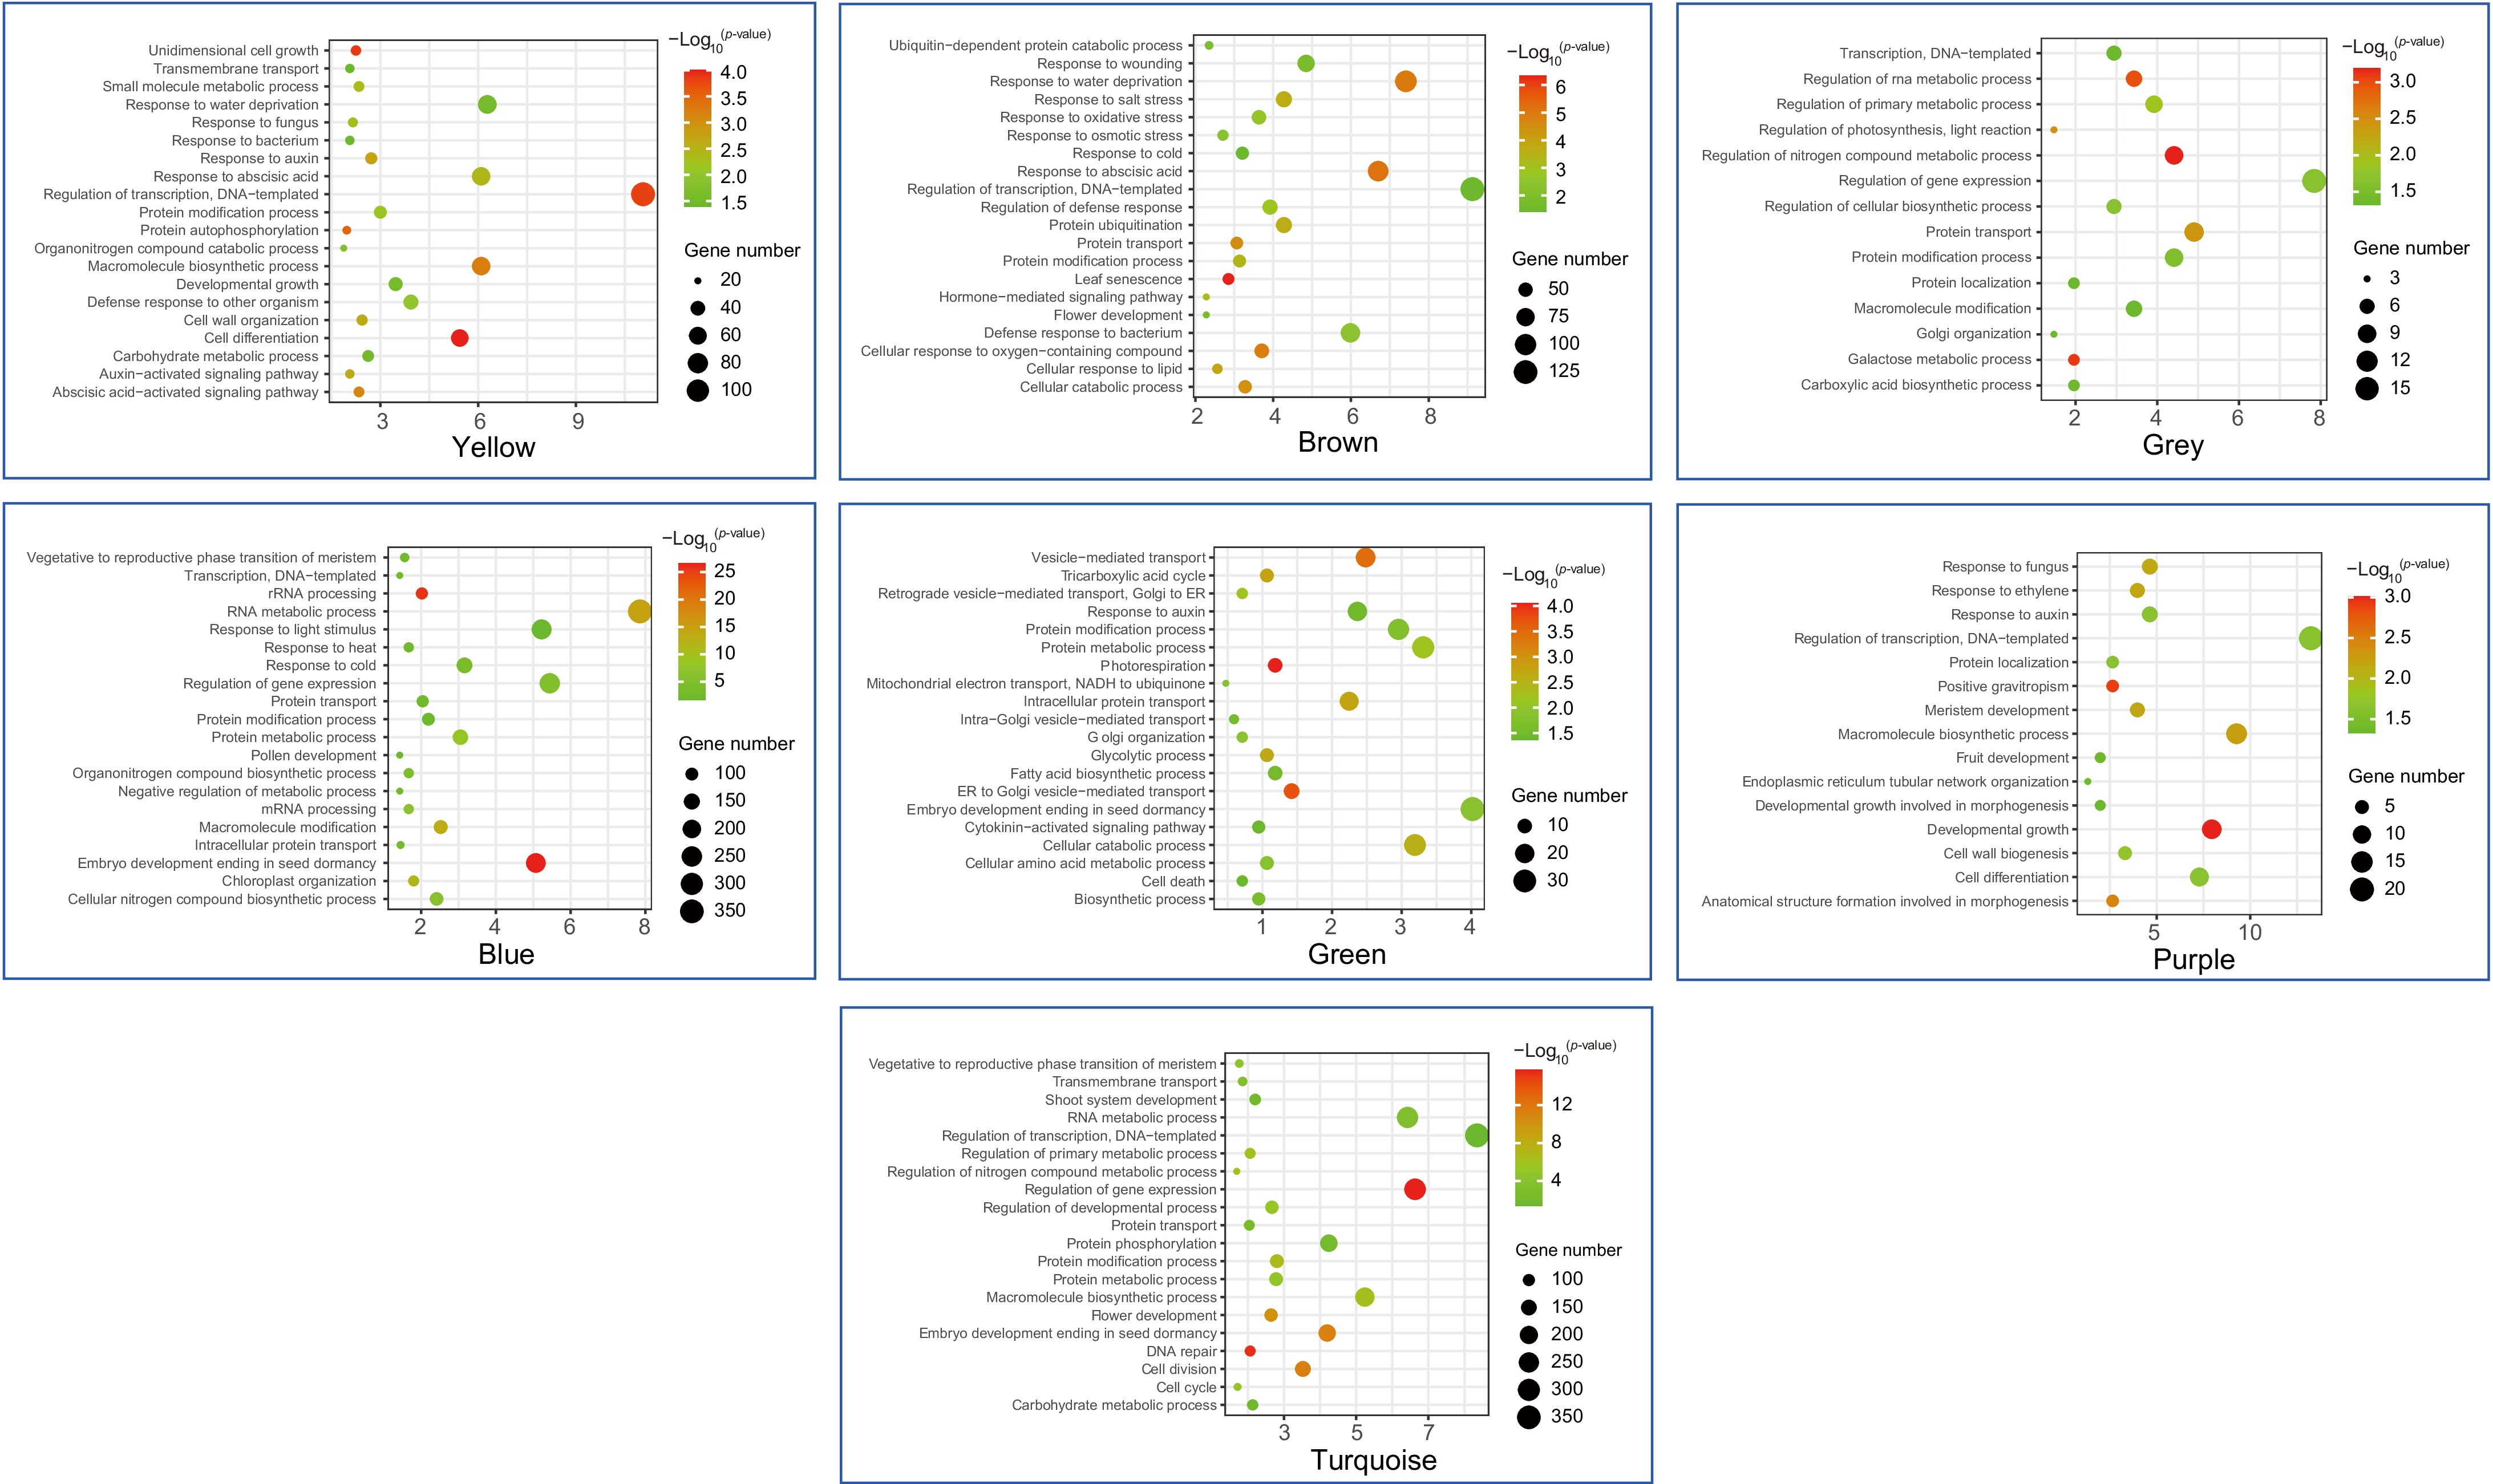
Figure 8.
The GO enrichment analysis of seven modules containing VpMADSs. Yellow, brown, grey, blue, green, purple, and turquoise meant different modules in WGCNA analysis.
-
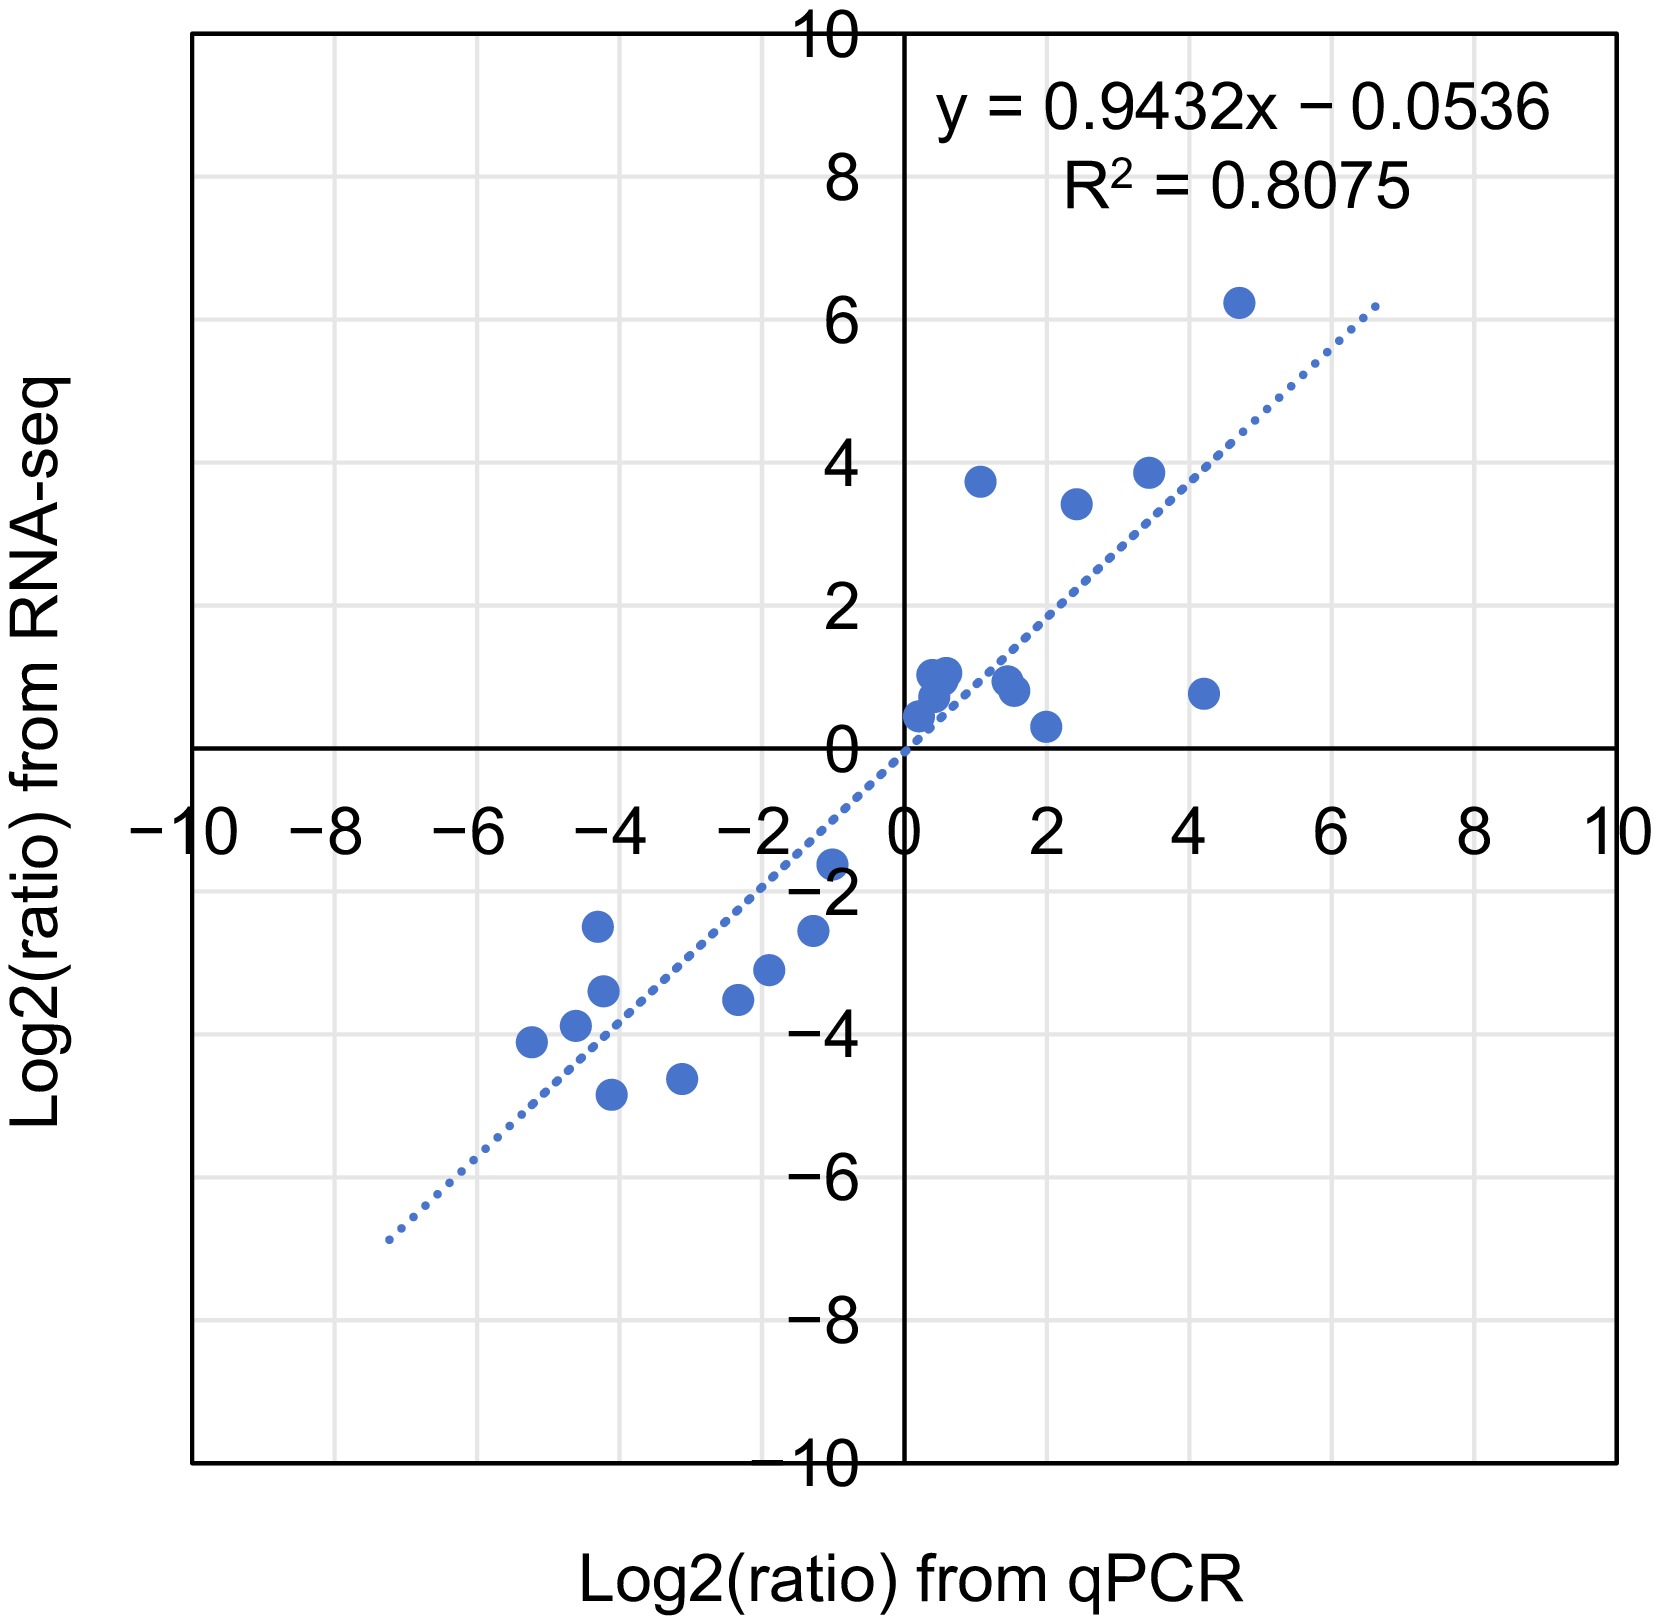
Figure 9.
Coefficient analysis of fold change data between qPCR and RNA-seq.
-
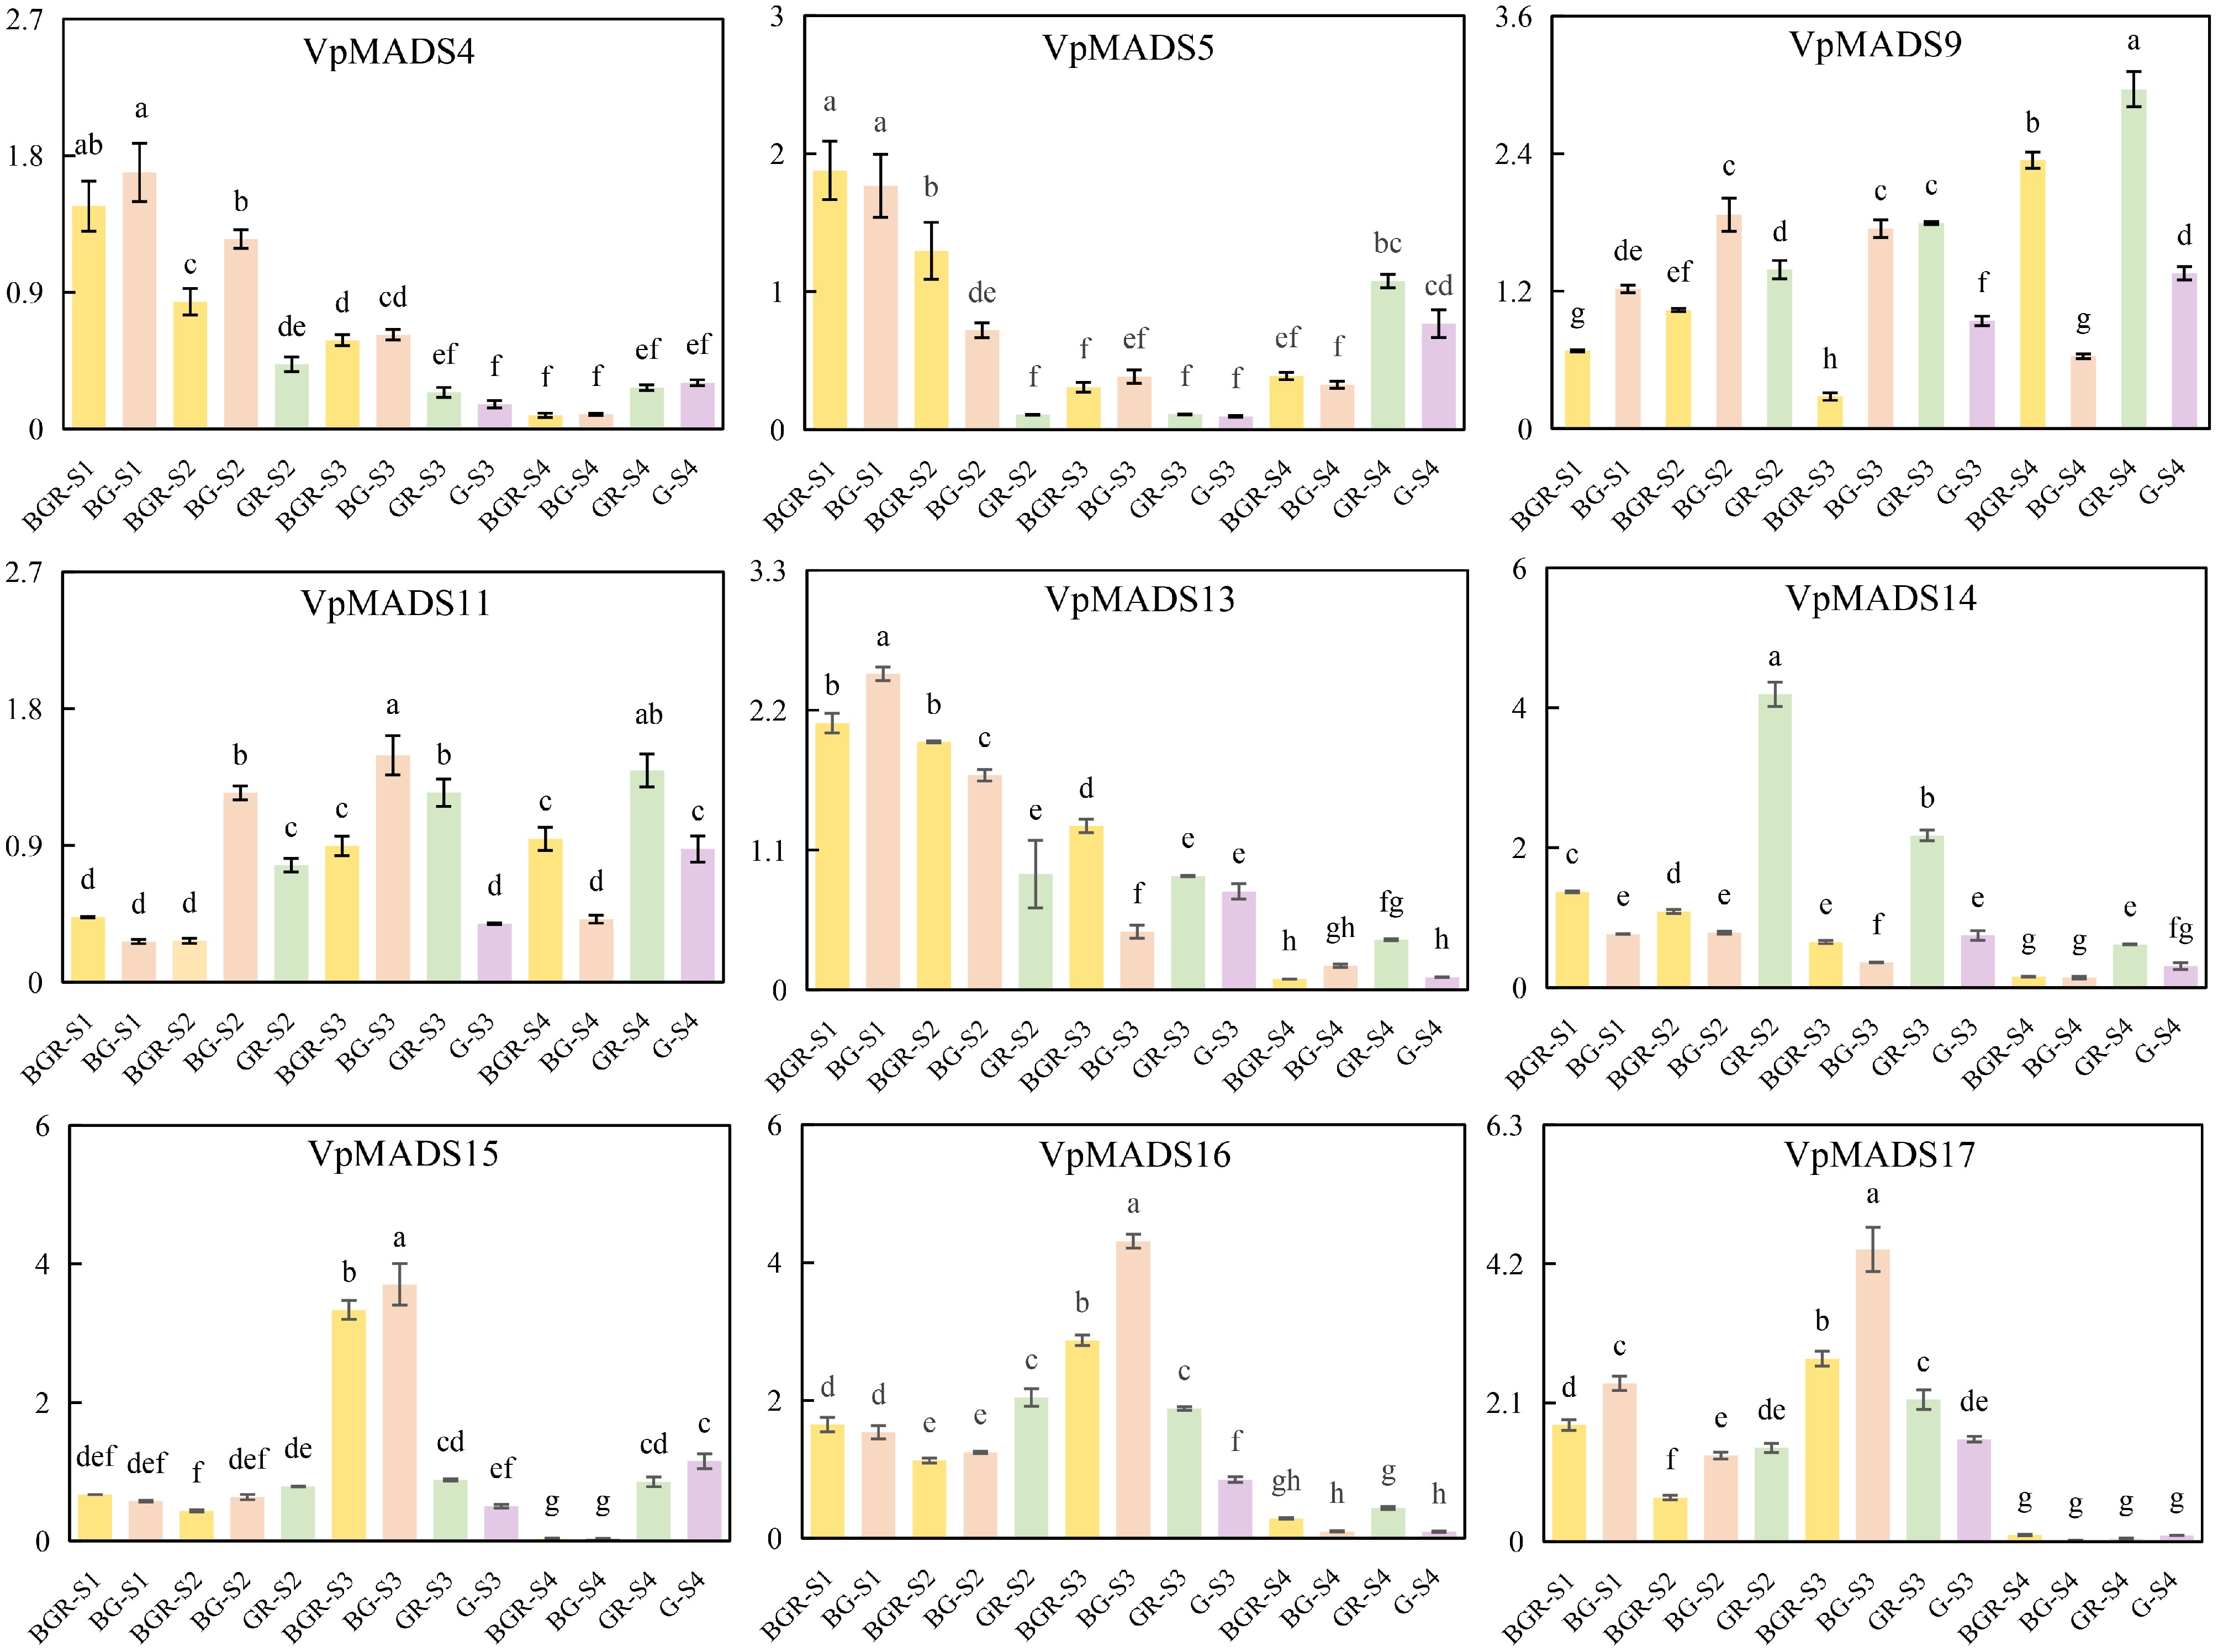
Figure 10.
The expression profiles of qRT-PCR results.
-
Number Gene name Gene ID Protein ID Chromosome Location Exon Lengths
(aa)Molecular
weight (kDa)pIs Instability
indexAliphatic
indexGRAVY Subcellular
locations1 VpMADS1 HPP92_008009 KAG0491146.1 CM028166.1 53926398−53889497 8 243 27.70 9.13 59.86 81.15 −0.627 nucl 2 VpMADS2 HPP92_025895 KAG0452056.1 Scaffold 4610−28001 5 143 16.72 9.95 50.35 86.57 −0.671 nucl 3 VpMADS3 HPP92_002365 KAG0502293.1 CM028164.1 41951176−41971594 8 239 27.47 10.18 46.05 75.19 −0.724 nucl 4 VpMADS4 HPP92_008272 KAG0486177.1 CM028167.1 13125651−13163619 13 333 37.84 8.46 38.89 76.55 −0.664 nucl 5 VpMADS5 HPP92_004657 KAG0493663.1 CM028165.1 19723207−19699540 7 170 19.48 10.28 37.52 76.94 −0.710 nucl 6 VpMADS6 HPP92_012311 KAG0477592.1 CM028169.1 913908−940568 7 233 27.02 8.74 55.83 78.84 −0.738 nucl 7 VpMADS7 HPP92_019641 KAG0465477.1 CM028173.1 1750461−7467554 11 273 31.37 10.01 58.54 73.66 −0.897 nucl 8 VpMADS8 HPP92_000523 KAG0500451.1 CM028164.1 7310328−7337810 8 238 27.74 9.66 58.97 76.68 −0.912 nucl 9 VpMADS9 HPP92_004659 KAG0493665.1 CM028165.1 19759650−19739731 7 206 23.77 7.44 59.50 88.50 −0.594 nucl 10 VpMADS10 HPP92_018645 KAG0469317.1 CM028172.1 35561818−35564488 8 196 22.62 9.65 49.77 93.06 −0.501 nucl 11 VpMADS11 HPP92_013585 KAG0478866.1 CM028169.1 39304241−39332580 8 306 35.00 10.09 48.99 84.54 −0.727 chlo 12 VpMADS12 HPP92_011874 KAG0483790.1 CM028168.1 46902542−46875786 6 158 18.43 9.89 48.19 89.49 −0.715 nucl 13 VpMADS13 HPP92_005378 KAG0494384.1 CM028165.1 34246112−34242902 7 210 24.46 9.73 54.20 80.33 −0.847 nucl 14 VpMADS14 HPP92_014026 KAG0474340.1 CM028170.1 4454990−4456550 7 227 26.12 9.79 30.65 76.43 −0.690 nucl 15 VpMADS15 HPP92_025189 KAG0453885.1 CM028177.1 12379231−12385185 7 226 26.11 9.4 37.58 71.19 −0.907 nucl 16 VpMADS16 HPP92_027258 KAG0449499.1 Scaffold 27238−28686 7 224 25.72 8.59 33.14 75.76 −0.816 nucl 17 VpMADS17 HPP92_027253 KAG0449534.1 Scaffold 23870−25317 7 224 25.75 8.59 32.46 75.31 −0.827 nucl 18 VpMADS18 HPP92_022688 KAG0459560.1 CM028175.1 27880086−27881205 6 199 23.30 6.26 55.70 90.10 −0.734 nucl 19 VpMADS19 HPP92_016068 KAG0471522.1 CM028171.1 15727789−15751238 6 237 27.44 6.86 53.86 85.61 −0.701 nucl 20 VpMADS20 HPP92_019895 KAG0465731.1 CM028173.1 22873092−22859226 8 233 26.90 9.95 44.53 80.39 −0.768 nucl 21 VpMADS21 HPP92_028185 KAG0447715.1 Scaffold 162889−180657 8 241 27.70 9.55 50.31 88.96 0.673 nucl 22 VpMADS22 HPP92_003653 KAG0503581.1 CM028164.1 71467560−71483956 8 236 26.67 9.49 52.95 85.97 −0.676 nucl 23 VpMADS23 HPP92_018187 KAG0468859.1 CM028172.1 25621594−25623473 2 397 43.42 8.33 51.10 75.47 −0.390 nucl 24 VpMADS24 HPP92_018217 KAG0468889.1 CM028172.1 25806044−25805443 1 201 22.20 10.51 49.06 84.48 −0.359 nucl 25 VpMADS25 HPP92_018216 KAG0468888.1 CM028172.1 25804775−25804159 1 206 22.59 5.89 57.61 69.66 −0.424 nucl 26 VpMADS26 HPP92_024103 KAG0456315.1 CM028176.1 13269344−13271121 2 227 25.23 8.38 42.41 69.25 −0.348 chlo 27 VpMADS27 HPP92_007552 KAG0490689.1 CM028166.1 47024798−47015510 2 285 30.46 7.84 49.59 76.35 −0.161 chlo 28 VpMADS28 HPP92_015891 KAG0471345.1 CM028171.1 8420535−8419862 1 225 24.75 9.32 56.46 79.47 −0.323 mito 29 VpMADS29 HPP92_017597 KAG0468269.1 CM028172.1 7523285−7522378 1 303 34.16 3.95 75.21 66.40 −0.351 cyto,nucl 30 VpMADS30 HPP92_020940 KAG0462464.1 CM028174.1 24936725−24936913 1 62 71.15 11.24 46.35 81.77 −0.715 cyto 31 VpMADS31 HPP92_021120 KAG0462644.1 CM028174.1 30103735−30104316 1 193 21.65 4.35 49.19 81.92 −0.244 nucl 32 VpMADS32 HPP92_003394 KAG0503322.1 CM028164.1 65572515−65571935 1 194 21.89 4.43 43.42 88.56 −0.268 nucl 33 VpMADS33 HPP92_021141 KAG0462665.1 CM028174.1 30322958−30322552 1 136 15.02 8.49 48.82 71.91 −0.425 chlo 34 VpMADS34 HPP92_021123 KAG0462647.1 CM028174.1 30109707−30110117 1 136 15.02 8.49 51.65 77.57 −0.421 nucl 35 VpMADS35 HPP92_018629 KAG0469301.1 CM028172.1 35292006−35292752 1 248 27.44 5.06 54.23 86.45 −0.328 mito 36 VpMADS36 HPP92_001001 KAG0500929.1 CM028164.1 17746641−17746100 1 181 20.59 11.87 98.81 70.17 −0.703 chlo 37 VpMADS37 HPP92_001047 KAG0500975.1 CM028164.1 18592118−18591250 1 290 31.94 8.37 71.18 75.41 −0.388 chlo 38 VpMADS38 HPP92_016507 KAG0471961.1 CM028171.1 25992721−25993493 2 232 26.96 9.85 55.03 72.33 −0.736 nucl 39 VpMADS39 HPP92_010957 KAG0482873.1 CM028168.1 21521752−21514509 10 334 38.02 5.63 52.66 78.50 −0.678 nucl 40 VpMADS40 HPP92_024526 KAG0456738.1 CM028176.1 20634534−20642107 5 158 18.14 9.28 58.00 58.10 −0.872 nucl 41 VpMADS41 HPP92_024533 KAG0456745.1 CM028176.1 20692383−20699955 5 158 18.22 9.24 55.56 58.10 −0.875 nucl 42 VpMADS42 HPP92_012718 KAG0477999.1 CM028169.1 8293060−8290817 3 93 10.50 9.88 43.58 93.33 −0.269 nucl 43 VpMADS43 HPP92_007709 KAG0490846.1 CM028166.1 49599440−49599250 1 64 7.44 10.46 74.37 88.44 −0.608 nucl 44 VpMADS44 HPP92_009109 KAG0487014.1 CM028167.1 33211407−33248681 9 292 32.97 8.6 42.97 93.84 −0.020 nucl 45 VpMADS45 HPP92_025155 KAG0453851.1 CM028177.1 11703058−11704492 2 62 7.08 10.81 48.70 84.84 −0.369 nucl 46 VpMADS46 HPP92_027213 KAG0449578.1 Scaffold 20952−21112 1 53 6.09 11.03 62.05 88.30 −0.232 nucl 47 VpMADS47 HPP92_004675 KAG0493681.1 CM028165.1 20125812−20119937 5 157 18.10 10.82 79.68 64.01 −0.810 nucl Table 1.
Characterization information of MADS-box genes in V. planifolia.
Figures
(10)
Tables
(1)