-
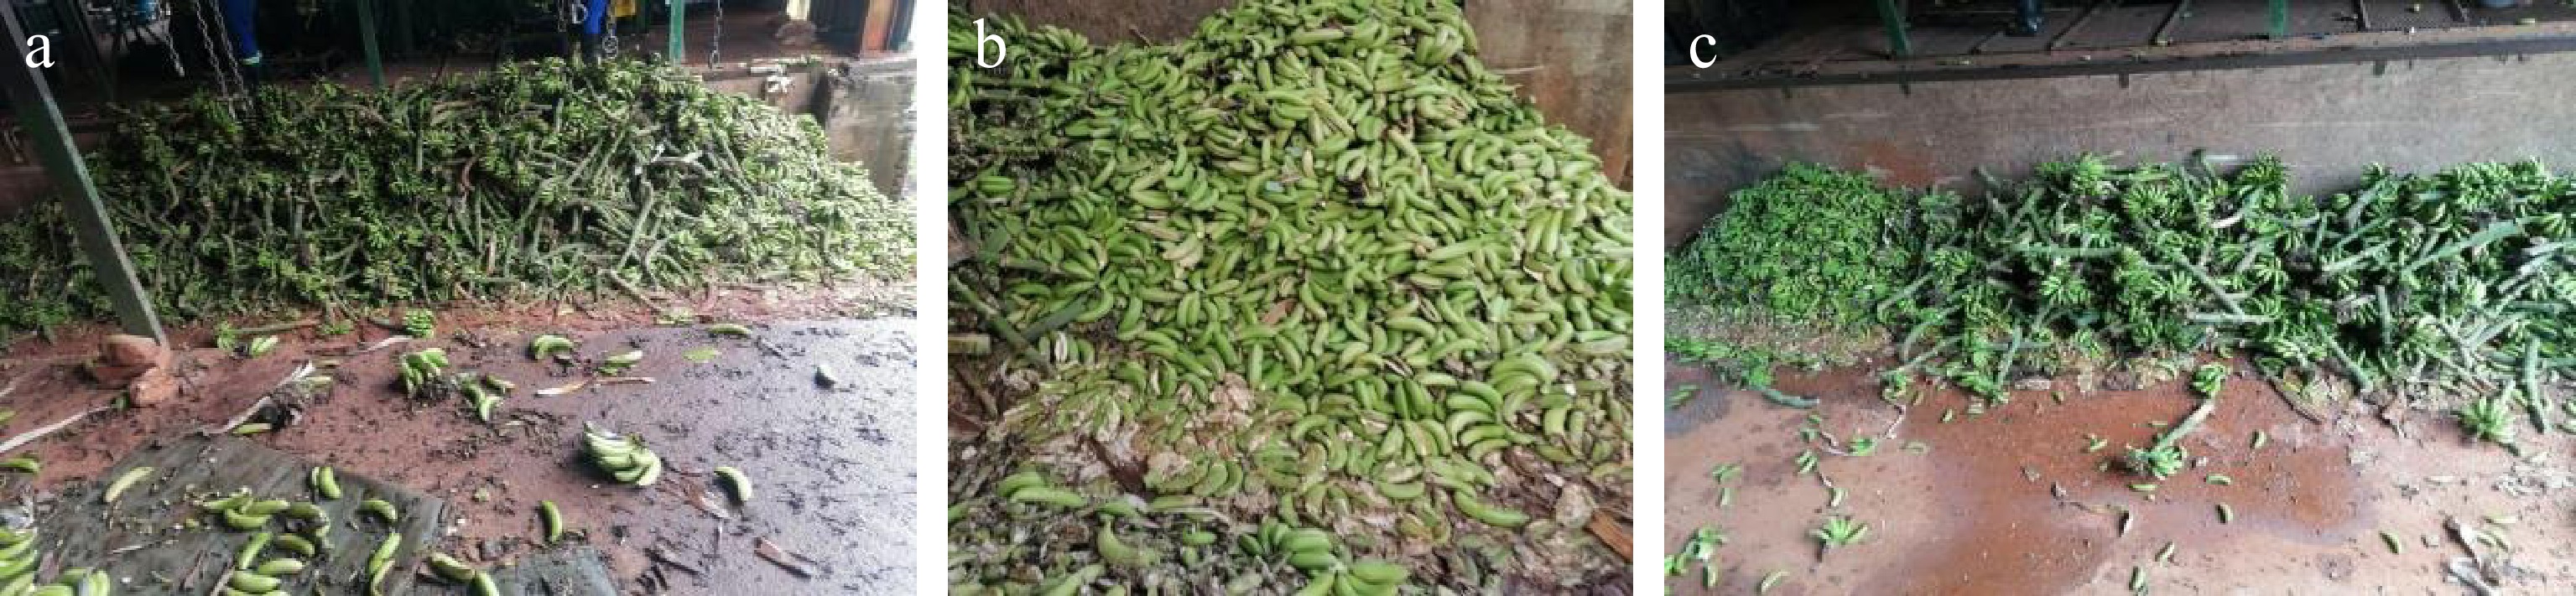
Figure 1.
(a)−(c) Loss of bananas due to improper harvesting and handling. Source: Field survey 2024.
-
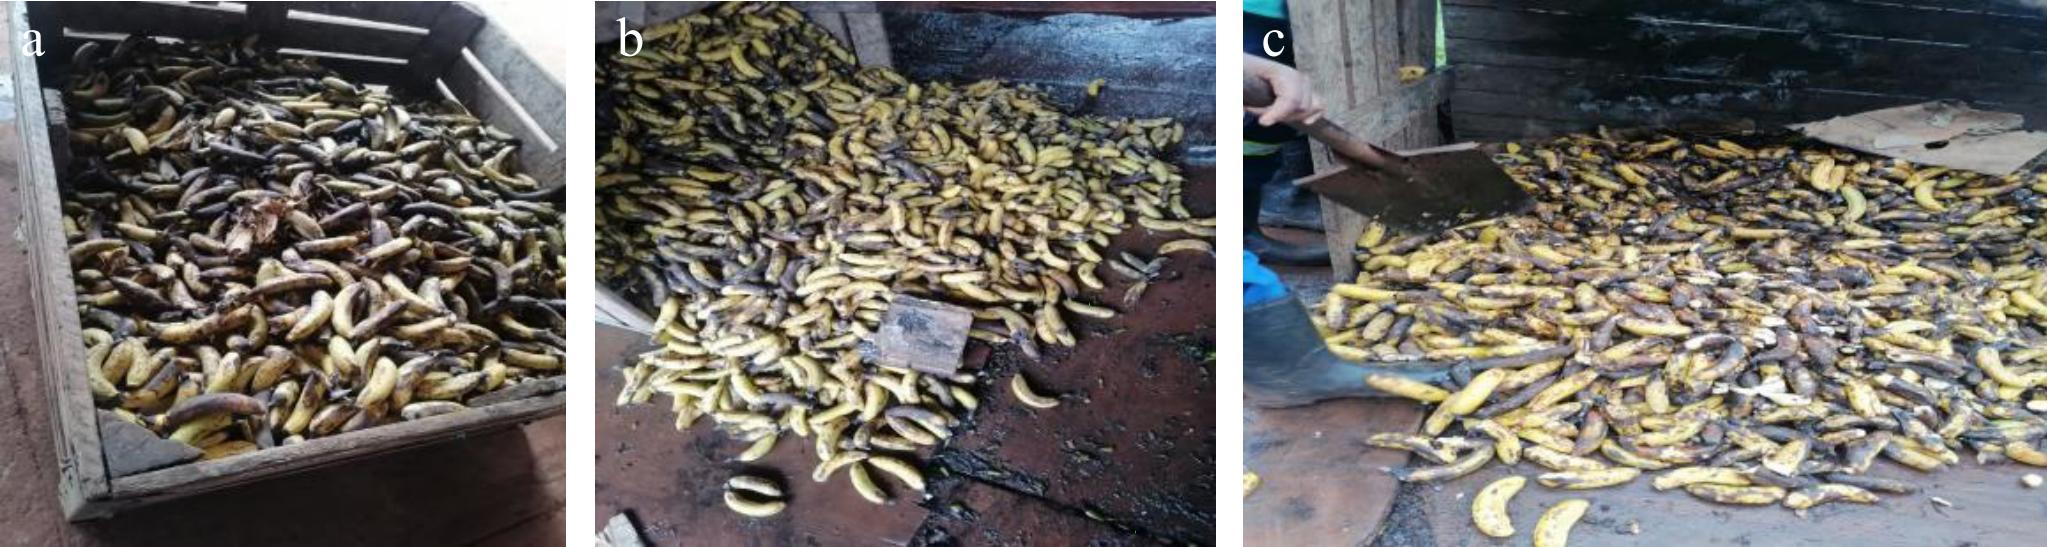
Figure 2.
(a)−(c) Loss of bananas due to improper packaging and lack of market information. Source: Field survey 2024.
-
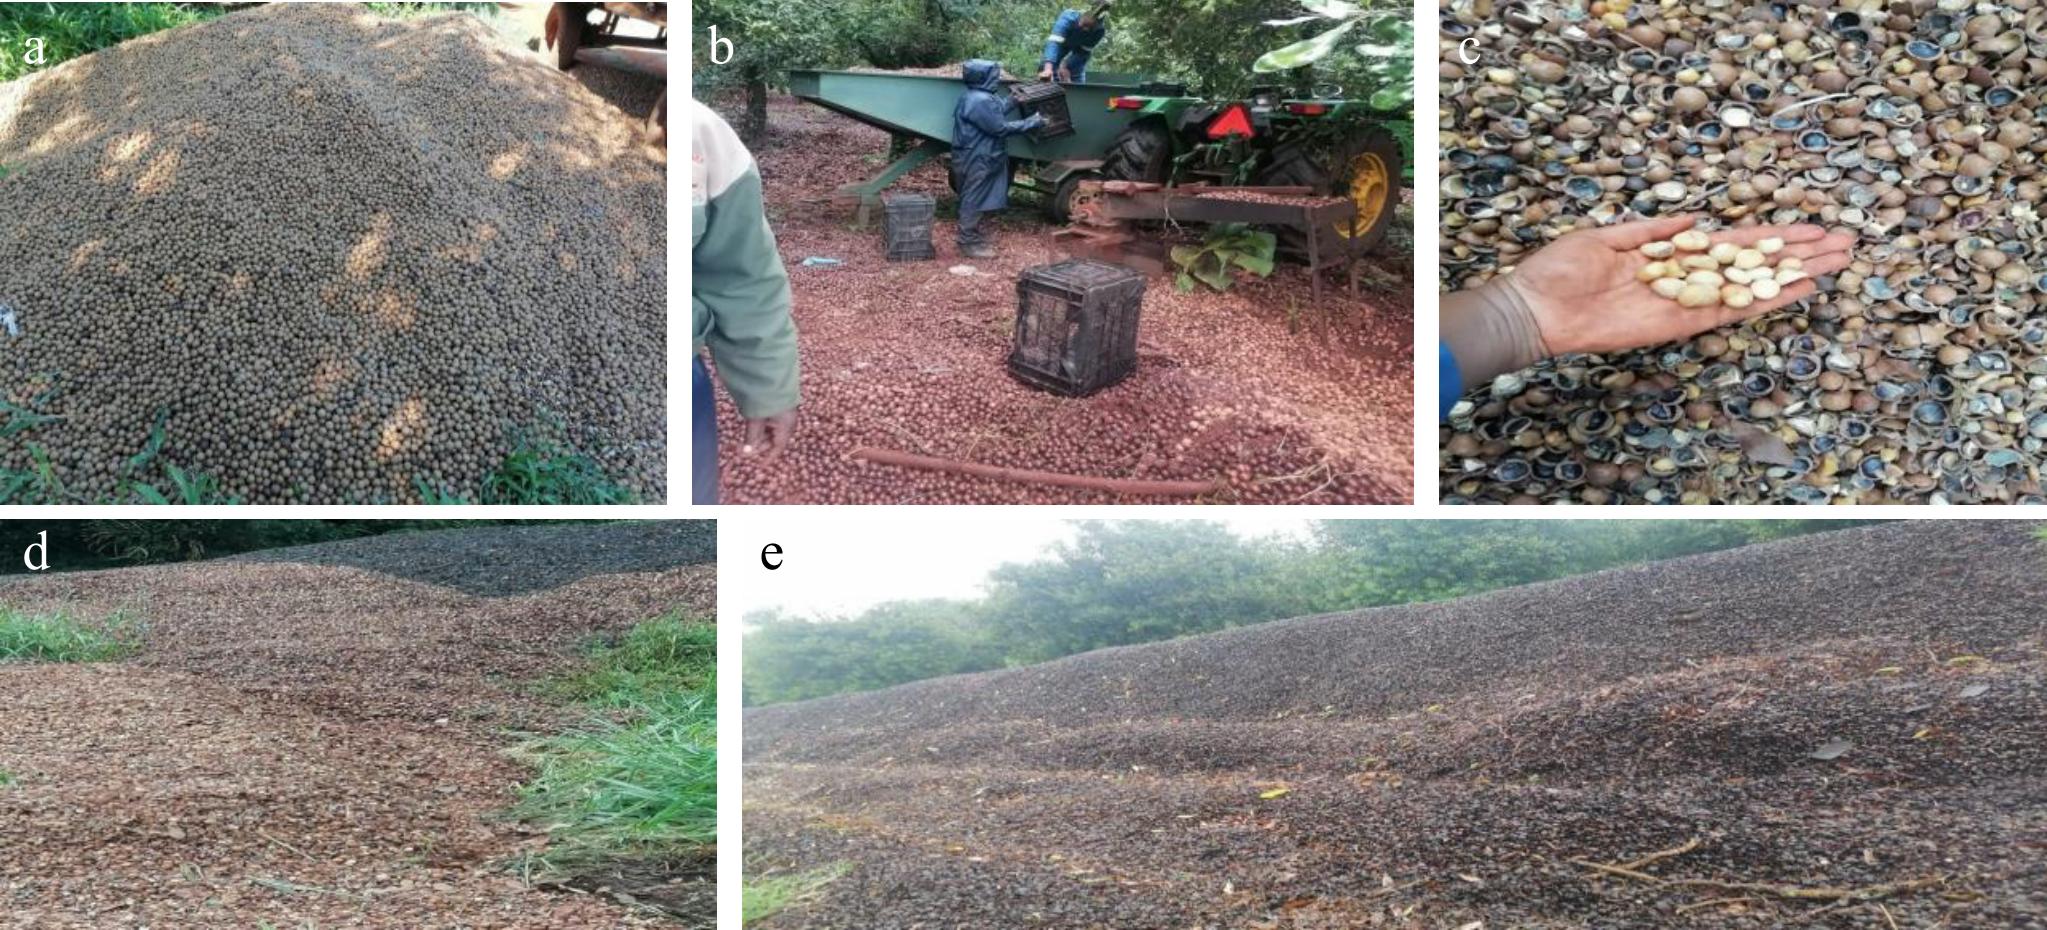
Figure 3.
(a)−(e) Loss of macadamia due to lack of market access and high competition. Source: Field survey 2024.
-
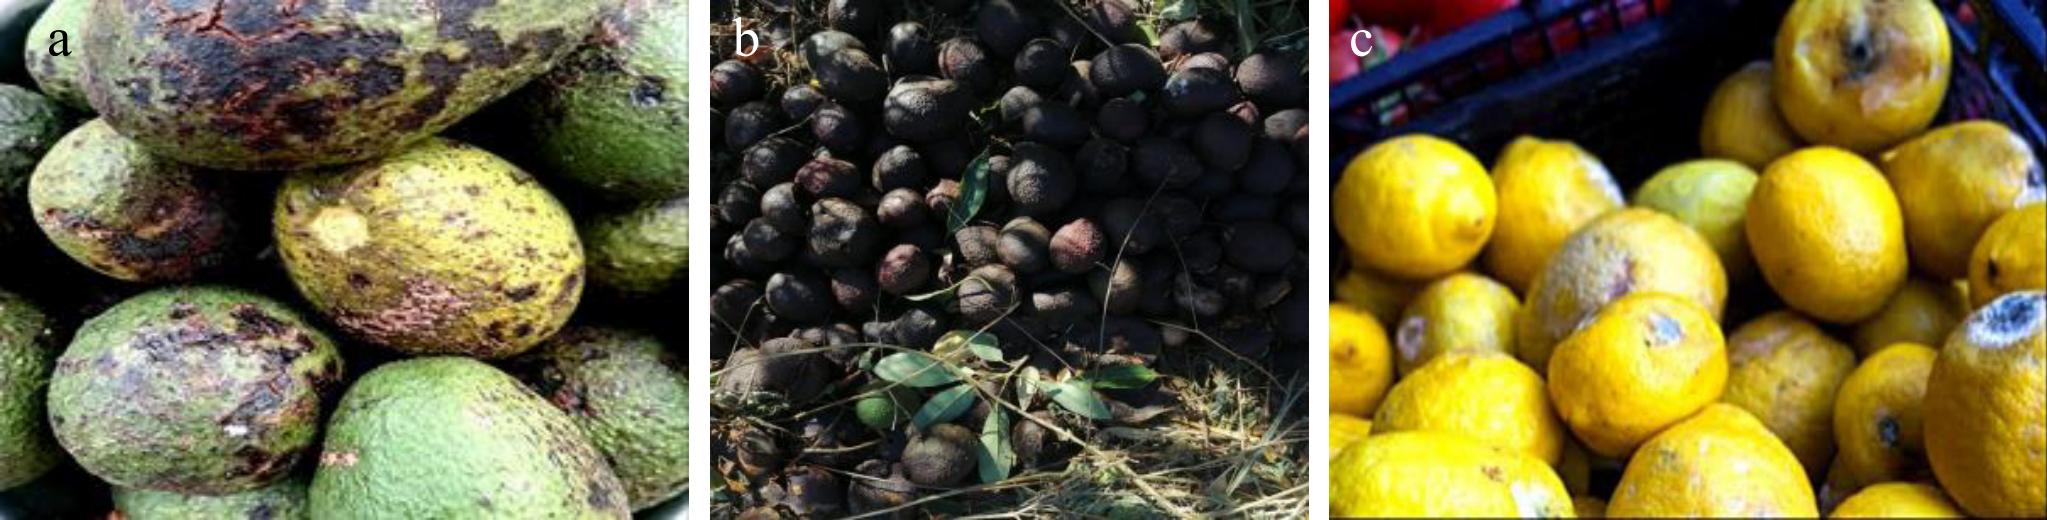
Figure 4.
(a)−(c) Losses from other fruits. Source: Field survey 2024.
-
Socioeconomic variables Frequency Percentage (%) Gender Male 143 63.9 Female 81 36.1 Age 18–30 46 20.4 31–40 45 20.0 41–50 26 11.4 51–60 36 15.9 > 60 71 31.4 Educational level No formal education 5 2.2 Primary 19 8.5 Secondary 109 48.7 Tertiary 89 39.7 Abet 2 0.9 Source of household income Agricultural activities 189 84.4 Salaried employment 28 12.5 Business 32 14.3 Social grant 77 34.4 Pension 23 10.3 Source: Computed from a field survey in 2024. Table 1.
Socioeconomic characteristics of the farmers (n = 224).
-
Land ownership & fruit crop grown Frequency Percentage (%) Land ownership Yes 214 95.5 No 10 4.5 Type of fruits grown Avocados 135 60.3 Macadamia 94 42.0 Litchis 65 29.0 Banana 51 22.7 Mango 47 21.0 Oranges 30 13.4 Lemon 11 4.9 Guava 3 1.3 Watermelon 3 1.3 Pineapple and granadilla 2 0.9 Multiple responses included the types of fruits grown. Source: Computed from a field survey in 2024. Table 2.
Land ownership and type of fruits grown (n = 224).
-
Preferred storage method Frequency Percentage (%) Store fruits after harvest Yes 84 62.5 No 140 37.5 Preferred storage Backroom 20 23.8 Storeroom 18 21.4 Garage 18 21.4 Pack house 9 10.7 Shed 8 9.5 Storage facilities 6 7.1 Gas room 2 2.4 Cold room 2 2.4 Crate 1 1.2 Total 224 100.0 Source: Computed from field survey 2024. Table 3.
Storage of fruits and the preferred storage locations (n = 224).
-
Frequency Percentage (%) Experienced PHL Yes 114 50.9 No 110 49.1 Type of losses Rooting 75 33.5 Physical damage 21 9.4 Dehydration 17 7.6 Cracking 15 6.7 Quality loss 15 6.7 Deterioration 5 2.2 Nutritional loss 5 2.2 Lenticel 3 1.3 Bug 2 0.9 Source: Computed from field survey 2024. Table 4.
Experiences PHL and type of losses experienced (n = 224).
-
Practices Frequency Percentage (%) Cleaning and disinfecting method 40 17.9 Sorting and grading method 37 16.5 Transportation consideration 41 18.3 Storage practices 24 10.7 Packaging techniques 26 11.6 Selling at appropriate price and conditions 44 19.6 Postharvest fungicides 18 8.0 Manual cleaning 35 15.6 Chemical treatment 28 12.5 Source: Computed from field survey 2024. Table 5.
Practices and technologies used to minimize postharvest losses (n = 224).
-
Technology and practices usage drivers Yes No Total Using practices and technologies 78 (34.82%) 146 (65.18%) 224 Availability of infrastructure and equipment 19 (8.48%) 205 (91.52%) 224 Access to information and training 37 (16.52%) 187 (83.48%) 224 Financial resources 16 (7.14%) 208 (92.87) 224 Government policies and support 21 (9.38%) 203 (90.62%) 224 Market demand and consumer preferences 25(11.16%) 199 (88.84%) 224 Pest and disease control 66 (29.46%) 158 (70.54%) 224 Preservation of fruit quality 31 (13.84%) 193 (86.16%) 224 Extension services and advice from agricultural experts 23 (10.27%) 201 (89.73) 224 Cost and affordability 13 (5.80%) 211 (94.20%) 224 Availability and access to technology 11 (4.91%) 213 (95.05%) 224 Technical knowledge and expertise 11 (4.91%) 213 (95.09%) 224 Maintenance and operating cost 13 (5.80%) 211 (94.20%) 224 Source: Computed from field survey 2024. Table 6.
Factors influencing the usage of practices and technologies (n = 224).
-
PHL reducers/trimmers Yes No Total Access to storeroom/pack house 37 (16.5%) 187 (83.5%) 224 Access to credit 24 (10.7%) 200 (89.3%) 224 Access to training 77 (34.4%) 147 (65.6%) 224 Access to road 42 (18.8%) 182 (81.3%) 224 Export 8 (3.6%) 216 (81.3%) 224 Cold storage 11 (4.9%) 213 (95.1%) 224 Processing facilities 10 (4.5%) 214 (95.5%) 224 Market access 27 (12.1%) 197 (87.9%) 224 Water 8 (3.6%) 216 (96.4%) 224 Chemicals 23 (10.3%) 201 (89.7%) 224 Price regulation 8 (3.6%) 216 (96.4%) 224 Electricity 3 (1.3%) 221 (98.1%) 224 Technologies 1 (0.4%) 223 (99.6%) 224 Funding 9 (4.0%) 215 (96.0%) 224 Source: Computed from field survey 2024. Table 7.
Suggested ways to reduce PHL (n = 224).
Figures
(4)
Tables
(7)