-
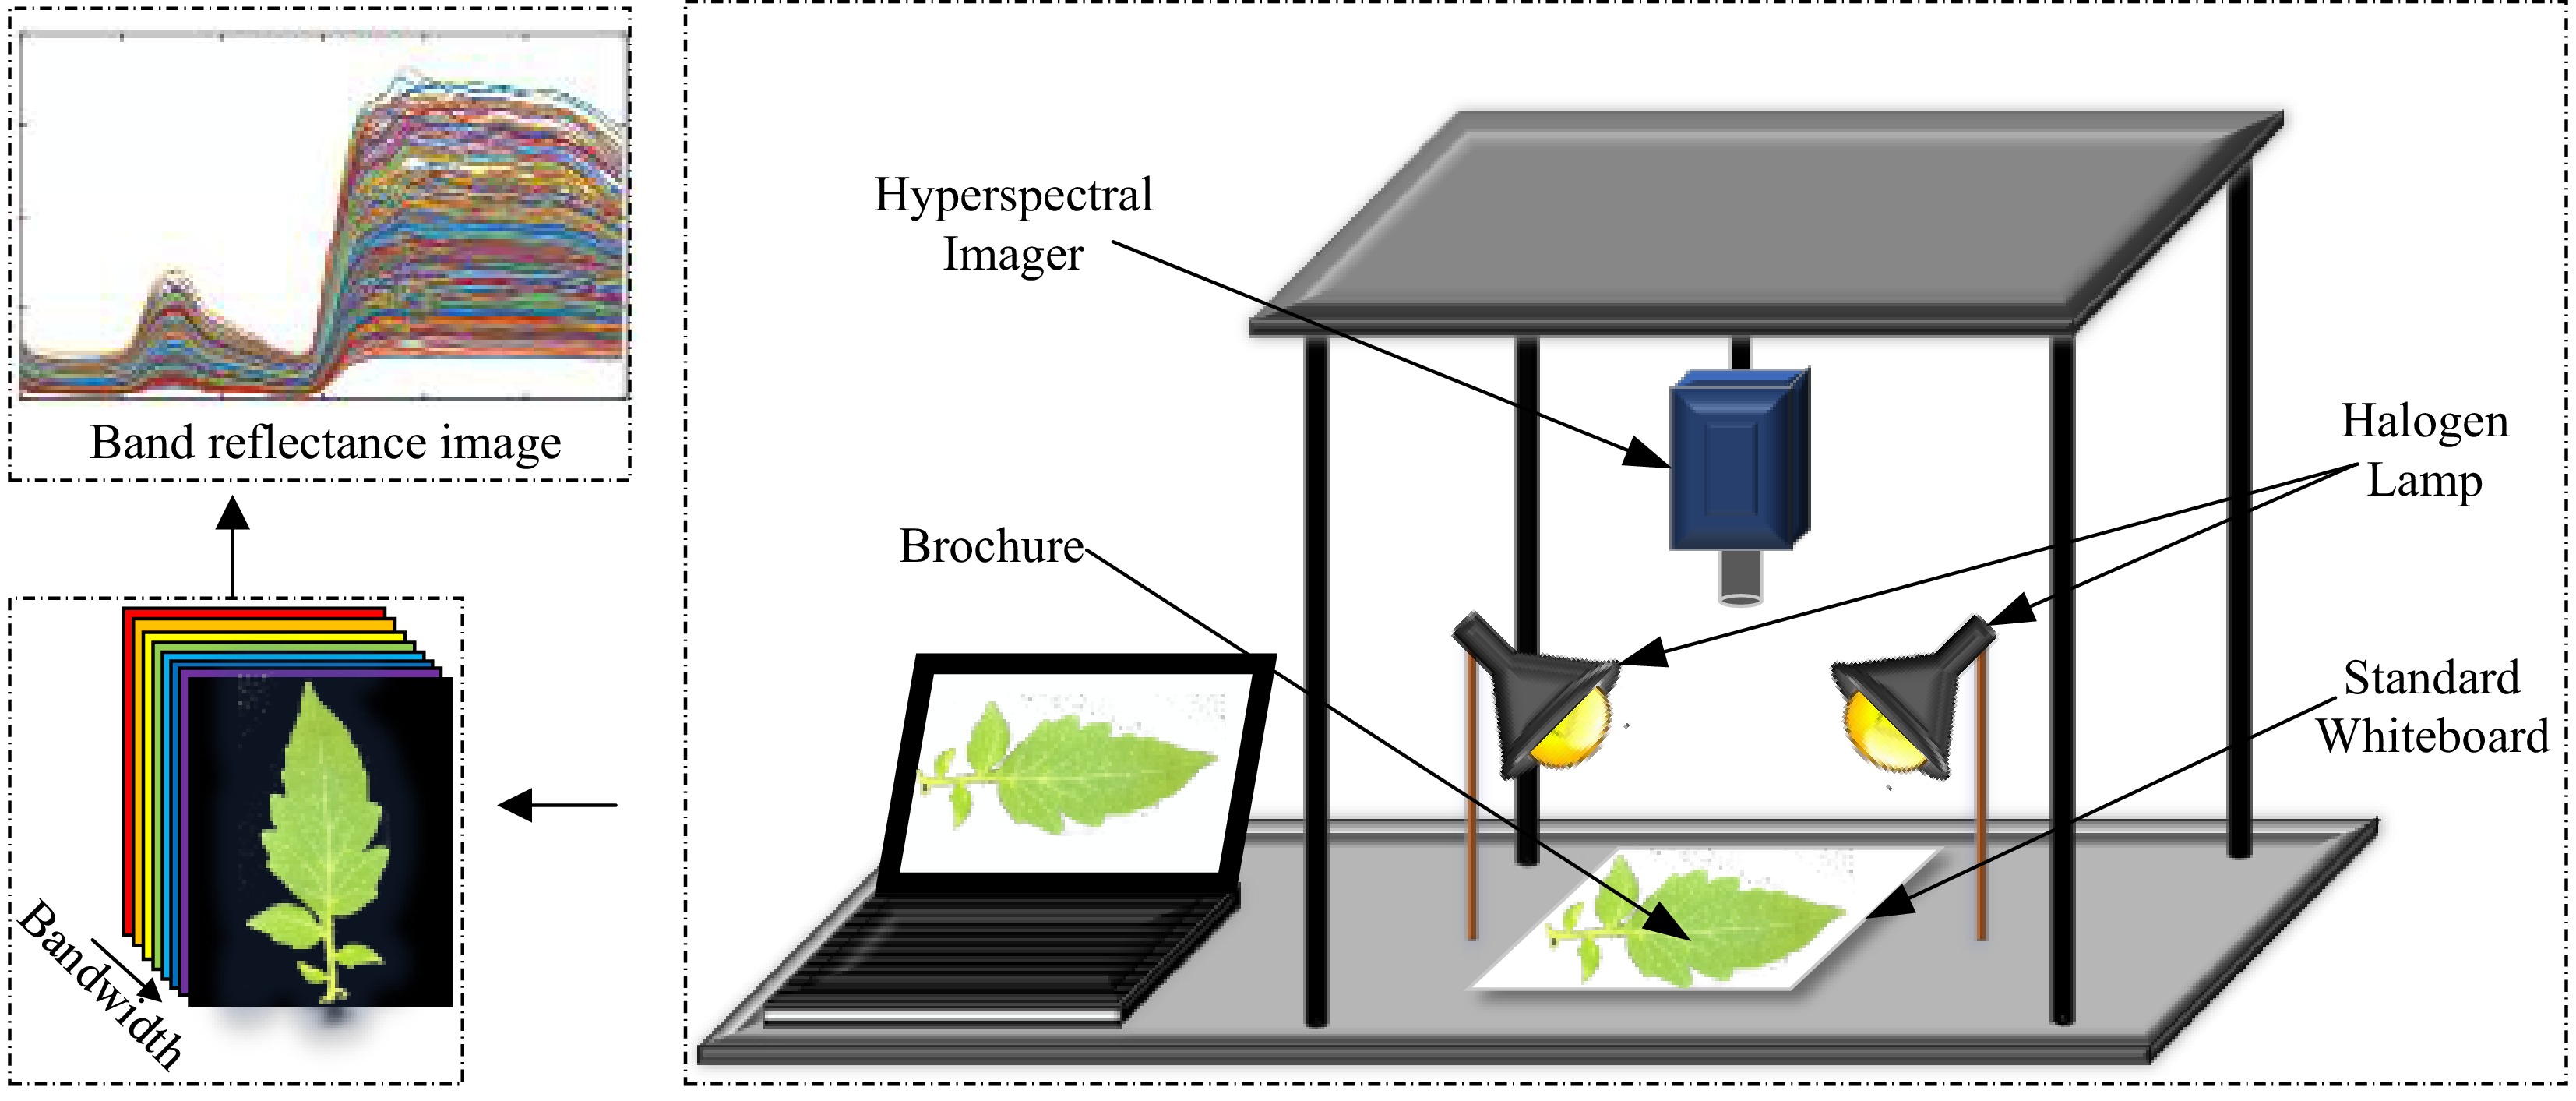
Figure 1.
Hyperspectral data acquisition system.
-
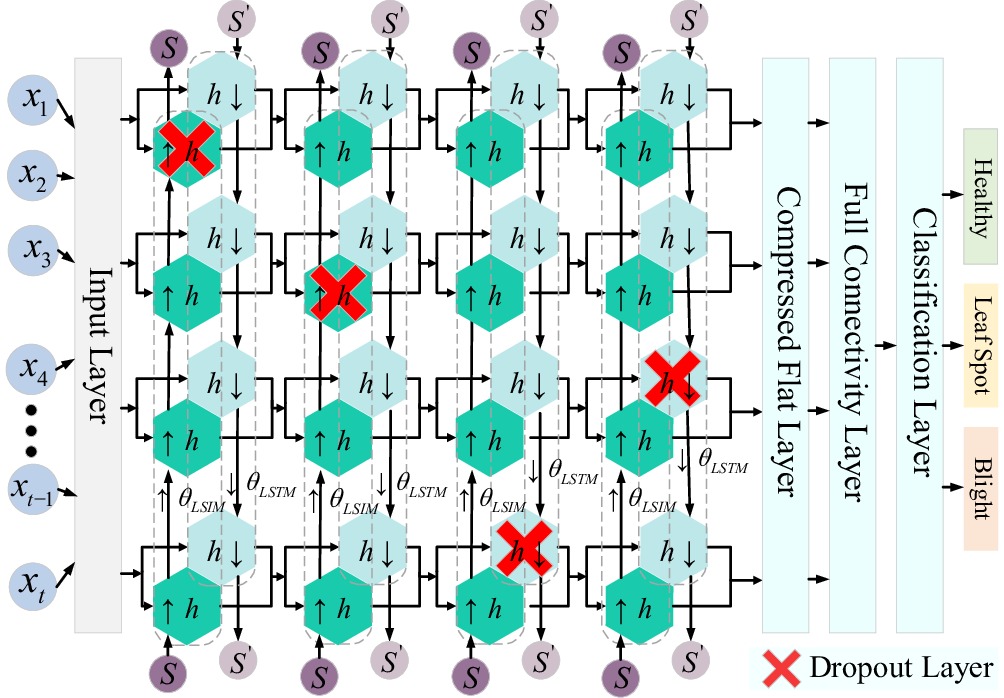
Figure 2.
BiLSTM neural network structure.
-
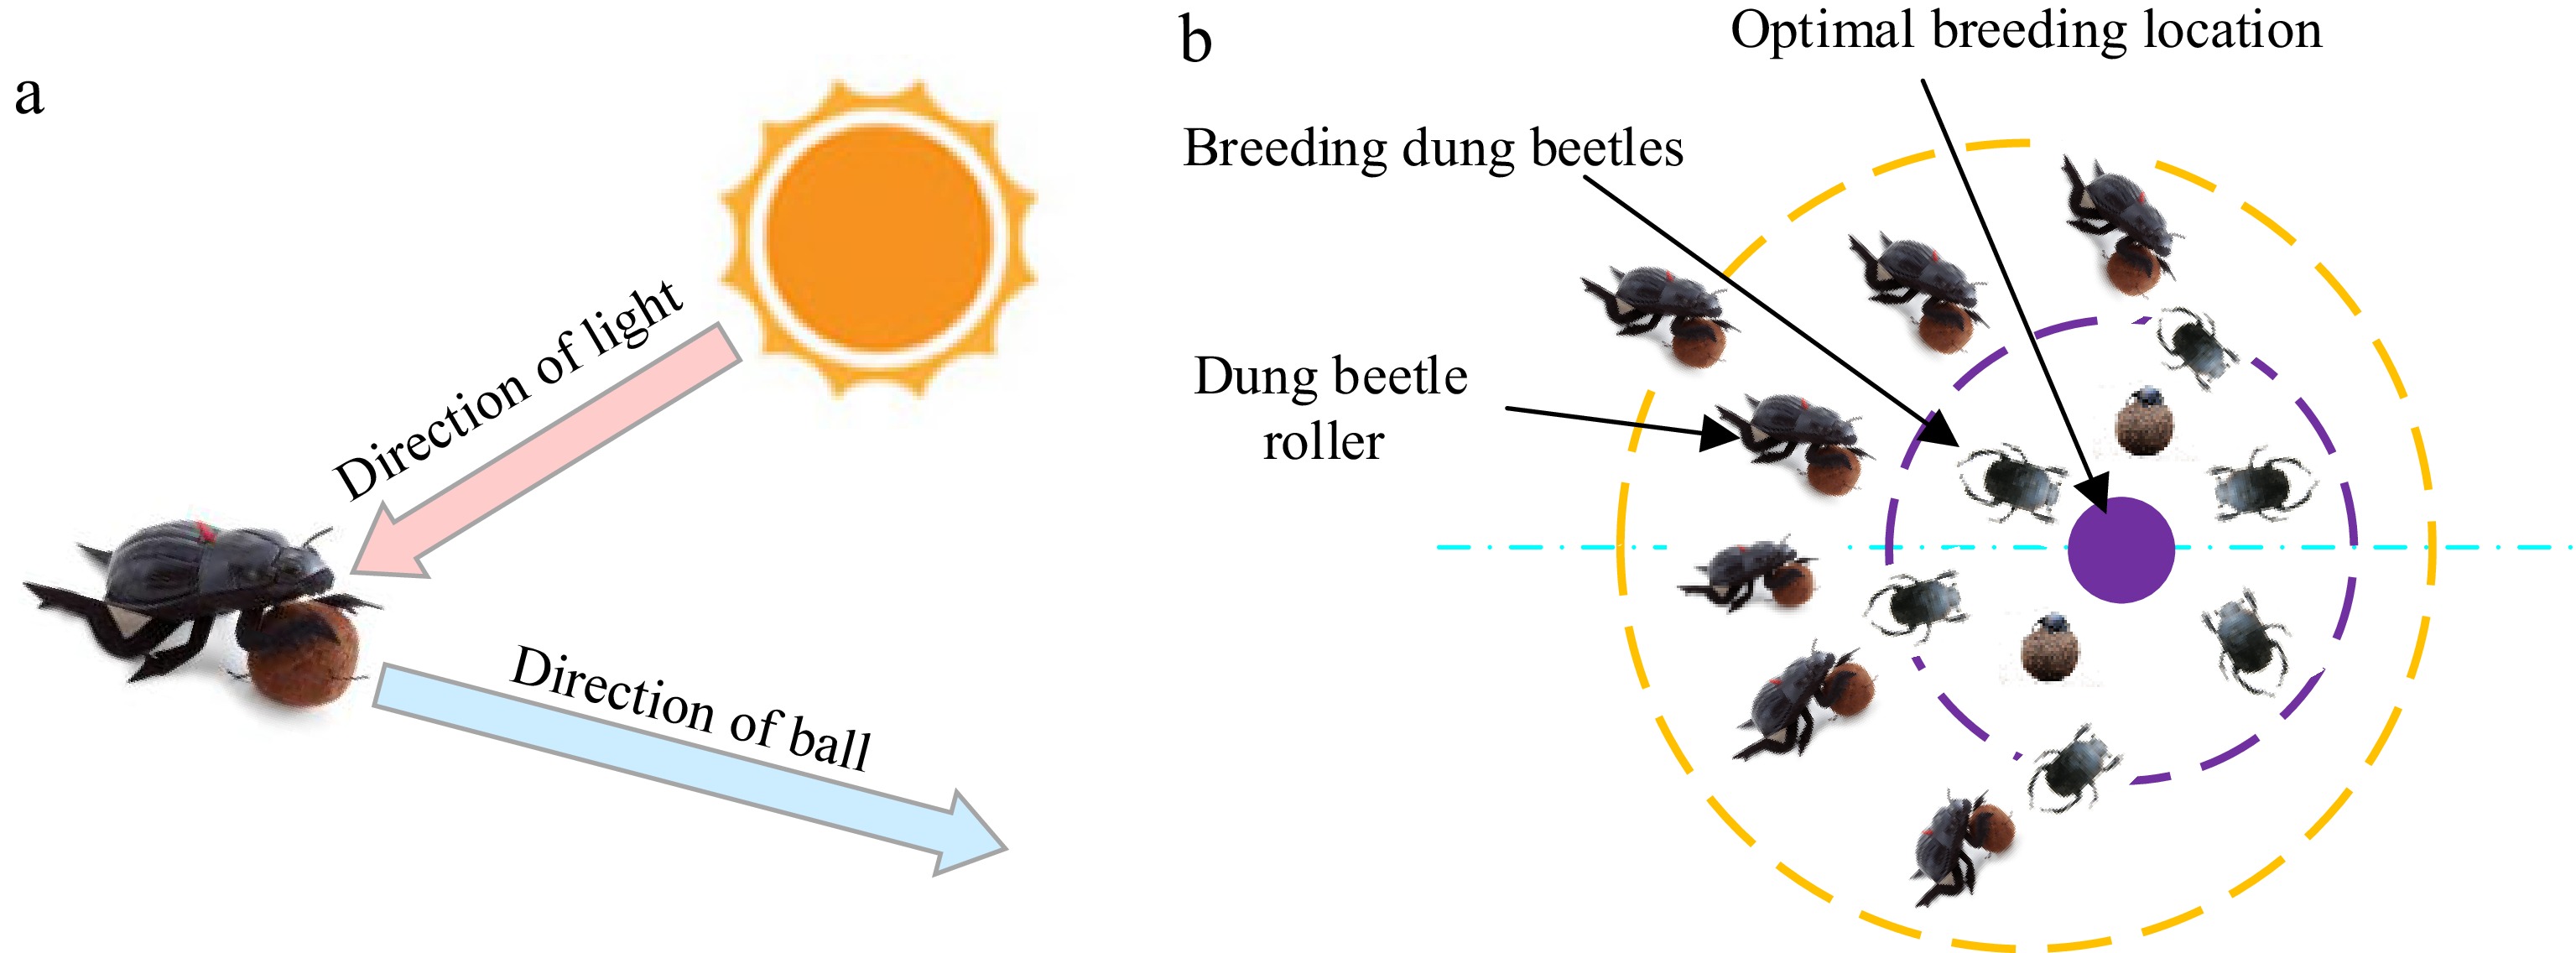
Figure 3.
Principles of Dung beetle movement. (a) Conceptual model of dung beetle trajectories. (b) Boundary selection strategy.
-
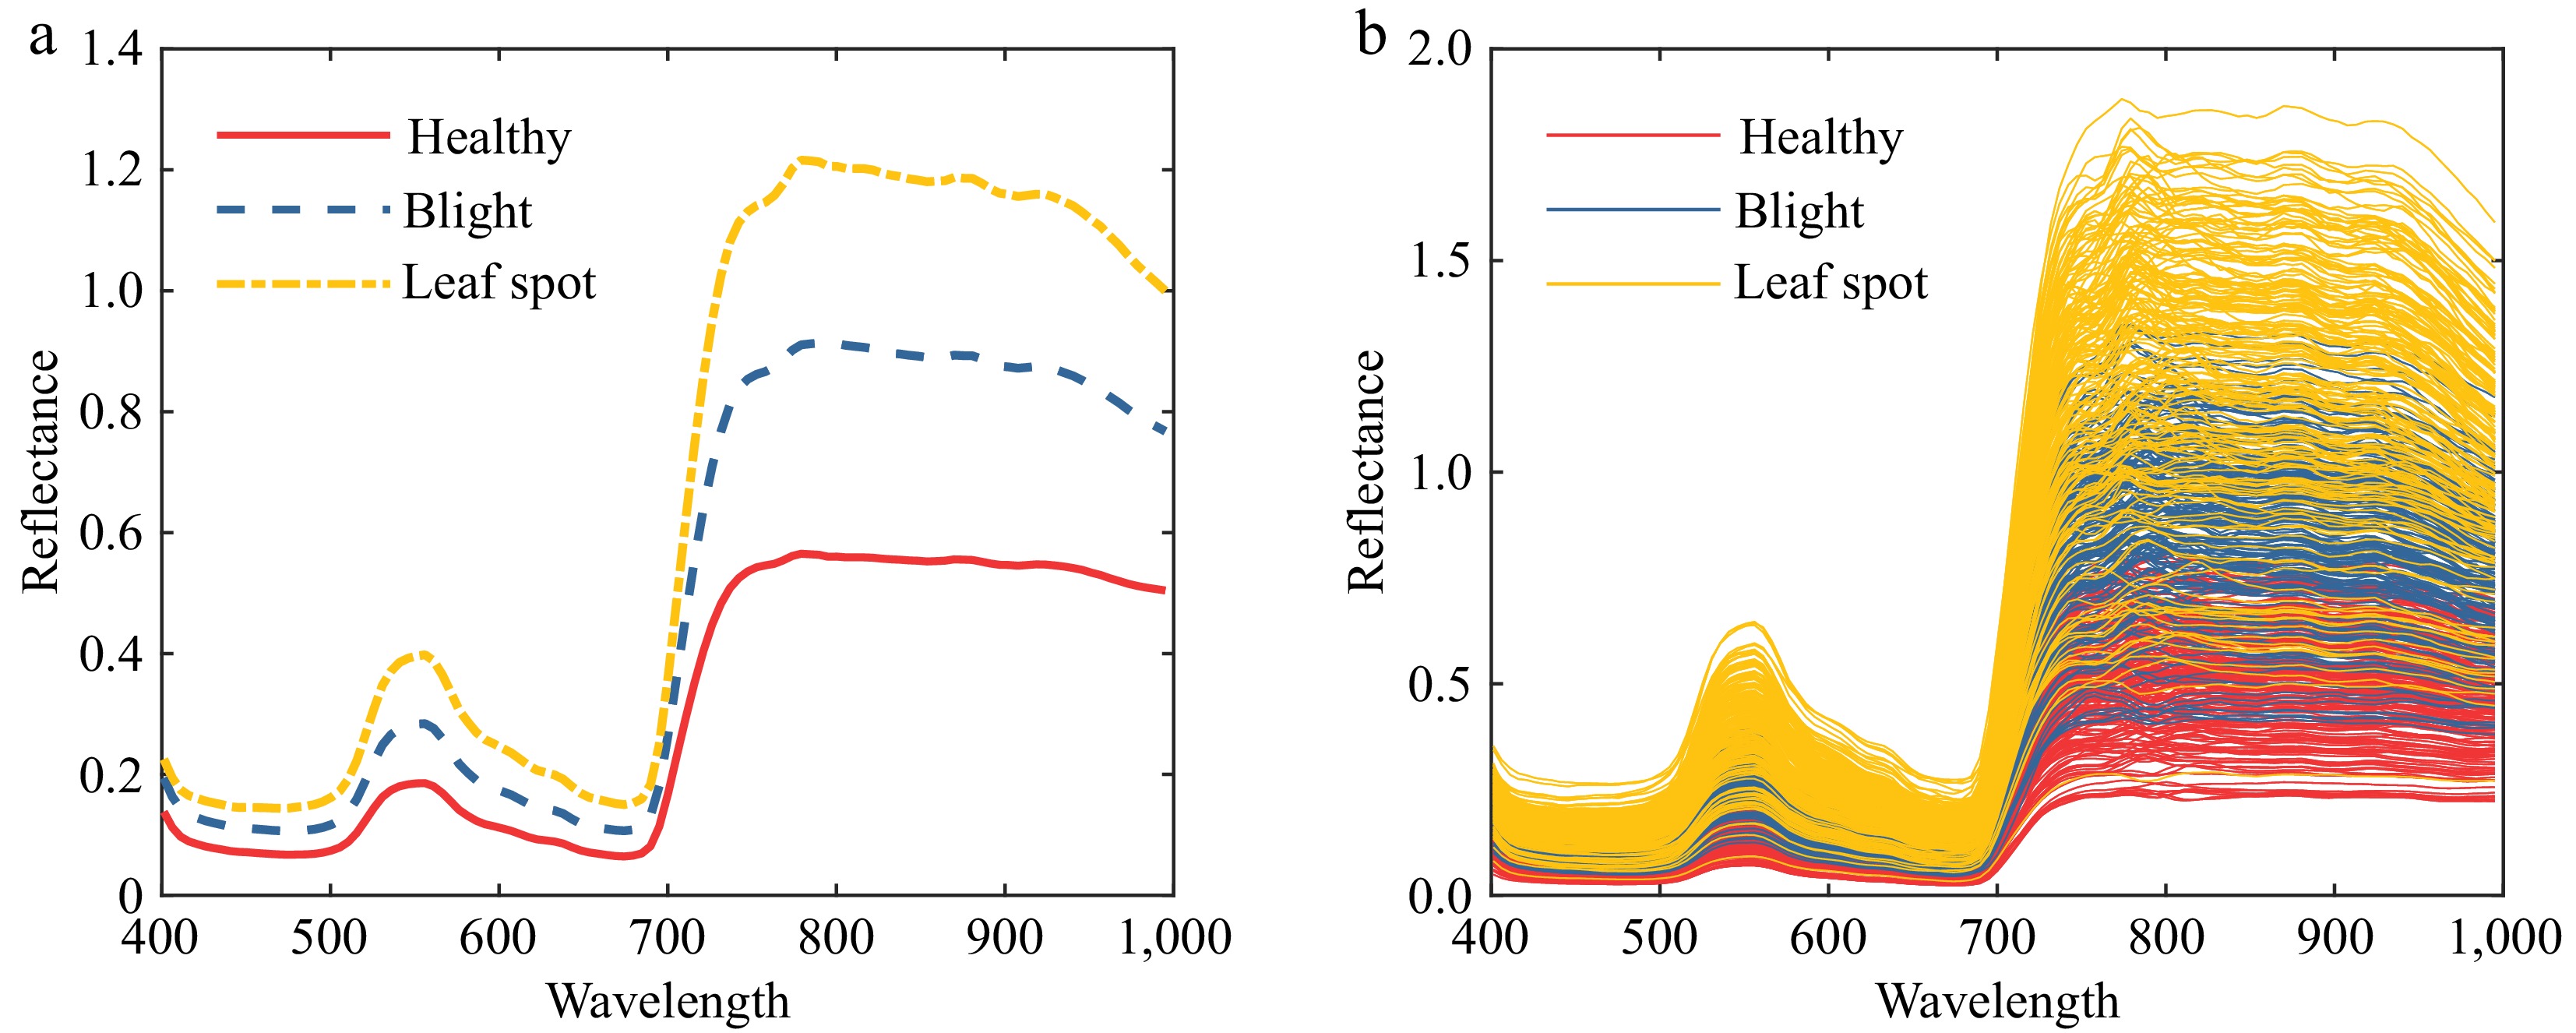
Figure 4.
Tomato leaf reflectance curve. (a) Average reflectance curve of tomato leaves. (b) Raw reflectance curve of tomato leaves.
-
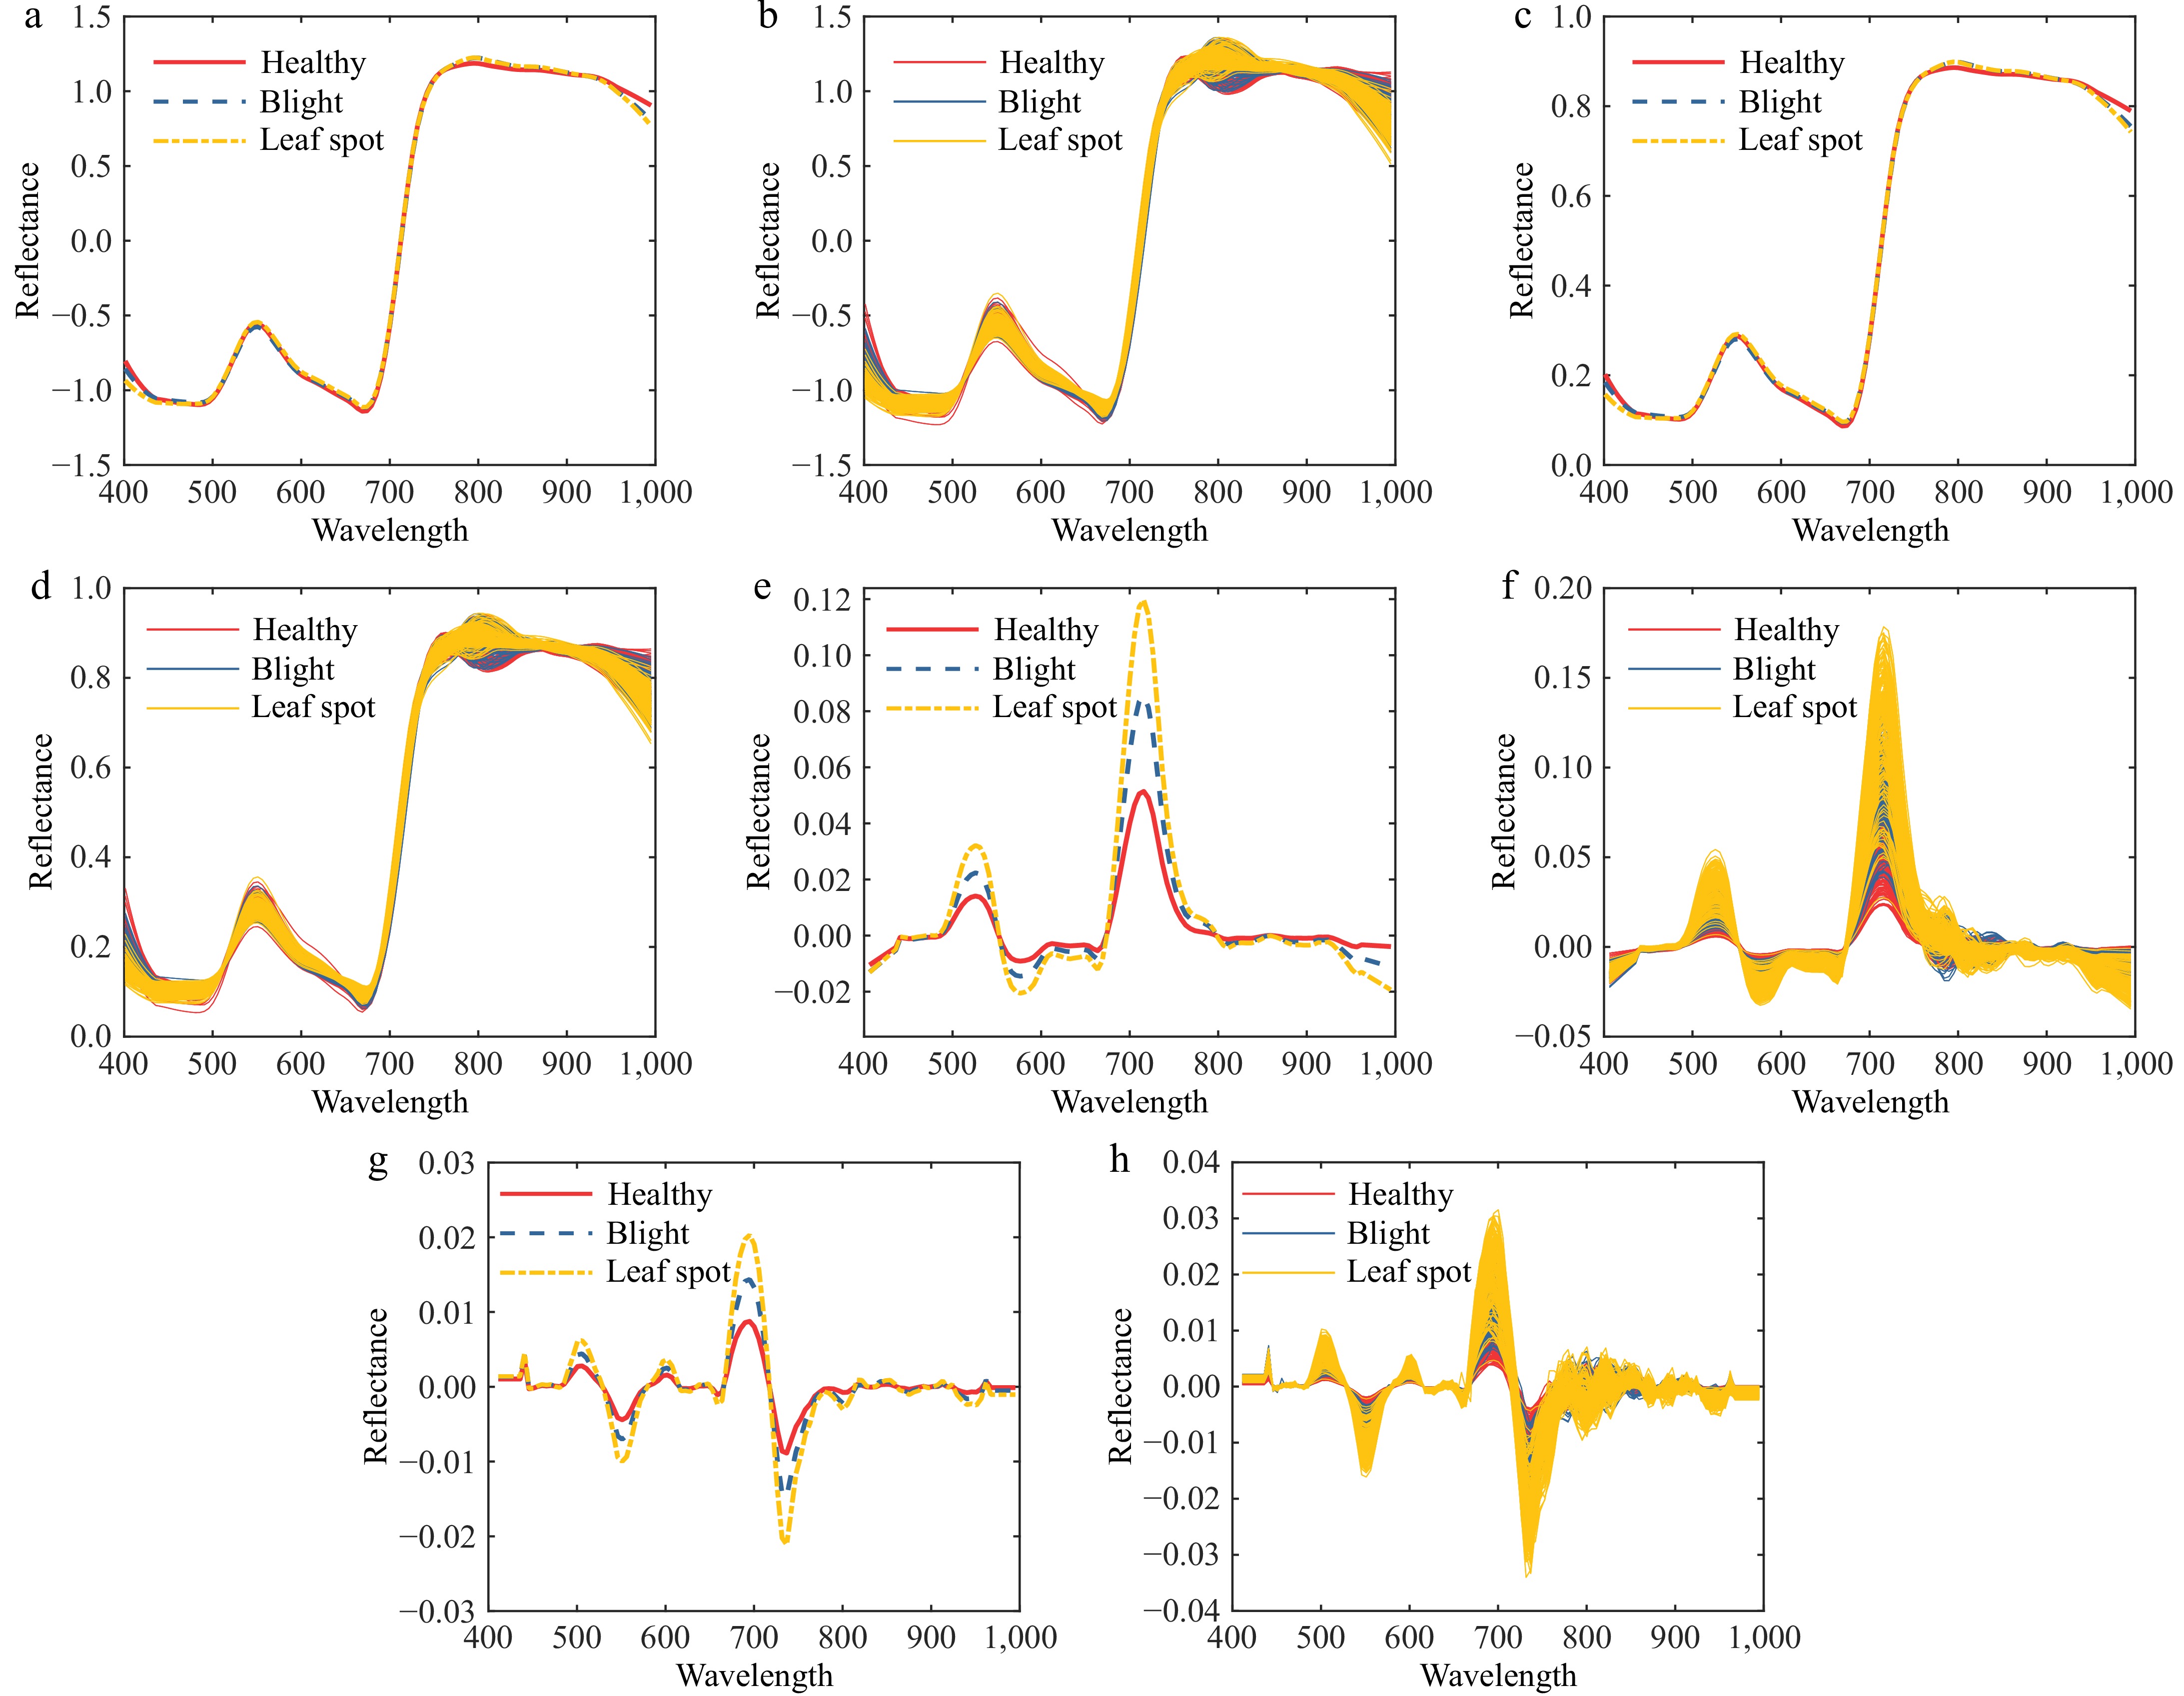
Figure 5.
Spectral preprocessing map of diseased tomato leaves. (a) SNV-SG average spectral curve. (b) SNV-SG preprocessing. (c) MSC-SG average spectral curve. (d) MSC-SG preprocessing. (e) 1st Der-SG average spectral curve. (f) 1st Der -SG preprocessing. (g) 2nd Der-SG average spectral curve. (h) 2nd Der-SG preprocessing.
-
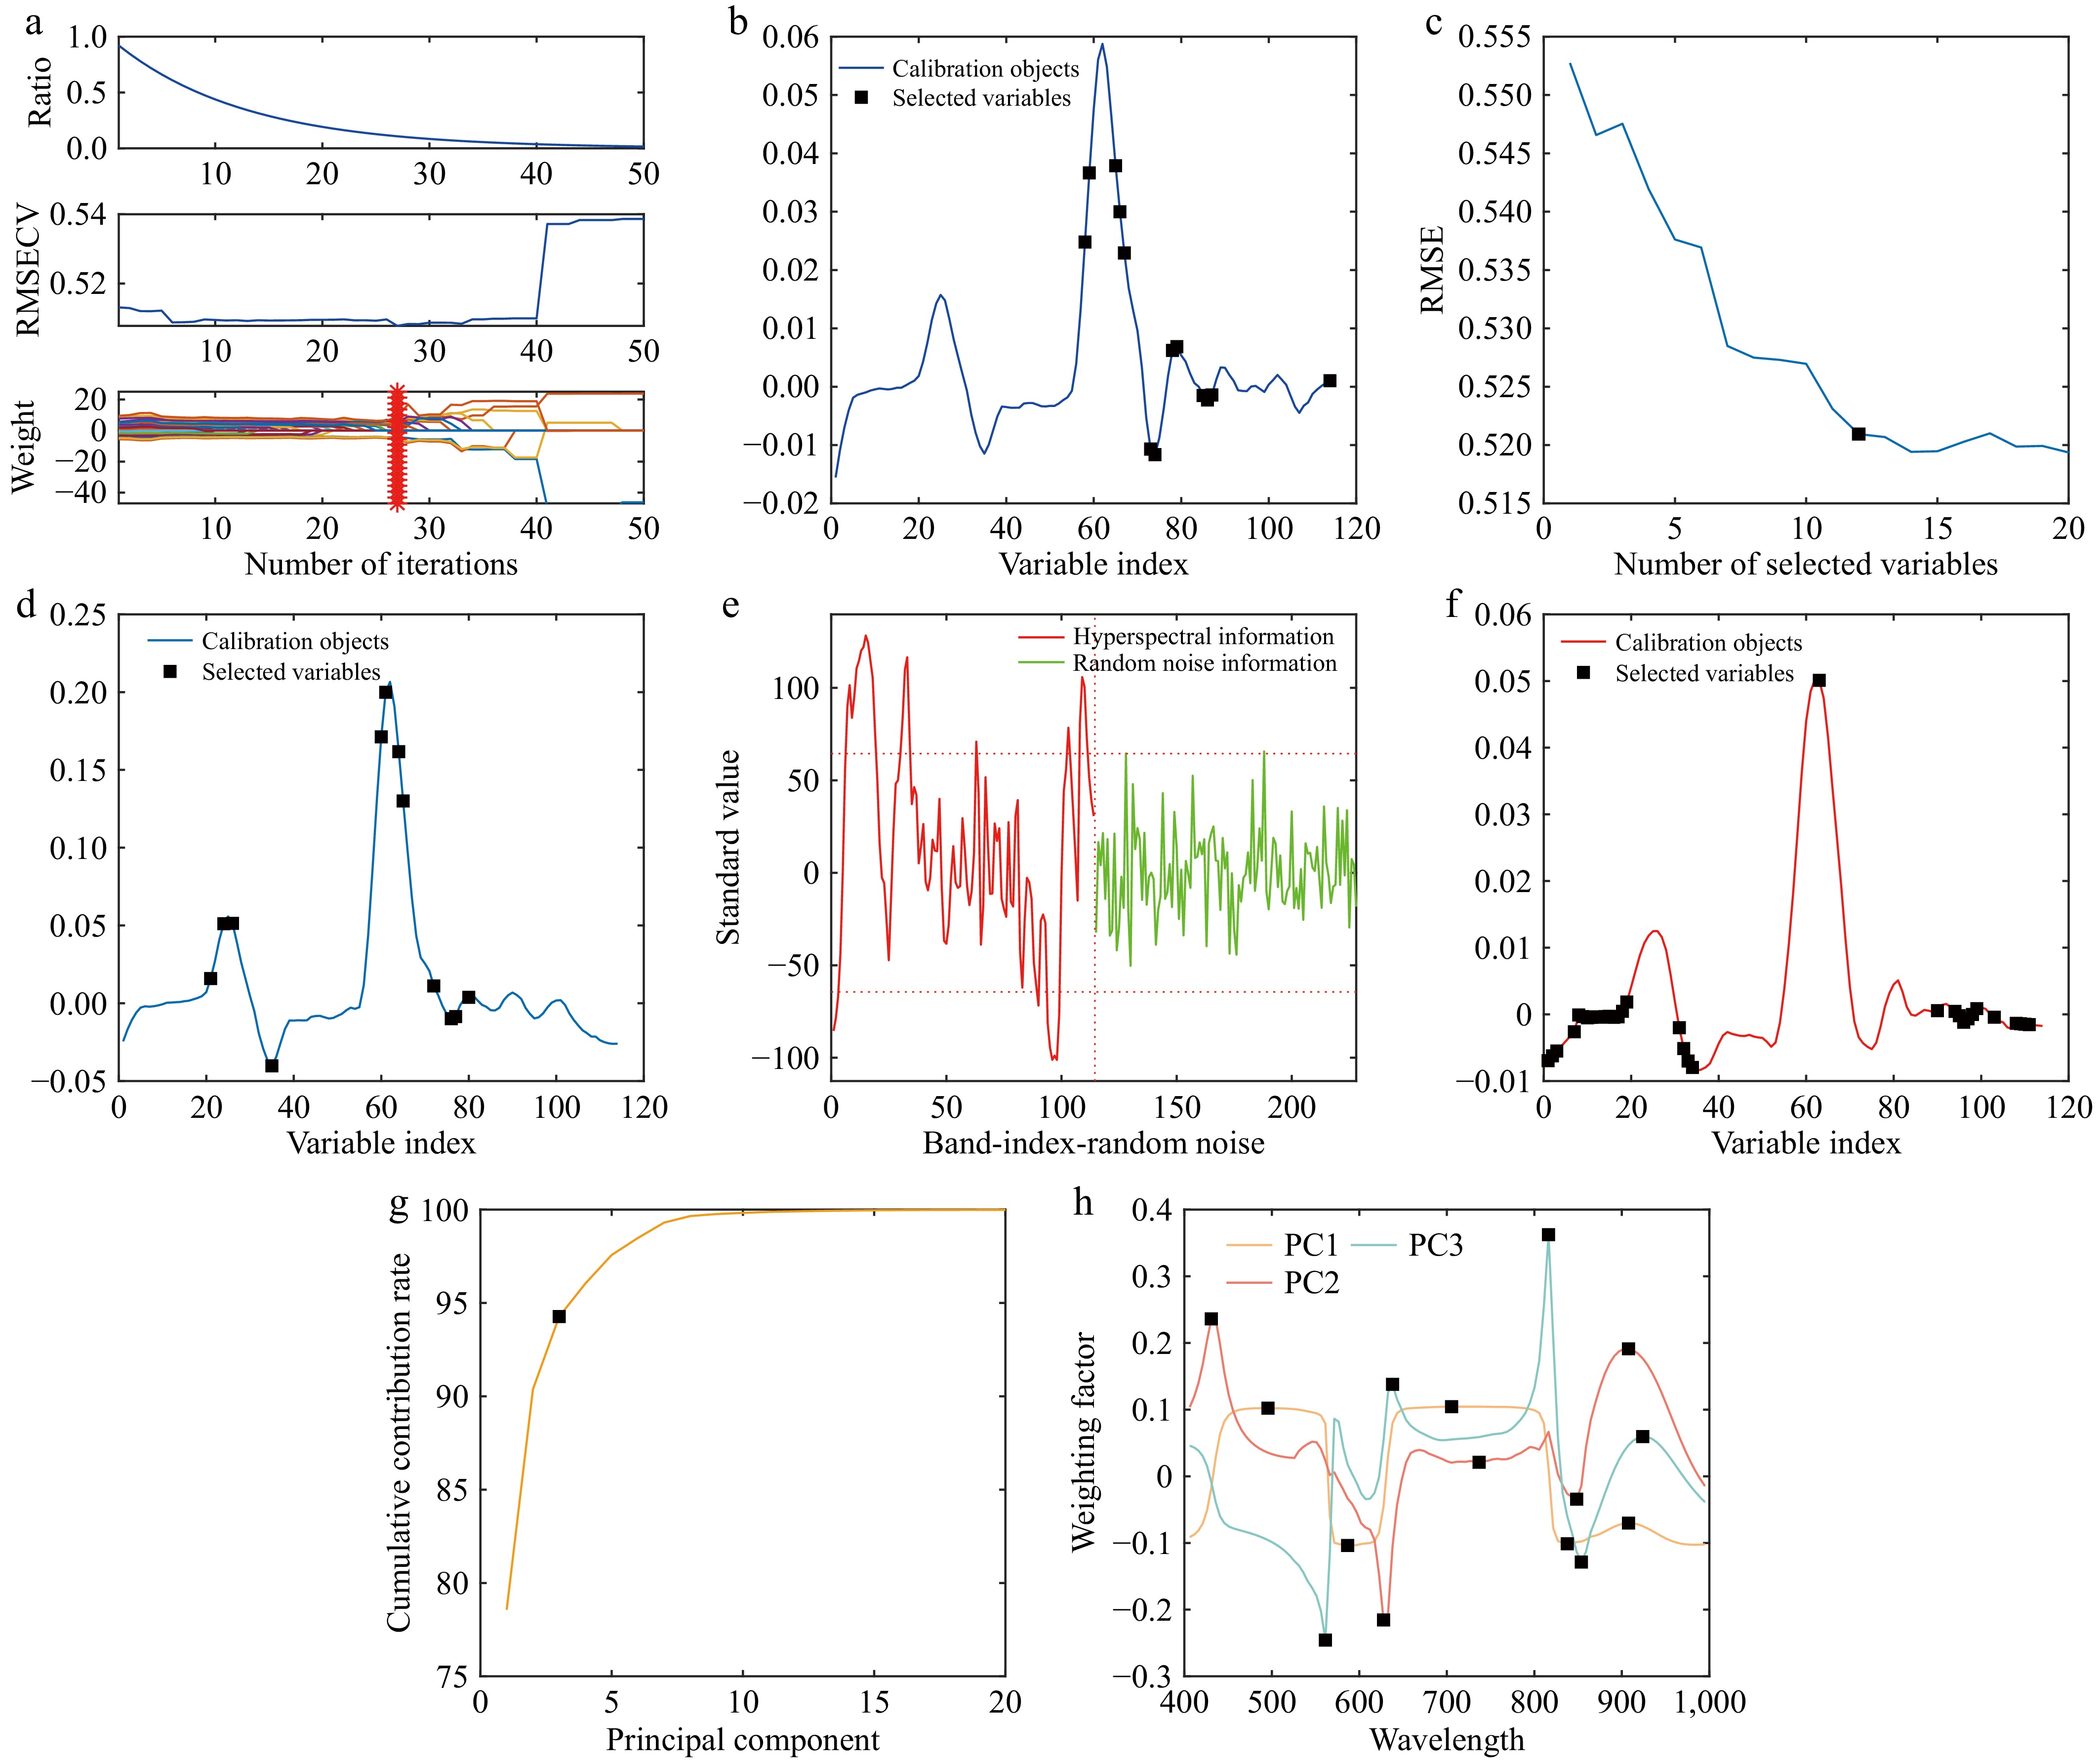
Figure 6.
Characteristic wavelength selection. (a) CARS characteristic wavelength selection. (b) Distribution of feature wavelengths. (c) Represents the wavelength retention trend. (d) Distribution of feature wavelengths. (e) Spectral information screening. (f) Distribution of feature wavelengths. (g) Cumulative contribution curve. (h) Weighting factor curves.
-
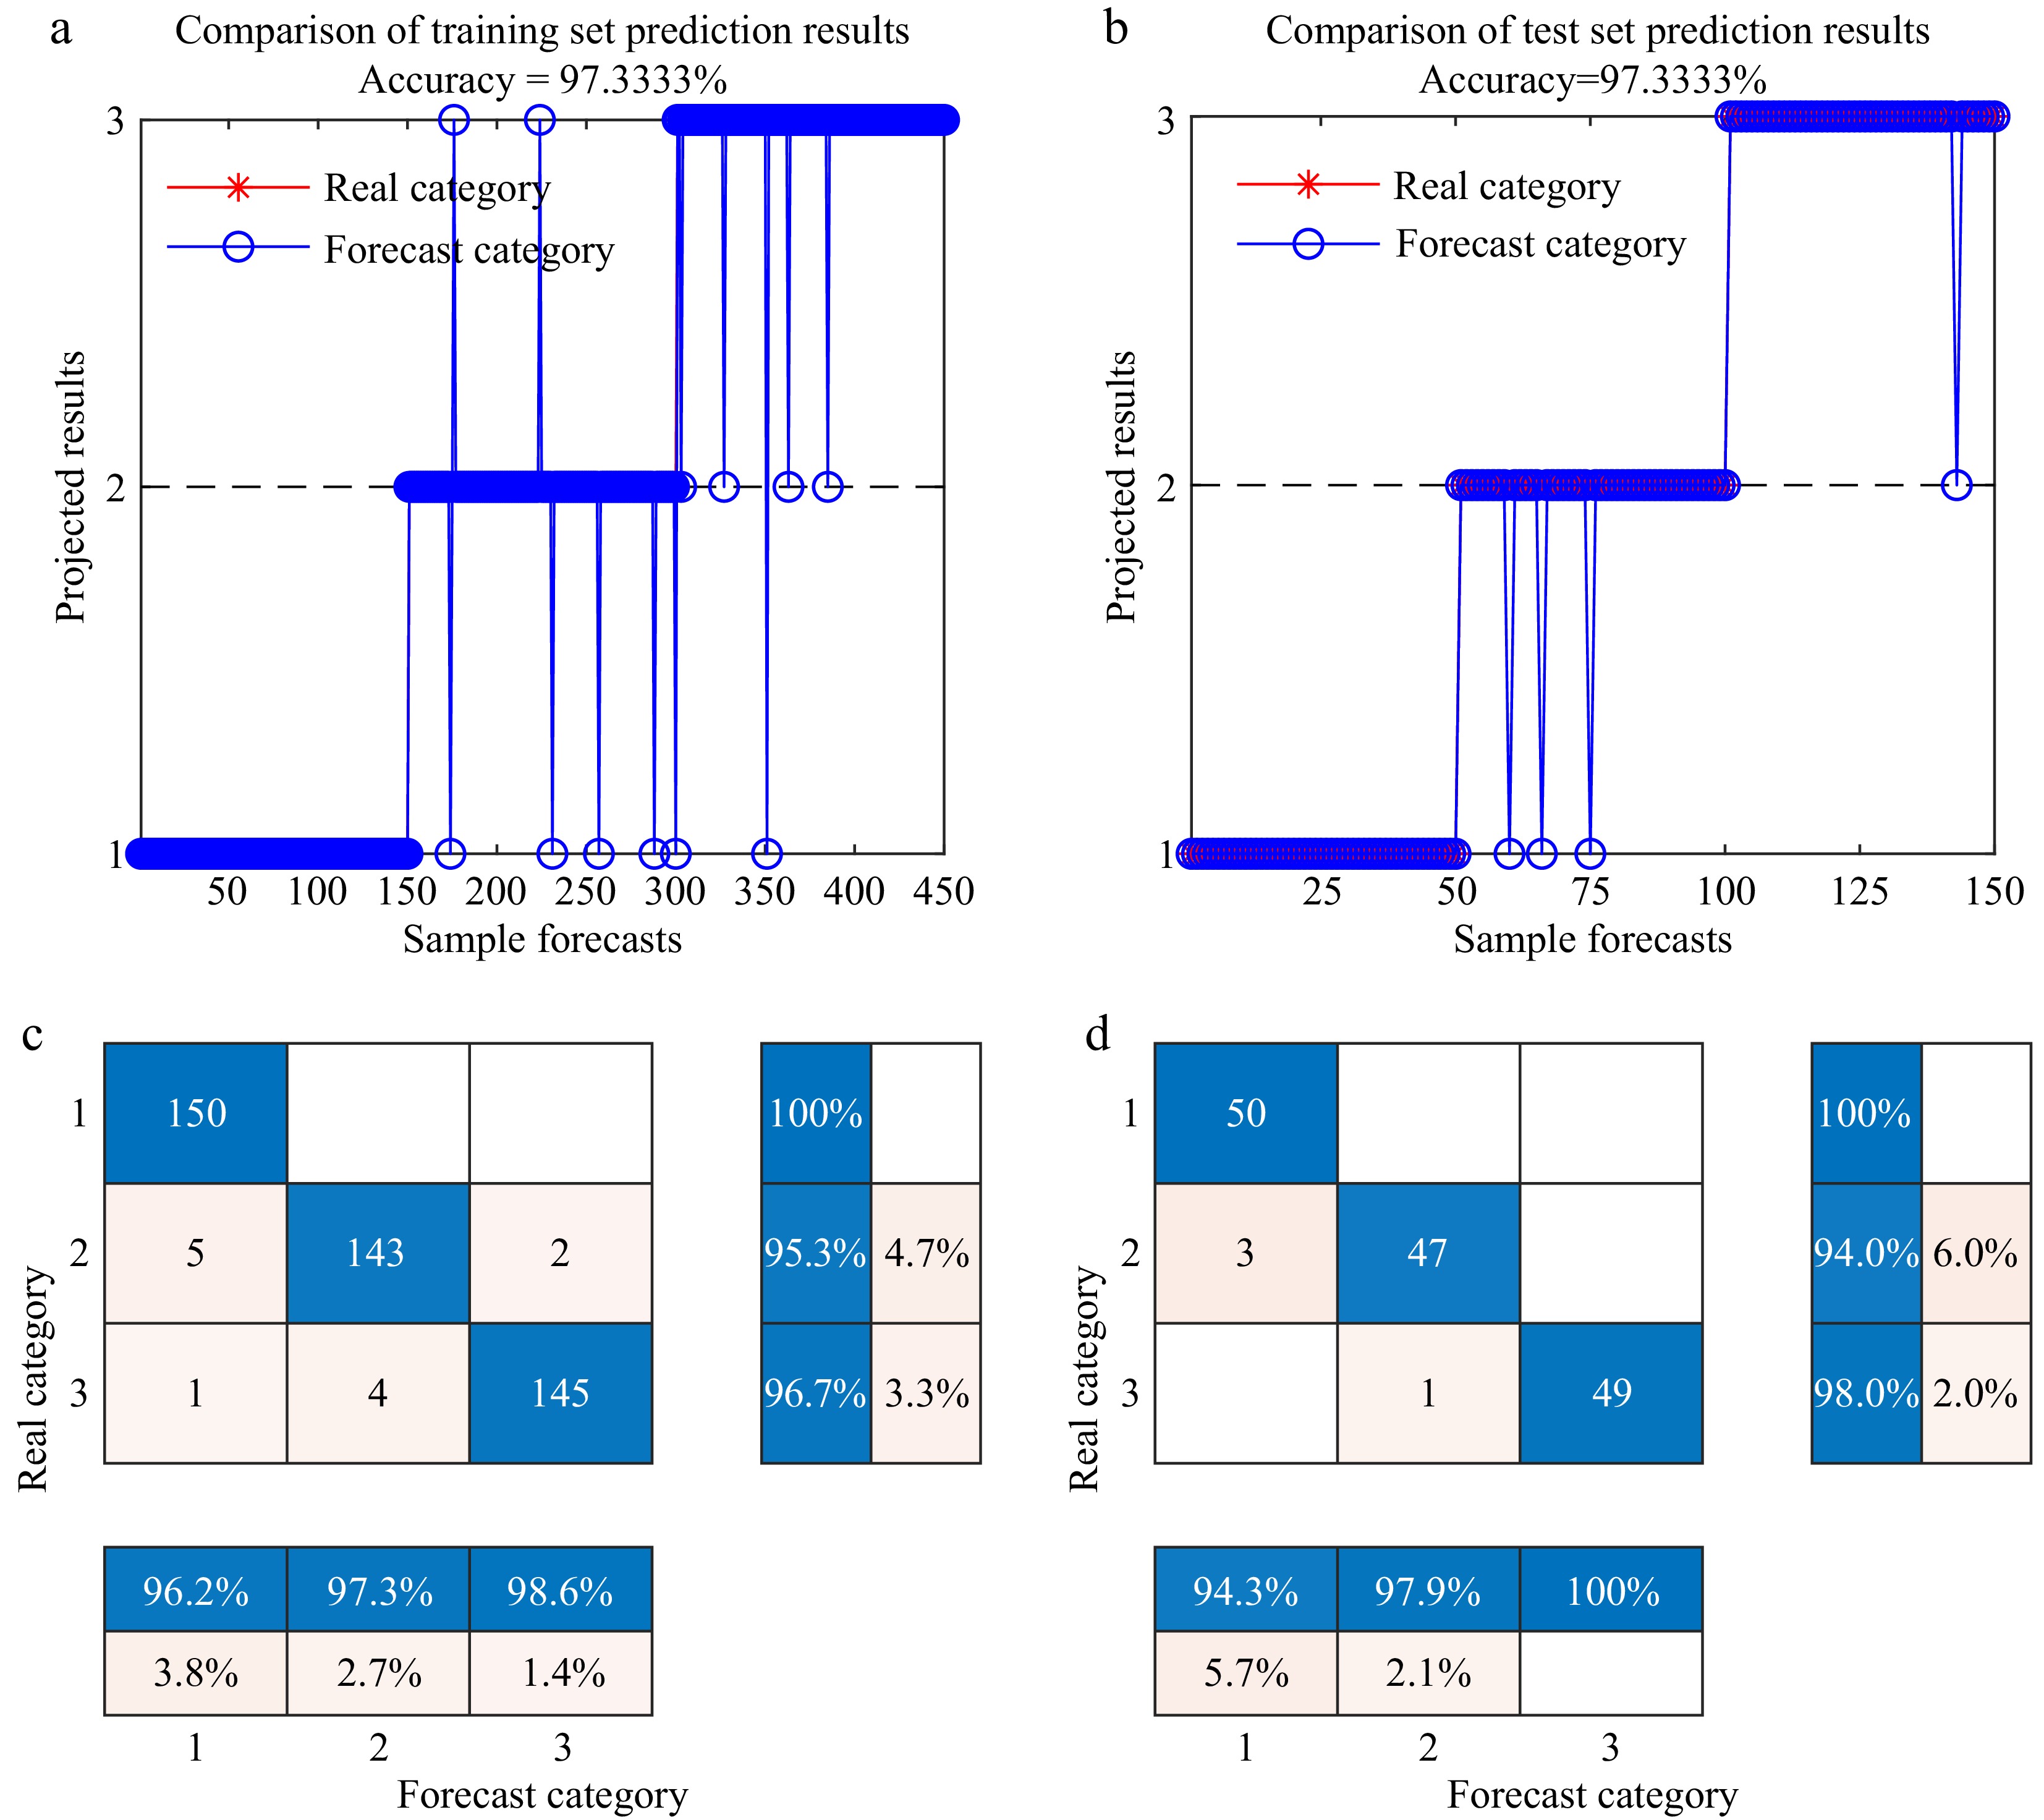
Figure 7.
1st Der-SG-UVE--DBO-BiLSTM Detection Classification Result. 1, 2, and 3 represent healthy, infected early wilt, and infected early leaf spot leaves of tomato, respectively. (a) Training set line chart. (b) Test set line chart. (c) Confusion matrix plot for the training set. (d) Confusion matrix plot for the test set.
-
Methods Train set detection accuracy (%) Test set detection accuracy (%) Health recall Blight recall Leaf spot recall Overall accuracy Health recall Blight recall Leaf spot recall Overall accuracy SNV-SG 89.9 61.1 82.0 77.1 86.3 39.5 78.7 71.3 MSC-SG 90.2 66.4 87.4 81.6 80.9 59.3 81.6 73.3 1st Der-SG 93.3 70.5 87.7 84.0 90.9 64.4 80.0 79.3 2nd Der-SG 94.8 76.0 87.7 86.2 87.0 64.0 78.9 76.3 Table 1.
Modeling comparison results of SG combined preprocessing methods.
-
Times Best principal component RMSECV 1 8 0.4789 2 12 0.4794 3 9 0.4775 4 11 0.4793 5 7 0.4789 Table 2.
RMSECV values with the number of selected principal components.
-
Model Methods Train set detection accuracy (%) Test set detection accuracy (%) Health recall Blight recall Leaf spot recall Overall accuracy Health recall Blight recall Leaf spot recall Overall accuracy SVM CARS 95.3 78.5 76.2 83.3 90.0 70.0 86.0 82.0 SPA 95.3 73.8 80.8 83.3 92.0 60.0 90.0 80.7 UVE 98.7 82.0 93.3 91.3 92.0 74.0 98.0 88.0 PCA 94.7 69.8 75.5 80.0 84.0 68.0 72.0 74.7 DBO-
SVMCARS 94.7 86.6 90.7 90.7 94.0 86.0 92.0 90.7 SPA 93.3 89.2 88.8 90.4 88.0 84.0 88.0 86.7 UVE 98.0 87.3 98.0 94.4 98.0 86.0 98.0 94.0 PCA 96.0 88.5 92.1 92.2 94.0 88.0 92.0 91.3 BiLSTM CARS 90.7 85.9 80.1 85.5 90.0 76.0 92.0 86.0 SPA 94.7 86.5 84.2 88.4 86.0 84.0 86.0 85.3 UVE 90.0 87.9 97.4 91.8 86.0 90.0 96.0 90.7 PCA 93.3 77.0 92.8 87.8 92.0 72.0 96.0 86.7 DBO-
BiLSTMCARS 98.7 90.6 98.7 96.0 96.0 96.0 96.0 96.0 SPA 98.0 90.5 95.4 94.7 94.0 92.0 98.0 94.7 UVE 100.0 95.3 96.7 97.3 100.0 94.0 98.0 97.3 PCA 98.0 91.2 98.7 96.0 96.0 98.0 94.0 96.0 Table 3.
Early detection model of tomato diseases based on different feature extraction methods.
Figures
(7)
Tables
(3)