-
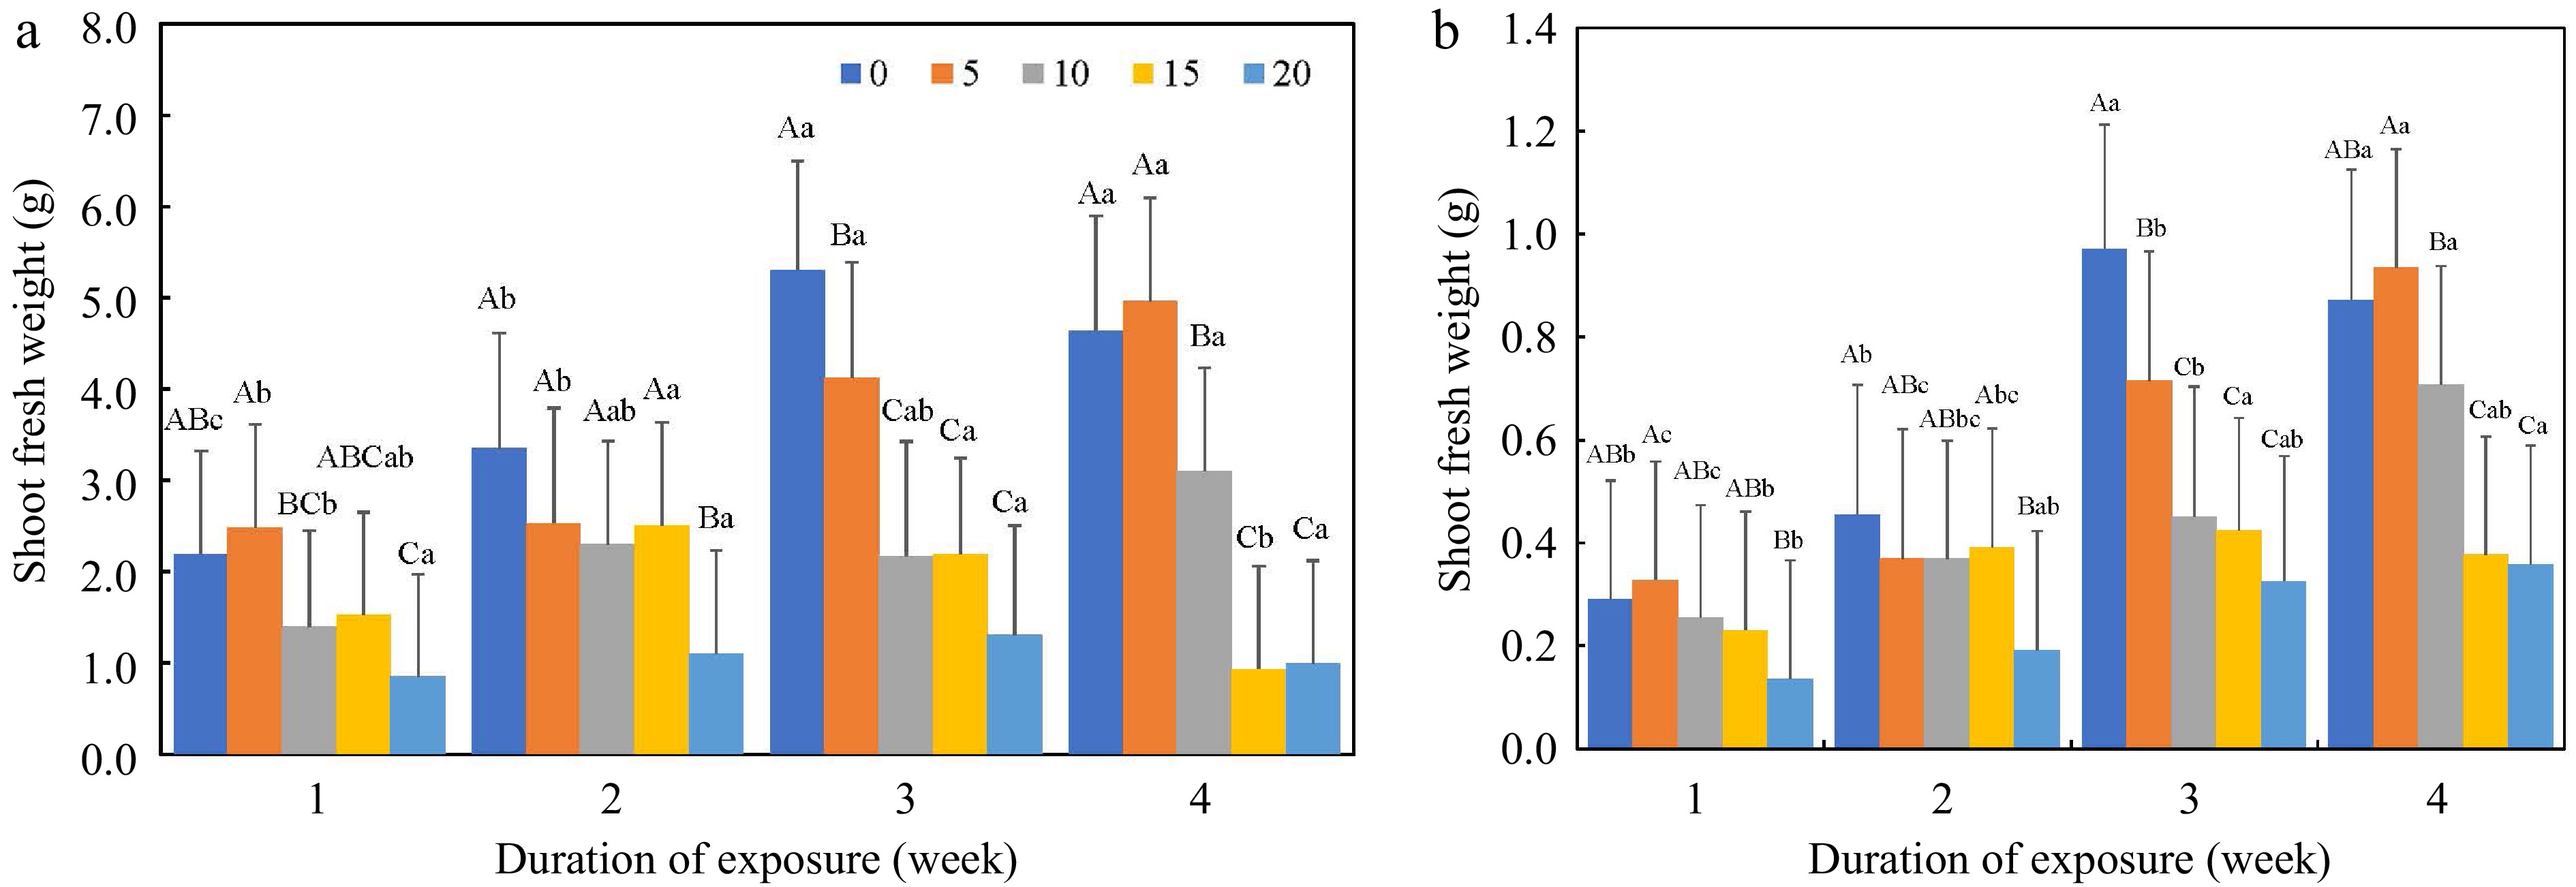
Figure 1.
(a) Shoot fresh weight, and (b) shoot dry weight in grams (g) as affected by salt concentration (0–20 dS·m−1) and duration of saline exposure (week). Uppercase letters indicate differences among salt concentrations in the same week at p ≤ 0.05. Lowercase letters indicate differences among weeks at the same salt concentration at p ≤ 0.05.
-
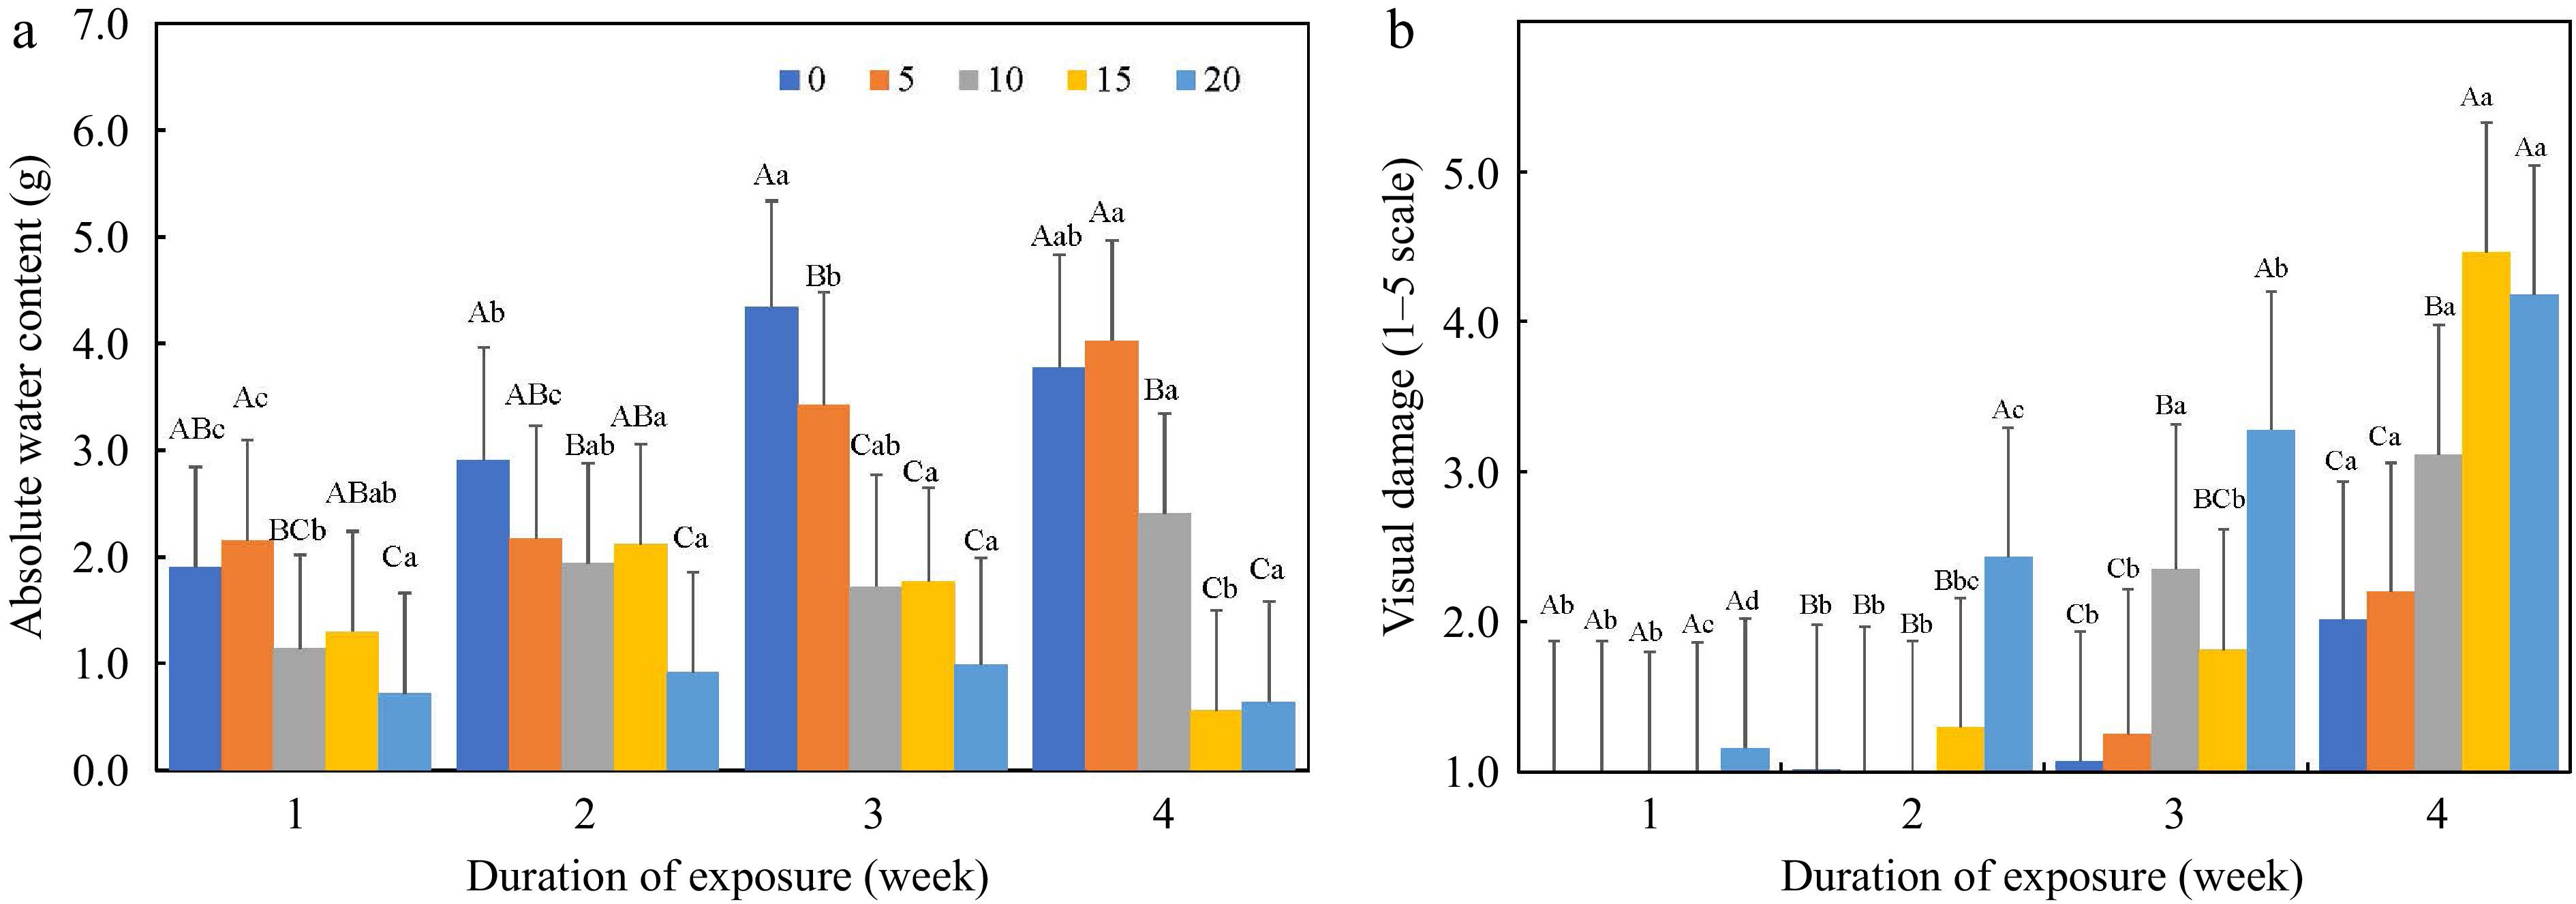
Figure 2.
(a) Absolute water content in grams (g), and (b) visual damage (1–5 scale, 1 = healthy plants and 5 = dead plants) as affected by salt concentration (0–20 dS·m−1) and duration of saline exposure (week). Uppercase letters indicate differences among salt concentrations within the same week at p ≤ 0.05. Lowercase letters indicate differences among weeks at the same salt concentration at p ≤ 0.05.
-
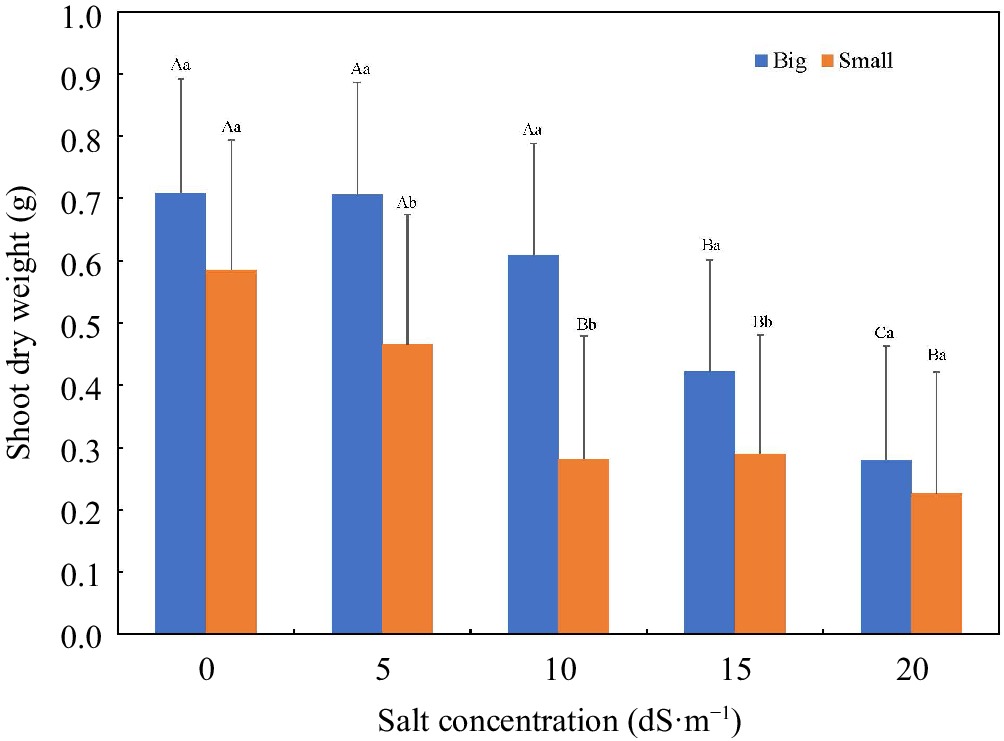
Figure 3.
Shoot dry weight (g) as affected by salt concentration (0–20 dS·m−1) and container size (big and small). Uppercase letters indicate differences among salt concentrations in the same container size at p ≤ 0.05. Lowercase letters indicate differences between container sizes at the same salt concentration at p ≤ 0.05. Big container = 556 mL (6.4 cm diam. × 25.4 cm long); small container = 410 mL (3.8 cm diam. × 20.3 cm long).
-
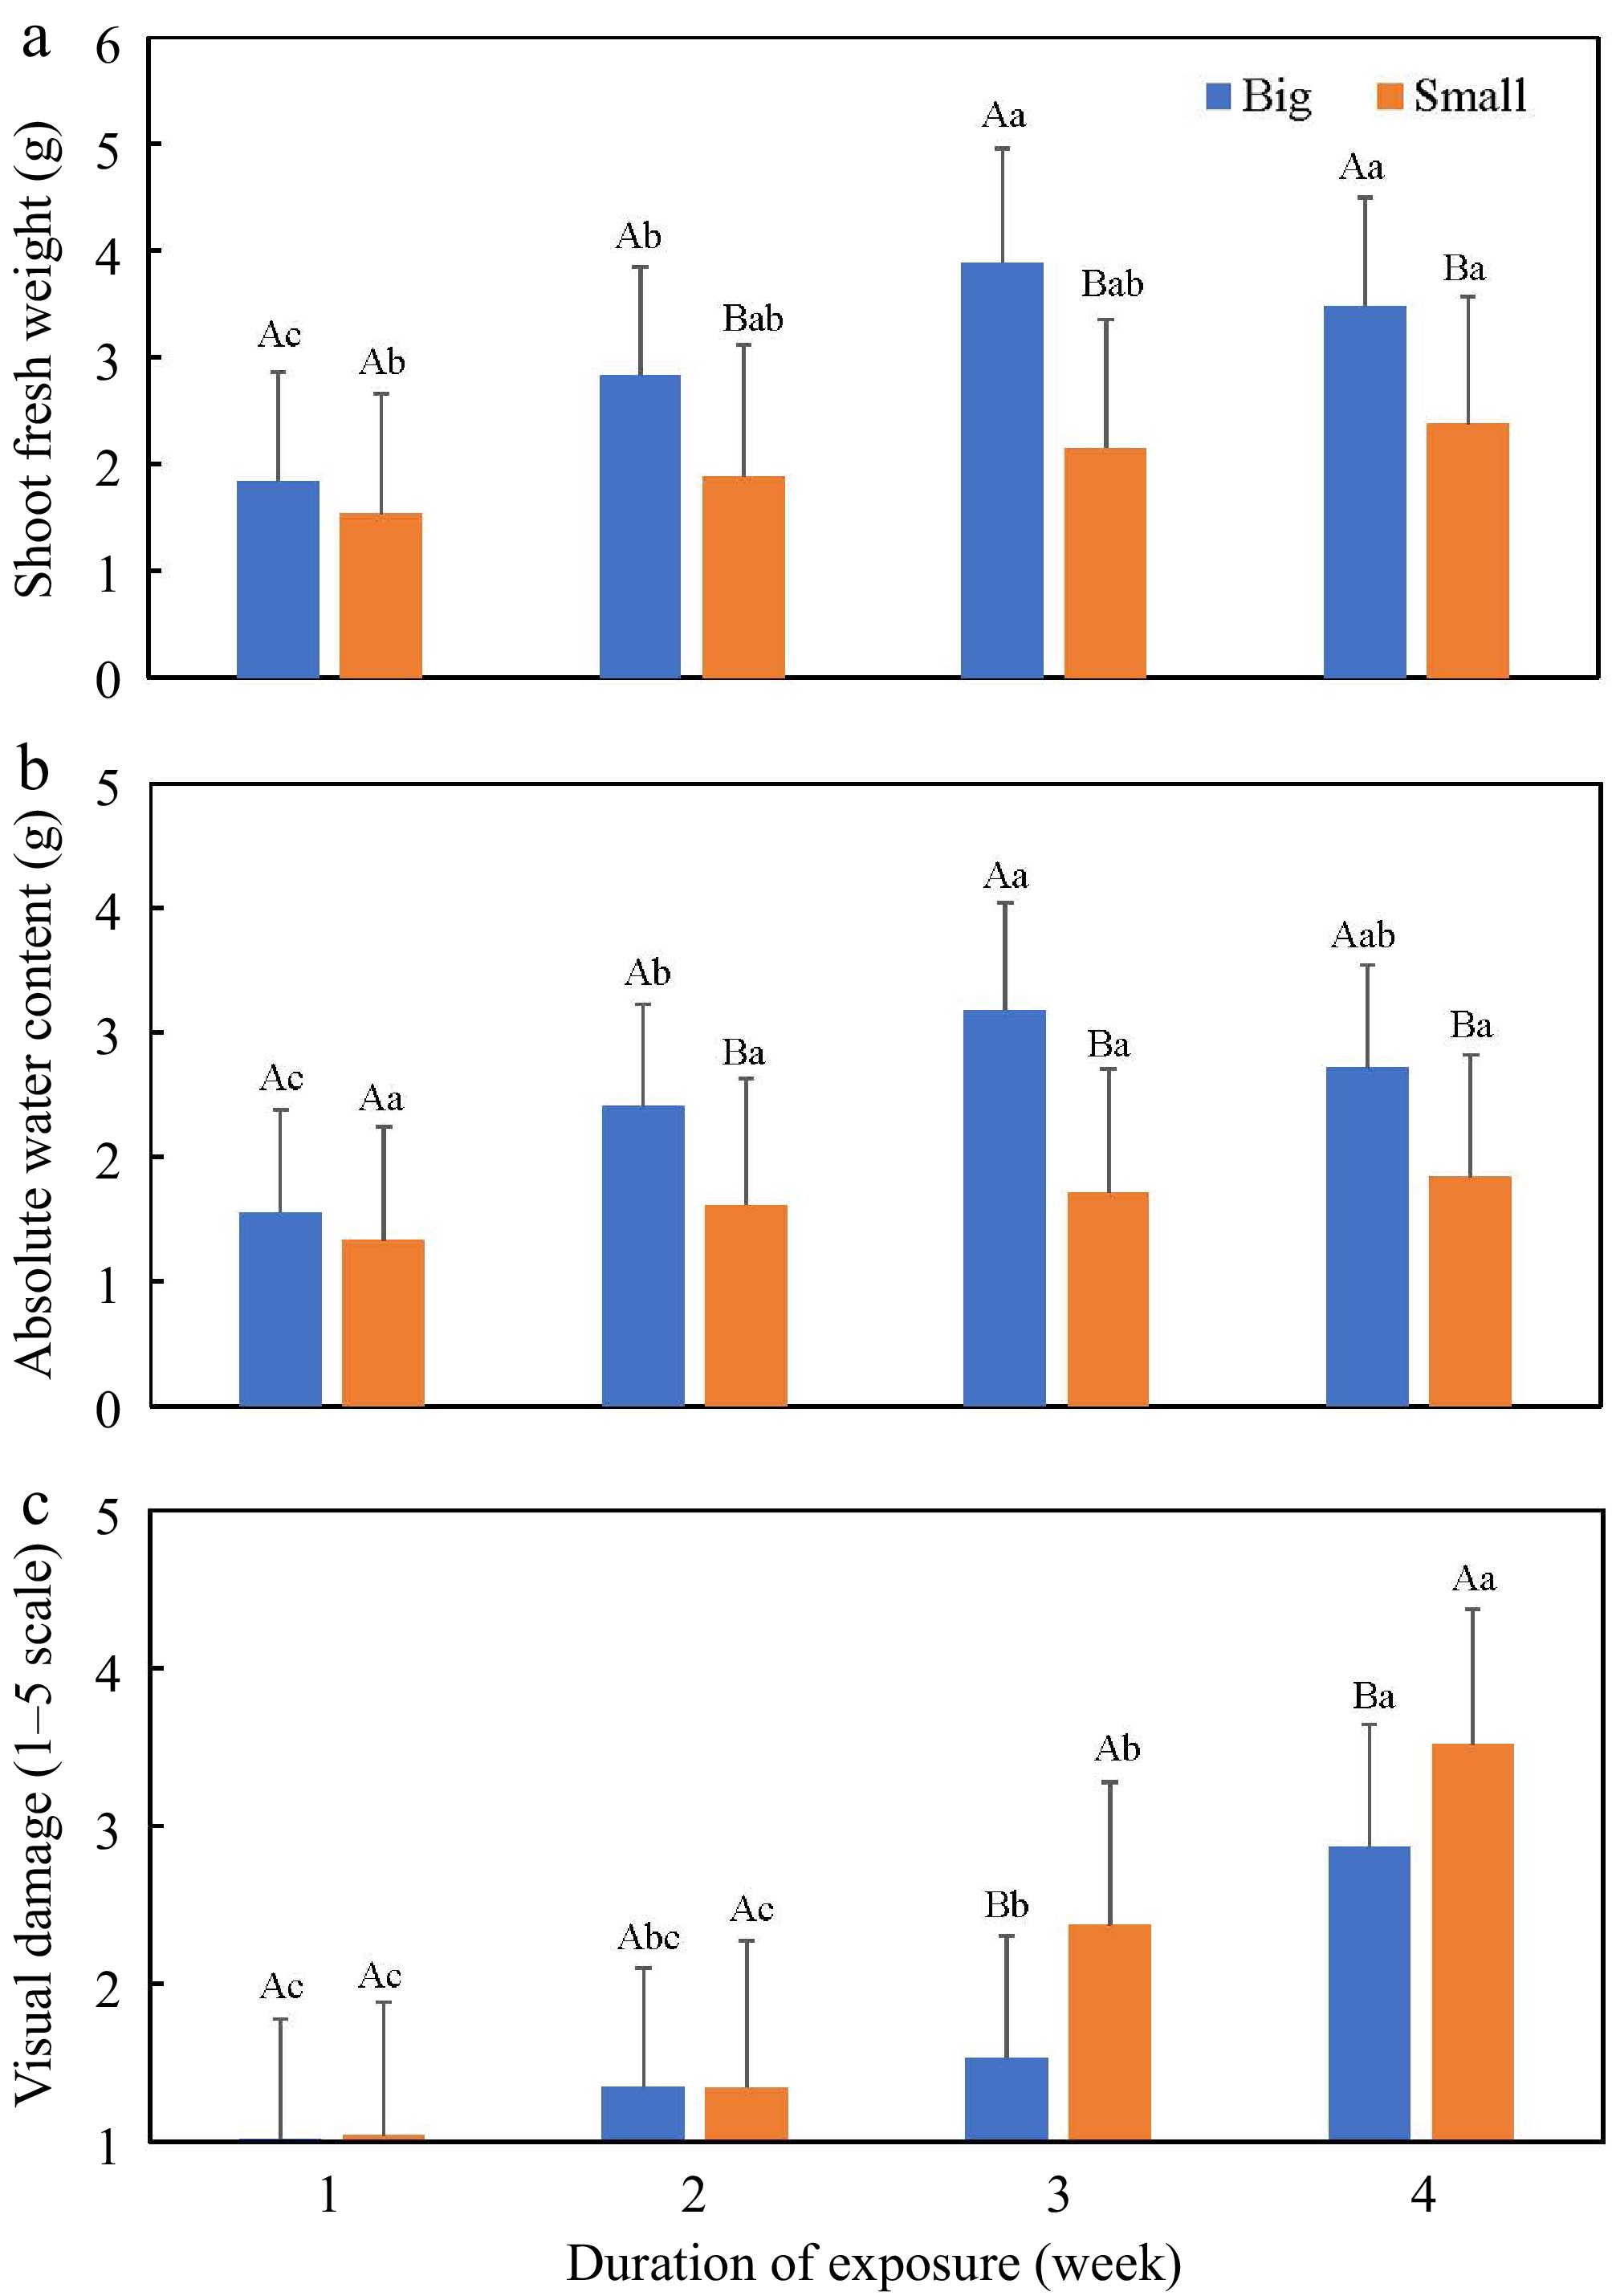
Figure 4.
(a) Shoot fresh weight (g), (b) absolute water content (g), and (c) visual damage (1–5 scale, 1 = healthy plants and 5 = dead plants) as affected by container size (big and small) and duration of saline exposure (week). Uppercase letters indicate differences between container sizes in the same week at p ≤ 0.05. Lowercase letters indicate differences among weeks in the same container size at p ≤ 0.05. Big container = 556 mL (6.4 cm diam. × 25.4 cm long); small container = 410 mL (3.8 cm diam. × 20.3 cm long).
-
Target salt
concentration (EC, dS·m−1)Na2SO4
(g·L−1)MgSO4·7H2O Na2SO4
(g·L−1)0 0.000 0.000 5 2.370 2.056 10 5.473 4.748 15 8.575 7.440 20 11.678 10.132 Table 1.
Salt mixtures to achieve the targeted salt concentrations from irrigation.
-
Score Description of plant visual damage 1 Healthy, green 2 No more than 25% of leaves are chlorotic/wilted, but no necrosis 3 Chlorosis, wilting, or necrosis on 50% of leaves 4 About 75% of the plants have chlorotic, wilted, or necrotic stem necrosis beginning 5 Plant is dead Table 2.
Description of plant visual damage using a 1–5 scale score.
-
Treatment ECe (dS·m−1) pH Salt concentration (SC, dS·m−1) 0 2.37 ± 3.05e 6.98 ± 0.62a 5 4.59 ± 3.00d 7.01 ± 0.62a 10 7.04 ± 3.05c 7.06 ± 0.62a 15 9.58 ± 3.05b 7.03 ± 0.62a 20 12.53 ± 3.00a 7.14 ± 0.62a p values (Partial eta-squared, ηp2) < 0.0001 (0.82) 0.8745 (0.06) Duration of exposure (DOE, week) 1 6.44 ± 3.16b 6.73 ± 0.63c 2 6.24 ± 3.16b 7.16 ± 0.63b 3 6.86 ± 3.23b 6.84 ± 0.63c 4 9.35 ± 3.16a 7.45 ± 0.63a p values (Partial eta-squared, ηp²) < 0.0001 (0.37) < 0.0001 (0.04) Container size (CS) Big* 7.41 ± 3.76a** 7.02 ± 1.34a Small 7.04 ± 3.76a 7.07 ± 1.34a p values (Partial eta-squared, ηp²) 0.3502 (0.01) 0.5935 (0.01) SC × DOE 0.6269 (0.12) 0.0553 (0.15) SC × CS 0.6551 (0.03) 0.7319 (0.06) DOE × CS 0.8304 (0.01) 0.7315 (0.04) SC × DOE × CS 0.9370 (0.07) 0.8335 (0.15) * Big container = 556 mL (6.4 cm-diam. × 25.4 cm long); small container = 410 mL (3.8-cm diam. × 20.3 cm long). ** Values represent mean ± standard deviation. Values followed by a common letter within each column are not significantly different at p ≤ 0.05. Table 3.
The electrical conductivity (ECe) and pH of the growing medium as affected by salt concentration (SC), duration of exposure (DOE), container size (CS), and their interactions.
-
Treatment aVD SFW (g) SDW (g) AWC (g) aRDW (g) RL (cm) SRL (cm·g−1) Salt concentration (SC, dS·m−1) 0 1.28 ± 1.02c 3.87 ± 1.41a 0.65 ± 0.34a 3.23 ± 1.13a 0.11 ± 0.06a 11.83 ± 0.85ab 124.25 ± 164.95a 5 1.36 ± 1.02c 3.53 ± 1.41a 0.59 ± 0.34a 2.95 ± 1.13a 0.11 ± 0.06ab 12.58 ± 0.85a 147.55 ± 162.58a 10 1.87 ± 1.02b 2.24 ± 1.36b 0.45 ± 0.34b 1.80 ± 1.07b 0.08 ± 0.06bc 10.84 ± 0.85ab 195.38 ± 147.53a 15 2.14 ± 0.96b 1.79 ± 1.36b 0.36 ± 0.34bc 1.44 ± 1.07b 0.07 ± 0.06cd 10.31 ± 0.85b 209.53 ± 139.22a 20 2.76 ± 1.02a 1.06 ± 1.36c 0.25 ± 0.34c 0.82 ± 1.07c 0.05 ± 0.06d 8.37 ± 0.85c 239.96 ± 143.23a p values (Partial eta-squared, ηp²) 0.0002 (0.15) < 0.0001 (0.62) < 0.0001 (0.49) < 0.0001 (0.62) 0.0012 (0.35) 0.0054 (0.24) 0.0631 (0.15) Duration of exposure (DOE, week) 1 1.04 ± 0.95c 1.69 ± 1.33c 0.25 ± 0.32c 1.45 ± 1.08c 0.09 ± 0.06b 10.75 ± 4.05a 146.02 ± 136.42b 2 1.35 ± 1.01c 2.36 ± 1.39b 0.36 ± 0.38b 2.01 ± 1.14b 0.11 ± 0.06a 11.52 ± 4.24a 146.31 ± 136.42b 3 1.95 ± 1.01b 3.02 ± 1.39a 0.58 ± 0.38a 2.45 ± 1.14a 0.08 ± 0.06b 10.86 ± 4.36a 178.11 ± 134.46b 4 3.19 ± 1.01a 2.93 ± 1.39a 0.65 ± 0.38a 2.28 ± 1.08a 0.06 ± 0.06c 10.02 ± 4.24a 262.89 ± 131.55a p values (Partial eta-squared, ηp²) < 0.0001 (0.66) < 0.0001 (0.33) < 0.0001 (0.59) < 0.0001 (0.25) 0.0005 (0.22) 0.3304 (0.04) 0.0002 (0.24) Container size (CS) bBig 1.69 ± 1.07b 3.01 ± 1.61a 0.55 ± 0.45a 2.47 ± 1.16a 0.10 ± 0.09ac 11.61 ± 4.47a 156.35 ± 130.94b Small 2.07 ± 1.25a 1.99 ± 1.70b 0.37 ± 0.45b 1.63 ± 1.34b 0.07 ± 0.09b 9.97 ± 5.10b 210.31 ± 152.59a p values (Partial eta-squared, ηp²) 0.0064 (0.09) < 0.0001 (0.32) < 0.0001 (0.28) < 0.0001 (0.30) < 0.0001 (0.19) 0.0062 (0.09) 0.0111 (0.06) SC × DOE 0.0002 (0.36) < 0.0001 (0.41) 0.0002 (0.36) < 0.0001 (0.40) 0.7244 (0.12) 0.3009 (0.15) 0.2585 (0.18) SC × CS 0.9942 (0.01) 0.087 (0.08) 0.0519 (0.08) 0.1194 (0.07) 0.2794 (0.06) 0.2906 (0.05) 0.6338 (0.07) DOE × CS 0.0549 (0.08) 0.0331 (0.11) 0.1509 (0.06) 0.0315 (0.11) 0.4091 (0.05) 0.1709 (0.04) 0.1990 (0.02) SC × DOE × CS 0.8907 (0.07) 0.4813 (0.14) 0.4723 (0.14) 0.4980 (0.13) 0.1845 (0.21) 0.4981 (0.12) 0.3333 (0.17) aVD = visual damage rating (1–5 scale, 1 = healthy plants and 5 = dead plants), SFW = shoot fresh weight, SDW = shoot dry weight, AWC = absolute water content, RDW = root dry weight, RL = root length, SRL = specific root length. bBig container = 556 mL (6.4 cm-diam. × 25.4 cm long); small container = 410 mL (3.8-cm diam. × 20.3 cm long). cValues represent mean ± standard deviation. Values followed by the same letter within each column are not significantly different at p ≤ 0.05. Table 4.
Growth of pea seedlings as affected by salt concentration, exposure duration, container size, and their interactions.
-
ECe pH RDW RL SRL AWC SDW SFW VD ECe pH 0.22 (0.0173) RDW −0.45 (< 0.0001) −0.20 (0.0386) RL −0.42 (< 0.0001) −0.08 (0.4096) 0.64 (<0.0001) SRL 0.34 (0.0004) 0.24 (0.0156) −0.71 (0.0002) −0.33 (0.0002) AWC −0.49 (< 0.0001) 0.03 (0.7346) 0.61 (< 0.0001) 0.56 (< 0.0001) −0.44 (< 0.0001) SDW −0.26 (0.0050) 0.16 (0.0921) 0.48 (< 0.0001) 0.46 (< 0.0001) −0.29 (< 0.0001) 0.86 (< 0.0001) SFW −0.46 (< 0.001) 0.06 (0.5491) 0.60 (< 0.0001) 0.55 (< 0.0001) −0.42 (0.0011) 0.99 (< 0.0001) 0.90 (< 0.0001) VD 0.49 (< 0.0001) 0.27 (0.0043) −0.40 (< 0.0001) −0.30 (0.0005) 0.44 (< 0.0001) −0.37 (< 0.0001) −0.02 (0.8539) −0.31 (0.0003) ECe = electrical conductivity from saturated growing medium, RDW = root dry weight, RL = root length, SRL = specific root length, AWC = absolute water content, SFW = shoot fresh weight, SDW = shoot dry weight, VD = visual damage rating (1–5 scale, 1 = healthy plants and 5 = dead plants). Table 5.
Pearson correlation coefficient analyses (p-value) between electrical conductivity (ECe) and pH of growing medium and growth indices in pea seedlings.
Figures
(4)
Tables
(5)