-
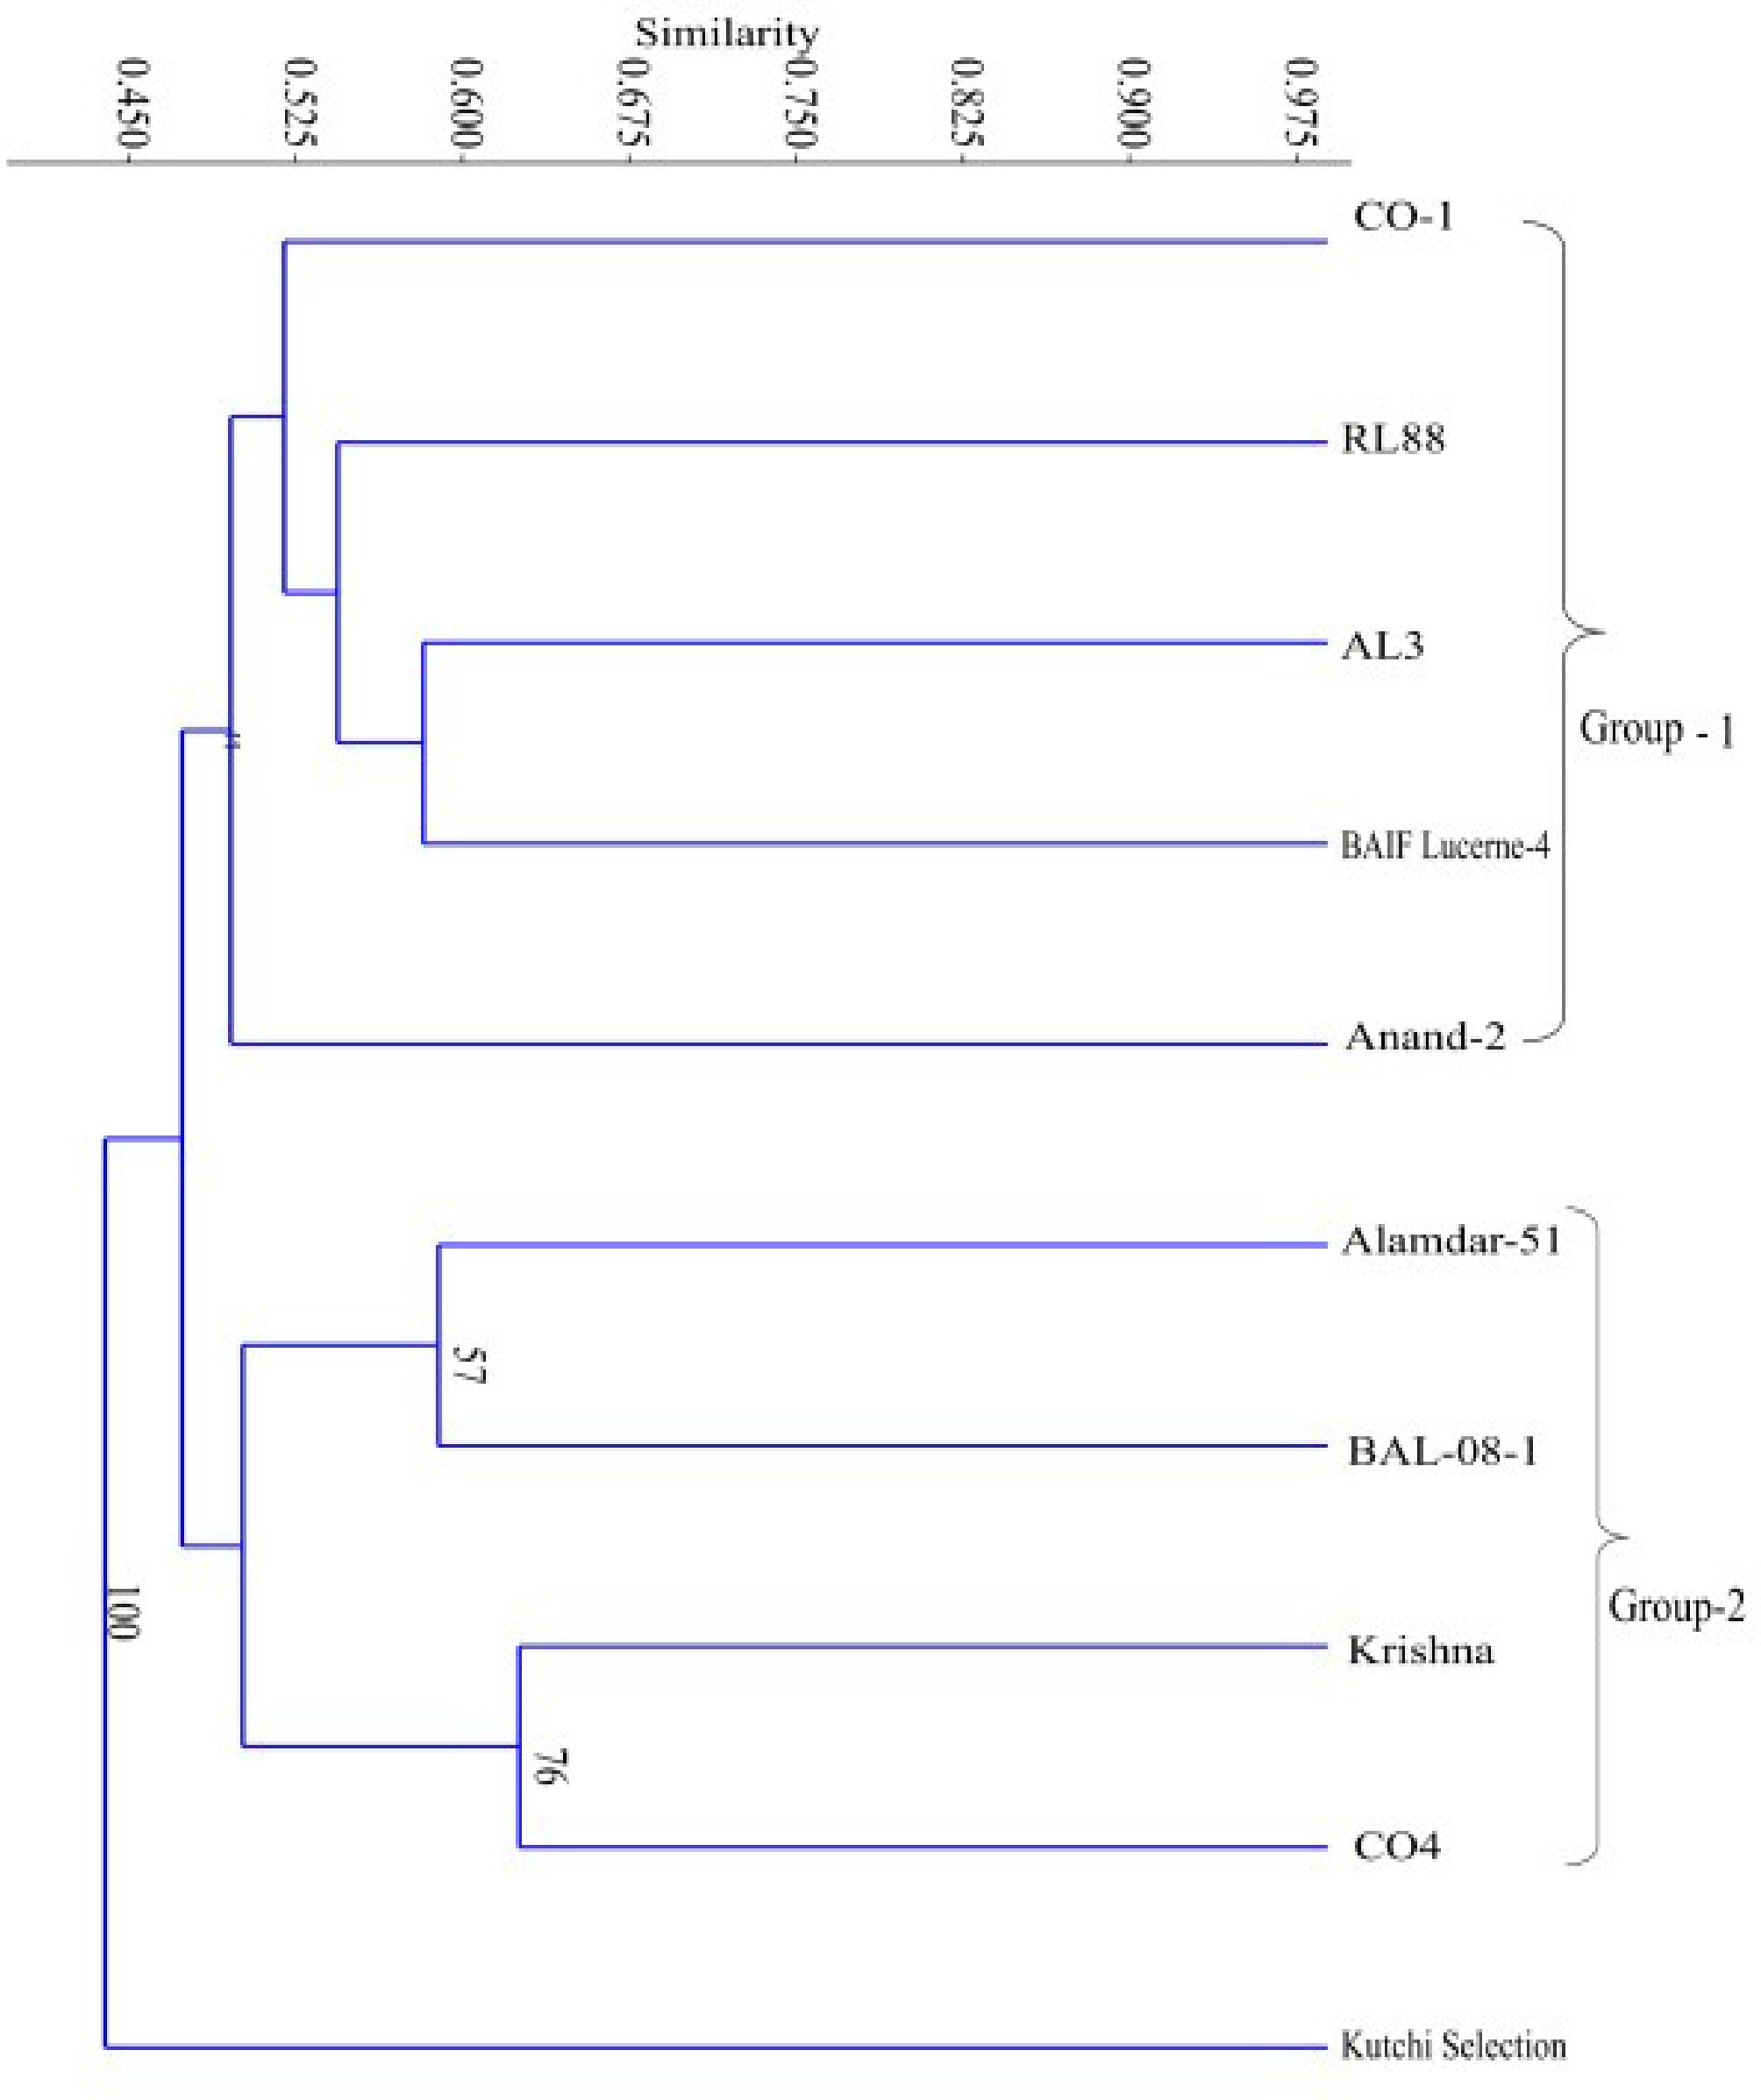
Figure 1.
Dendrogram constructed by UPGMA analysis using Jaccard coefficient of ten genotypes of lucerne using ISSR primers.
-
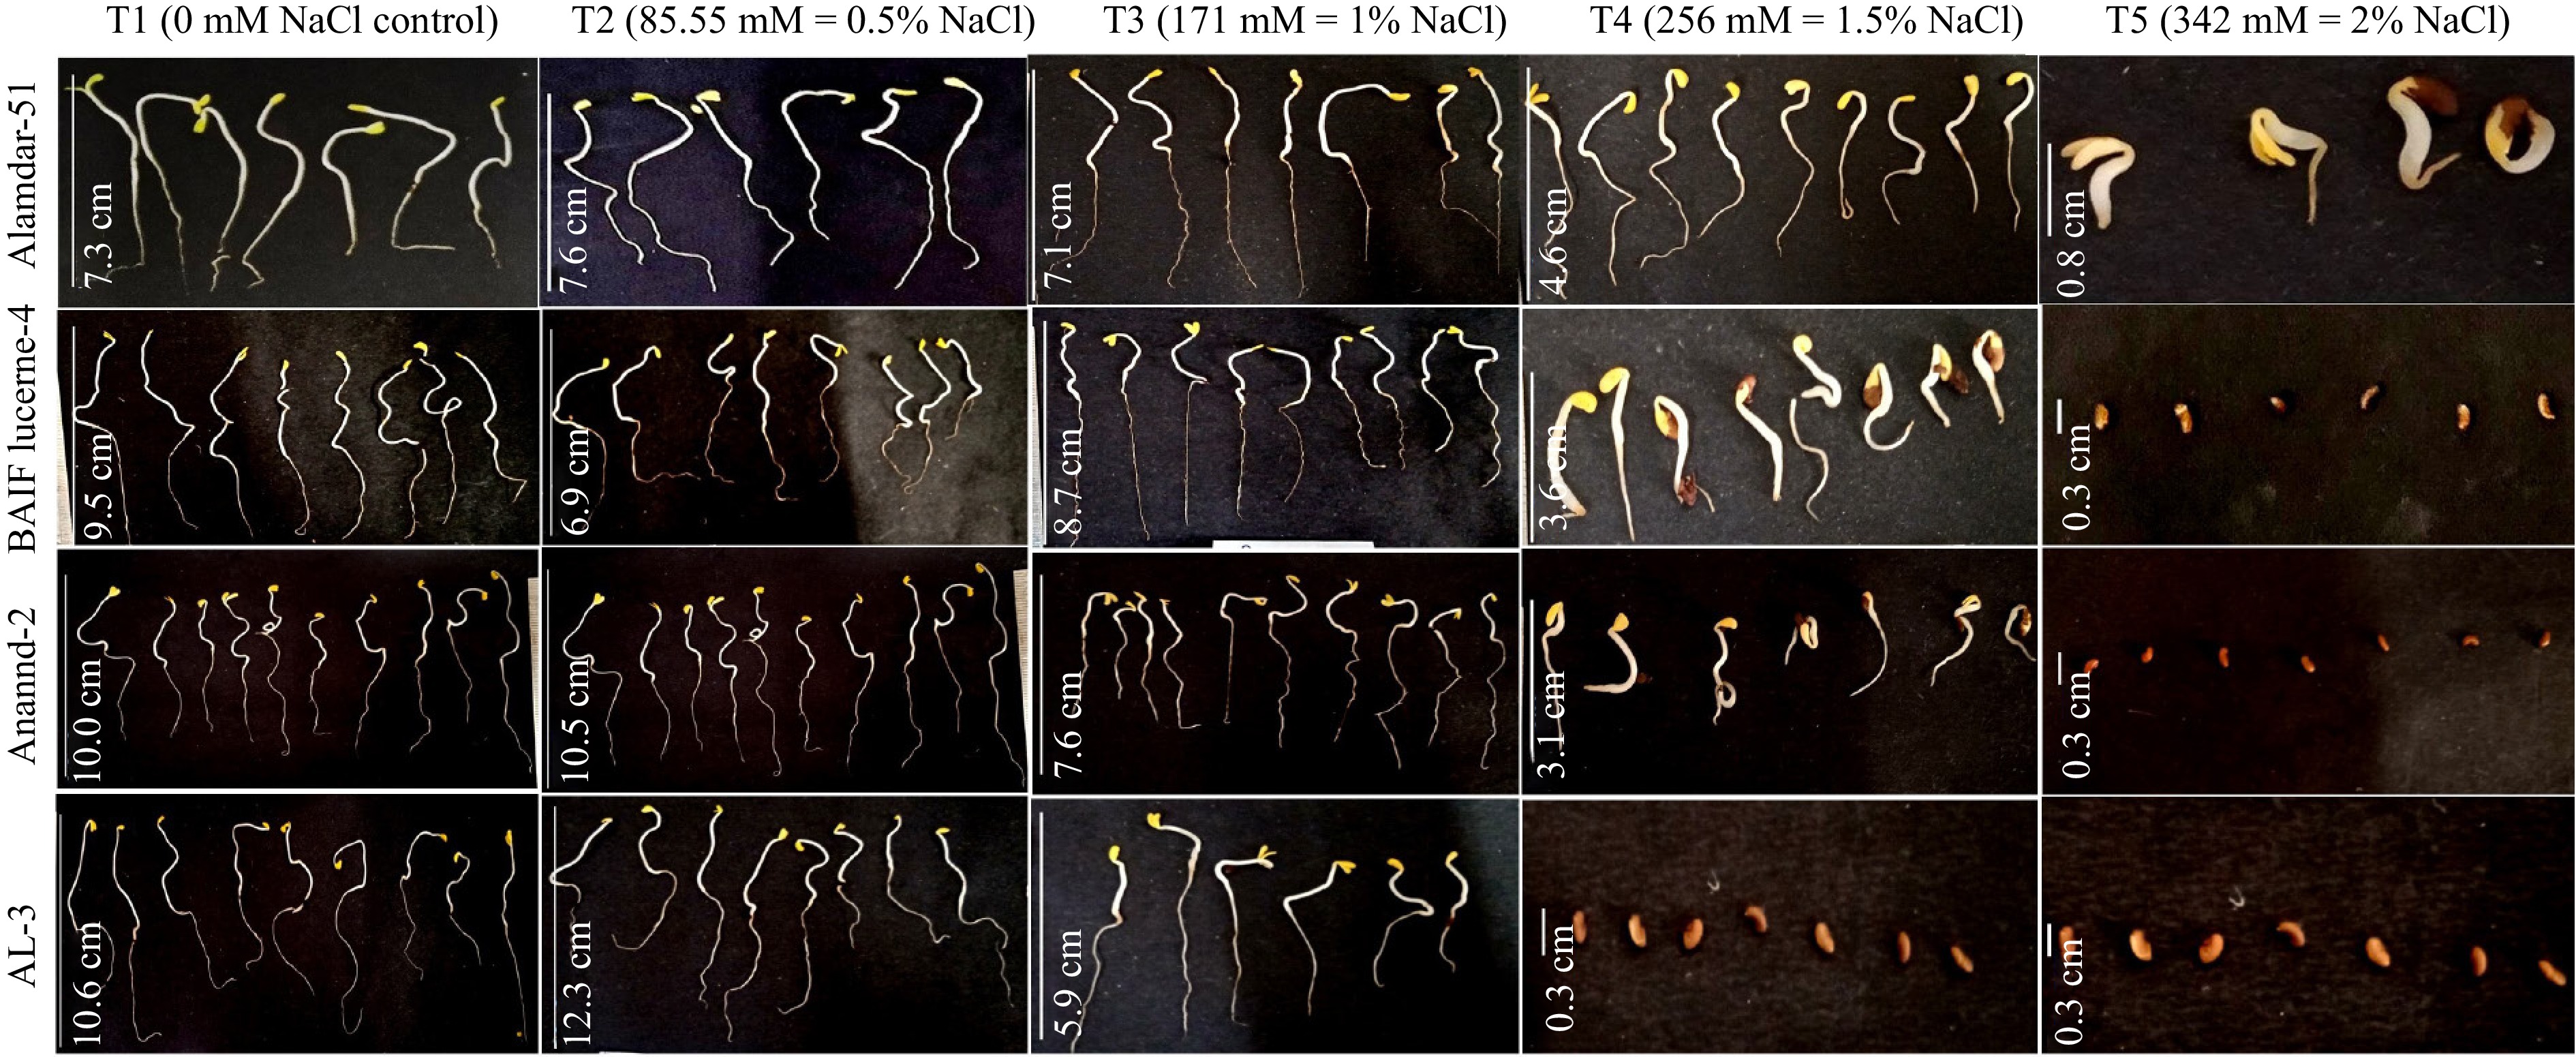
Figure 2.
The effect of various salt concentrations on seed germination and radicle elongation of selected genotypes.
-
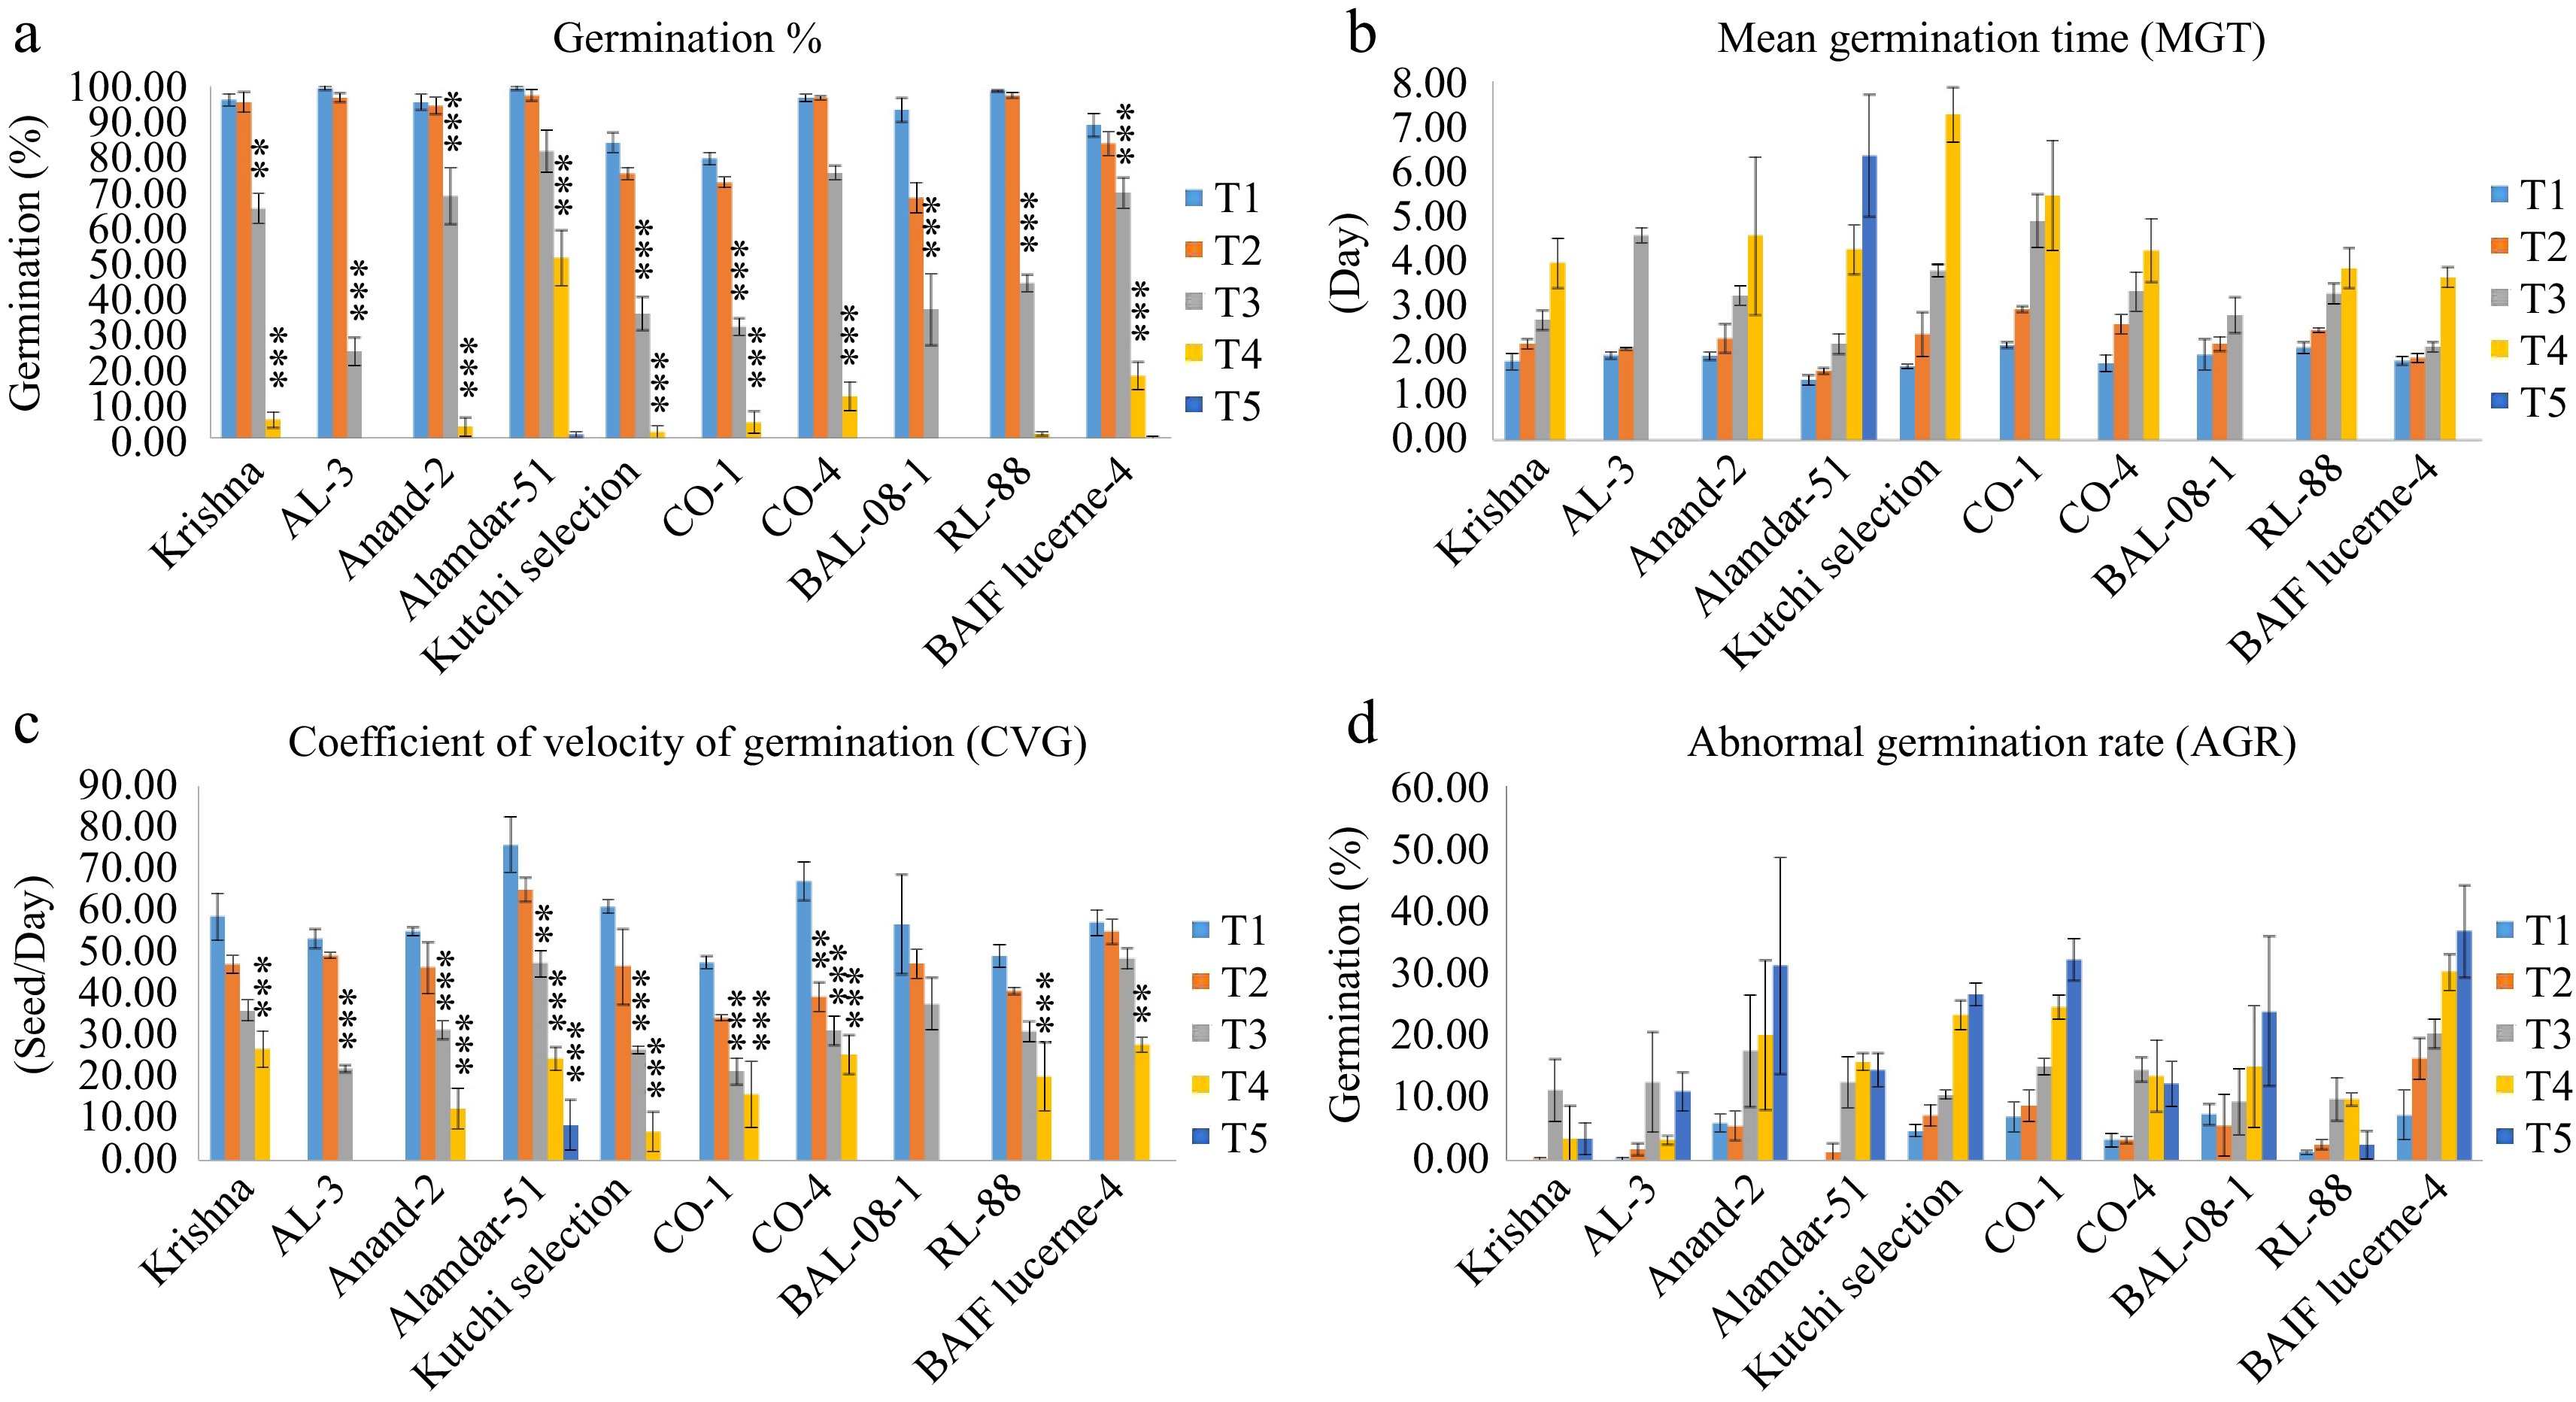
Figure 3.
Effect of five different concentrations of salt stress (T1 - 0 mM, T2 - 85.55 mM, T3 - 171 mM, T4 - 256 mM, and T5 - 342 mM NaCl) on germination indices of ten different genotypes of lucerne. The means are averages of 100 seeds with four replications. The significant differences at < 0.05, Tukey's post hoc test (*** < 0.001, ** < 0.01, NS - non-significant). (a) Germination percentage. (b) Mean germination time. (c) Coefficient of velocity of germination. (d) Abnormal germination rate.
-
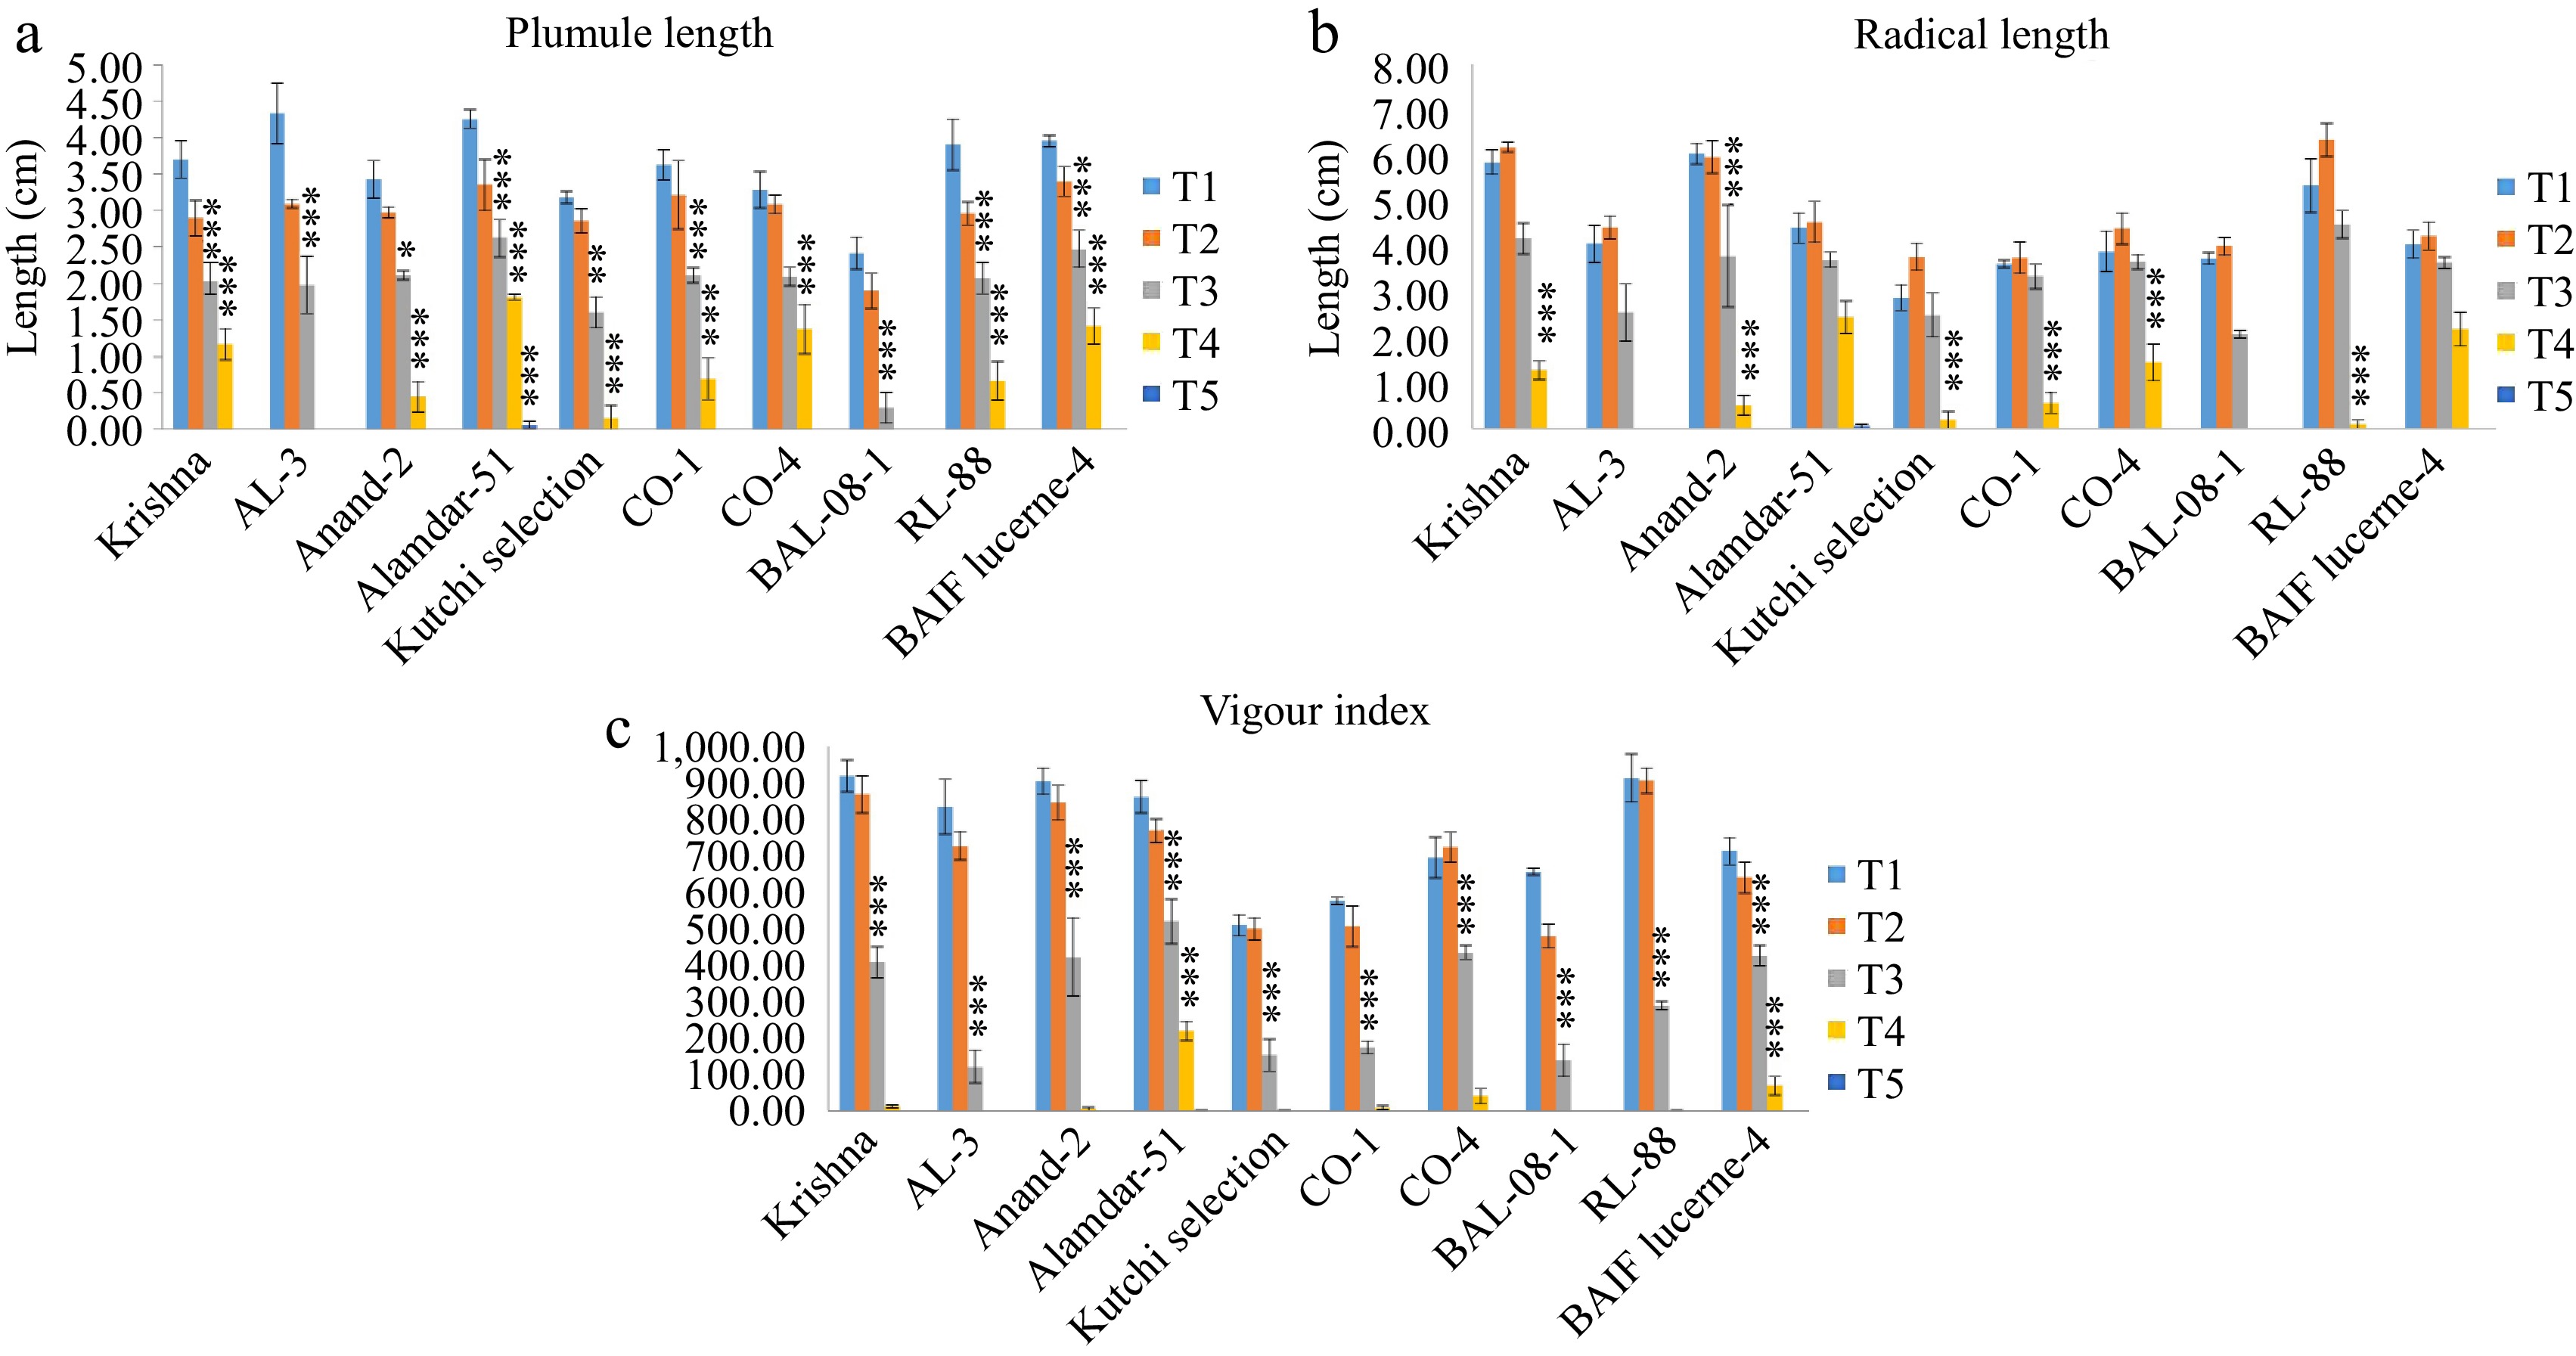
Figure 4.
Effect of five different concentrations of salt stress (T1 - 0 mM, T2 - 85.55 mM, T3 - 171 mM, T4 - 256 mM, and T5 - 342 mM NaCl) on seedling parameters of ten different genotypes of lucerne. The means are averages of 100 seeds with four replications. The significant differences at < 0.05, Tukey's post hoc test (*** < 0.001, * < 0.05, NS - non-significant). (a) Plumule length. (b) Radical length. (c) Vigor index.
-
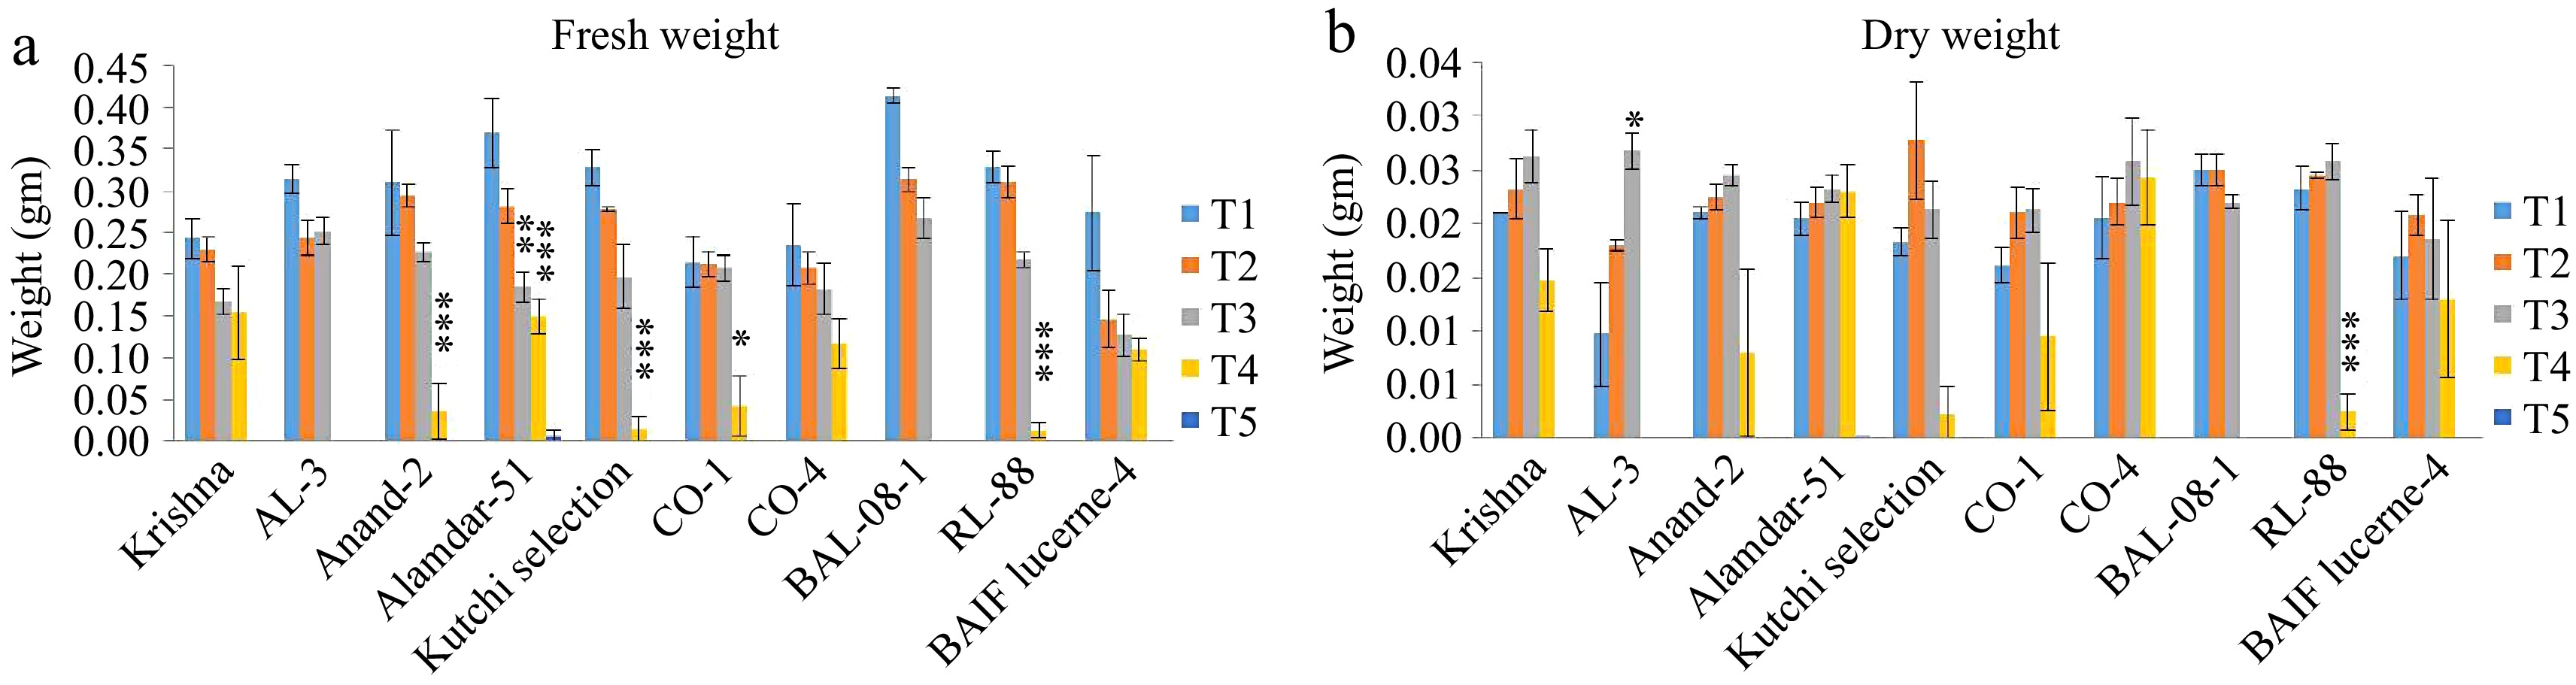
Figure 5.
Effect of five different concentrations of salt stress (T1 - 0 mM, T2 - 85.55 mM, T3 - 171 mM, T4 - 256 mM, and T5 - 342 mM NaCl) on fresh weight and dry weight of seedlings of ten different genotypes of lucerne. The means are averages of 100 seeds with four replications. The significant differences at < 0.05, Tukey's post hoc test (*** < 0.001, ** < 0.01, * < 0.05, NS- non-significant). (a) Fresh weight. (b) Dry weight.
-
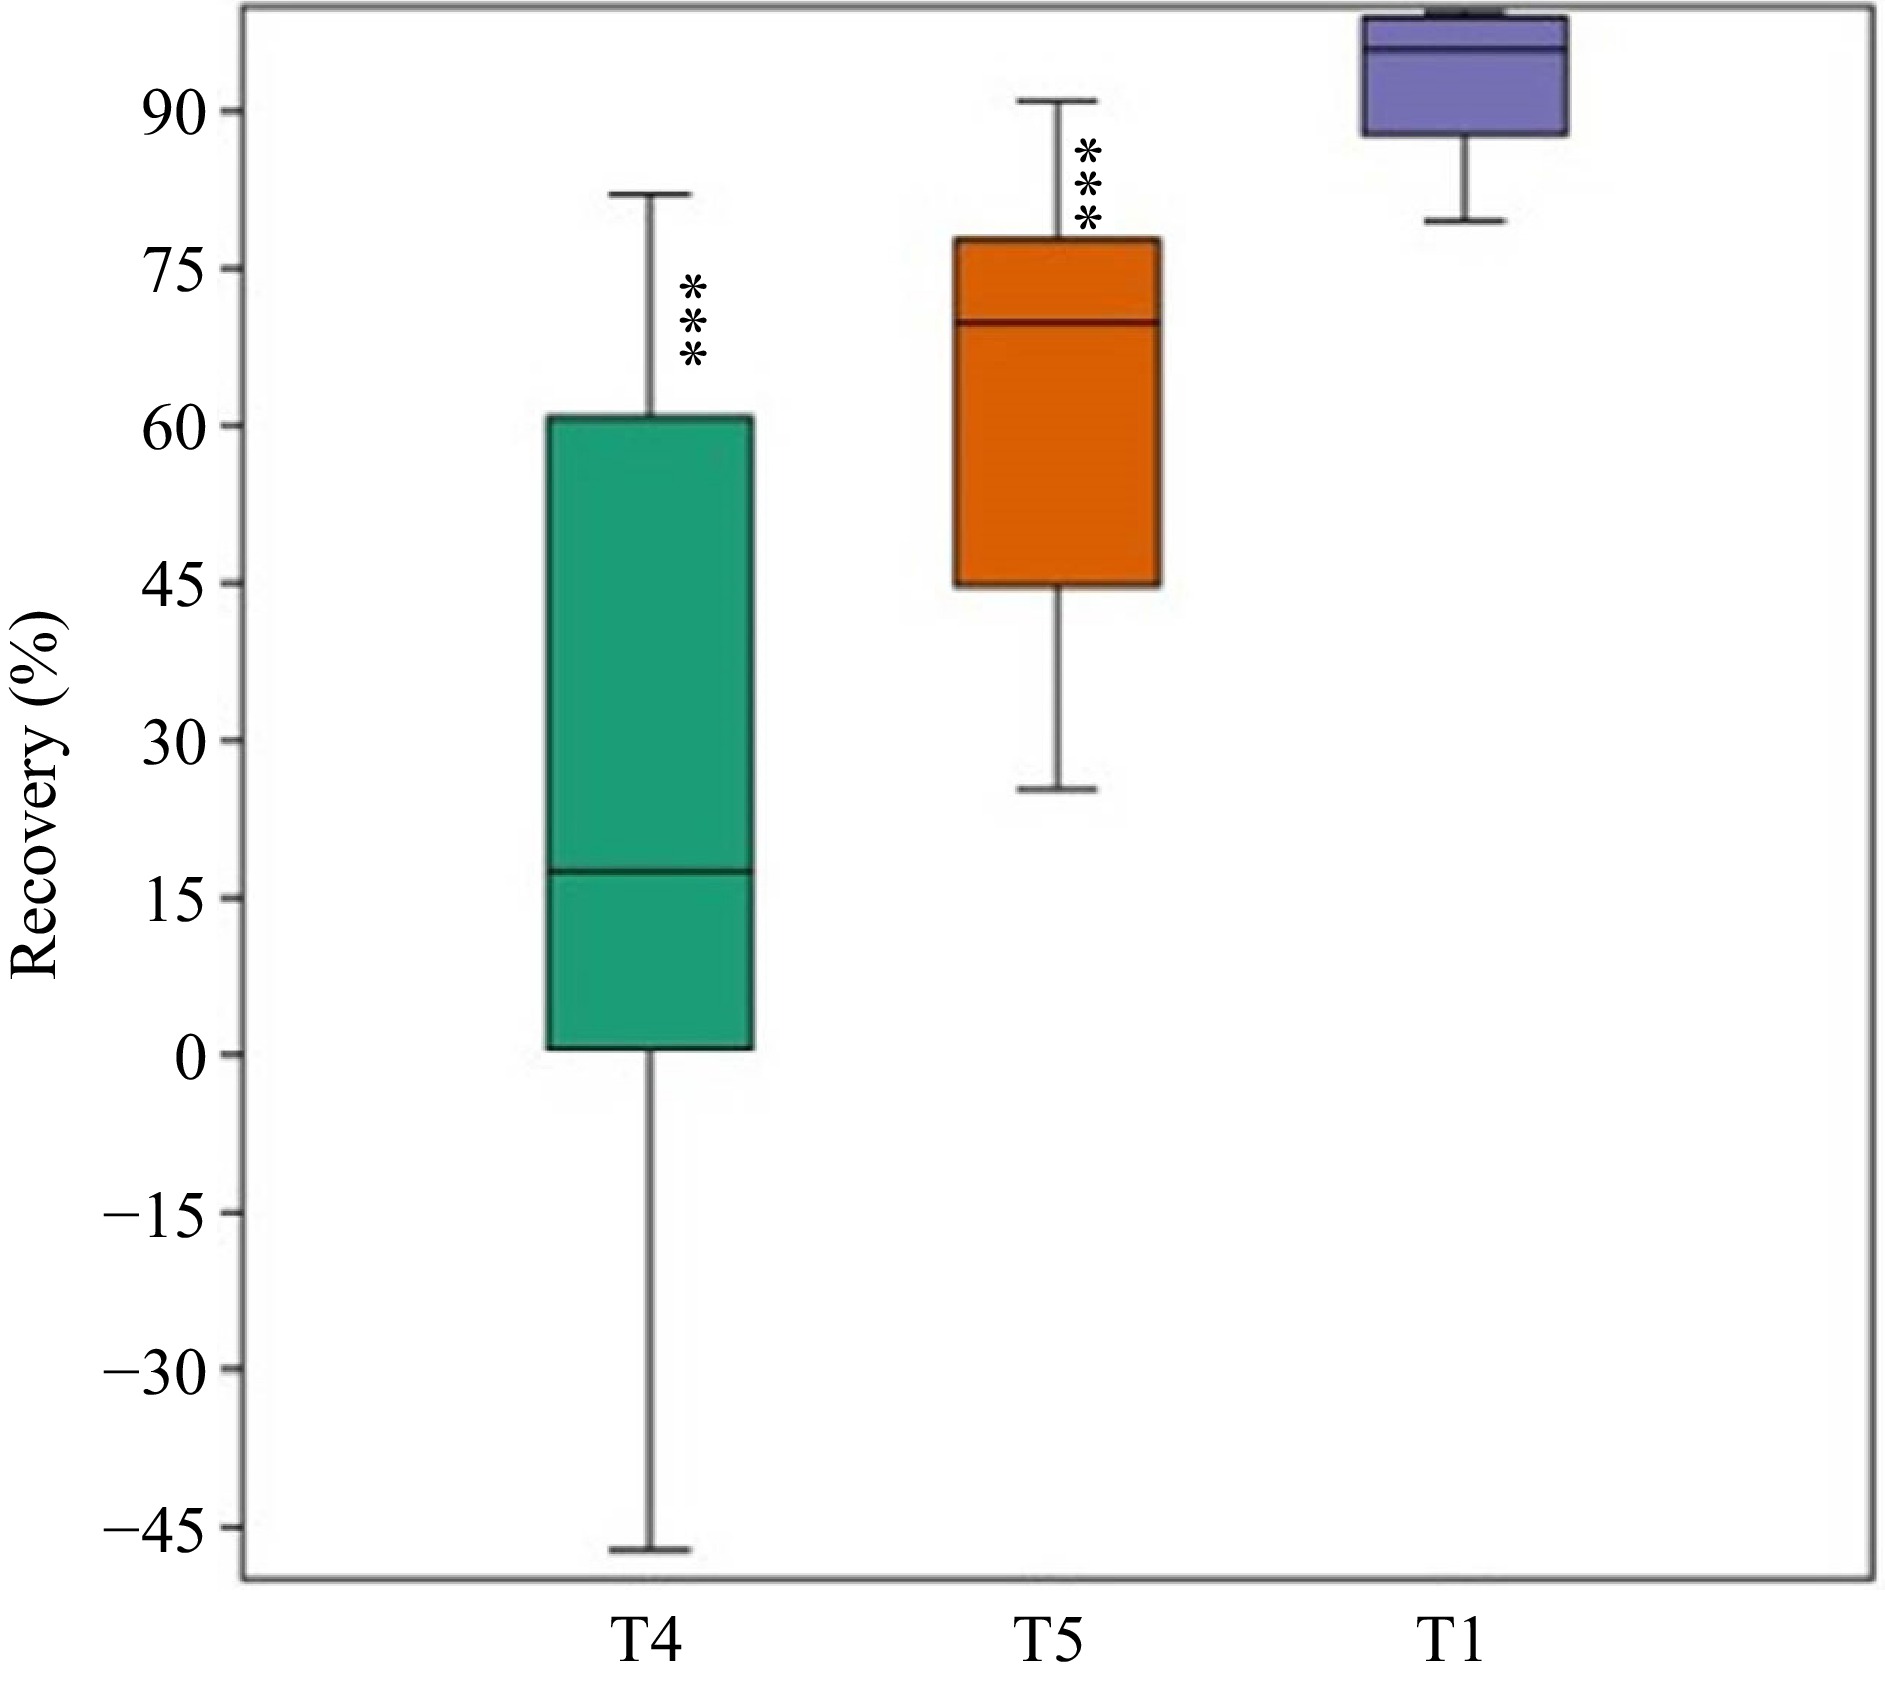
Figure 6.
Percentage recovery of non-germinated seeds from higher salt concentrations T4 and T5 recorded. The germination percentage from the T1 control treatment was included for comparison (*** p < 0.001).
-
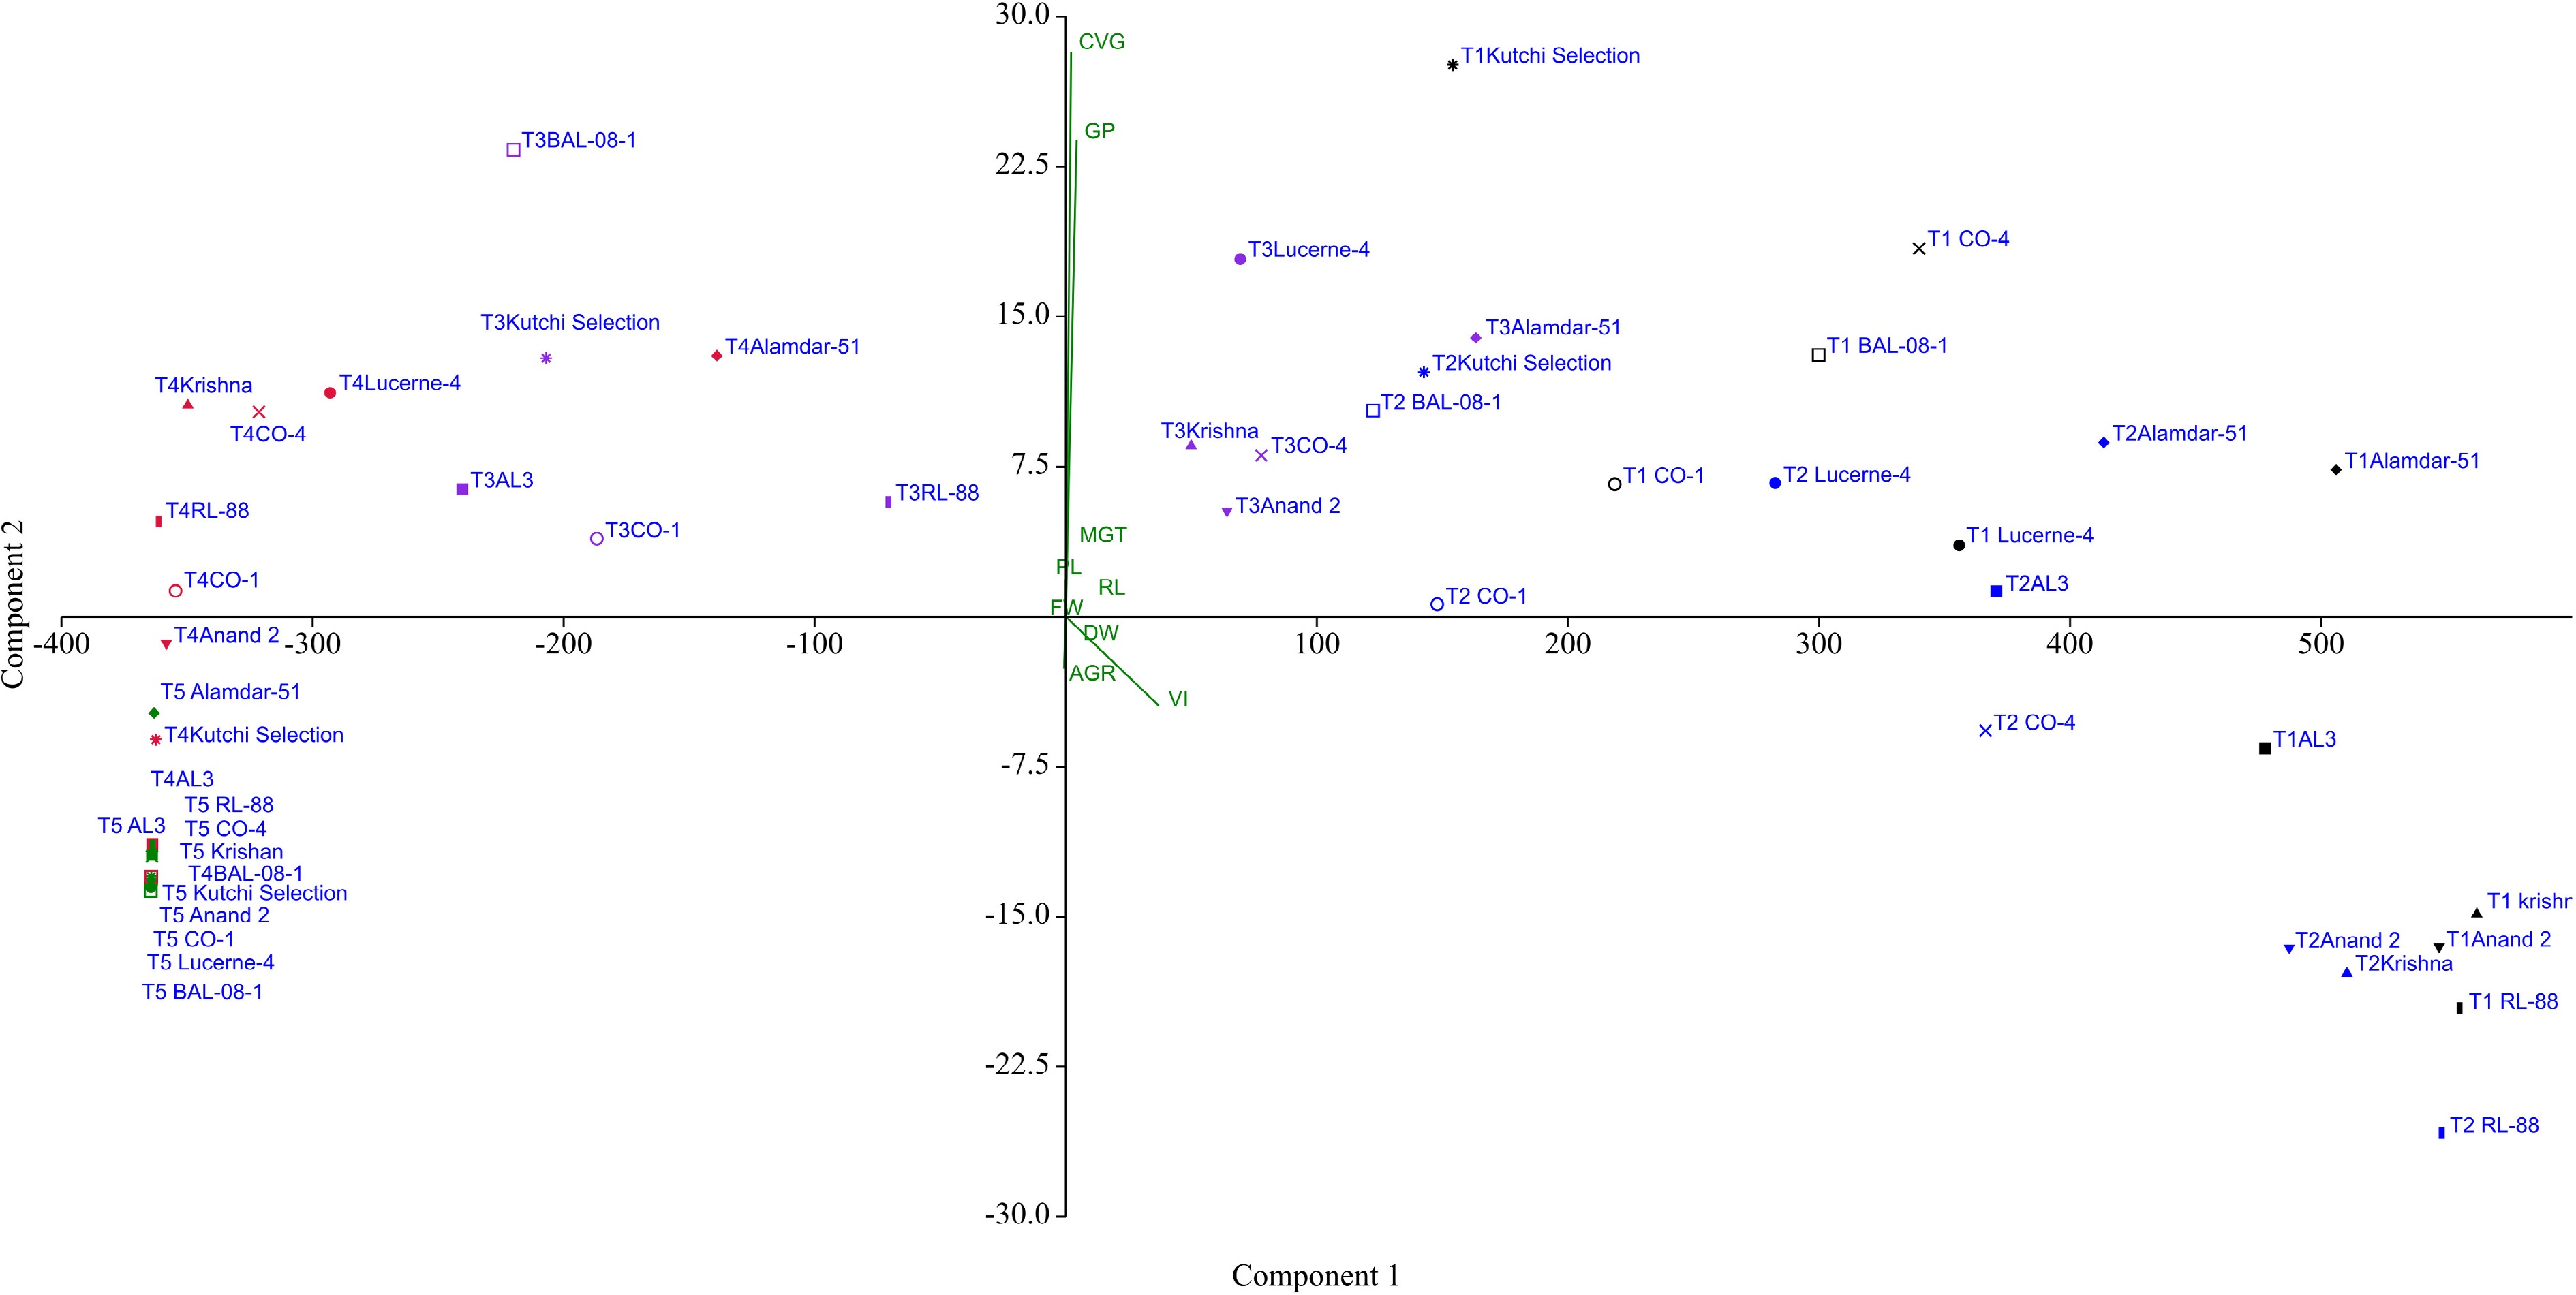
Figure 7.
Principal Component Analysis (PCA) showing the effect of salinity treatments on ten lucerne genotypes for studied nine germination and six seedling parameters.
-
Primer repeat Total no.
of bandsNo. of polymorphic bands % Polymorphic bands PIC SPI (AG)8Y*T 12 12 100.00 0.37 3.72 (AC)8G 8 5 62.50 0.47 4.72 (AC)8Y*T 20 18 90.00 0.43 4.27 (AT)8G 11 11 100.00 0.40 4.00 (CA)8R*C 13 12 92.31 0.42 4.19 (CA)8R*G 11 9 81.82 0.45 4.46 (AG)8Y*A 14 9 64.29 0.47 4.66 (CA)8A 6 4 66.67 0.34 3.39 (AG)8C 8 6 75.00 0.45 4.47 Total 103 86 83.50 * Y = C or T (Pyrimidine), and R = A or G (Purine). Table 1.
Comparison of primers, number of fragments scored, number of polymorphic bands, and percentage polymorphism.
-
Source of variance Df Germination percentage Mean germination time Coefficient of velocity of germination Abnormal germination rate MC F P MC F P MC F P MC F P Genotypes 9 2,122.63*** 20.91 1.54E-22 4.877*** 3.537 0.00053 944.705*** 12.17 2.54E-14 735.164*** 10.36 2.54E-12 Treatments 4 71,011.3*** 699.5 7.06E-96 55.88*** 40.52 5.47E-23 11,997.1*** 256.9 5.07E-66 1,979.5*** 27.9 2.52E-17 Genotypes × treatments 36 503.738*** 4.962 1.55E-12 3.92*** 2.842 5.17E-06 150.515** 1.938 0.00316 94.698NS 1.335 0.1186 df: Degree of freedom; MC: Mean square; F: ratio of variances at 0.05 level; P: p-value; *** < 0.001, ** < 0.01, NS: non-significant. Table 2.
Two-way ANOVA of the effect of genotypes and salinity treatments, their interaction on the germination percentage, mean germination time, coefficient of velocity of germination, and abnormal germination rate.
-
Source of variance Df Plumule length Radical length Vigor index MC F P MC F P MC F P Genotypes 9 3.2683*** 15.61 8.44E-18 18.87*** 18.87 8.70E-21 190,890*** 26.59 5.6E-27 Treatments 4 89.2529*** 426.4 8.20E-81 371.4*** 371.4 1.05E-76 4.88E+06*** 679.9 5.34E-95 Genotypes × treatments 36 0.505971*** 2.417 0.000112 4.221*** 4.221 2.49 E-10 42,130.6*** 5.868 4.29E-15 df: Degree of freedom; MC: Mean square; F: ratio of variances at 0.05 level; P: p-value; *** < 0.001, NS: non-significant. Table 3.
Effect of genotypes and salinity treatments and their interaction on the plumule length, radical length, and vigor index.
-
Source of variance Df Fresh weight Dry weight MC F P MC F P Genotypes 9 0.00773* 2.169 0.02722 0.0001*** 4.17 8.04E-05 Treatments 4 0.60435*** 169.5 1.40E-54 0.0038*** 114.4 1.58E-44 Genotypes × treatments 36 0.00789*** 5.22 0.000478 7.98E-05*** 2.414 0.000115 df: Degree of freedom; MC: Mean square; F: ratio of variances at 0.05 level; P: p-value; *** < 0.001, * < 0.05, NS: non-significant. Table 4.
Effect of genotypes and salinity treatments and their interaction on the fresh, dry weight and its ratio.
-
Source of variation SS df MS F P F crit Between Groups 45,123.1 11 4,102.1*** 4.720137 7.02E-06 1.878388 Within Groups 93,858.89 108 869.0638 Total 138,982 119 df: Degree of freedom; MS: Mean square; F: ratio of variances at 0.05 level; P: p-value; *** < 0.001, NS: non-significant. Table 5.
ANOVA of ten lucerne genotypes for recovery percentage.
-
Genotype Krishna AL-3 Anand-2 Alamdar-51 Kutchi selection Y R2 X Model R2 X Model R2 X Model R2 X Model R2 X Model Germination percentage 0.897** 1.832 y = −28.27x + 137.2 0.866* 1.647 y = −29.57x + 132.9 0.879* 1.816 y = −28.22x + 137.0 0.871* 2.18 y = −24.32x + 139.1 0.932** 1.76 y = −24.15x + 111.7 Mean germination time 0.035NS 1.218 y = −0.171x + 2.620 0.241NS 1.351 y = −0.583x + 3.452 0.019NS 1.155 y = −0.147x + 2.828 0.885* −0.09 y = 1.267x − 0.678 0.008NS 0.92 y = 0.158x + 2.535 Coefficient of velocity of germination 0.9499** 2.167 y = −13.65x + 74.49 0.917** 1.734 y = −15.48x + 71.22 0.987*** 1.997 y = −14.29x + 71.74 0.989*** 2.25 y = −17.47x + 96.48 0.981*** 1.86 y = −16.05x + 76.26 Abnormal germination rate 0.127NS 0.771 y = 1.025x + 0.625 0.421NS 0.474 y = 2.3x − 1.15 0.917* −0.138 y = 6.45x − 3.35 0.827* 0.16 y = 4.35x − 4.25 0.922** −0.12 y = 5.95x − 3.4 Plumule length 0.994*** 2.069 y = −0.912x + 4.700 0.949*** 1.759 y = −1.176x + 5.411 0.957** 1.915 y = −0.938x + 4.610 0.9645** 2.18 y = −0.993x + 5.402 0.941** 1.81 y = −0.906x + 4.278 Radical length 0.908** 1.939 y = −1.658x + 8.468 0.864* 1.761 y = −1.251x + 5.956 0.917* 1.853 y = −1.751x + 8.512 0.841* 2.18 y = −1.076x + 6.258 0.768* 1.77 y = −0.935x + 4.673 Fresh weight 0.960*** 2.040 y = −0.118x + 0.612 0.995*** 2.049 y = −0.089x + 0.458 0.936** 1.861 y = −0.088x + 0.429 0.956*** 2.41 y = −0.083x + 0.496 0.907* 1.80 y = −0.068x + 0.325 Dry weight 0.409NS 1.781 y = −0.003x + 0.025 0.750* 1.750 y = −0.006x + 0.031 0.633NS 1.753 y = −0.006x + 0.032 0.403NS 2.04 y = −0.002x + 0.022 0.839* 1.76 y = −0.005x + 0.024 Vigor index 0.918** 299.43 y = −269.3x + 1249 0.852* 273.14 y = −239.4x + 1054 0.919** 300.01 y = −264.8x + 1229 0.977*** 2.02 y = −227.1x + 1155 8.790** 1.67 y = −151.6x + 687.3 Genotype CO-1 CO-4 BAL-08-1 RL-88 BAIF Lucerne-4 Y R2 X Model R2 X Model R2 X Model R2 X Model R2 X Model Germination Percentage 0.933** 1.77 y = −22.72x + 105.8 0.882** 1.89 y = −27.82x + 139.6 0.948** 1.74 y = −25.5x + 116.1 0.906** 1.75 y = −29.37x + 136.4 0.906** 1.97 y = −24.35x + 125.1 Mean germination time 0.015NS 1.14 y = −0.172x + 3.592 0.031NS 1.20 y = −0.180x + 2.912 0.534NS 1.61 y = −0.598x + 3.168 0.088NS 1.37 y = −0.276x + 3.154 0.046NS 1.25 y = −0.175x + 2.393 Coefficient of velocity of germination 0.985*** 2.03 y = −11.28x + 57.59 0.933** 2.03 y = −14.73x + 76.67 0.904** 1.80 y = −15.98x + 76.13 0.964* 2.15 y = −11.81x + 63.53 0.865* 2.15 y = −14.04x + 79.59 Abnormal germination rate 0.956** −0.27 y = 6.575x − 2.275 0.631NS −0.04 y = 2.825x + 0.875 0.823* −0.19 y = 4.212x − 0.412 0.133NS 0.65 y = 0.975x + 2.225 0.989* −0.51 y = 7.225x + 0.375 Plumule length 0.973*** 1.96 y = −0.977x + 4.862 0.949** 2.13 y = −0.827x + 4.450 0.858* 1.59 y = −0.674x + 2.945 0.990*** 1.94 y = −1.010x + 4.952 0.975** 2.11 y = −0.989x + 5.217 Radical length 0.821* 1.89 y = −1.043x + 5.388 0.818* 2.02 y = −1.072x + 5.896 0.877** 1.75 y = −1.147x + 5.405 0.796* 1.76 y = −1.691x + 8.323 0.820* 2.14 y = −1.013x + 5.863 Fresh weight 0.900** 1.76 y = −0.019x + 0.089 0.894** 1.66 y = −0.031x + 0.139 0.910** 1.79 y = −0.114x + 0.540 0.930** 1.79 y = −0.106x + 0.500 0.972*** 1.86 y = −0.101x + 0.481 Dry weight 0.505NS 1.53 y = −0.001x + 0.005 0.736NS 1.70 y = −0.003x + 0.015 0.807* 1.77 y = −0.007x + 0.036 0.694NS 1.72 y = −0.007x + 0.036 0.785* 1.84 y = −0.007x + 0.037 Vigor index 0.912** 1.70 y = −164.8x + 747.2 0.895** 1.82 y = −207.1x + 1000 0.905** 1.64 y = −179.0x + 791.9 0.879** 1.68 y = −272.9x + 1240 0.946** 1.88 y = −199.5x + 967.8 X = standardize regression coefficients corresponding salinity, * p < 0.05, ** p < 0.01 (Significance at 5%), NS: non-significant. R2: square of total correlation coefficient. Table 6.
Linear regressions between the salinity levels (0, 85.55, 171, 256, 342 mM NaCl) and various parameters measured.
Figures
(7)
Tables
(6)