-
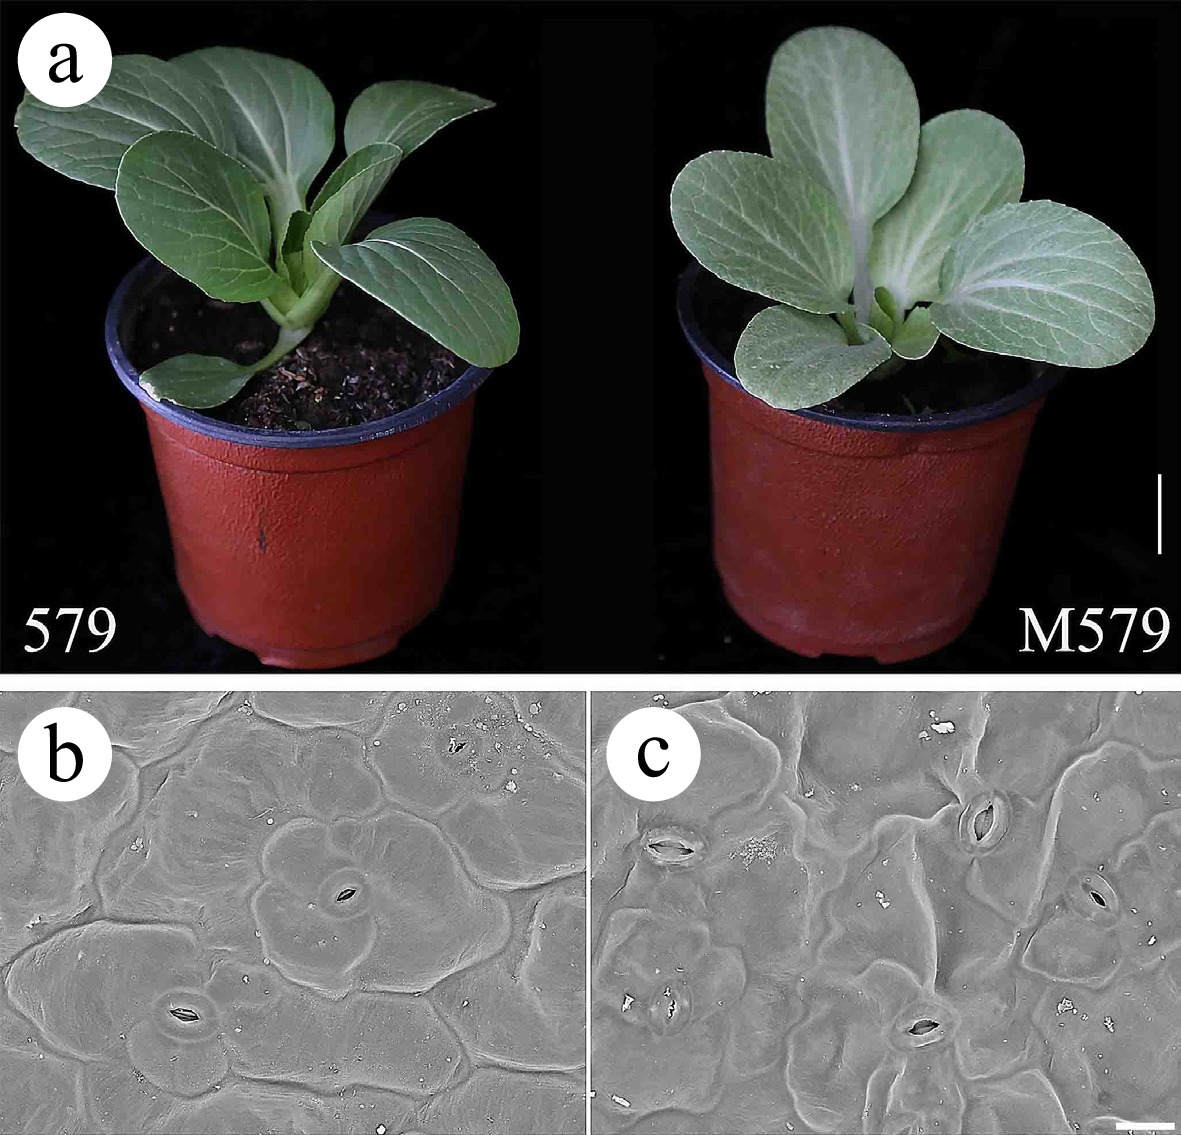
Figure 1.
Morphological characterization of wild-type '579' and mutant M579. (a) '579' with green leaves and M579 with gray leaves. Bar = 2 cm. (b, c) Scanning electron microscopy observations of '579' and M579. Bar = 200 μm.
-
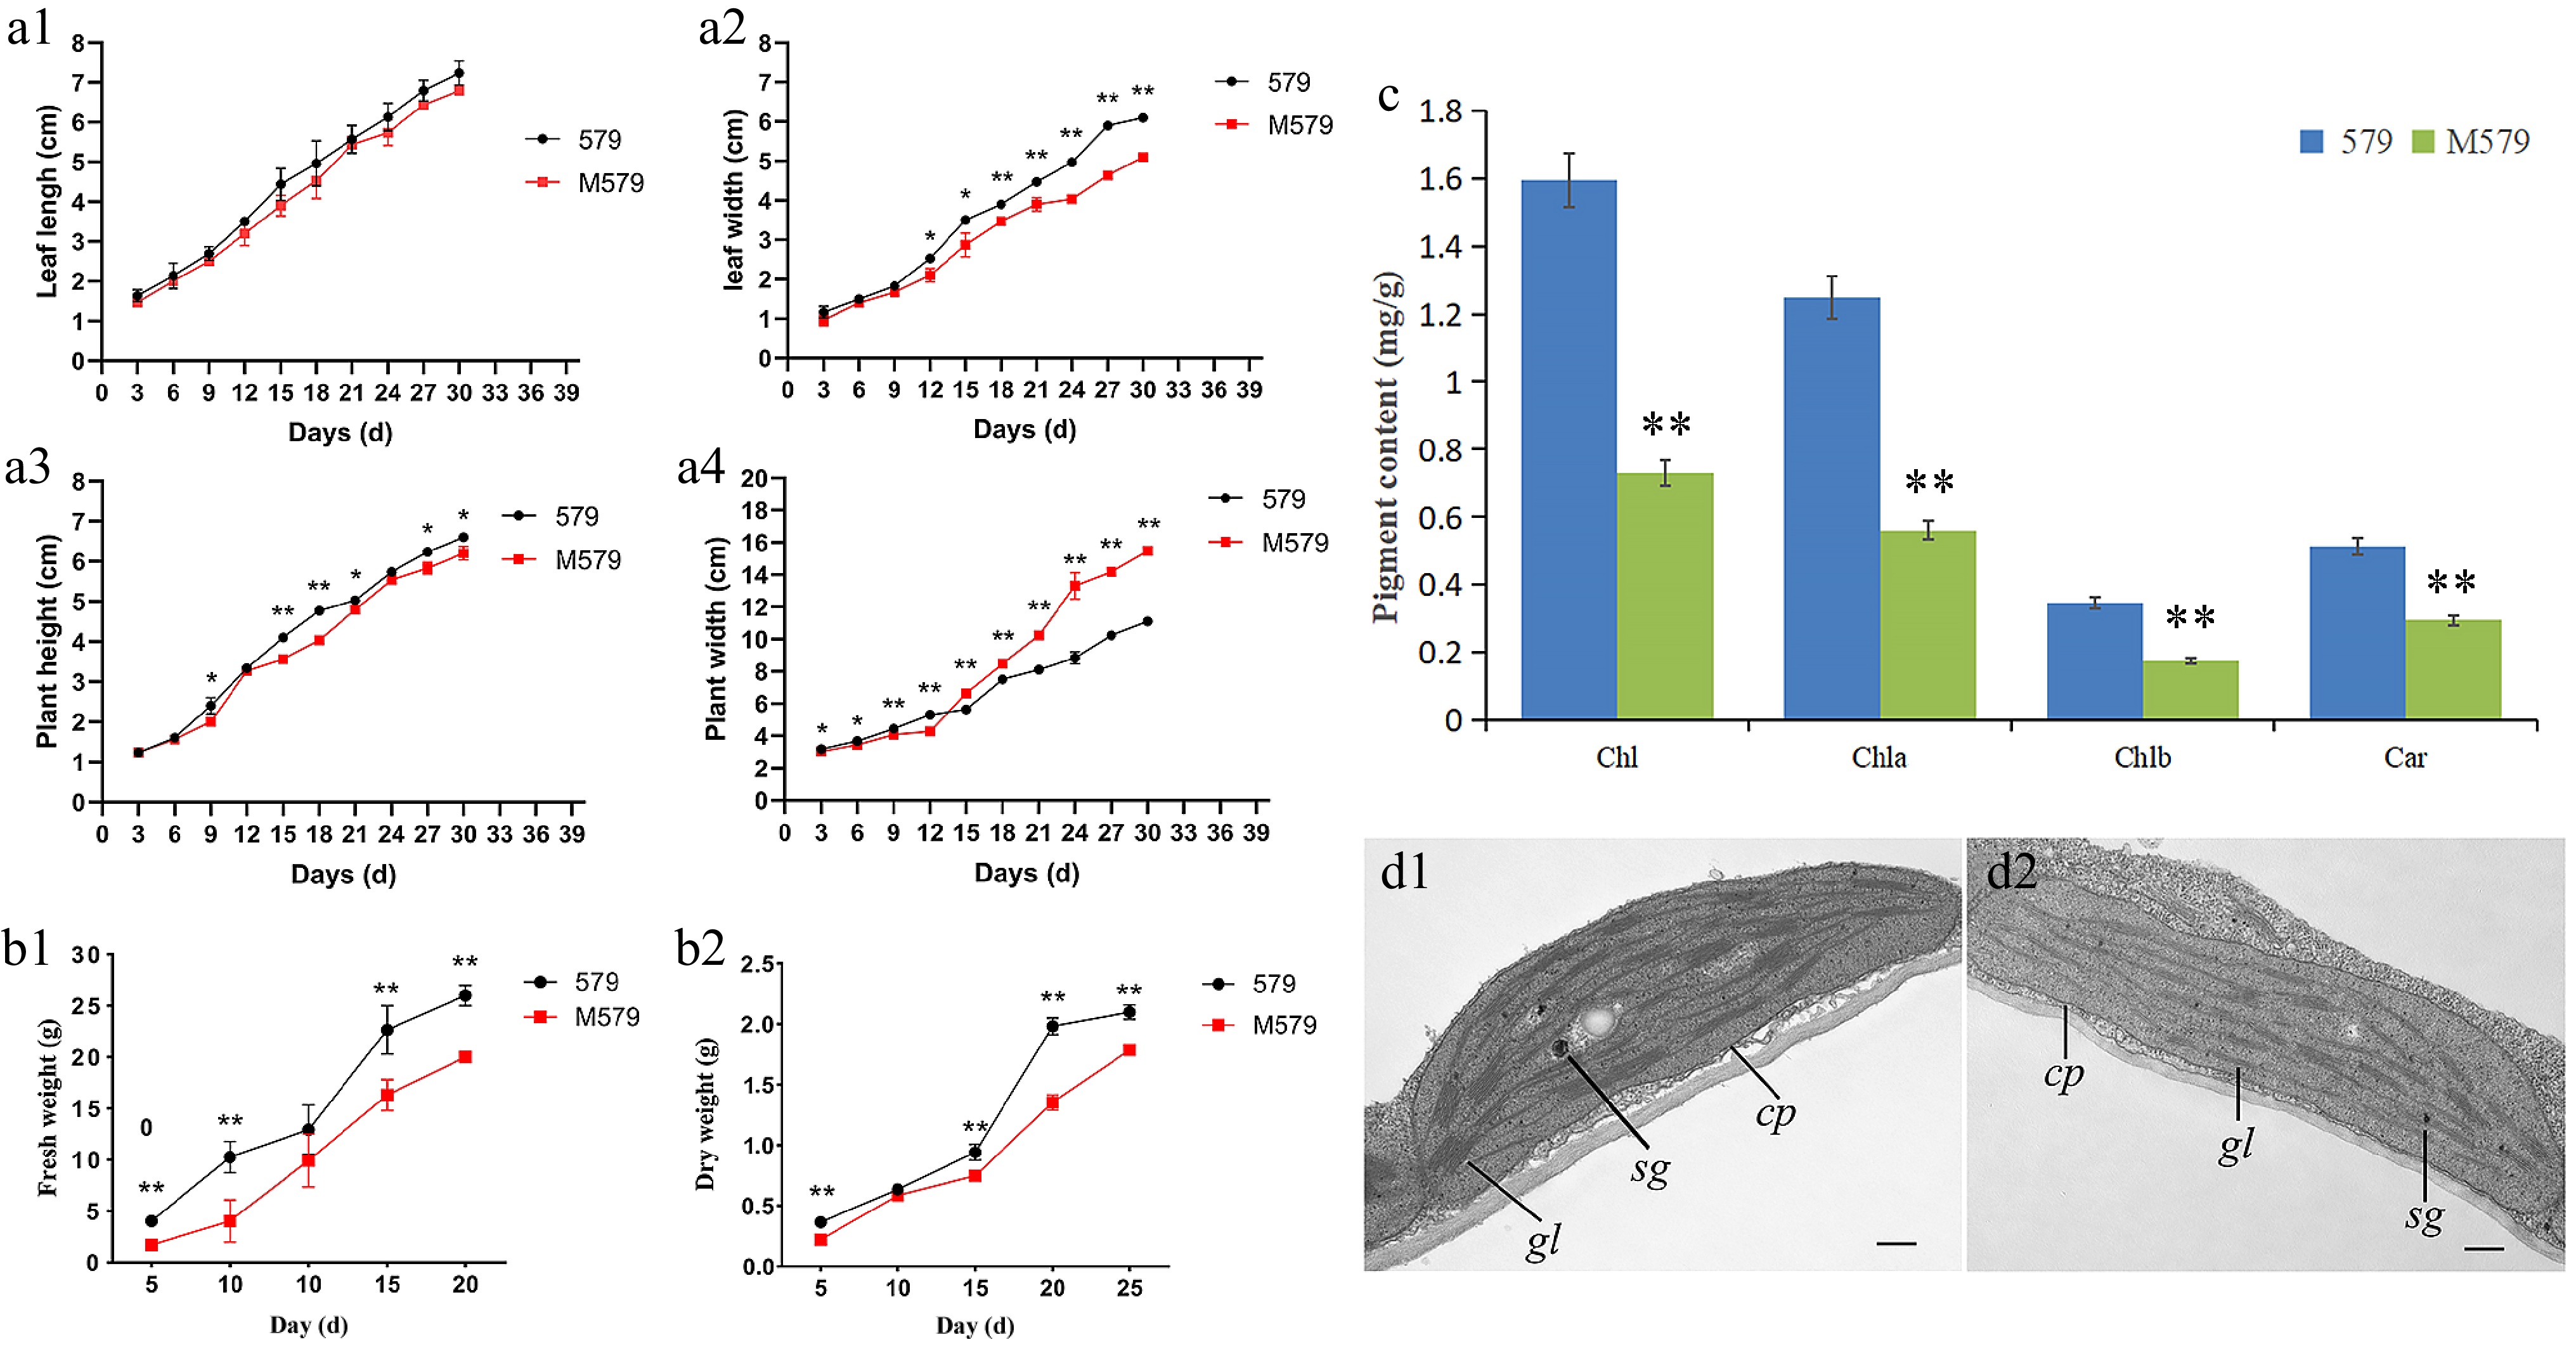
Figure 2.
Agronomic trait analysis of '579' and M579. (a) Growth potential curves of '579' and M579: (a1) leaf length, (a2) leaf width, (a3) plant height, and (a4) plant width. (b1) Fresh weight of '579' and M579. (b2) Dry weight of '579' and M579. (c) Photosynthetic pigment content of '579' and M579. (d) Transmission electron microscopy (TEM) analysis of chloroplasts in (d1) '579', and (d2) M579.
-
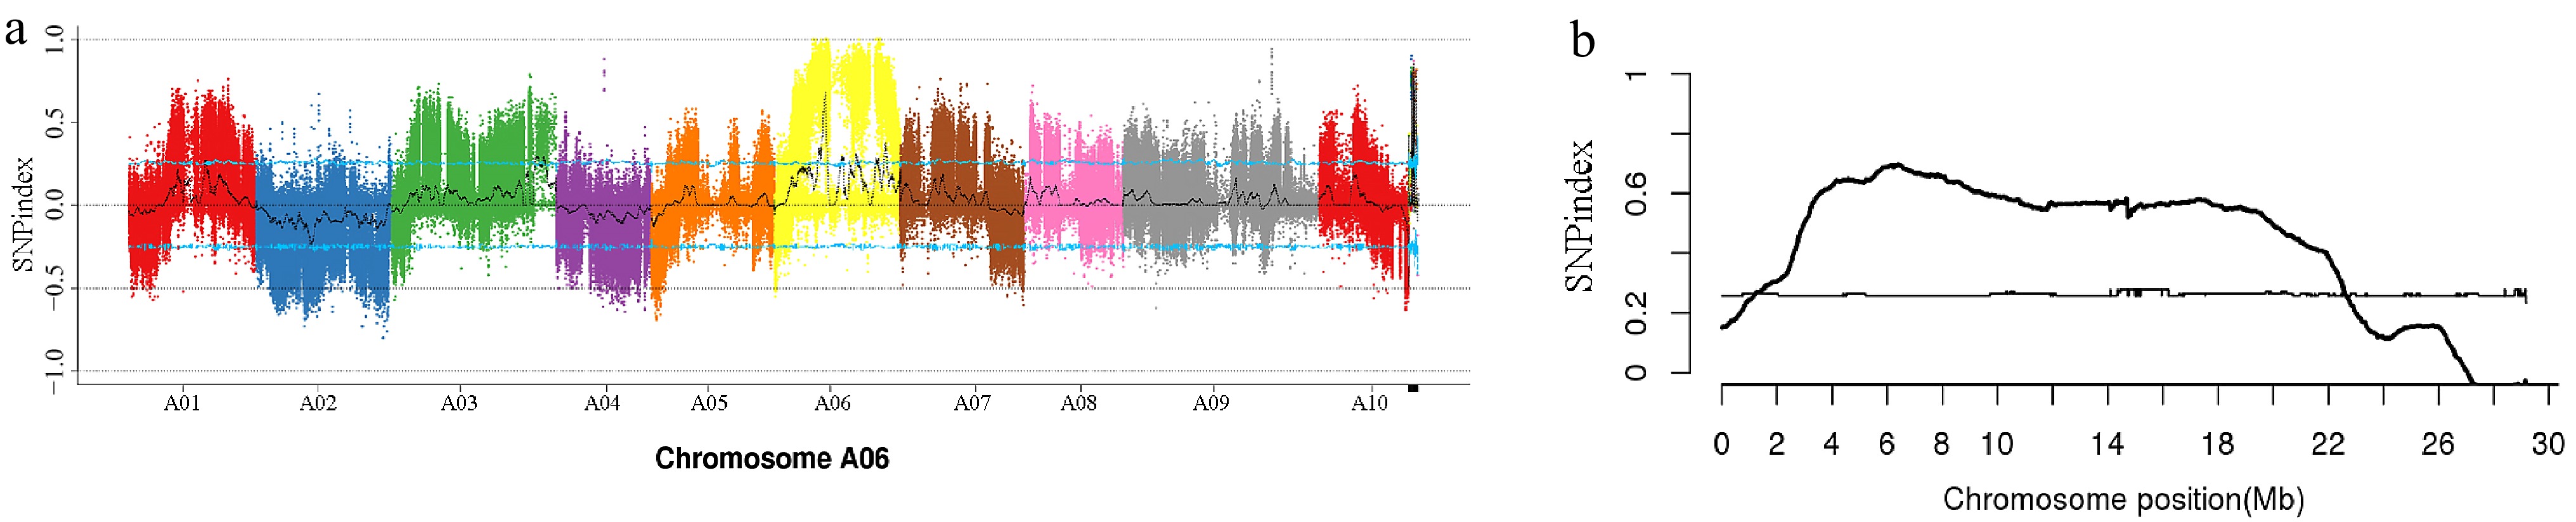
Figure 3.
Single nucleotide polymorphism (SNP) index mapping chart. (a) SNP index distribution on the chromosomes of pakchoi. (b) The candidate gene for the gray leaf trait was mapped to chromosome A06.
-
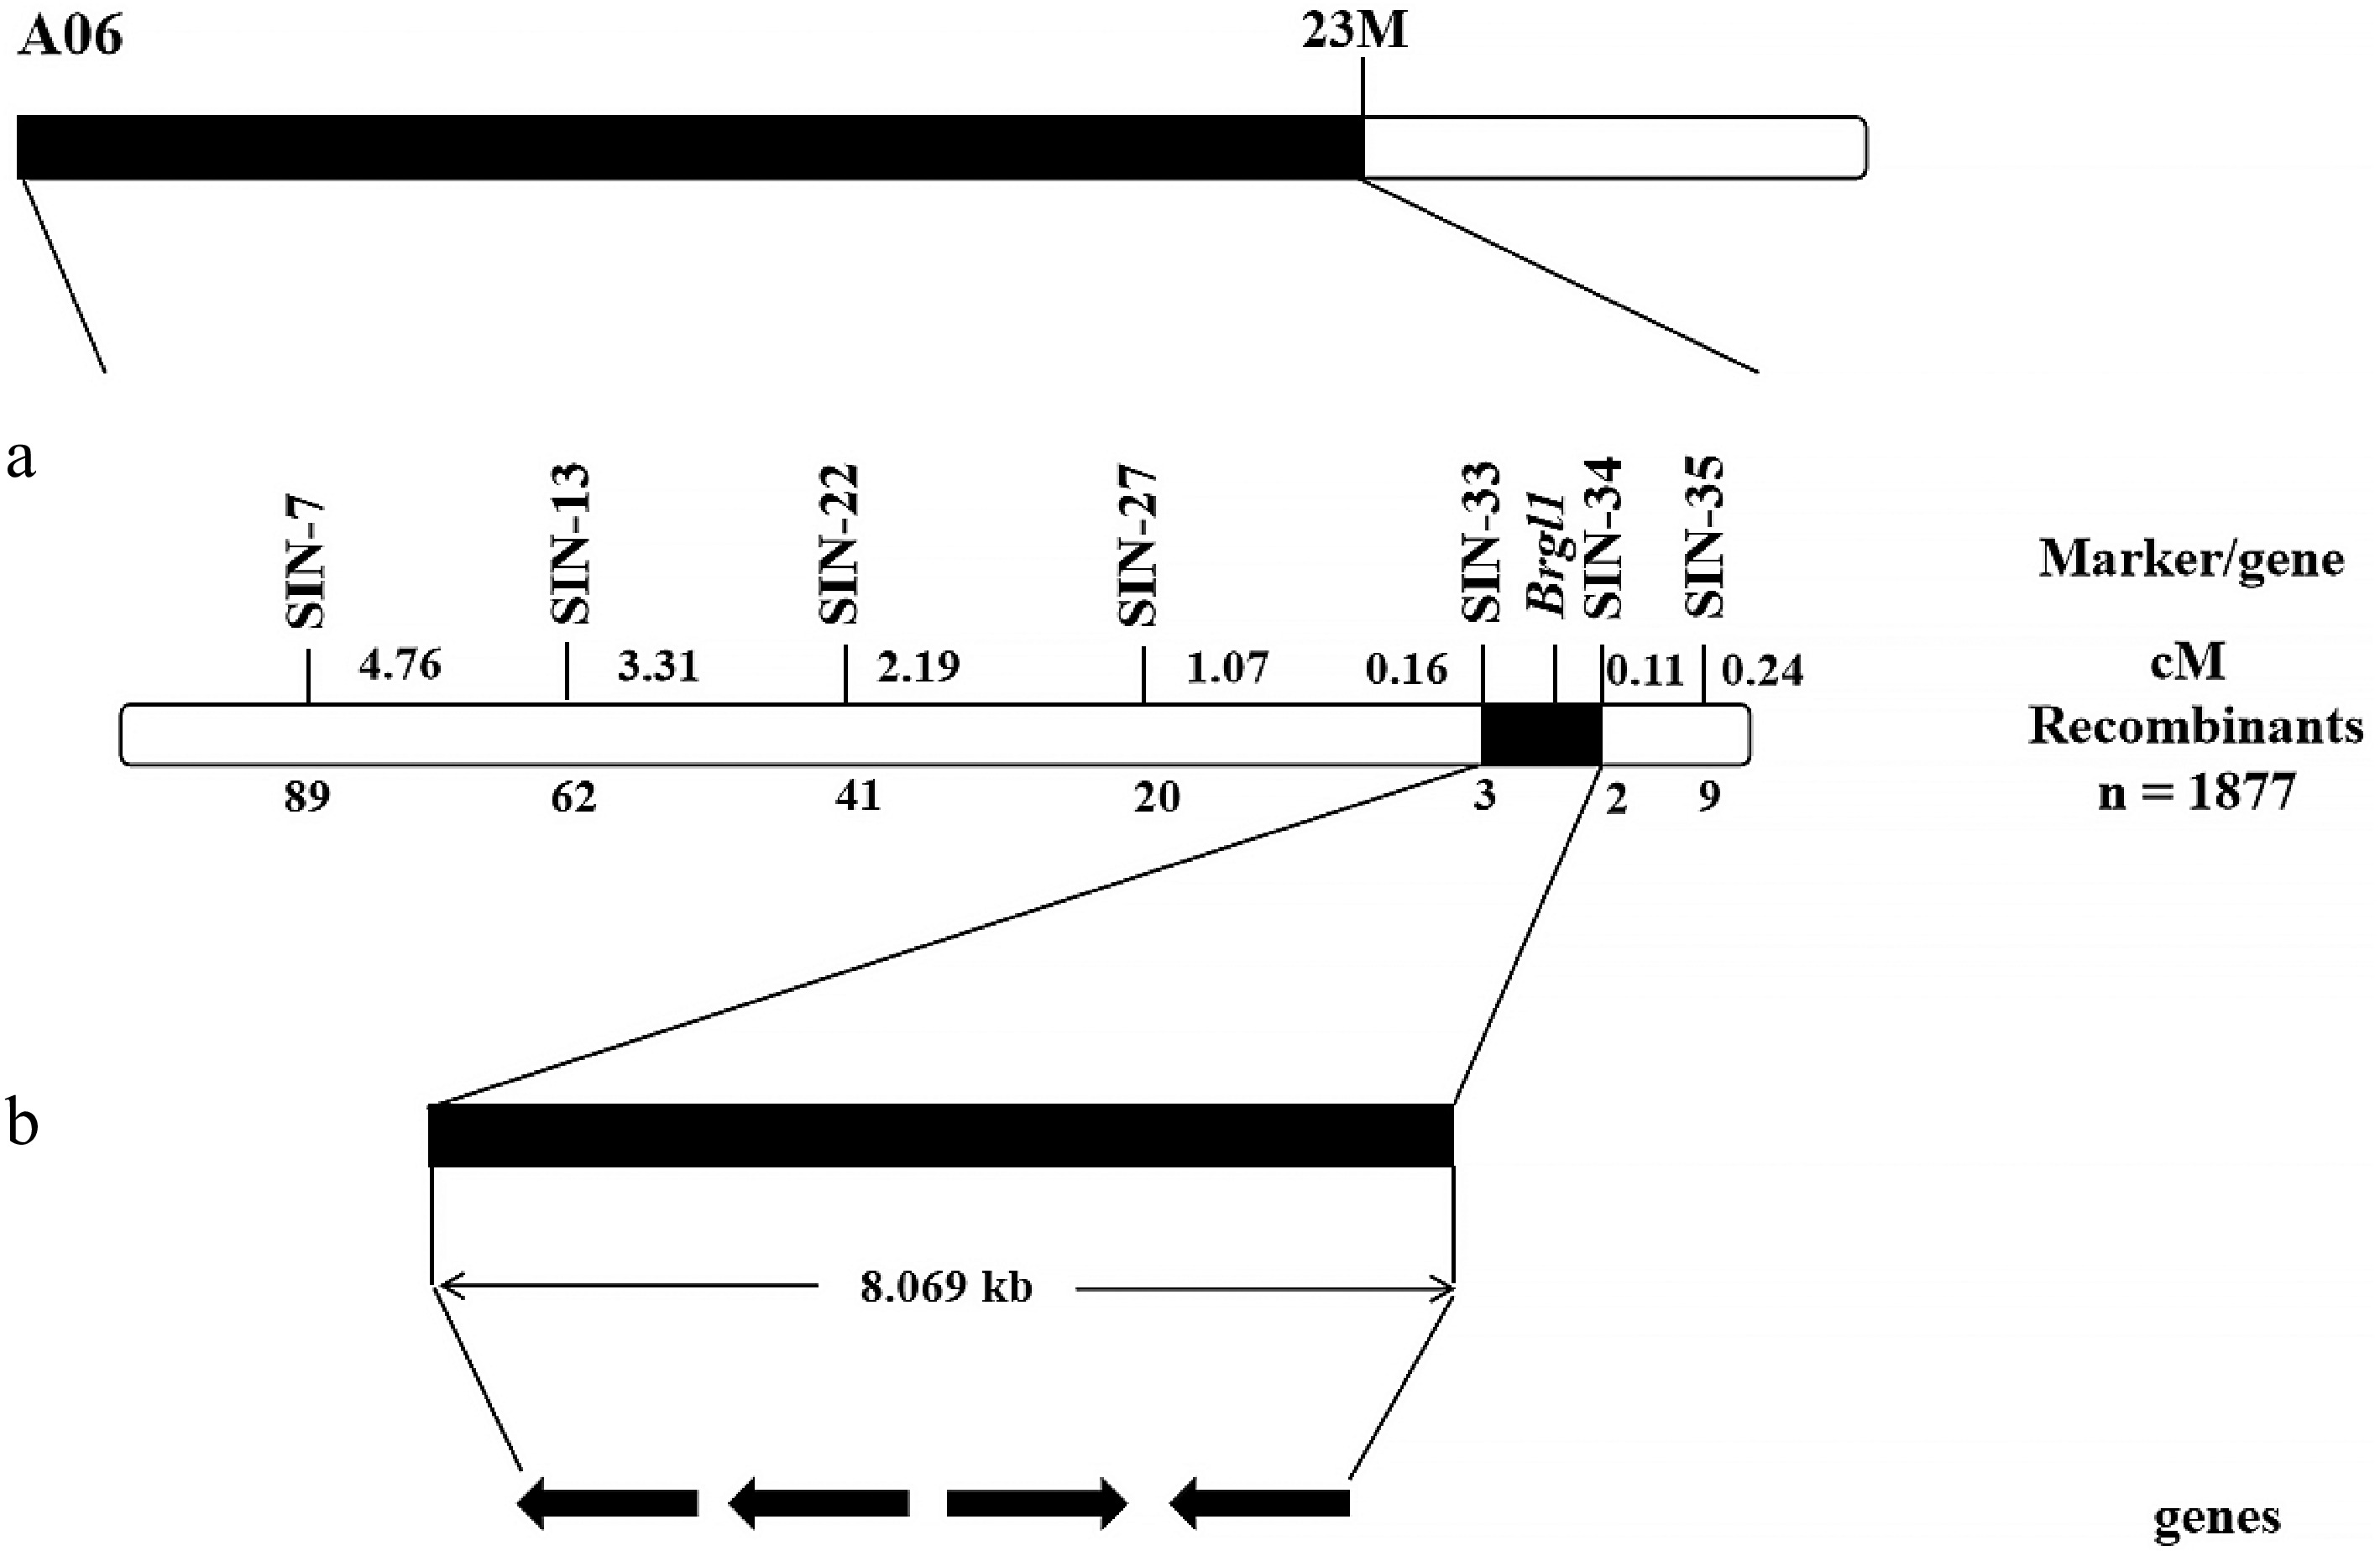
Figure 4.
The genetic and physical maps of Brgl1. (a) Brgl1 was mapped between the molecular markers SIN-33 and SIN-34. (b) The 8.069 kb region between SIN-33 and SIN-34 containing four genes.
-
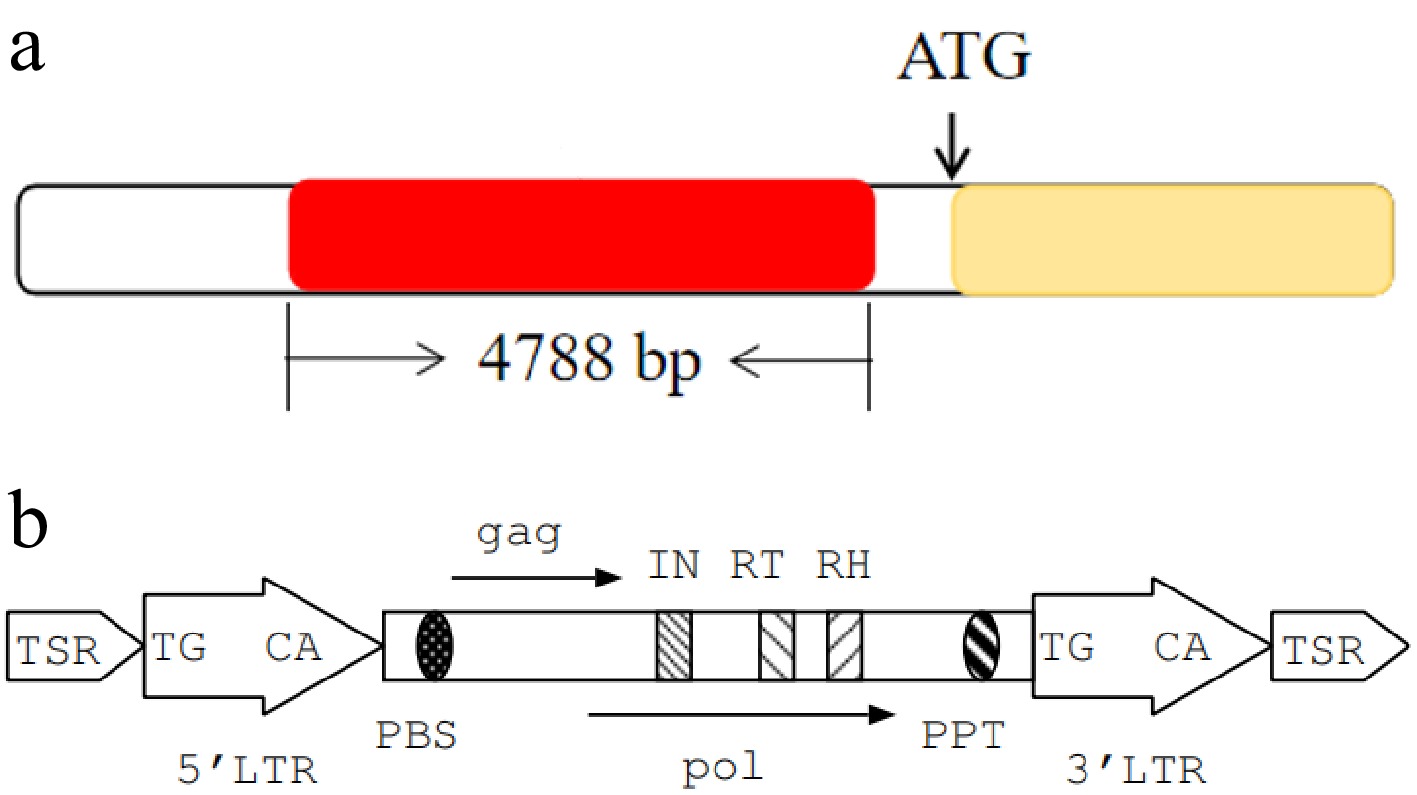
Figure 5.
Gene structural features. (a) Structural features of the Brgl1 gene and the insertion fragment. The yellow box represents the Brgl1 gene, the red box represents the insertion fragment. (b) Structural features of transposon TNT 1-94.
-

Figure 6.
Expression patterns of the Brgl1 gene. (a) GUS staining of the control in Arabidopsis. (b) GUS-stained positive plants in Arabidopsis. (c) Close-up of GUS-stained positive plants in Arabidopsis. (d) qRT-PCR analysis of Brgl1 in the leaves of '579' and M579.
-
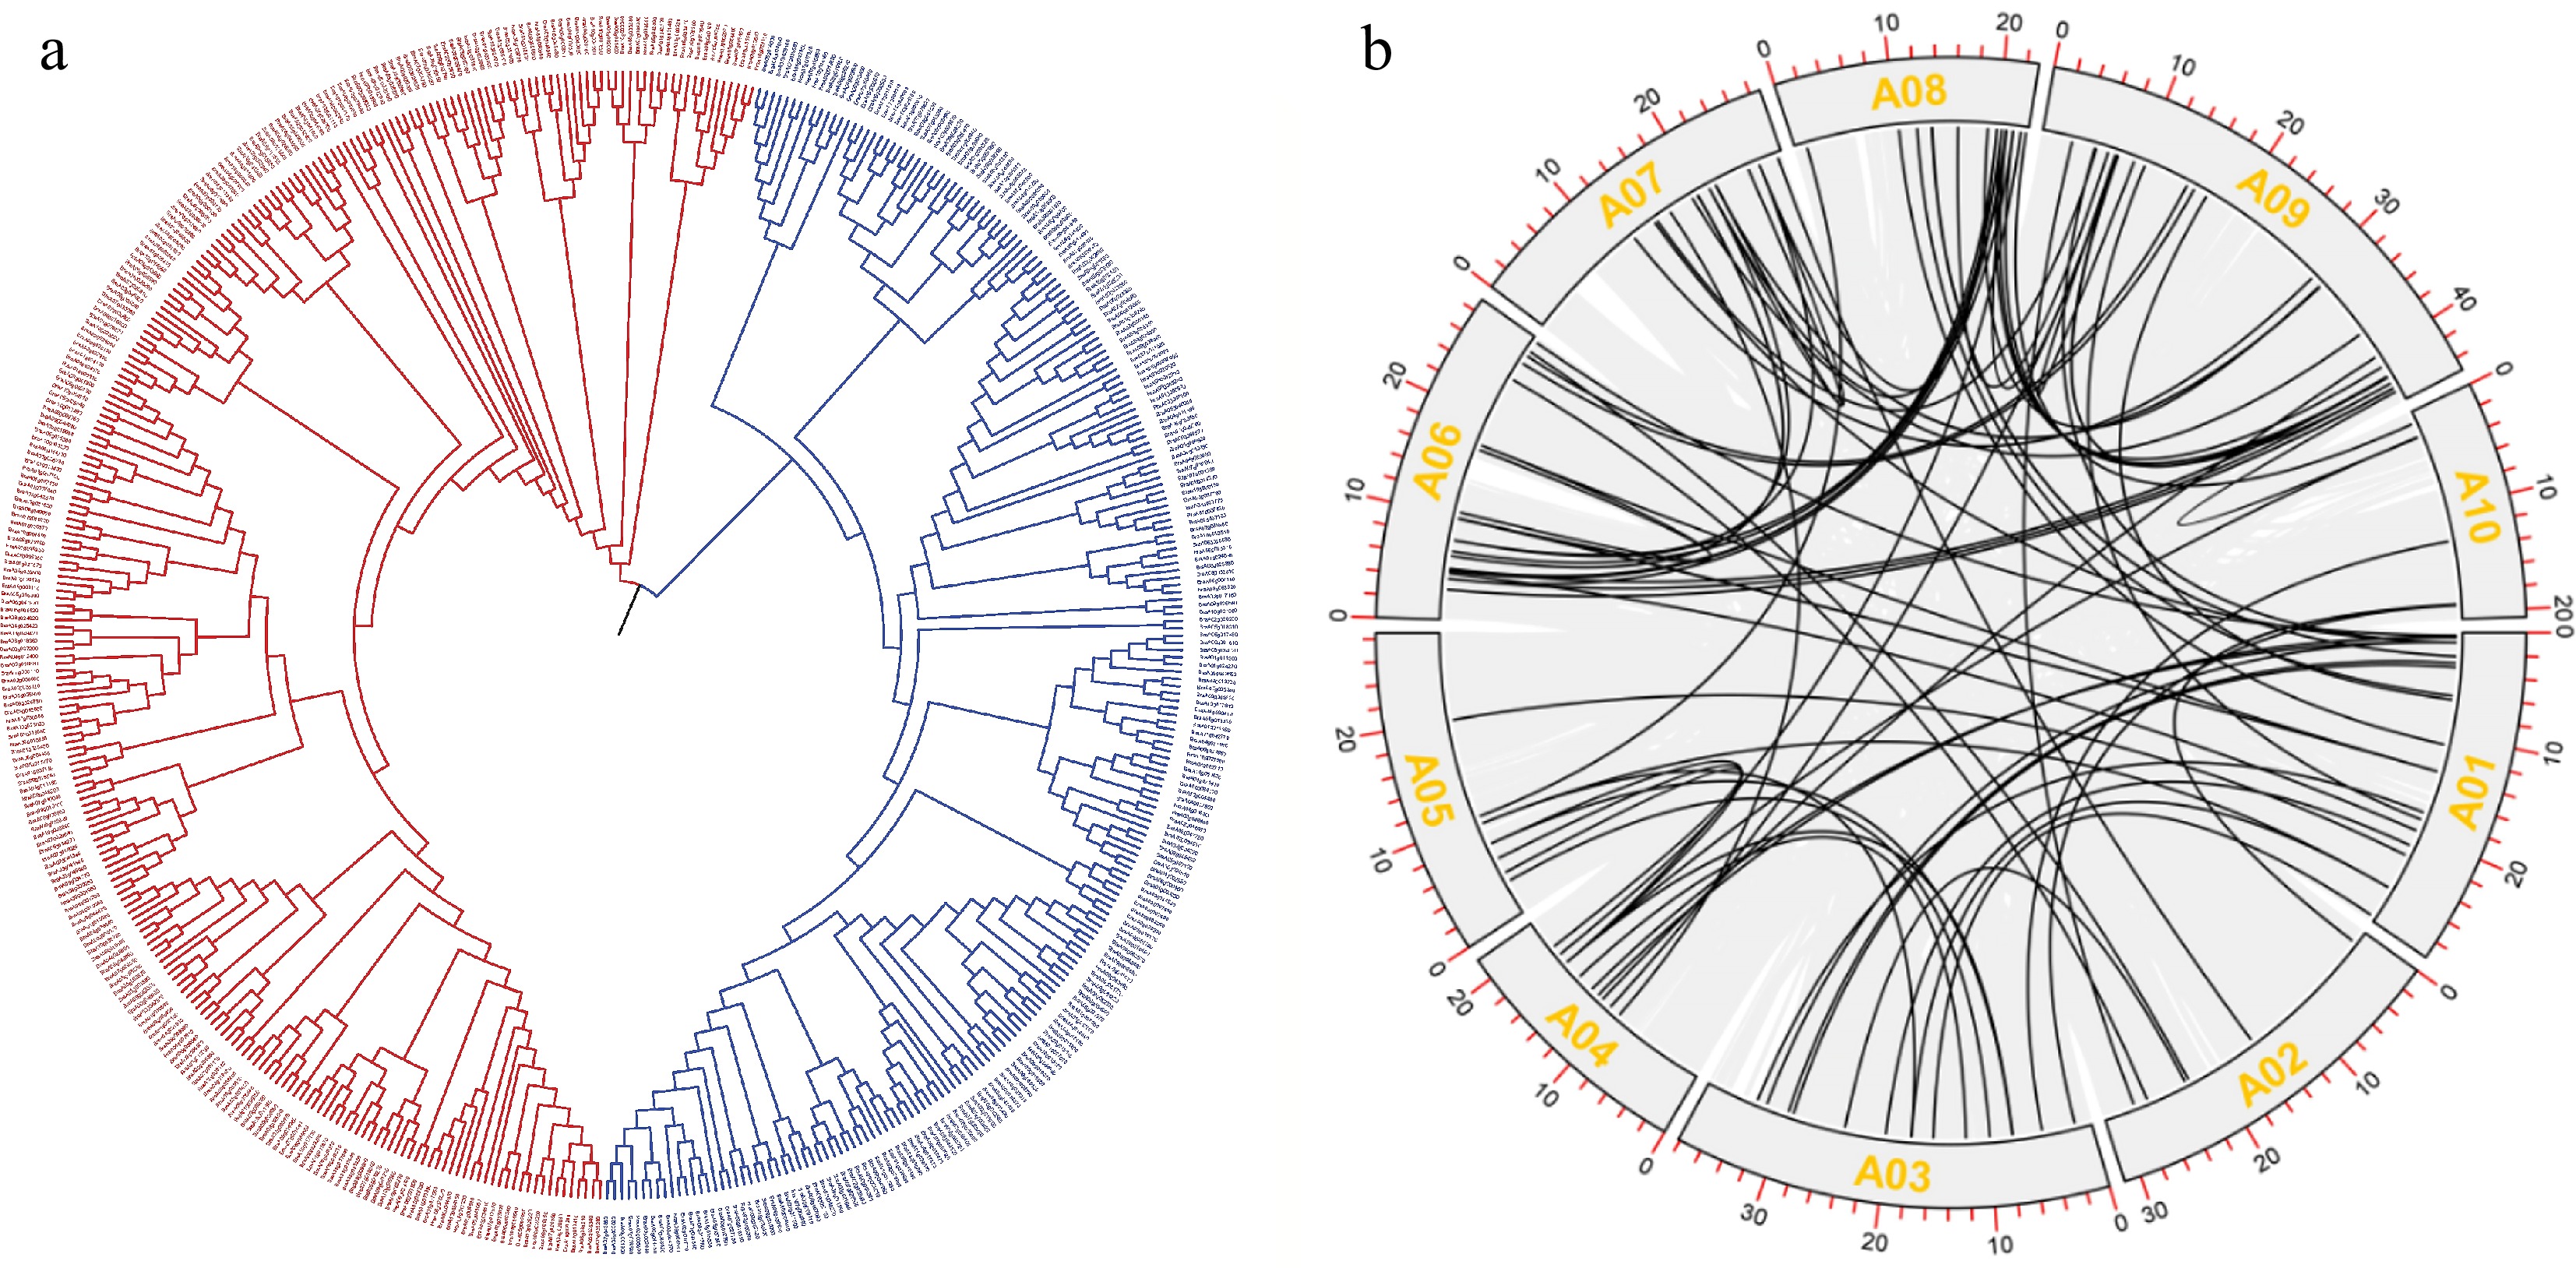
Figure 7.
Evolutionary analysis of PPR proteins. (a) Phylogenetic tree of PPR proteins. (b) Co-linearity analysis of PPR proteins.
-
Generation Total Green leaf Gray leaf Segregation ratio χ2 χ20.05 P1 ('579') 23 23 0 P2 (M579) 23 0 23 F1 (P1 × P2) 200 200 0 F1' (P2 × P1) 136 136 0 F2 2,000 1,535 465 3.3:1 0.81 3.841 Table 1.
Genetic analysis of the gray leaf mutant Brgl1 in pakchoi.
-
Material Photosynthetic rate
(mol/m2/s)Stomatal conductance
(mol/m2/s)Transpiration rate
(mol/m2/s)CO2 concentration
(mol/m2/s)579 6.38 ± 0.10** 0.06 ± 0.01** 1.60 ± 0.09* 221.33 ± 2.08** M579 2.49 ± 0.06 0.03 ± 0.07 1.06 ± 0.17 302.67 ± 1.53 * Significantly different at p = 0.05 by the t-test. ** Significantly different at p = 0.01 by the t-test. Table 2.
'579' and M579 photosynthetic parameters.
-
Chromosome number Number of P subgroups Number of PLS subgroups Total number of PPR genes A01 25 23 58 A02 20 10 30 A03 18 33 51 A04 10 12 22 A05 16 39 55 A06 38 35 73 A07 26 20 46 A08 10 16 26 A09 45 44 79 A10 16 26 42 Total 224 258 482 Table 3.
The distribution of PPR family genes across the ten chromosomes of pakchoi.
Figures
(7)
Tables
(3)