-
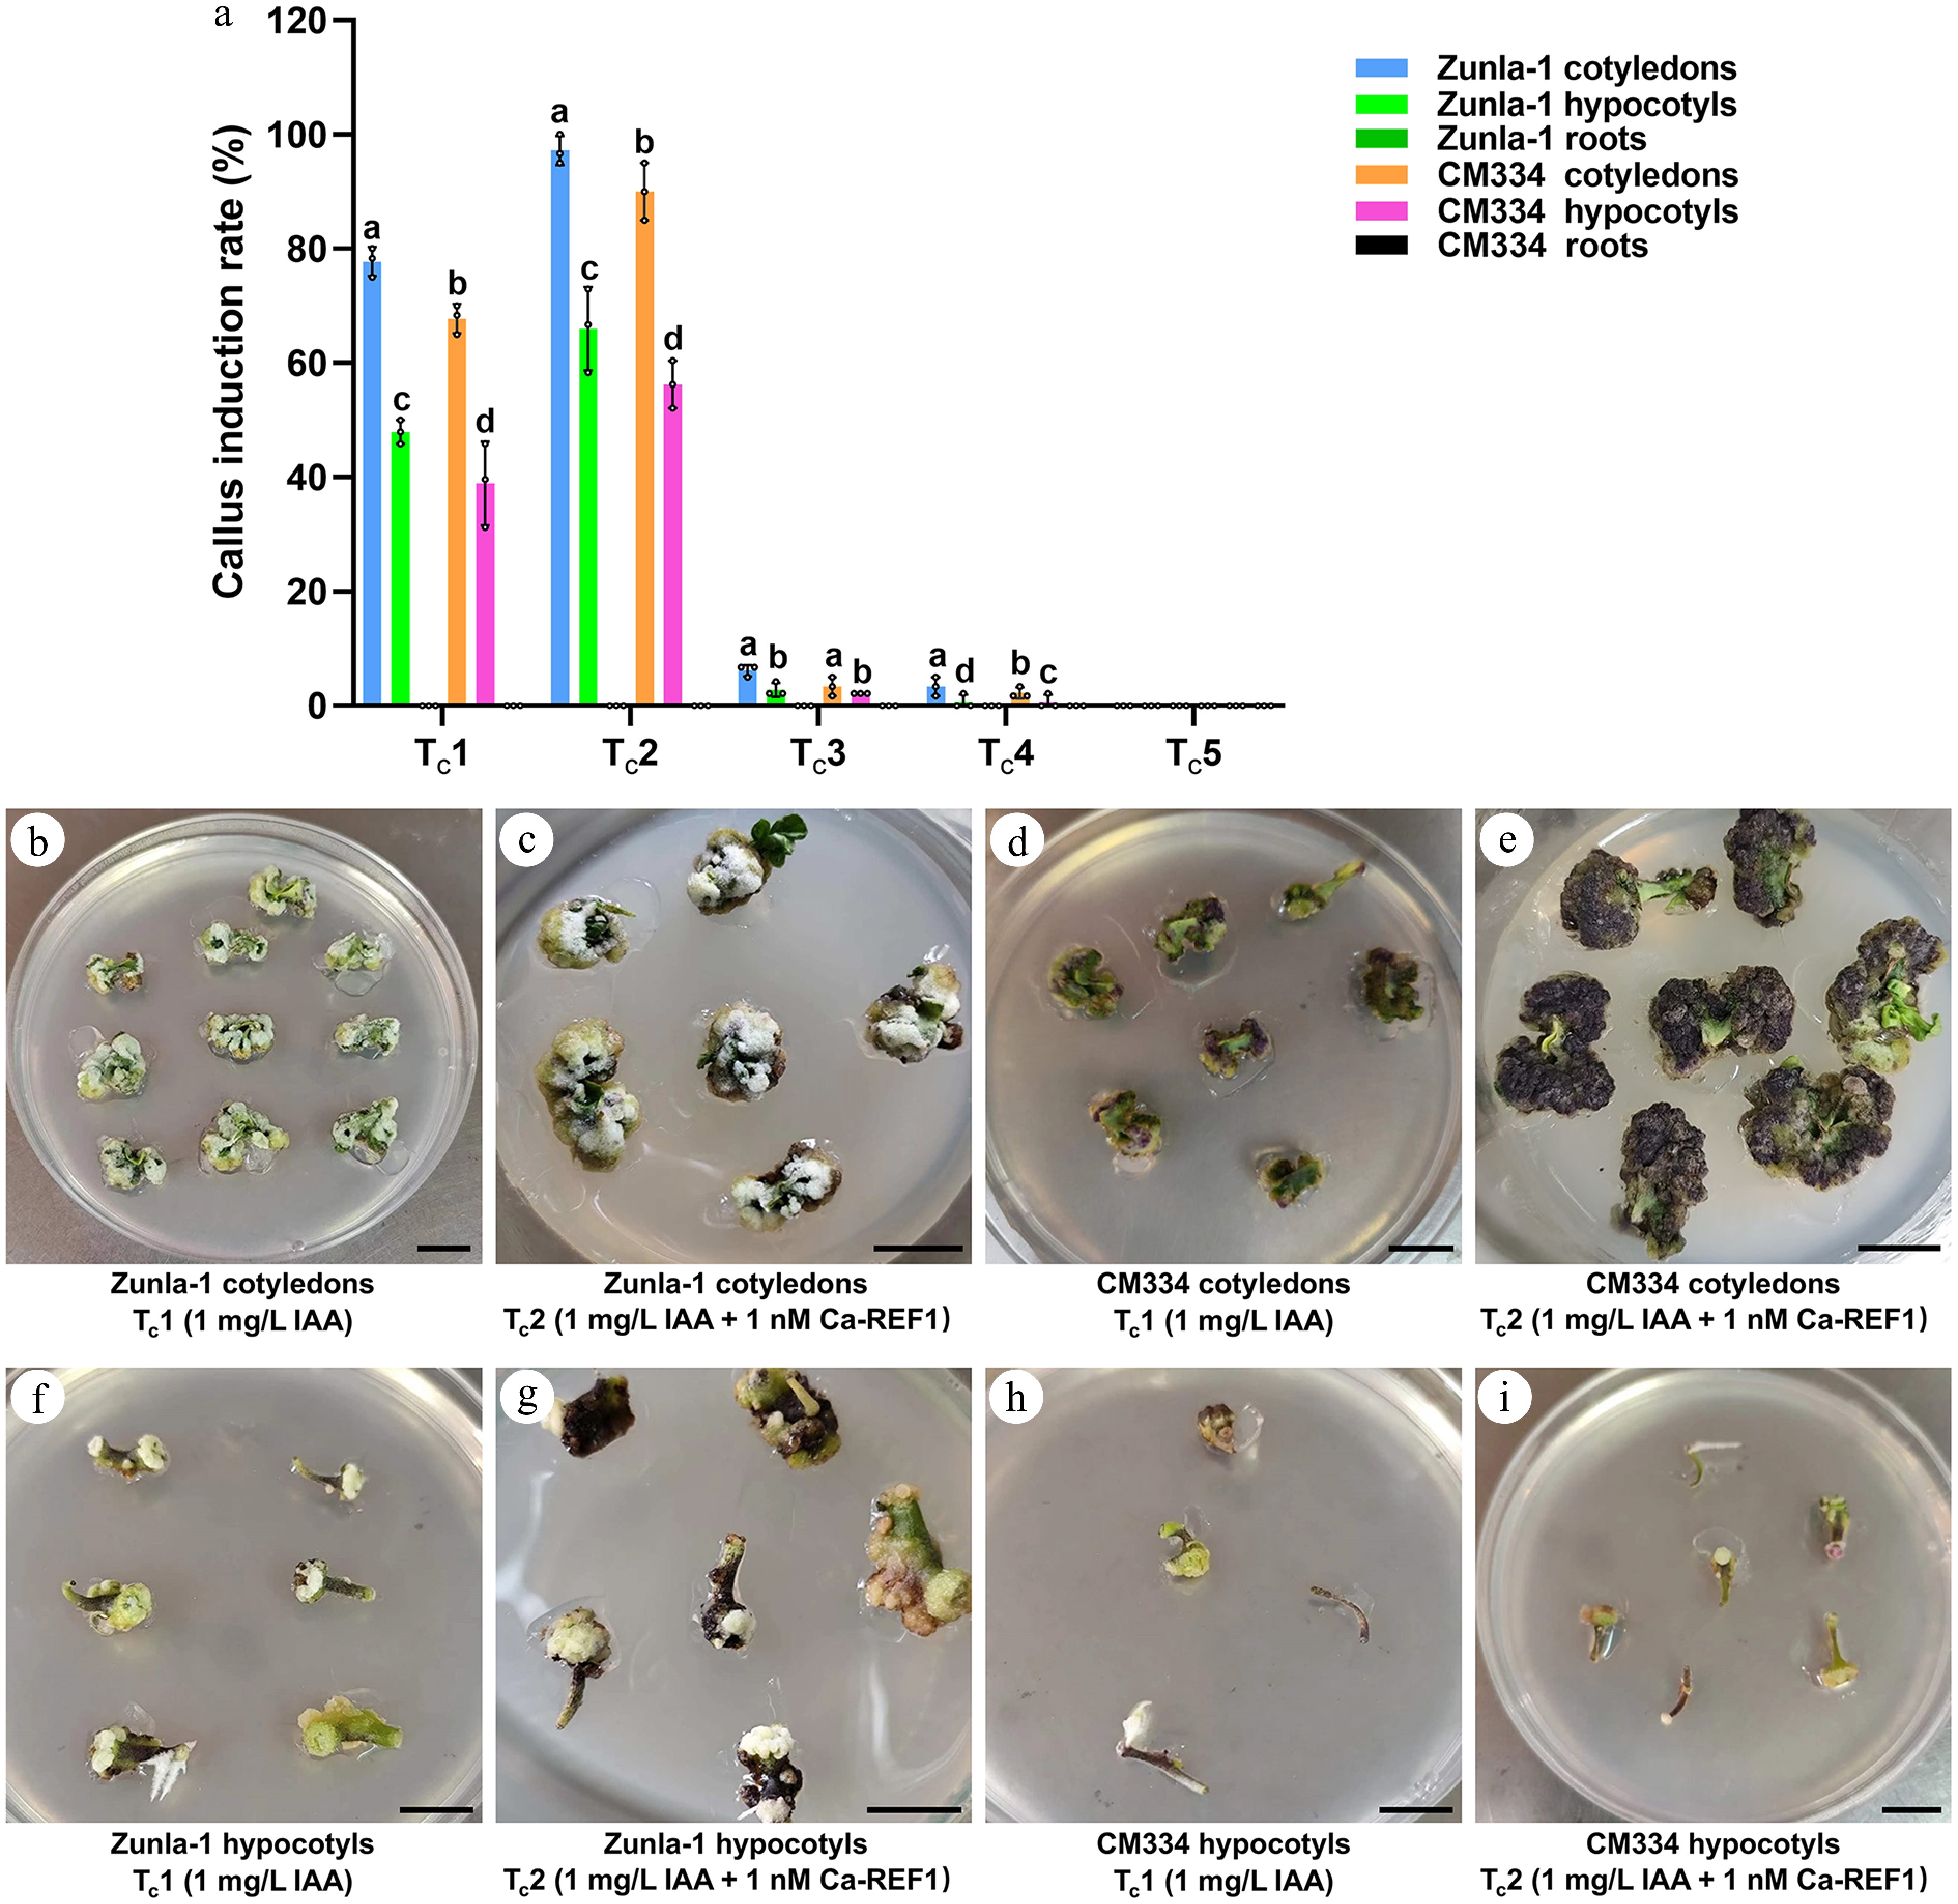
Figure 1.
Callus induction rate (%) in Zunla-1 and CM334 under different hormonal treatments. (a) Bar chart of callus induction rate (%) for two pepper varieties, Zunla-1 and CM334, and two explant types, cotyledons and hypocotyls, under five treatments. Treatments include Tc1 (1 mg/L IAA), Tc2 (1 mg/L IAA + 1 nM CaREF1), Tc3 (1 mg/L IAA + 1.5 nM CaREF1), Tc4 (1 mg/L IAA + 2 nM CaREF1), and Tc5 (1 mg/L IAA + 2 mg/L 2,4-D + 1 nM CaREF1). The annotations above the bars, marked as 'a', 'b', 'c', etc., signify statistical significance (p < 0.05), where bars sharing the same letter indicate no significant difference. (b)–(e) Show callus formation images for Zunla-1 and CM334 cotyledons under the respective treatments Tc1 and Tc2, respectively. (f)–(i) Show callus formation images for Zunla-1 and CM334 hypocotyls under the respective treatments Tc1 and Tc2, respectively. Scale bars indicate 1 cm.
-
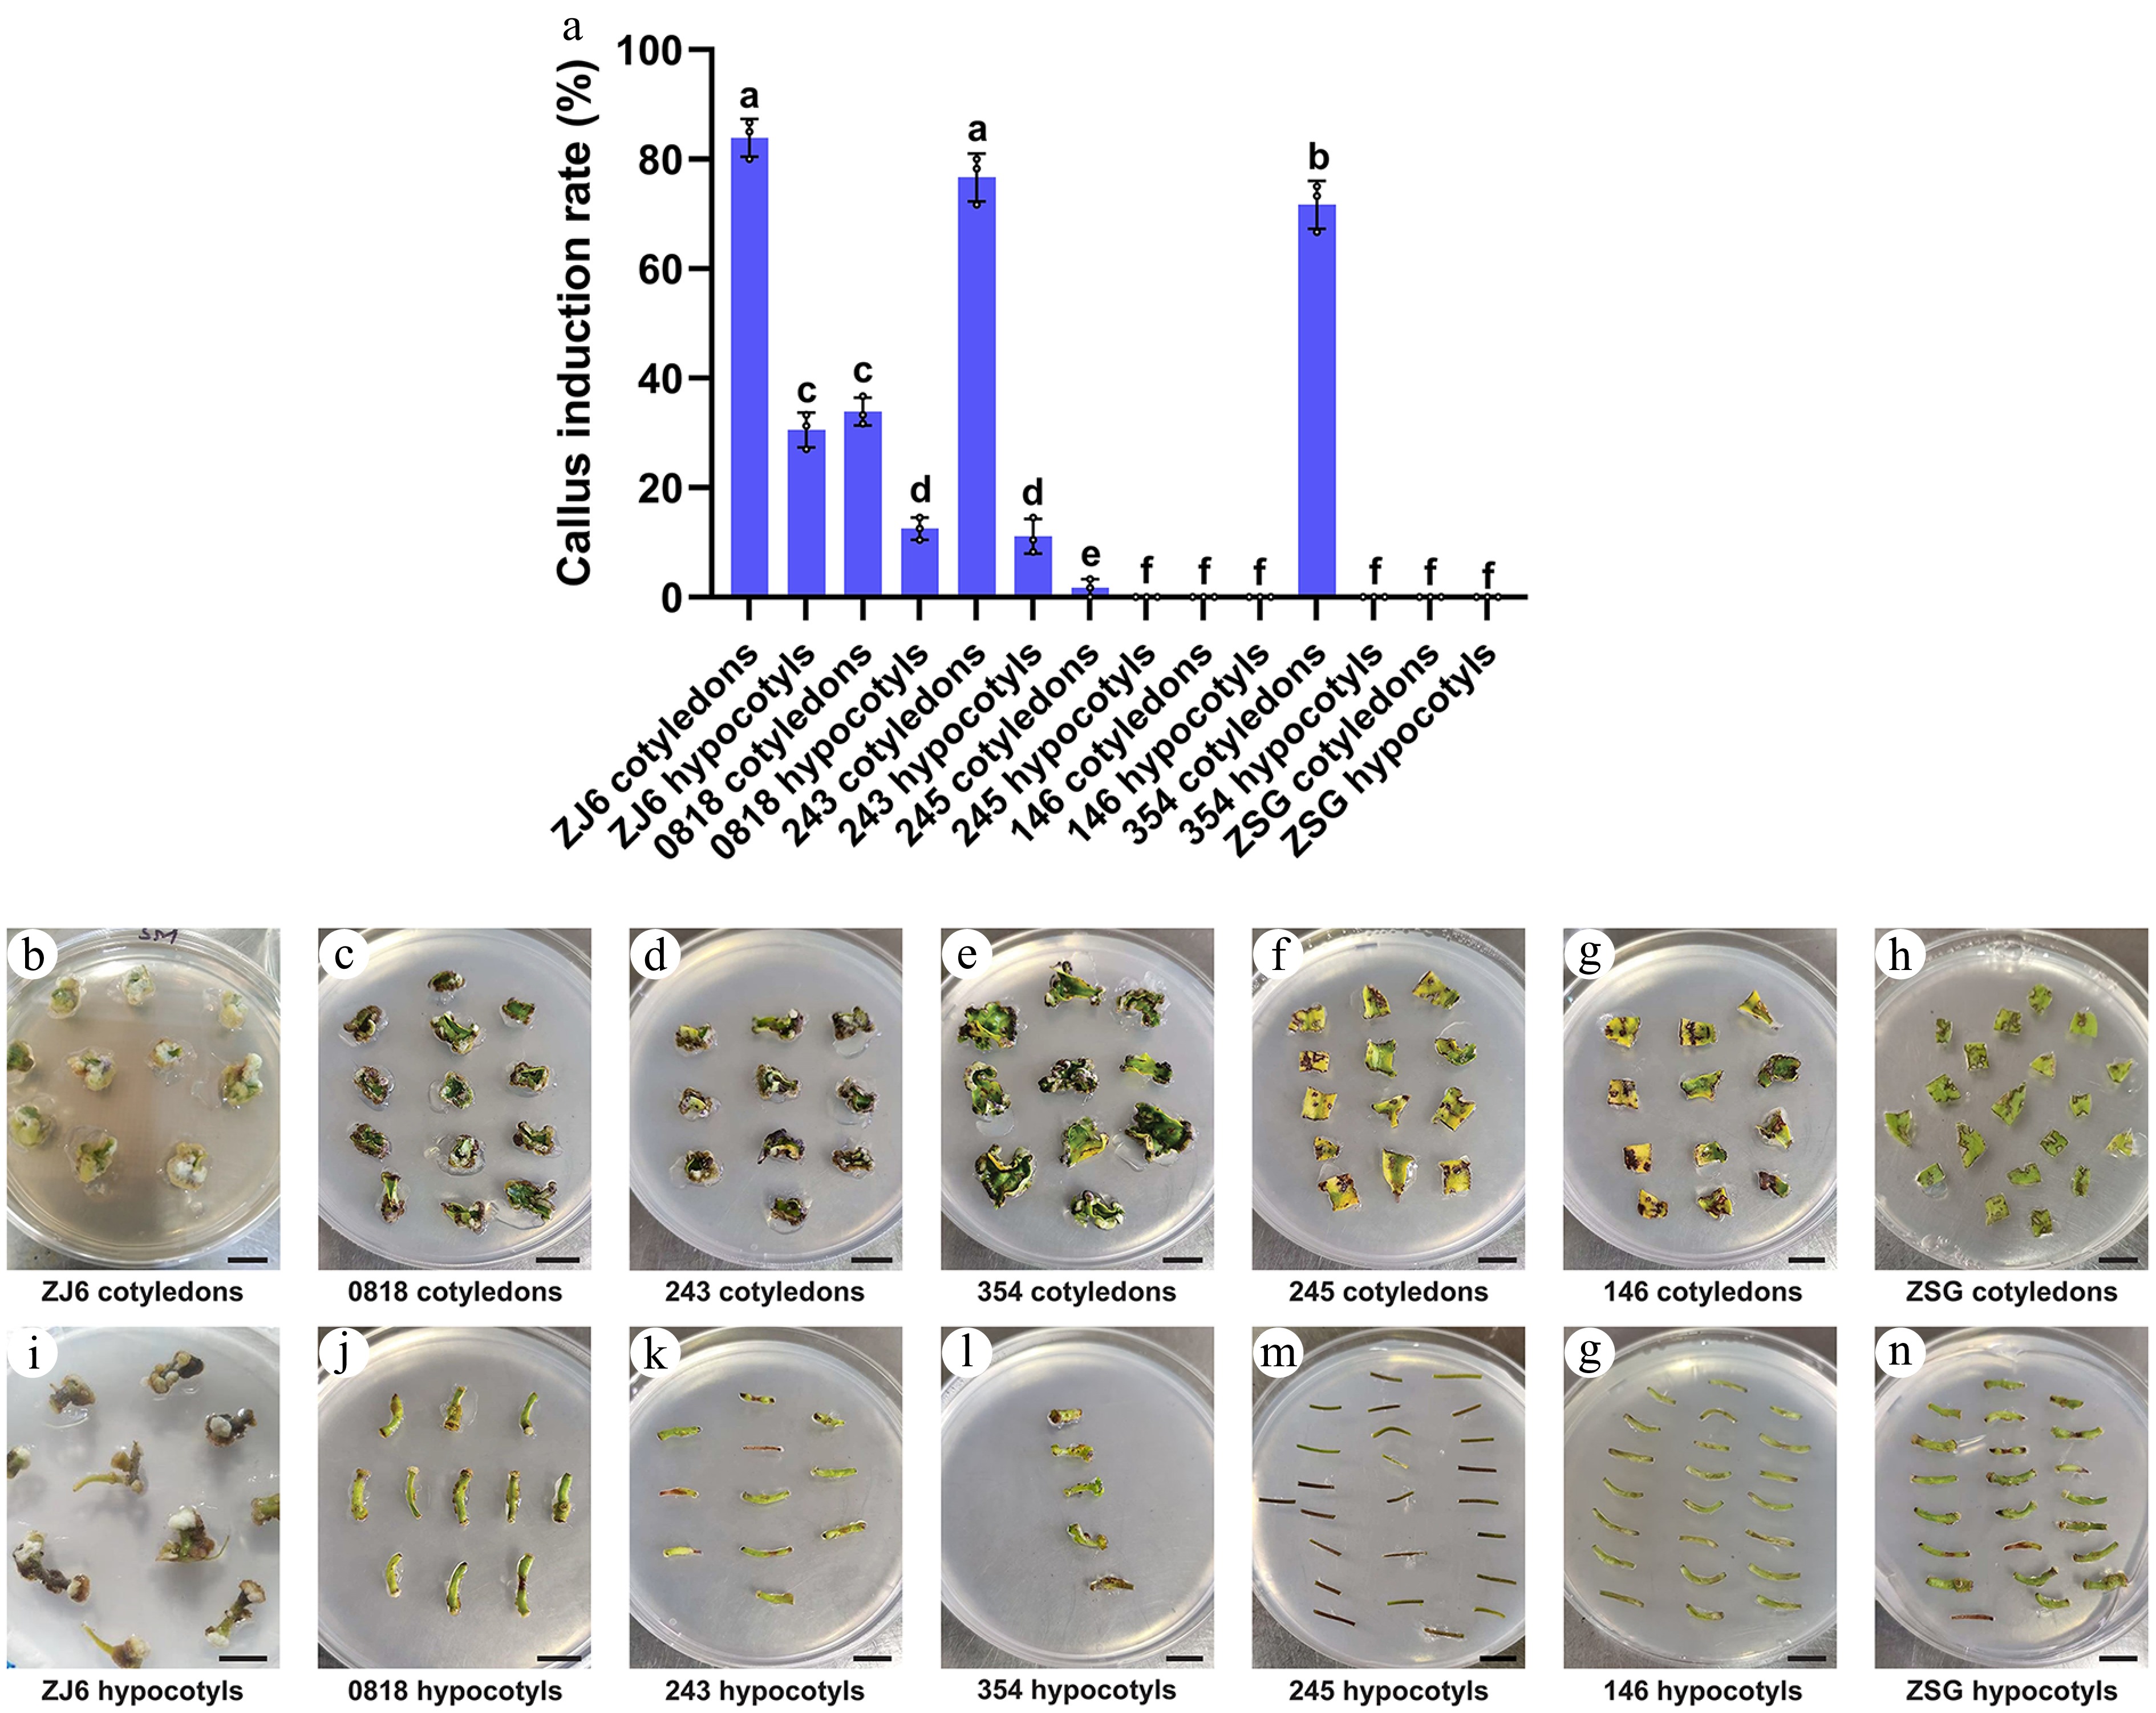
Figure 2.
Comparative analysis of callus induction rate (%) of cotyledon and hypocotyl explants of different pepper varieties under Tc2. (a) Bar chart illustrating the callus induction rate of different varieties under Tc2 (1 mg/L IAA + 1 nM CaREF1). The annotations above the bars, marked as 'a', 'b', 'c', etc., signify statistical significance (p < 0.05), where bars sharing the same letter indicate no significant difference. (b)–(h) Show the callus formation of cotyledon explants of ZJ6, 0818, 243, 354, 245, 146, and ZSG, respectively. (i)–(o) Show the callus formation of respective varieties in hypocotyl explants. Scale bars indicate 1 cm.
-
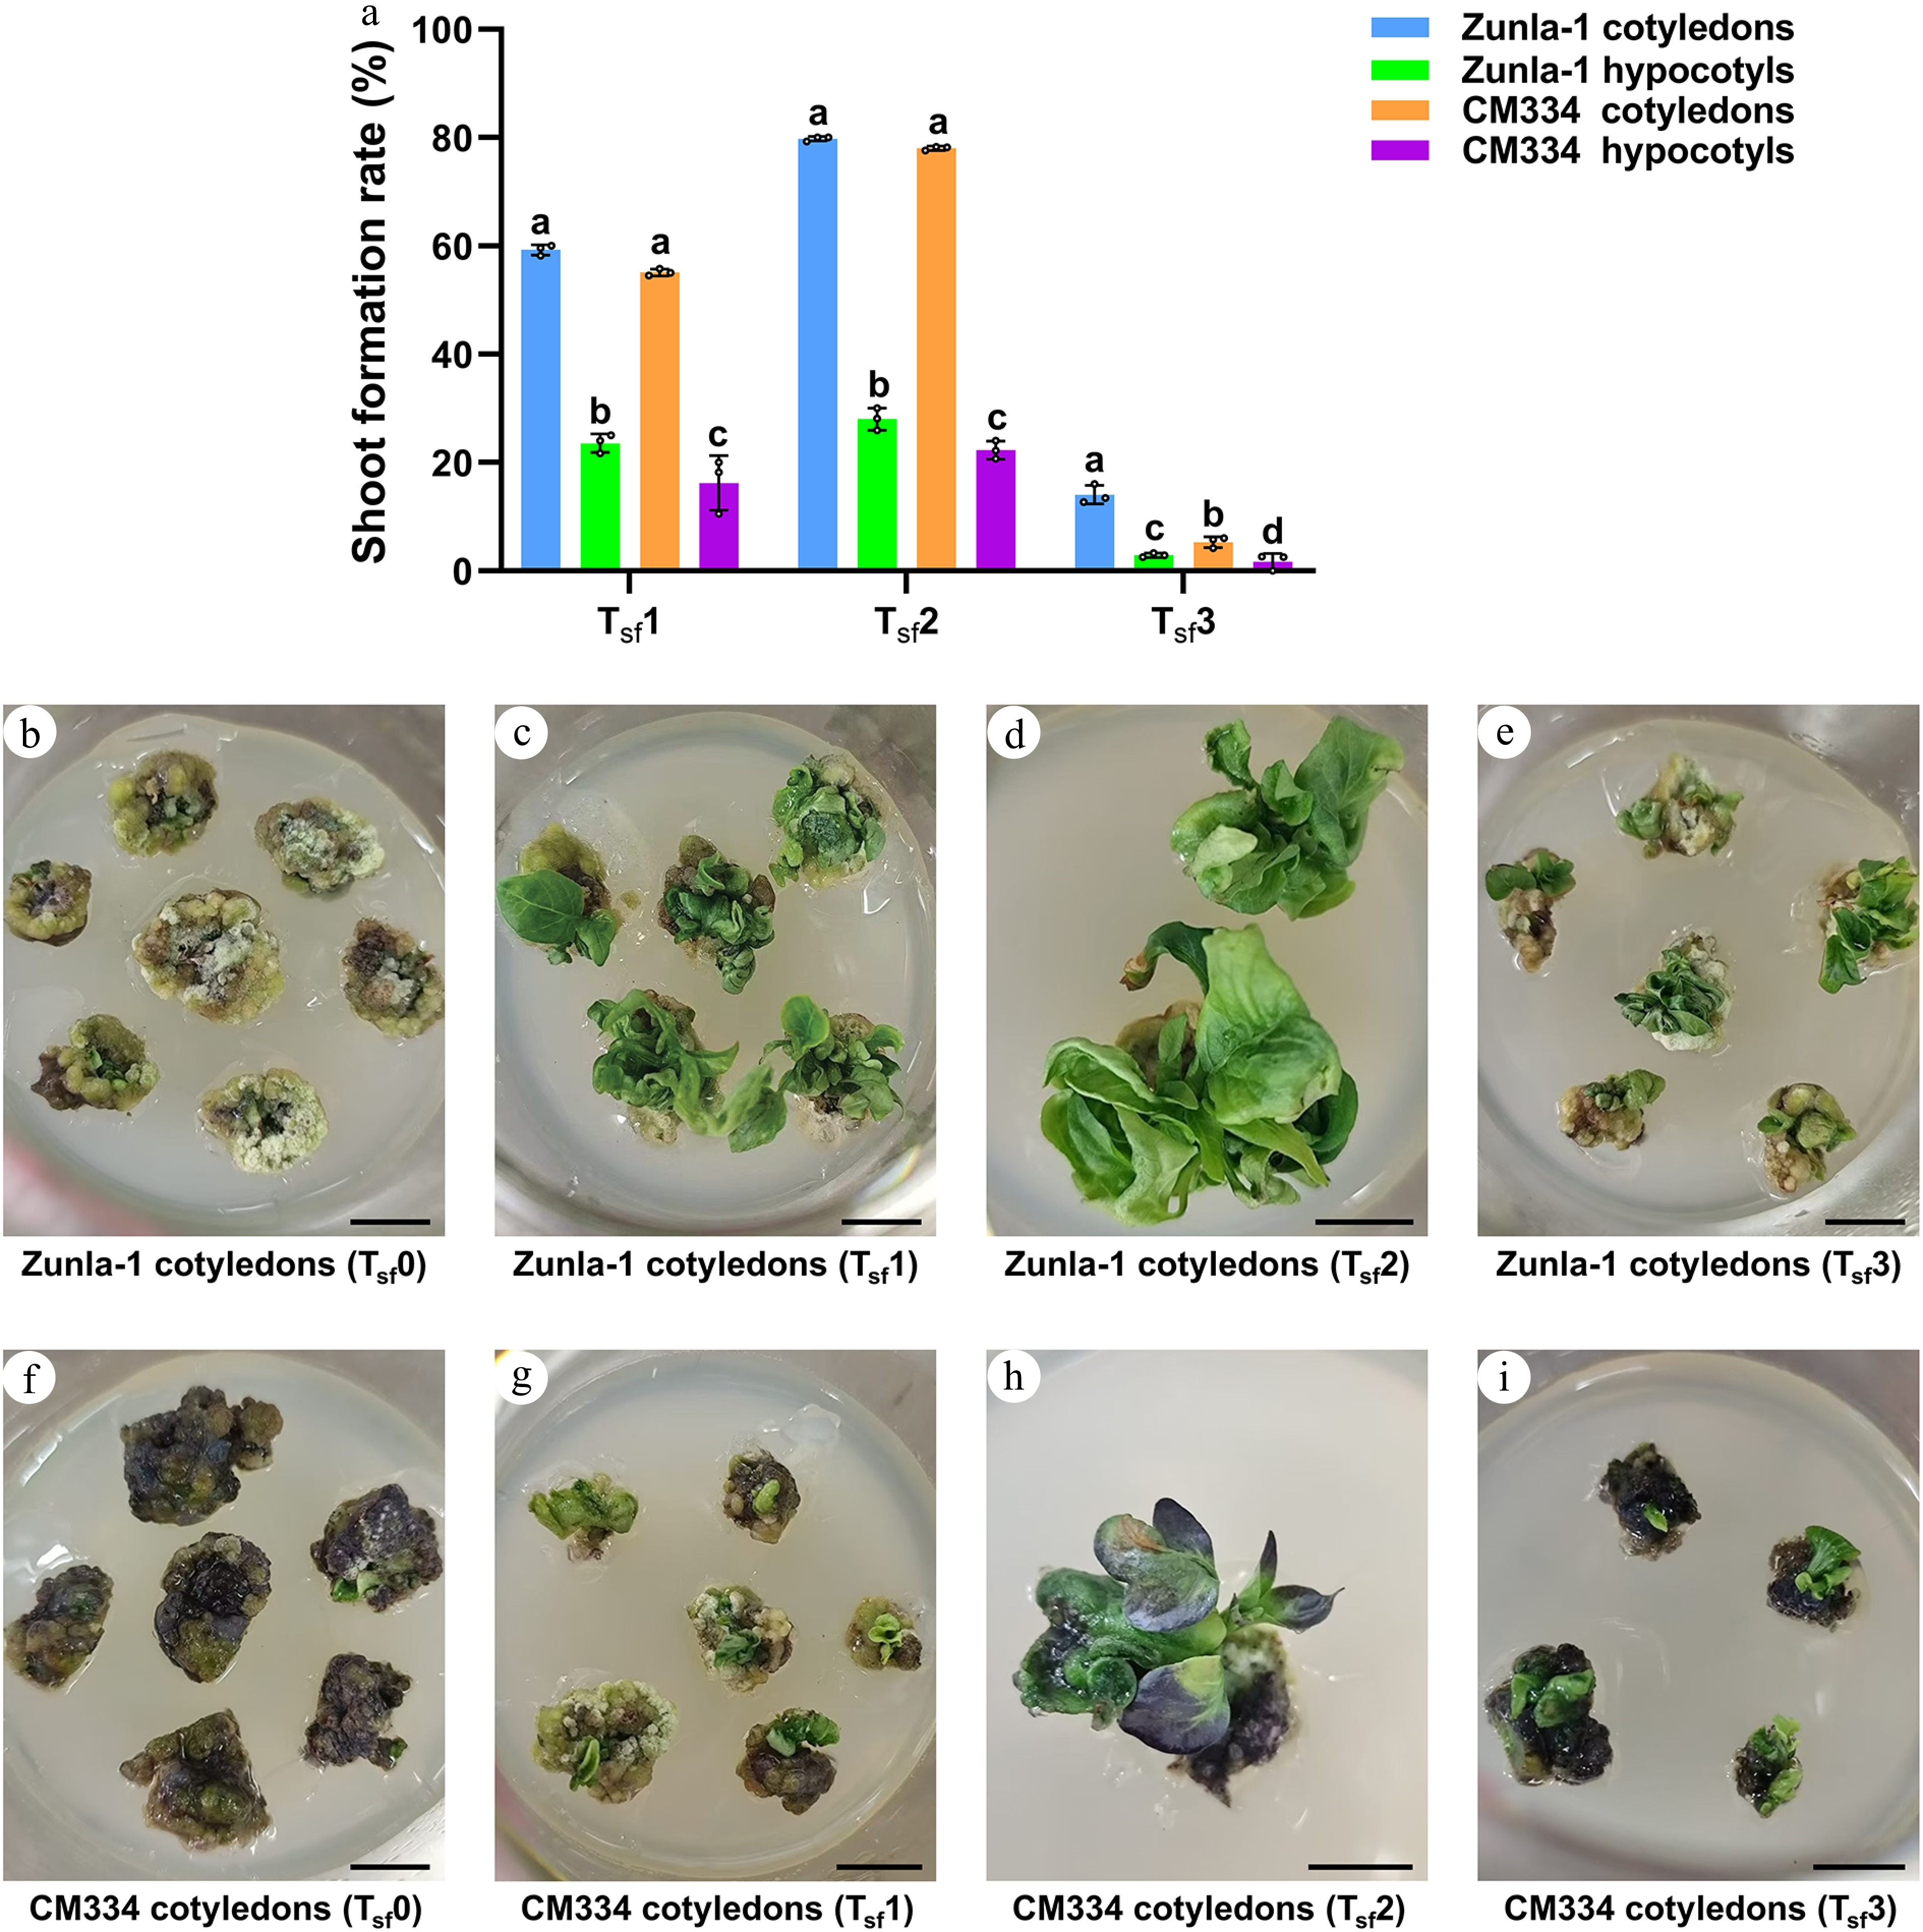
Figure 3.
Comparative analysis of shoot formation rate (%) in Zunla-1 and CM334 under Tsf1, Tsf2, and Tsf3. (a) Bar plot shows shoot formation rate in Zunla-1 and CM334 under Tsf1, Tsf2, and Tsf3. The annotations above the bars, marked as 'a', 'b', 'c', etc., signify statistical significance (p < 0.05), where bars sharing the same letter indicate no significant difference. (b)–(e) Show shoot formation under the effect of different treatments in Zunla-1 under control Tsf0 (without AgNO3); Tsf1: 5 mg/L AgNO3; Tsf2: 5 mg/L AgNO3 + 1 nM CaREF1; Tsf3: 10 mg/L AgNO3 + 1 nM CaREF1 in Zunla-1 cotyledon explants, respectively. (f)–(i) Demonstrates shoot formation under the effect of different treatments in CM334, control Tsf0 (without AgNO3); Tsf1: 5 mg/L AgNO3; Tsf2: 5 mg/L AgNO3 + 1 nM CaREF1; Tsf3: 10 mg/L AgNO3 + 1 nM CaREF1 in CM334 cotyledon explants, respectively. Scale bars indicate 1 cm.
-
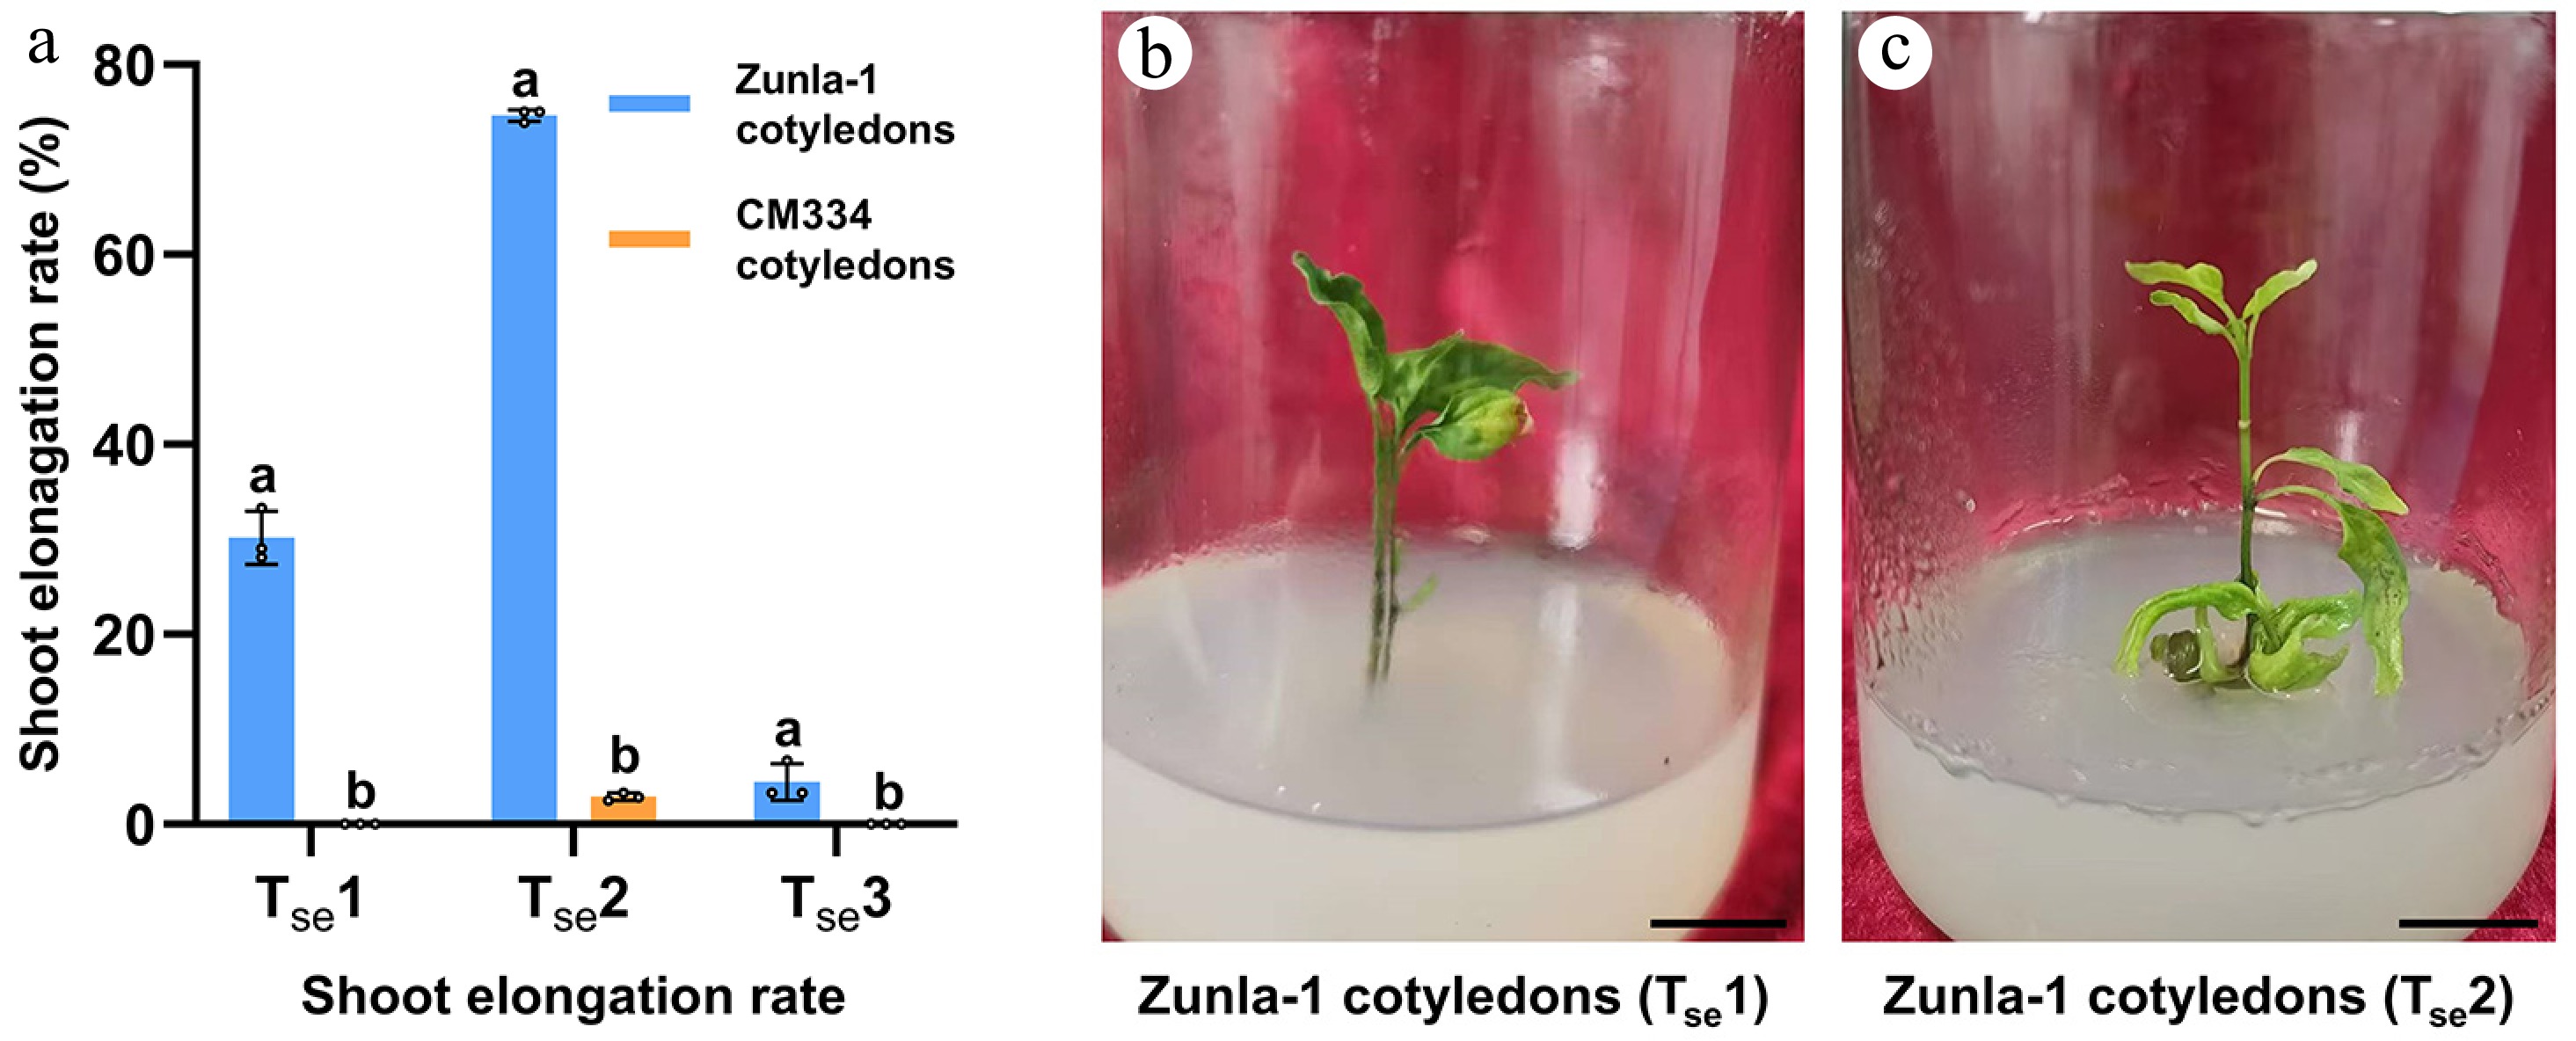
Figure 4.
Shoot elongation rates of Zunla-1 and CM334 under different treatments. (a) In the bar chart, the treatments are: Tse1: 0.5 mg/L GA3; Tse2: 0.5 mg/L GA3 + 1 nM CaREF1; Tse3: 1 mg/L GA3 + 1 nM CaREF1. Bars represent mean elongation rates (± SE) for cotyledons and hypocotyls of Zunla-1 and CM334. The annotations above the bars, marked as 'a', 'b', etc., signify statistical significance (p < 0.05). Bars sharing the same letter indicate no significant difference, while those with different letters denote significant differences in shoot elongation among the three treatments. (b)–(c) Images of shoot elongation in Zunla-1 cotyledon explants in Tse1 and Tse2, respectively. Scale bars indicate 1 cm.
-
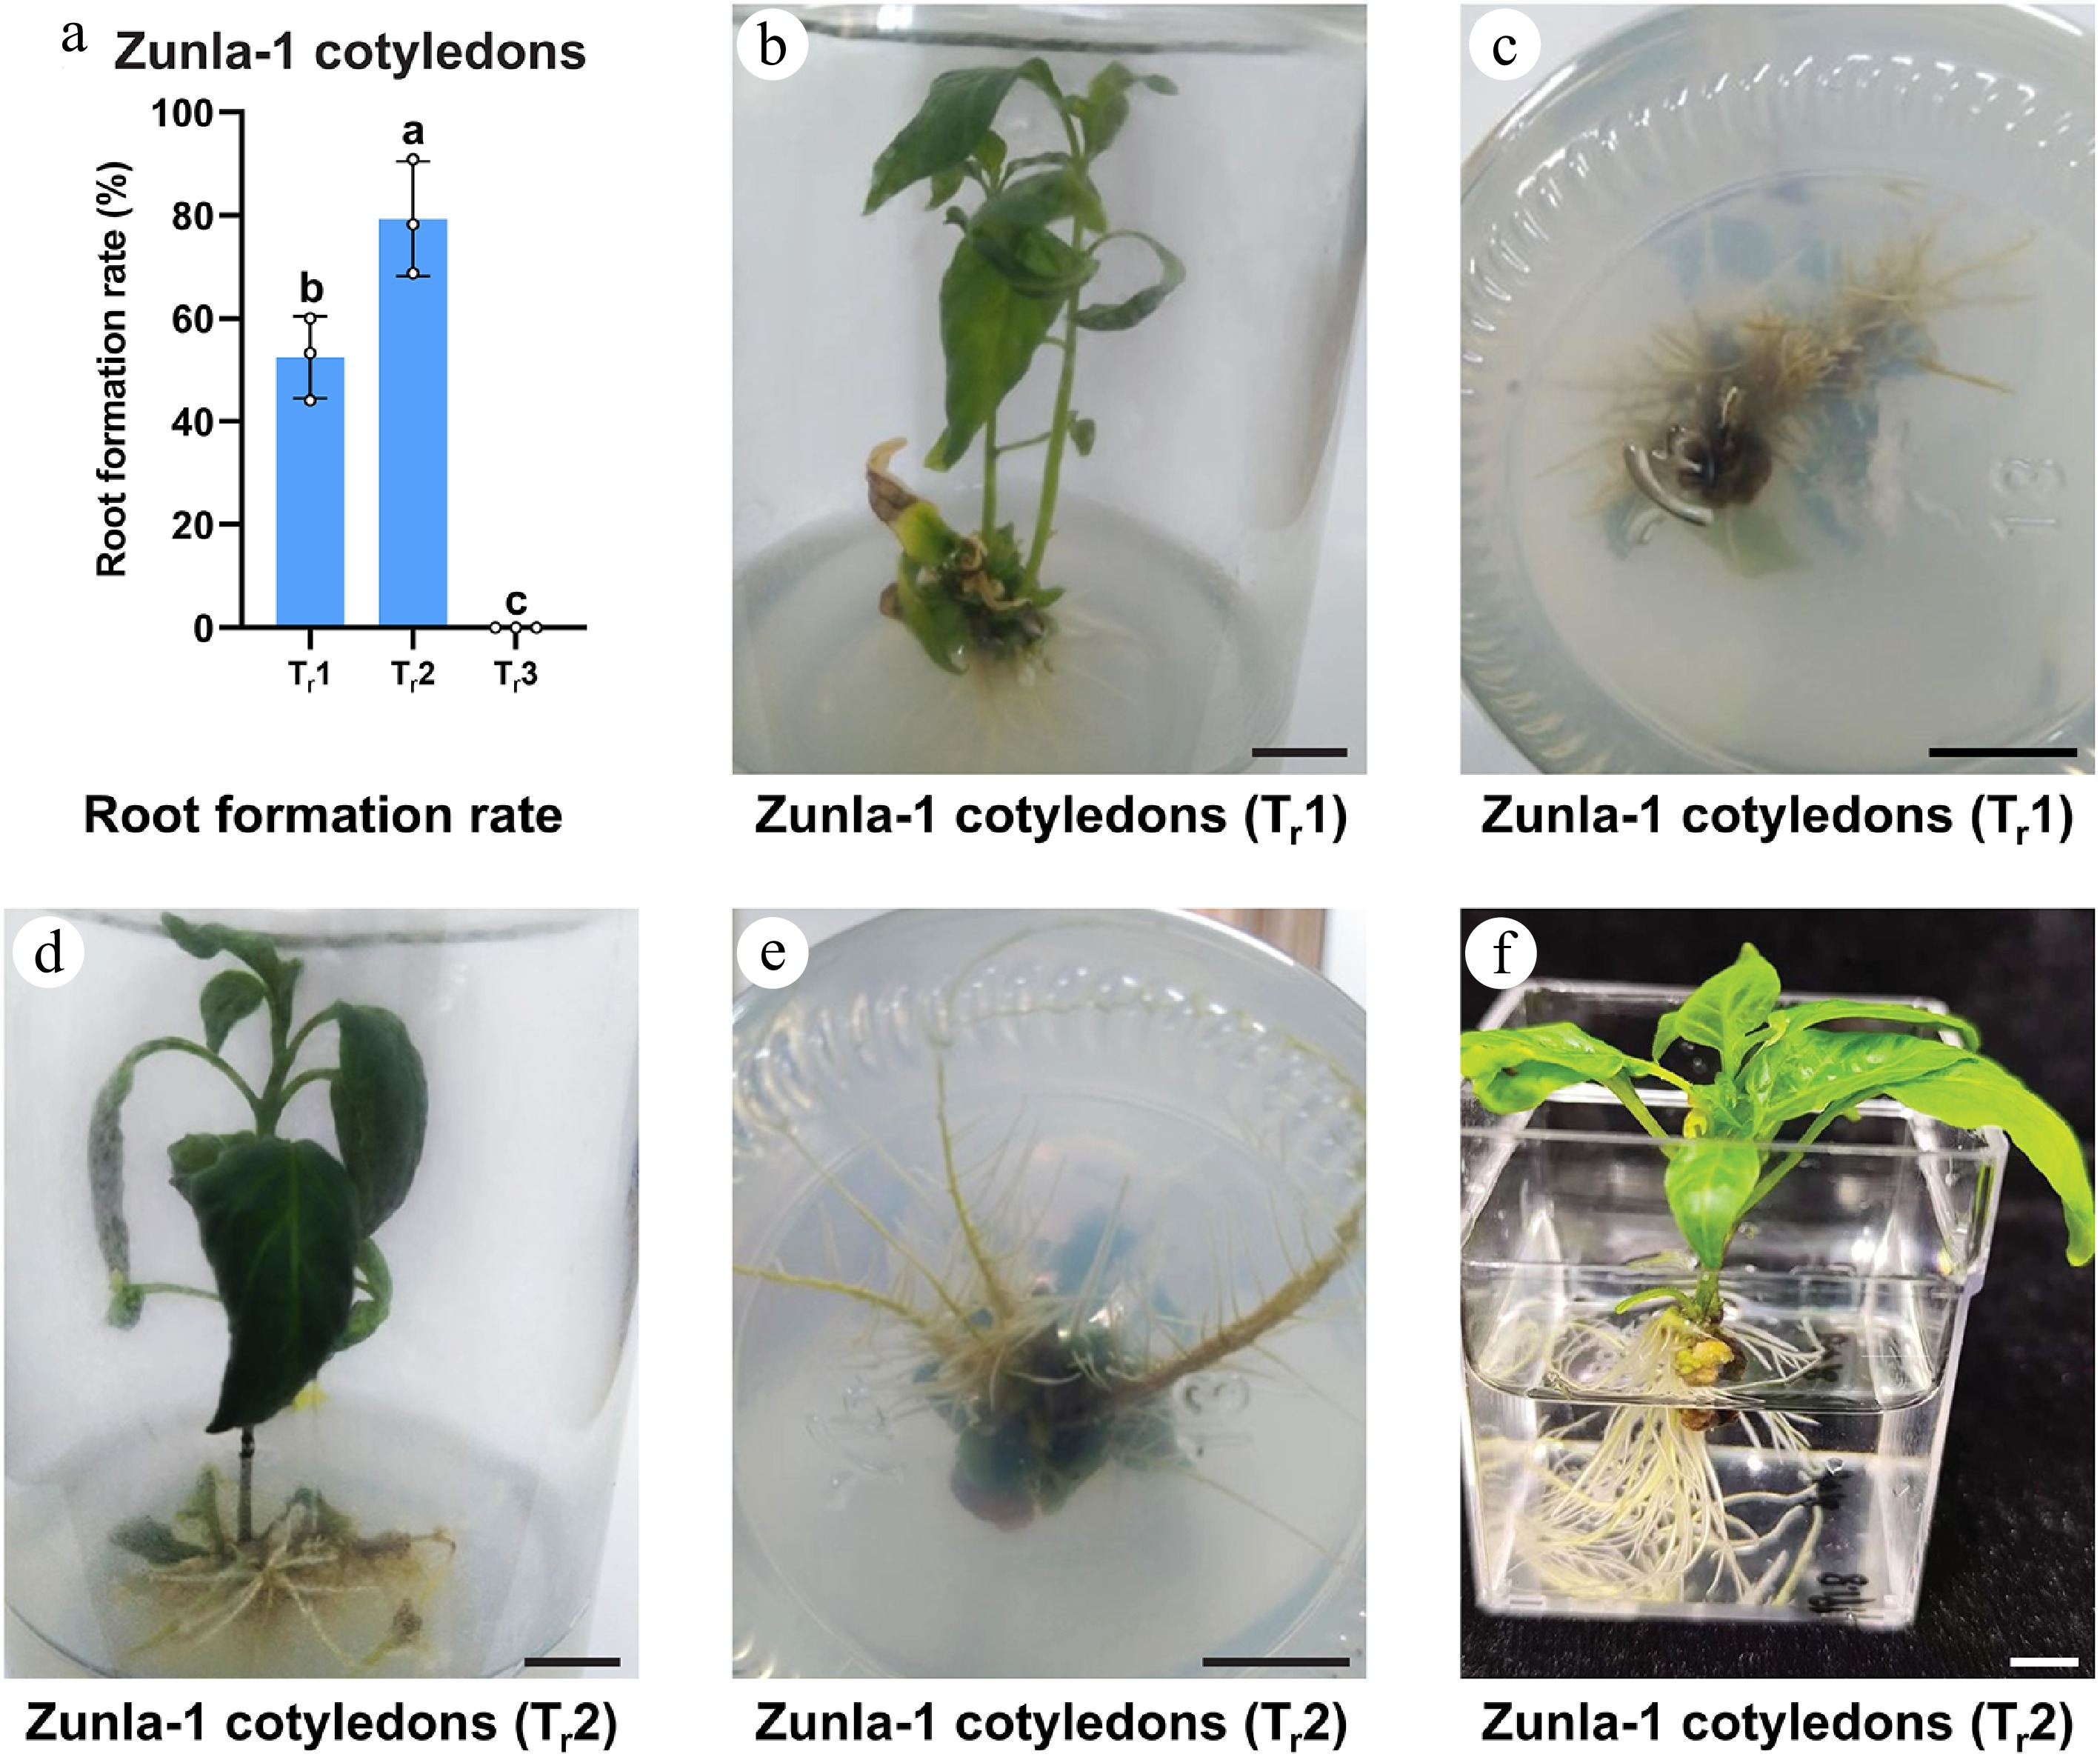
Figure 5.
Root formation rate (%) of Zunla-1 cotyledons under different treatments. (a) In the bar chart of root formation rate, Tr1: 1 mg/L IBA; Tr2: 1 mg/L IBA + 1 nM CaREF1; Tr3: 1 mg/L IAA+ 1 nM CaREF1. Bars represent mean elongation rates (± SE) for cotyledon explants. The annotations above the bars, marked as 'a', 'b' signify statistical significance (p < 0.05). (b)–(f) Images of root formation in Zunla-1 in MS medium and water. Scale bars indicate 1 cm.
-
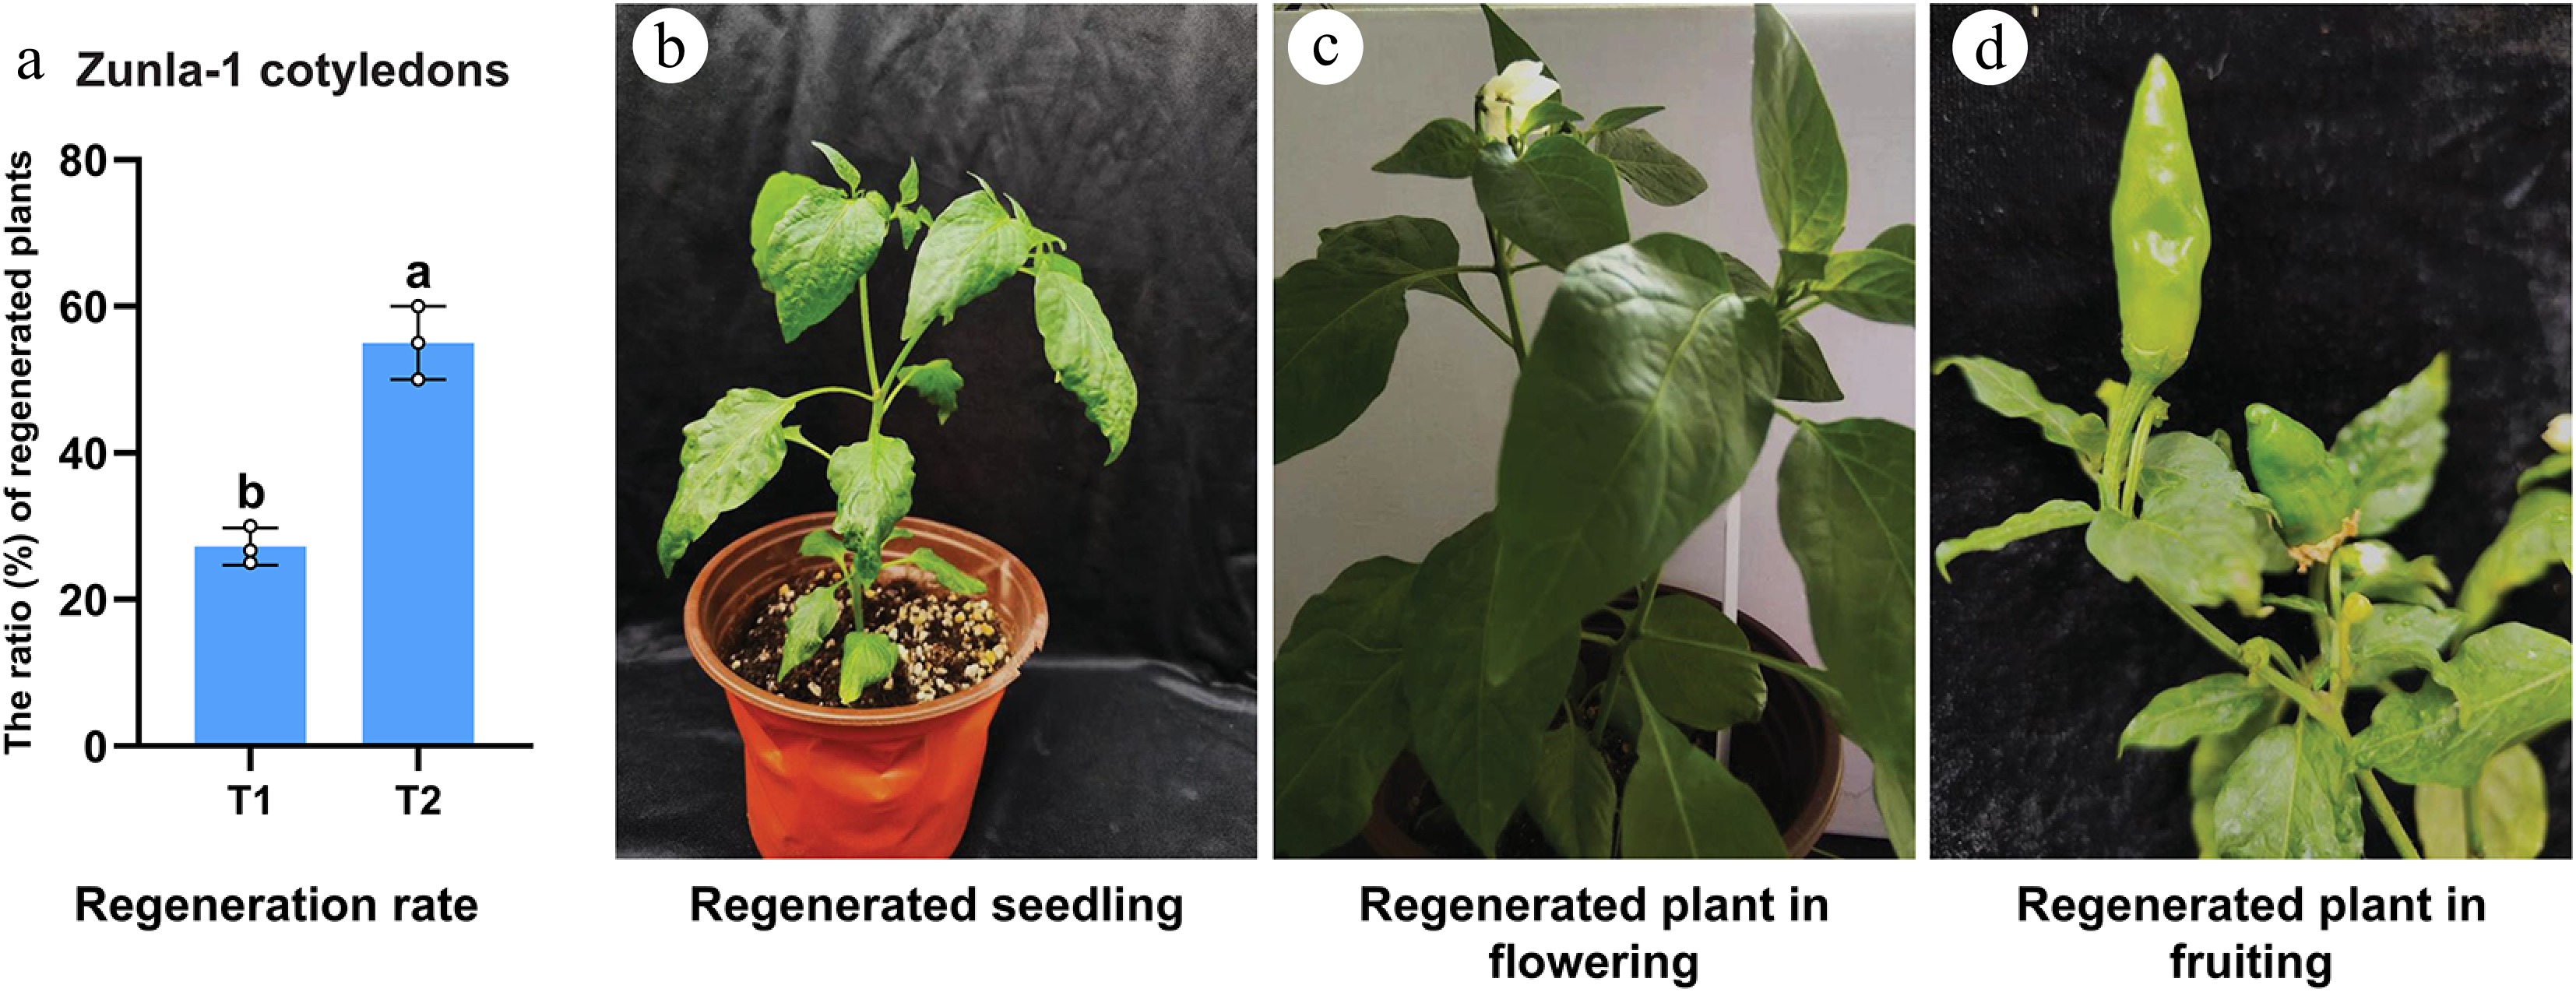
Figure 6.
The ratio (%) of regenerated plants for Zunla-1 cotyledons. (a) In the bar chart, T1: without CaREF1, T2: T1 + 1 nM CaREF1. Bars represent mean elongation rates (± SE) for cotyledon explants. The annotations above the bars, marked as 'a', 'b' denote statistical significance (p < 0.05). (b)–(d) Images of mature plants of Zunla-1 in pots, as well as plants showing flowering and fruiting in greenhouse conditions.
-
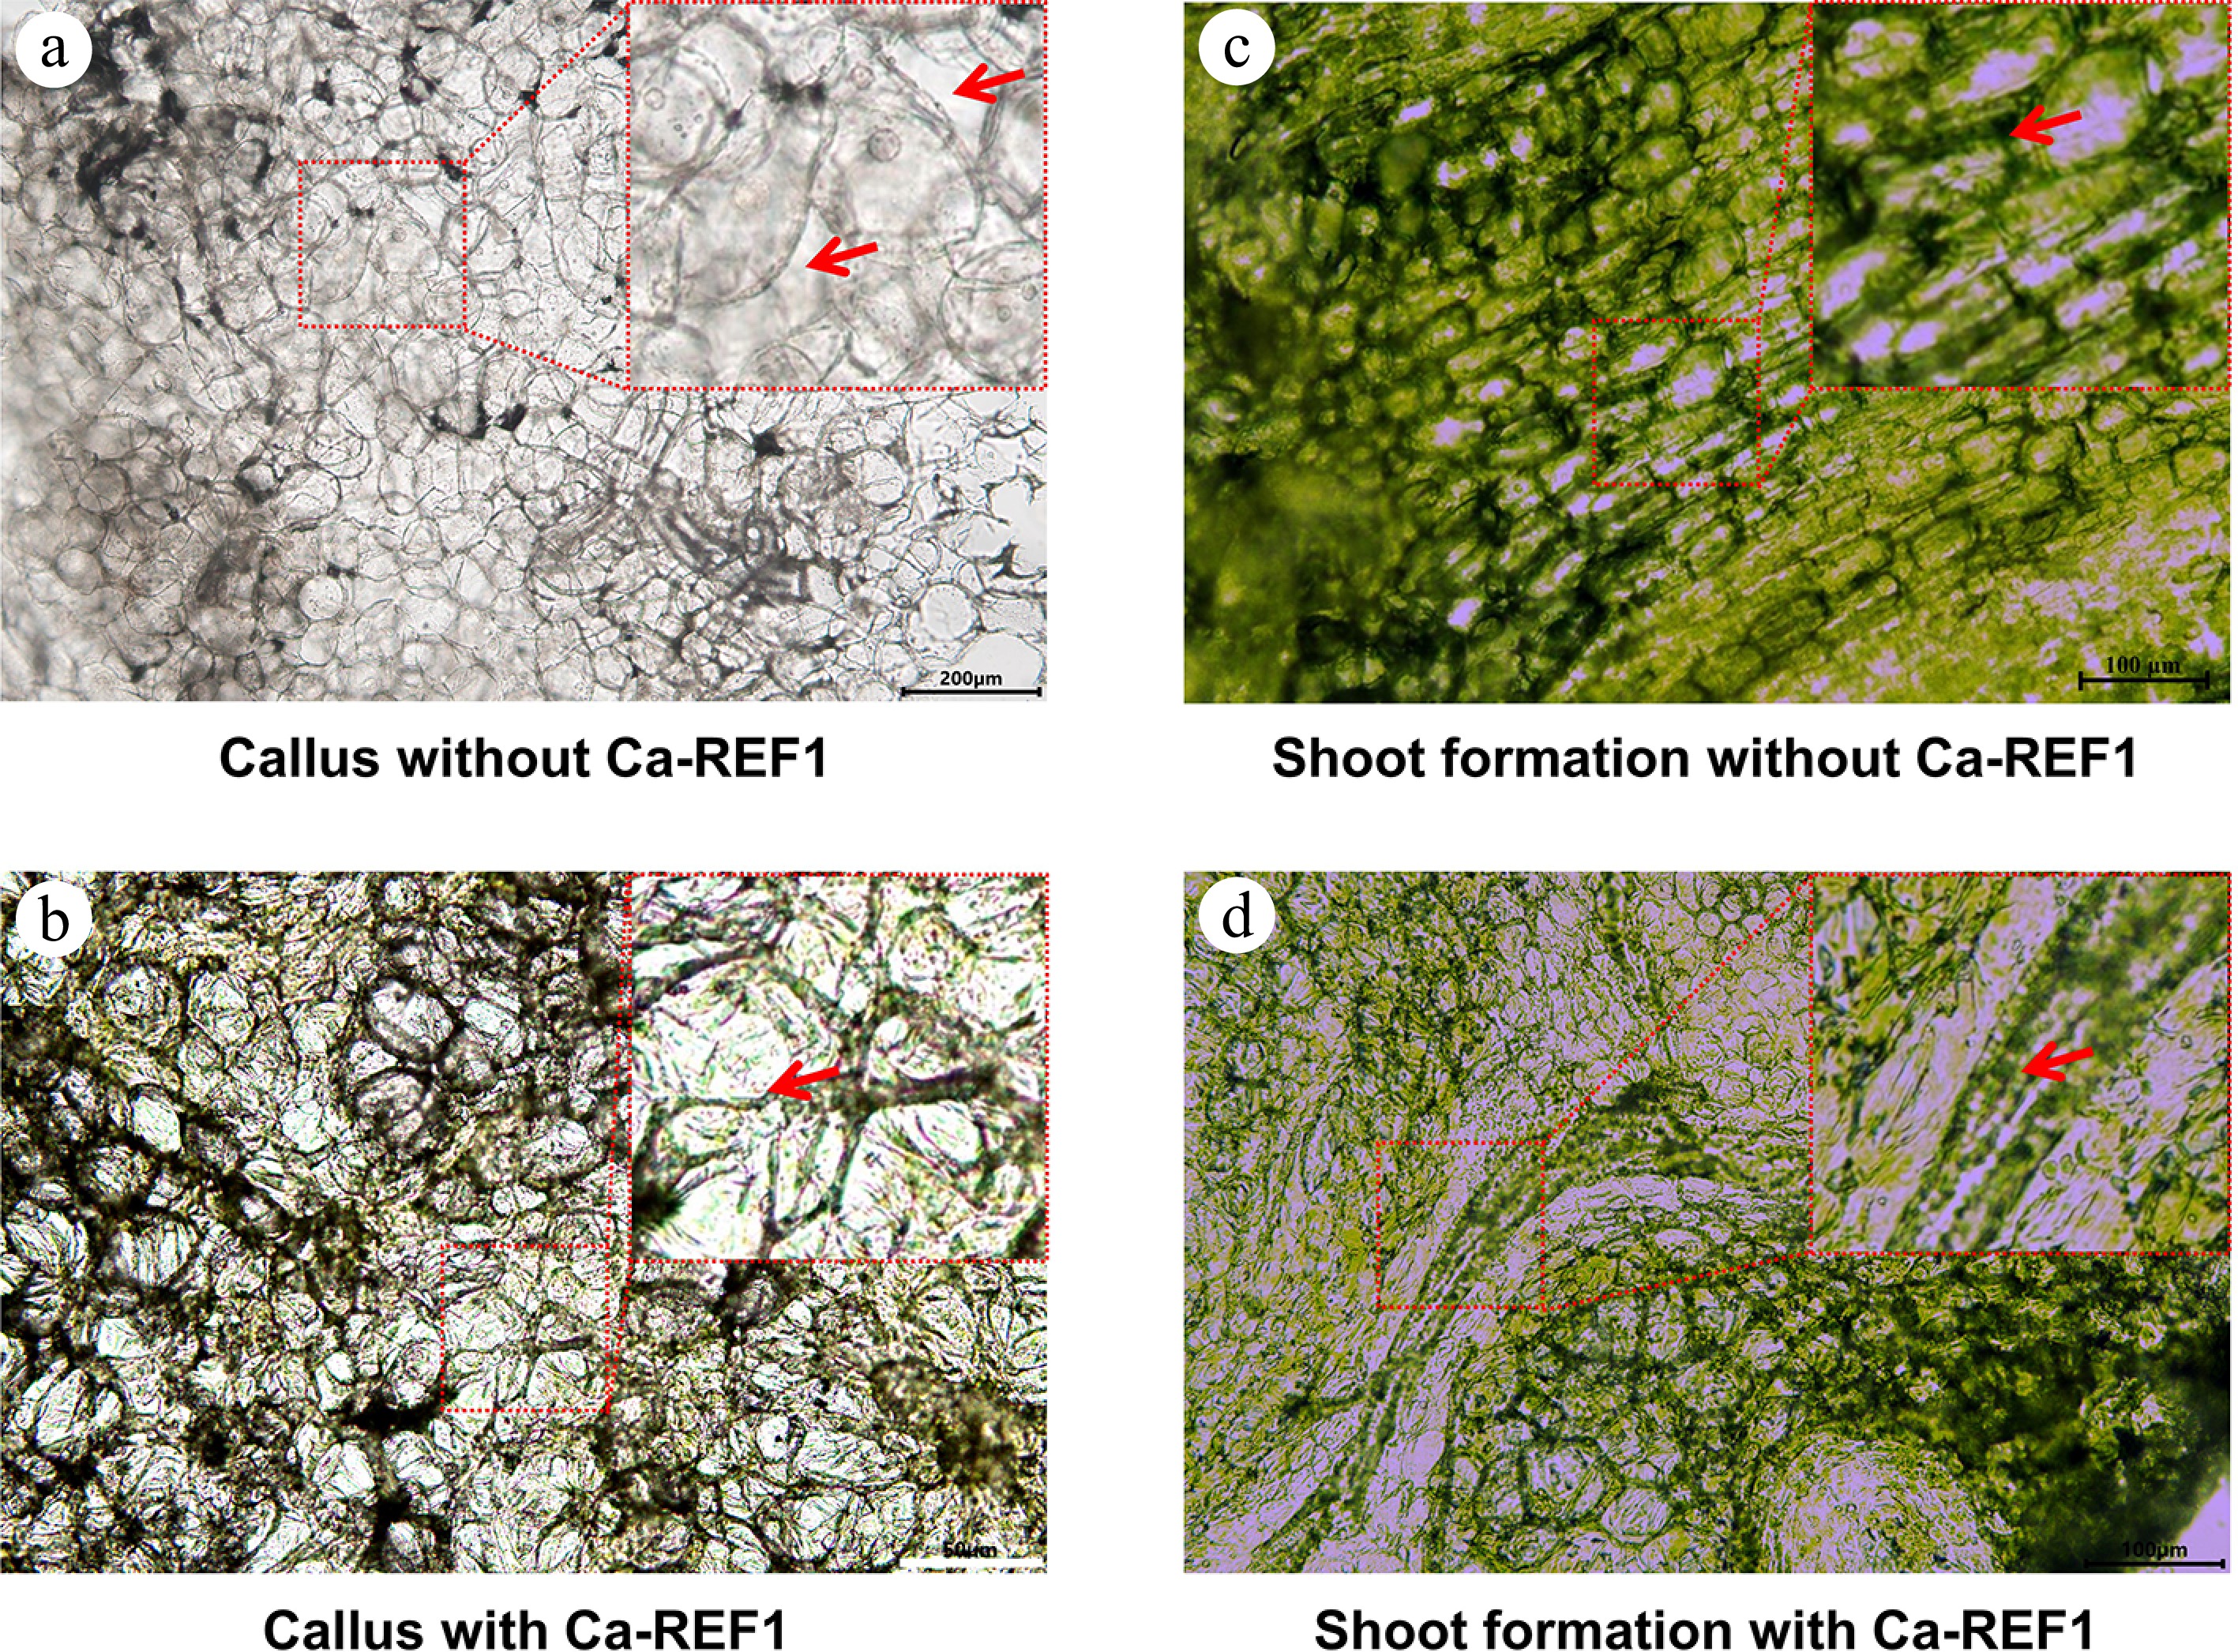
Figure 7.
Microscopic analysis of callus induction and shoot regeneration in tissue culture media with, and without CaREF1. (a), (b) Microscopic images showing callus induction in tissue culture media without, and with CaREF1 treatment. The enlarged parts display loosely arranged and densely packed cells in callus formation without, and with CaREF1, respectively. The red arrows in (a) indicate the gaps between cells, while the red arrow in (b) indicates the closely connected cells. (c)–(d) Shoot formation in media without, and with CaREF1 treatment. The enlarged parts display fewer compact cells with slower meristematic activity and more compact cells with higher meristematic activity without, and with CaREF1, respectively. The red arrow in (c) indicates these cells are loosely arranged, and lack the necessary conditions for normal division, while the red arrow in (d) indicates dense, smaller, and actively dividing cells. Scale bars: (a) 200 μm; (b) 50 μm; (c), (d) 100 μm.
-
Components Concentrations MS (g/L) 4.43 Sucrose (g/L) 30 Agar (g/L) 8 Table 1.
Seed germination medium.
-
Components Concentrations MS (g/L) 4.43 Sucrose (g/L) 30 Kinetin (g/L) 0.1 2,4-D (mg/L) 0.2 Table 2.
Explants soaking medium.
-
Components Tc1 Tc2 Tc3 Tc4 Tc5 MS (g/L) 4.43 4.43 4.43 4.43 4.43 Sucrose (g/L) 30 30 30 30 30 Agar (g/L) 8 8 8 8 8 BAP (mg/L) 5 5 5 5 5 IAA (mg/L) 1 1 1 1 1 2,4-D (mg/L) − − − − 2 CaREF1 (nM) − 1 1.5 2 1 NAA (mg/L) 0.01 0.01 0.01 0.01 0.01 ZT (mg/L) 2 2 2 2 2 Table 3.
Growth medium formulations with different cytokinins, along with, and without CaREF1 for callus formation.
-
Components Tsf0 Tsf1 Tsf2 Tsf3 MS (g/L) 4.43 4.43 4.43 4.43 Sucrose (g/L) 30 30 30 30 Agar (g/L) 8 8 8 8 BAP (mg/L) 5 5 5 5 IAA (mg/L) 1 1 1 1 CaREF1 (nM) − − 1 1 AgNO3 (mg/L) − 5 5 10 NAA (mg/L) 0.01 0.01 0.01 0.01 ZT (mg/L) 2 2 2 2 Table 4.
Growth medium formulations with different treatments of AgNO3, along with, and without CaREF1 for shoot formation.
-
Components Tse0 Tse1 Tse2 Tse3 MS (g/L) 4.43 4.43 4.43 4.43 Sucrose (g/L) 30 30 30 30 Agar (g/L) 8 8 8 8 BAP (mg/L) 5 5 5 5 IAA (mg/L) 1 1 1 1 CaREF1 (nM) − − 1 1 GA3 (mg/L) − 0.5 0.5 1 NAA (mg/L) 0.01 0.01 0.01 0.01 ZT (mg/L) 2 2 2 2 Table 5.
Growth medium formulations with different treatments of GA3, along with, and without CaREF1 for shoot elongation.
-
Components Tr0 Tr1 Tr2 Tr3 MS (g/L) 4.43 4.43 4.43 4.43 Sucrose (g/L) 30 30 30 30 Agar (g/L) 8 8 8 8 IBA (mg/L) − 1 1 − IAA (mg/L) − − − 1 CaREF1 (nM) − − 1 1 Table 6.
Growth medium formulations with different treatments of (IBA and IAA) along with, and without CaREF1 for root formation.
Figures
(7)
Tables
(6)