-
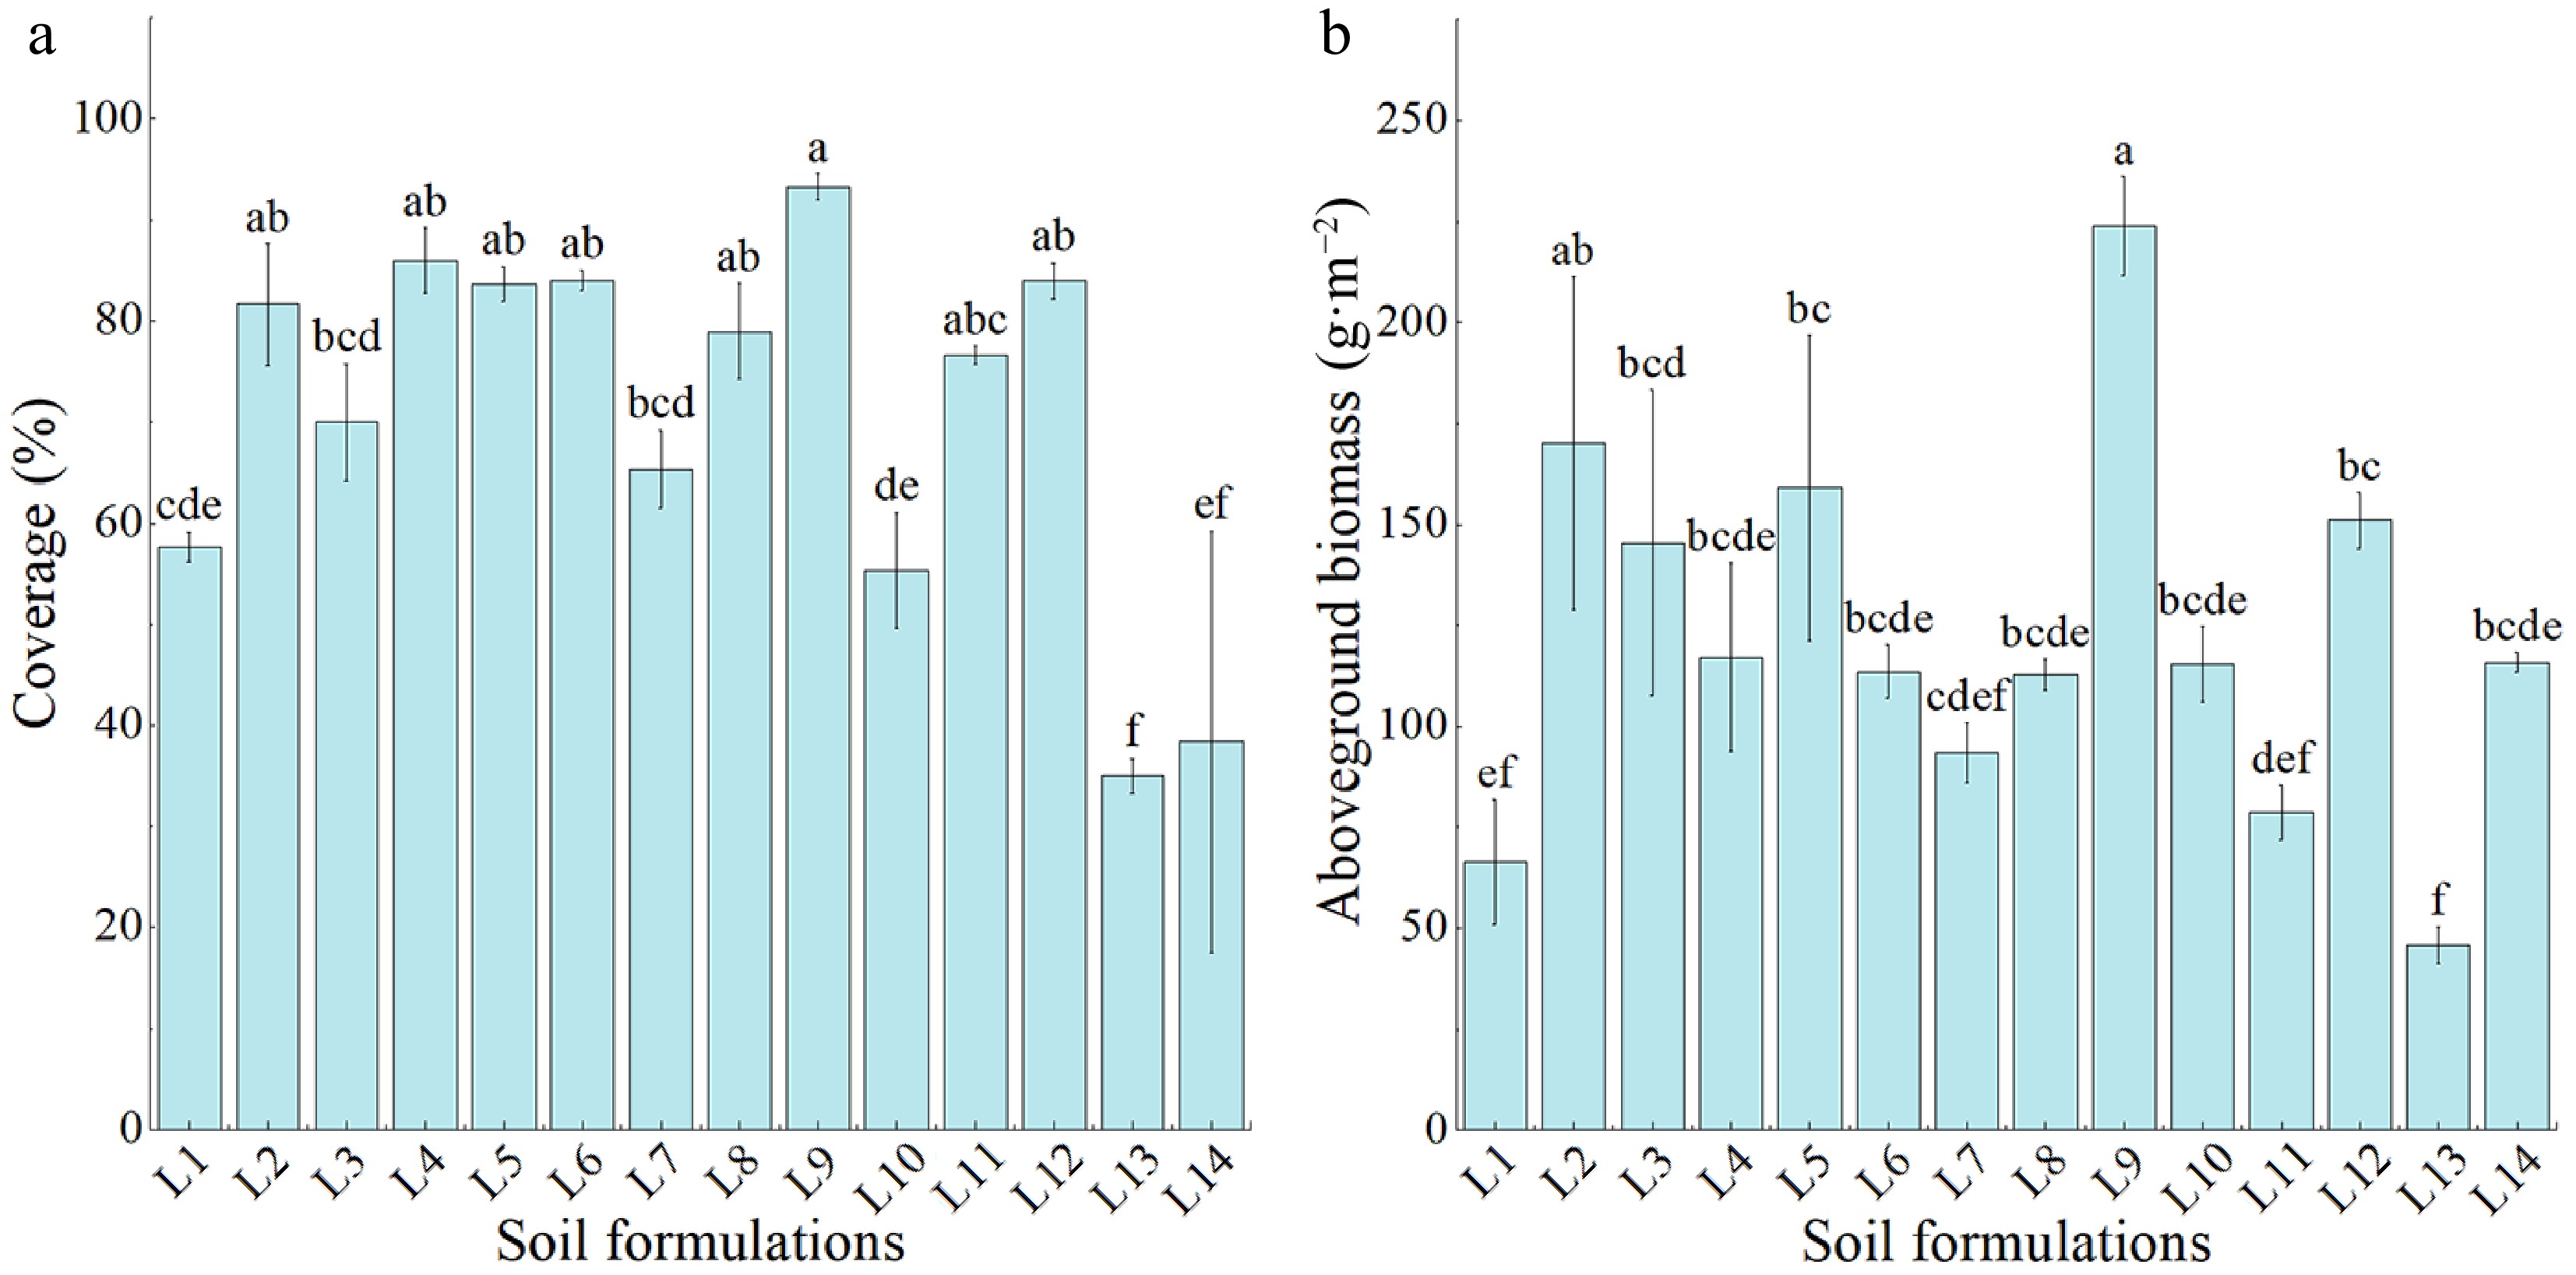
Figure 1.
The effects of different ratios of treated-waste slag soil on Elymus nutans vegetation coverage and aboveground biomass. (a) Vegetation coverage. (b) Aboveground biomass. Different lowercase letters indicate significant differences among different treatments (p < 0.05).
-
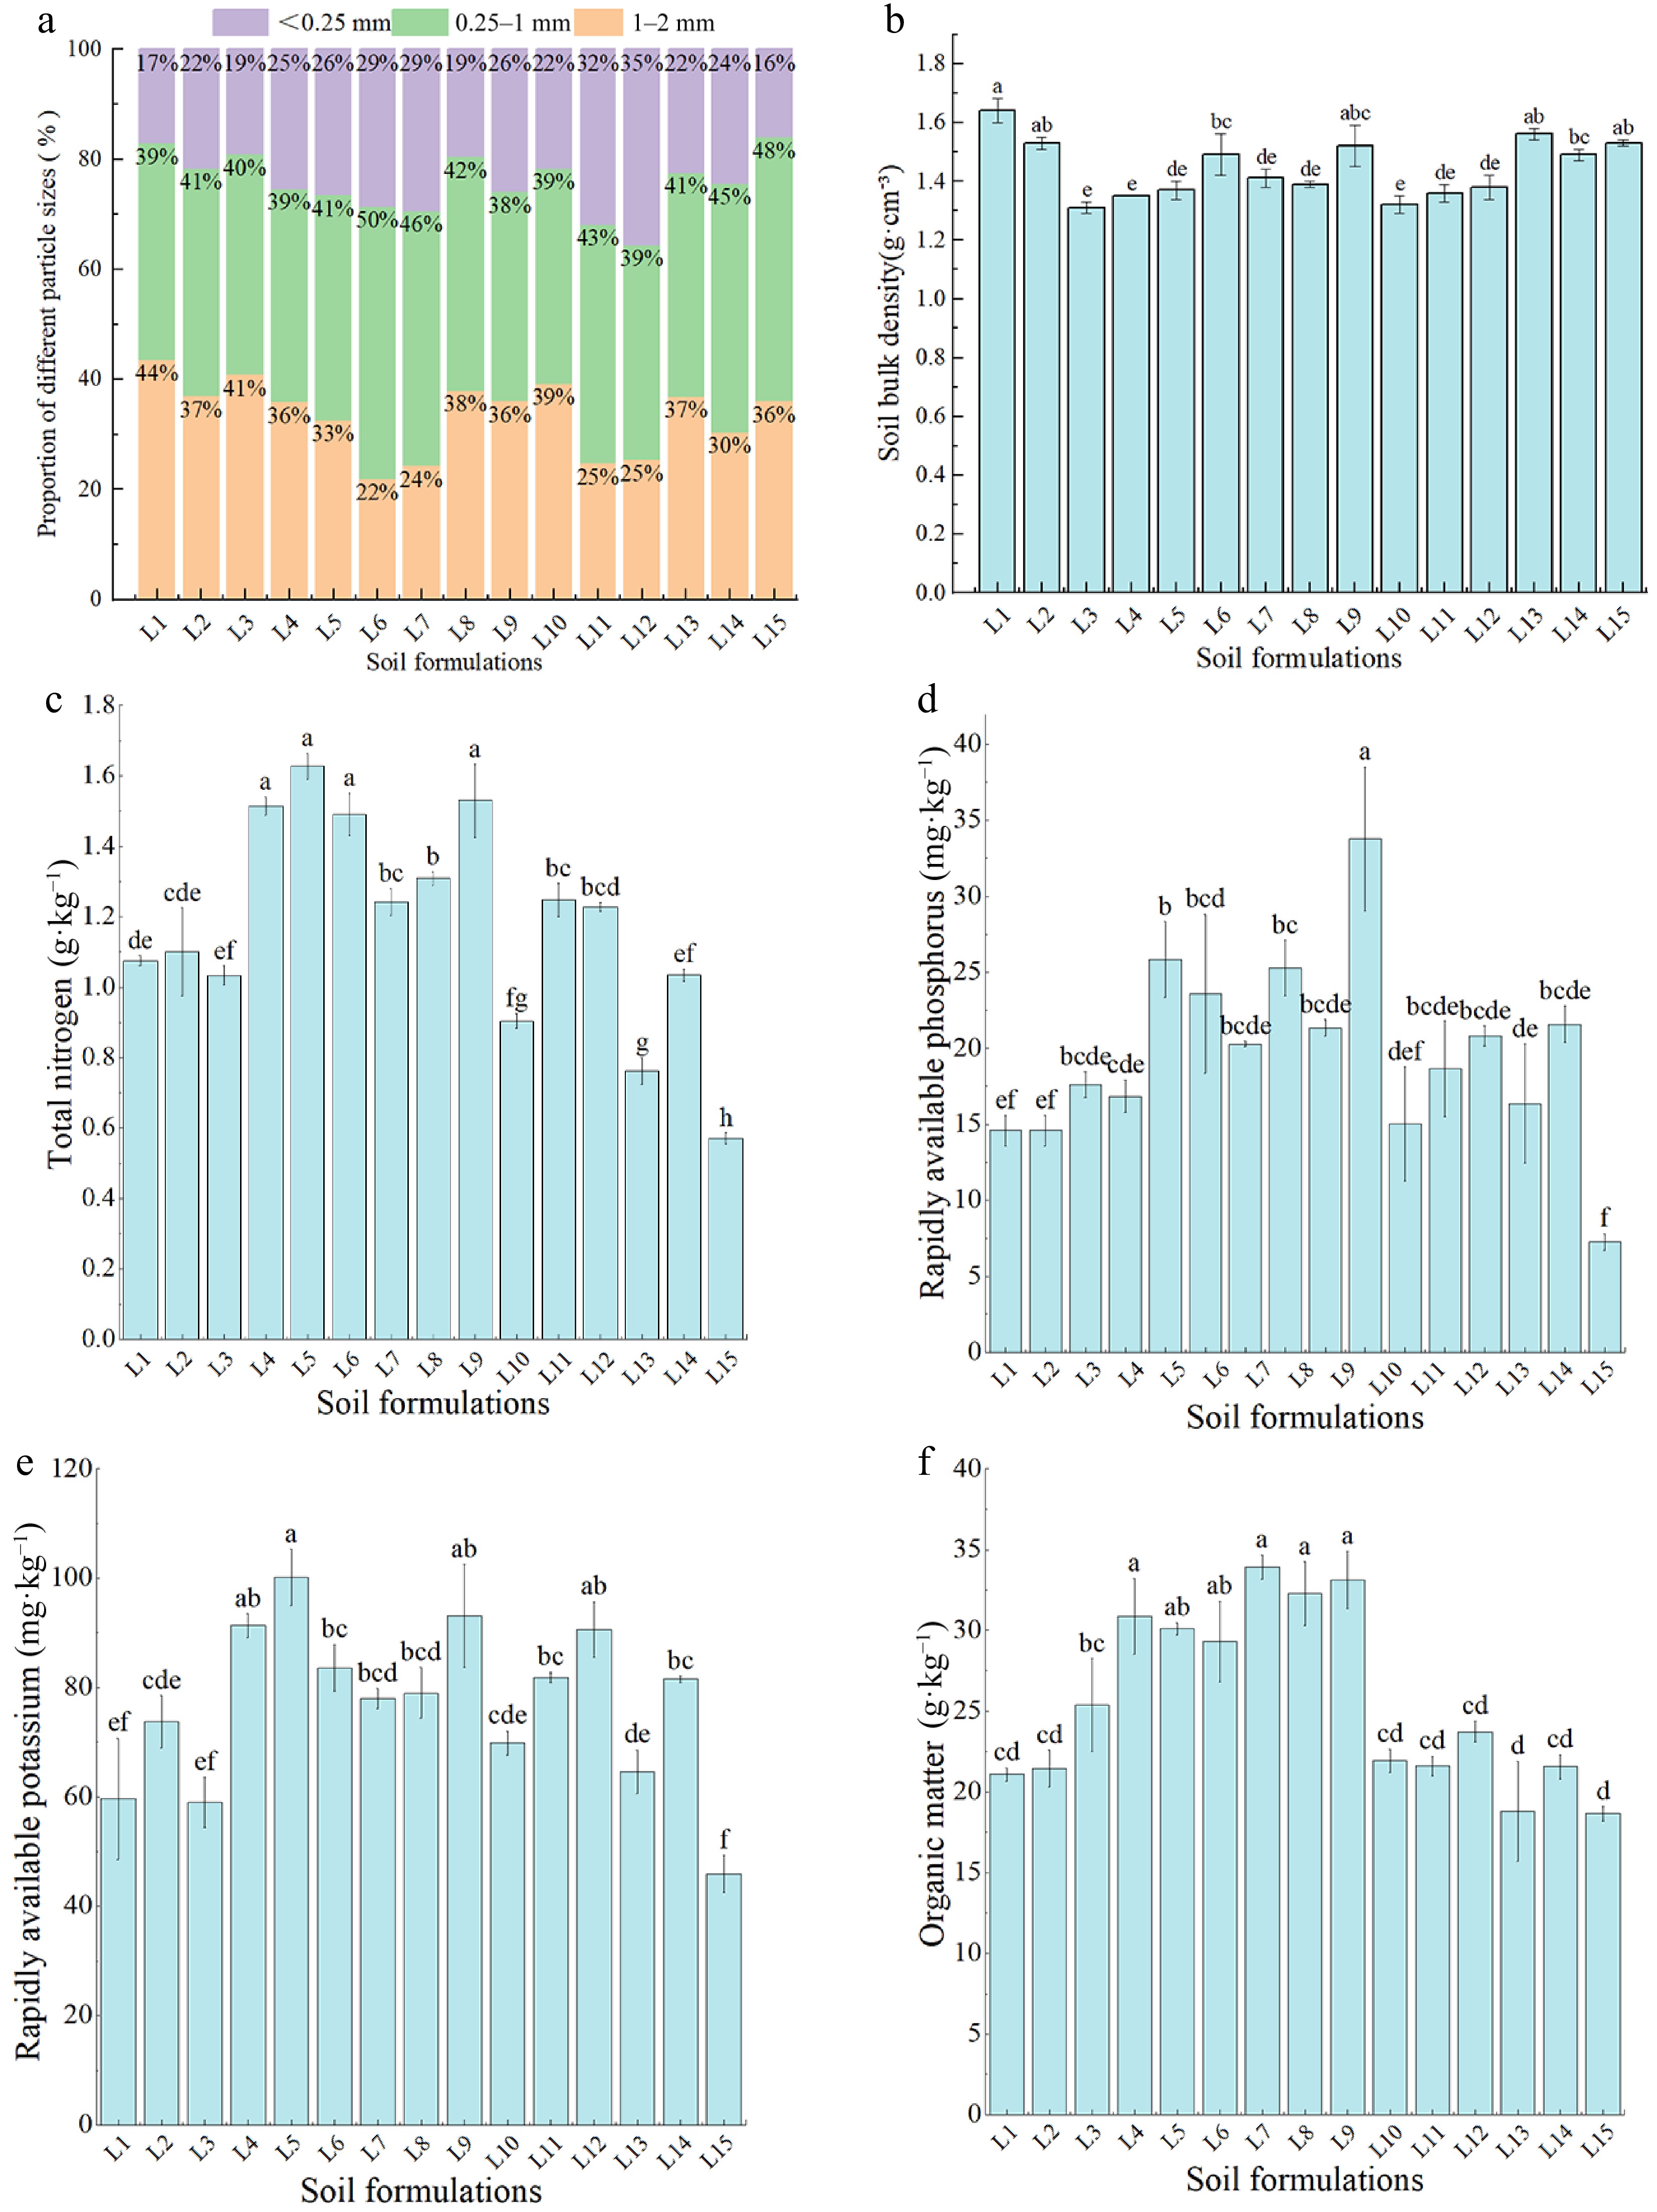
Figure 2.
Effects of different ratios of treated-waste slag soil on soil physical and chemical indexes. (a) Particle size composition. (b) Soil bulk density. (c) Total nitrogen. (d) Available phosphorus. (e) Available potassium. (f) Organic matter.
-
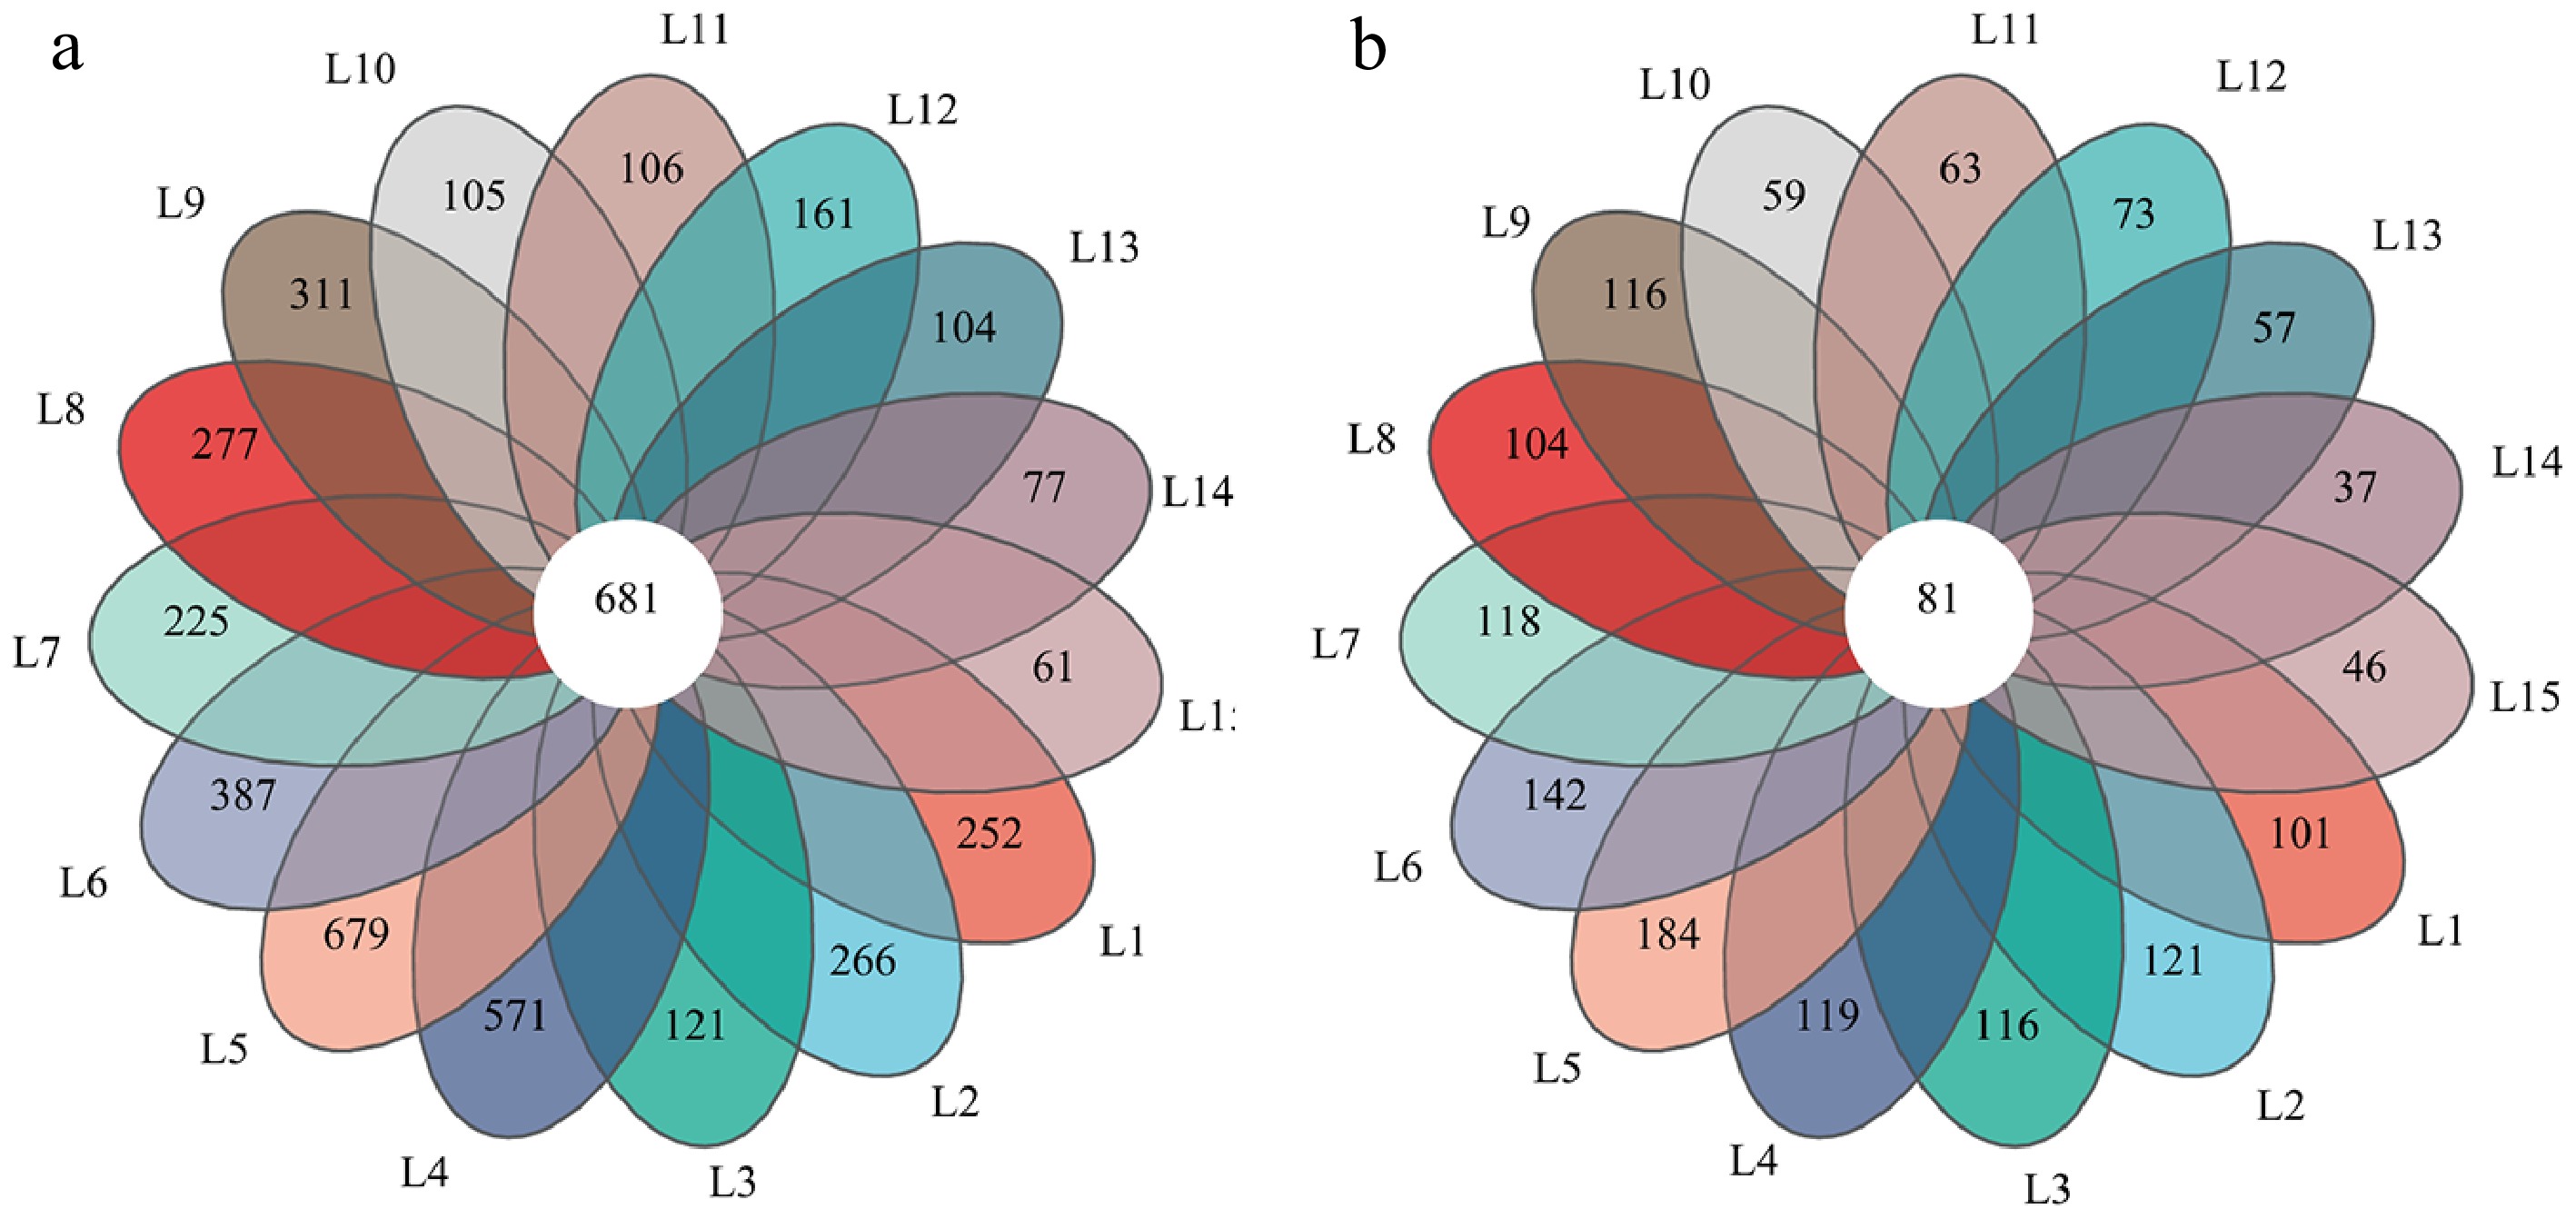
Figure 3.
Venn diagram showing the distribution of microbial OTUs in different waste-mixed soils. (a) Bacteria, (b) Fungi.
-
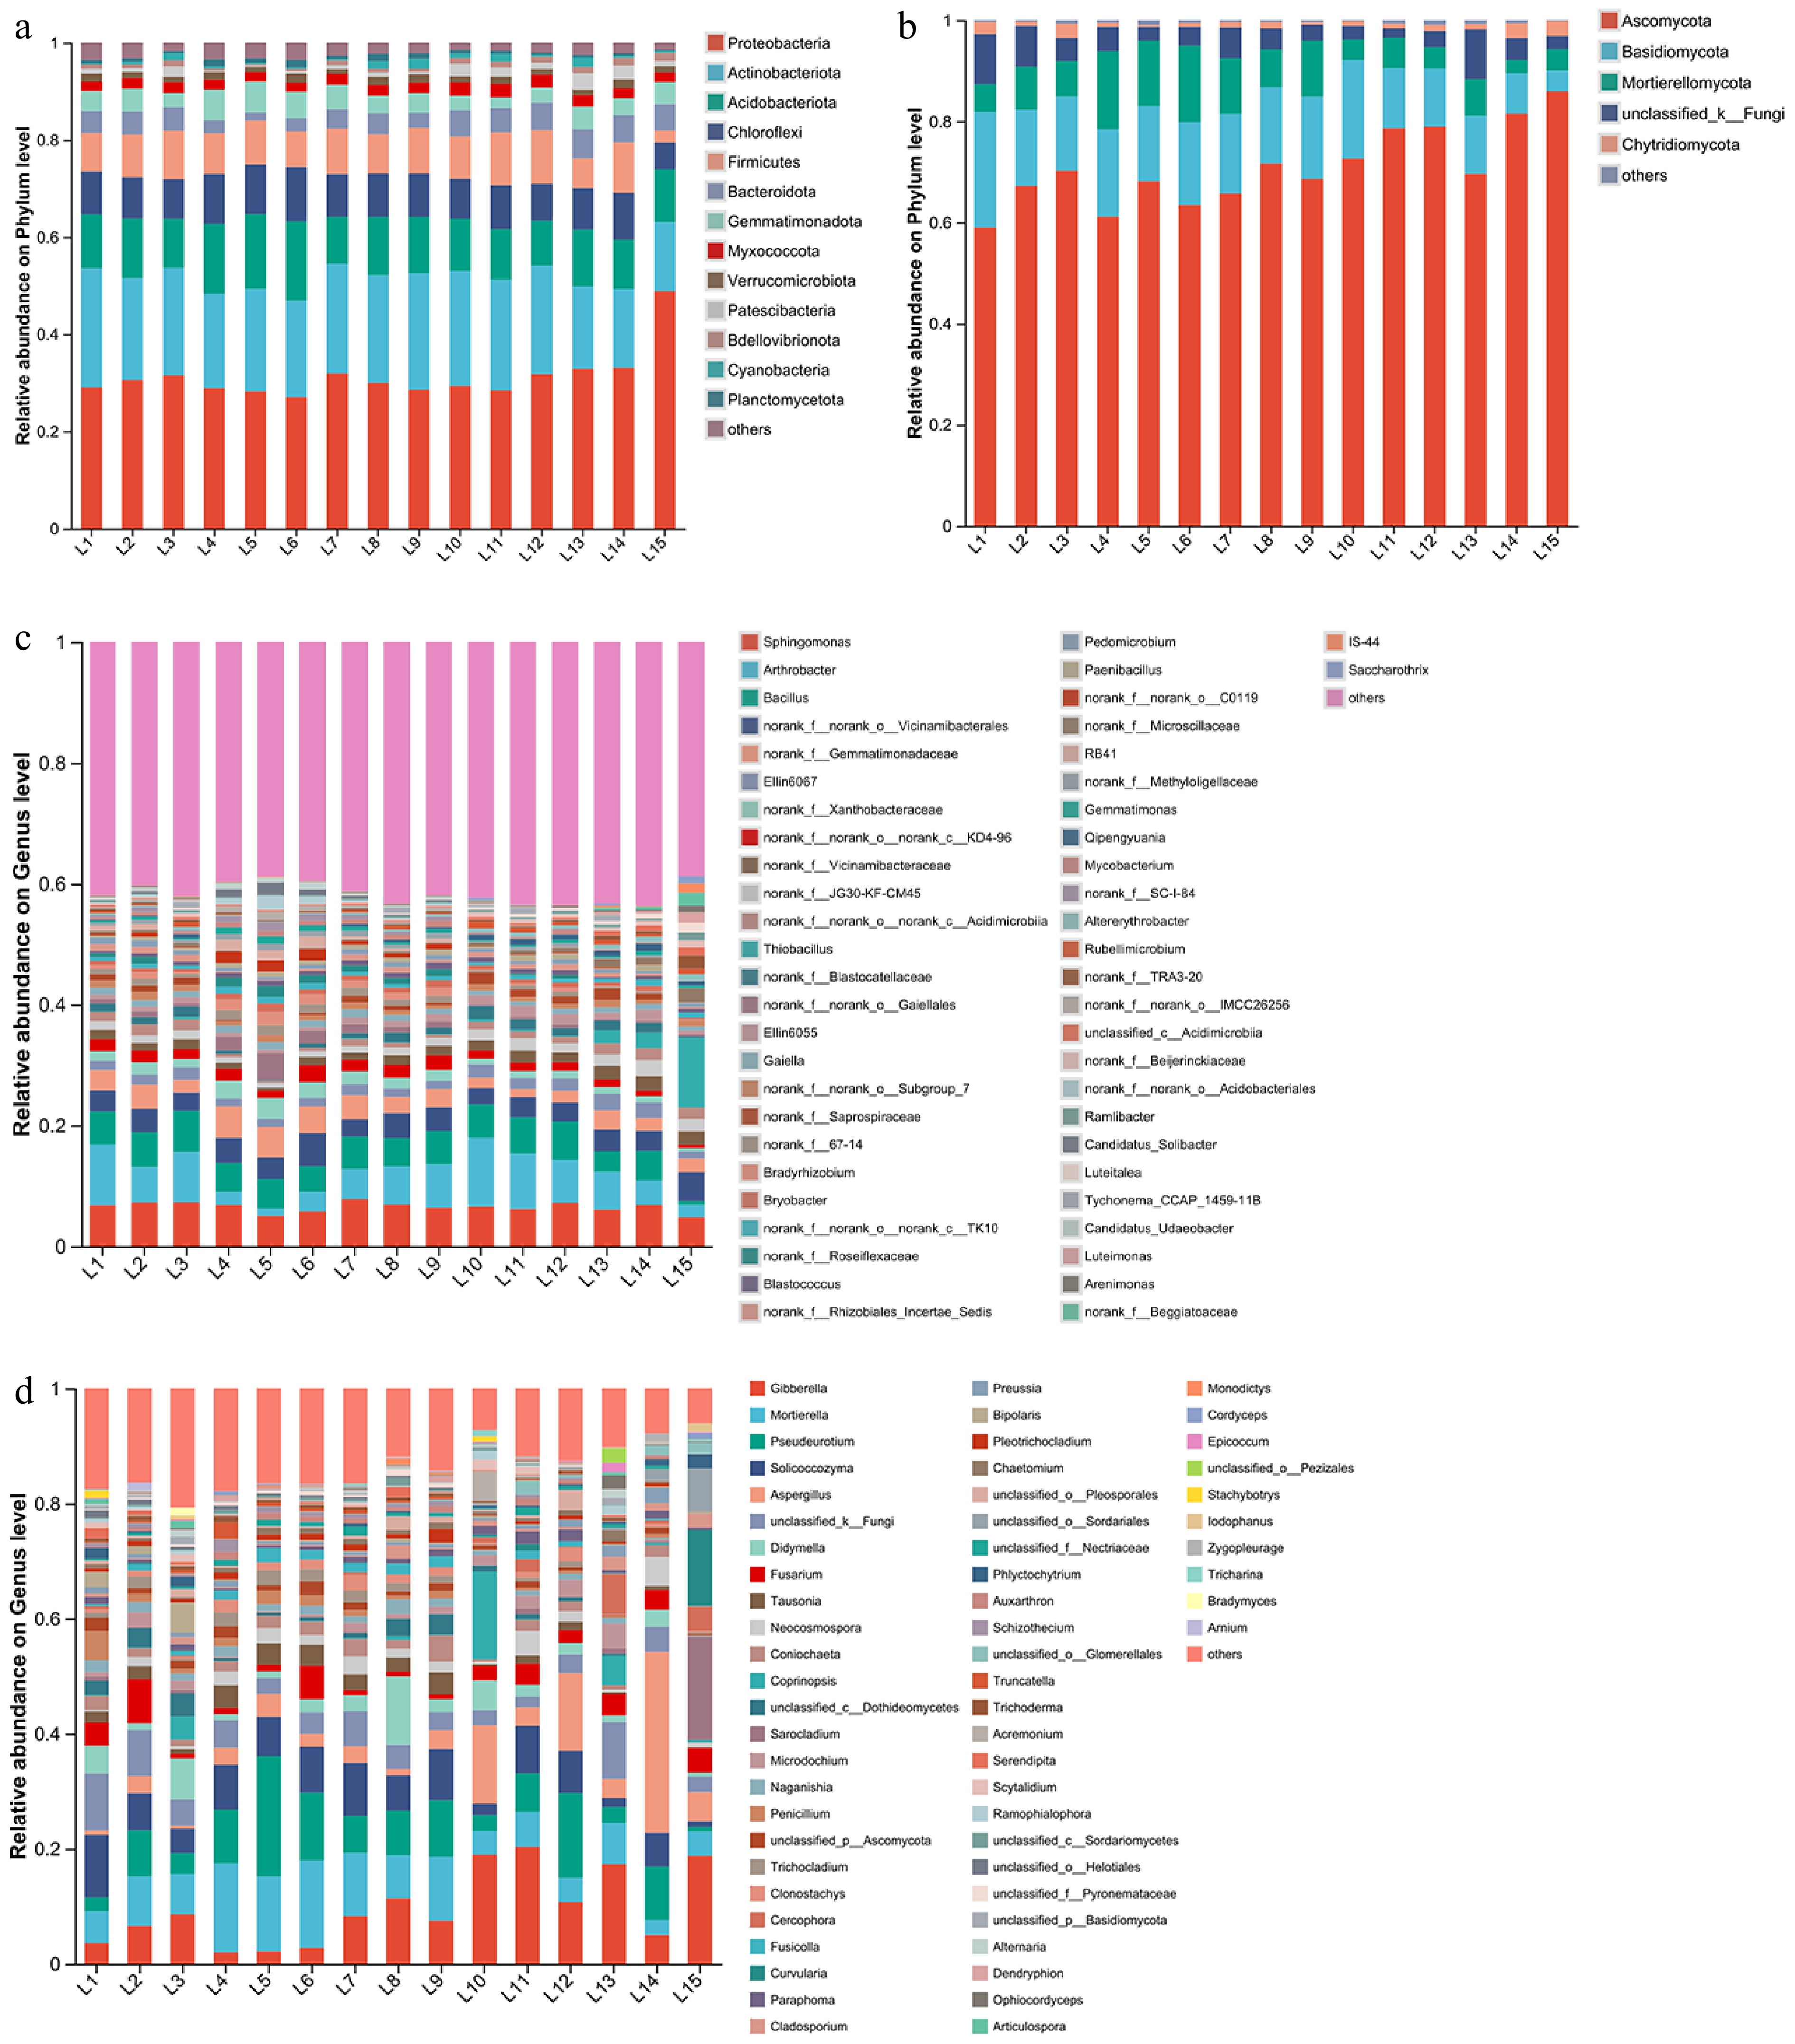
Figure 4.
The community composition and relative abundance of soil microorganisms at the phylum level and genus level under different treatments. The data represent the community composition and relative abundance of (a) bacteria, (b) fungi at the phylum level, and the community composition and relative abundance of (c) bacteria, and (d) fungi at the genus level.
-
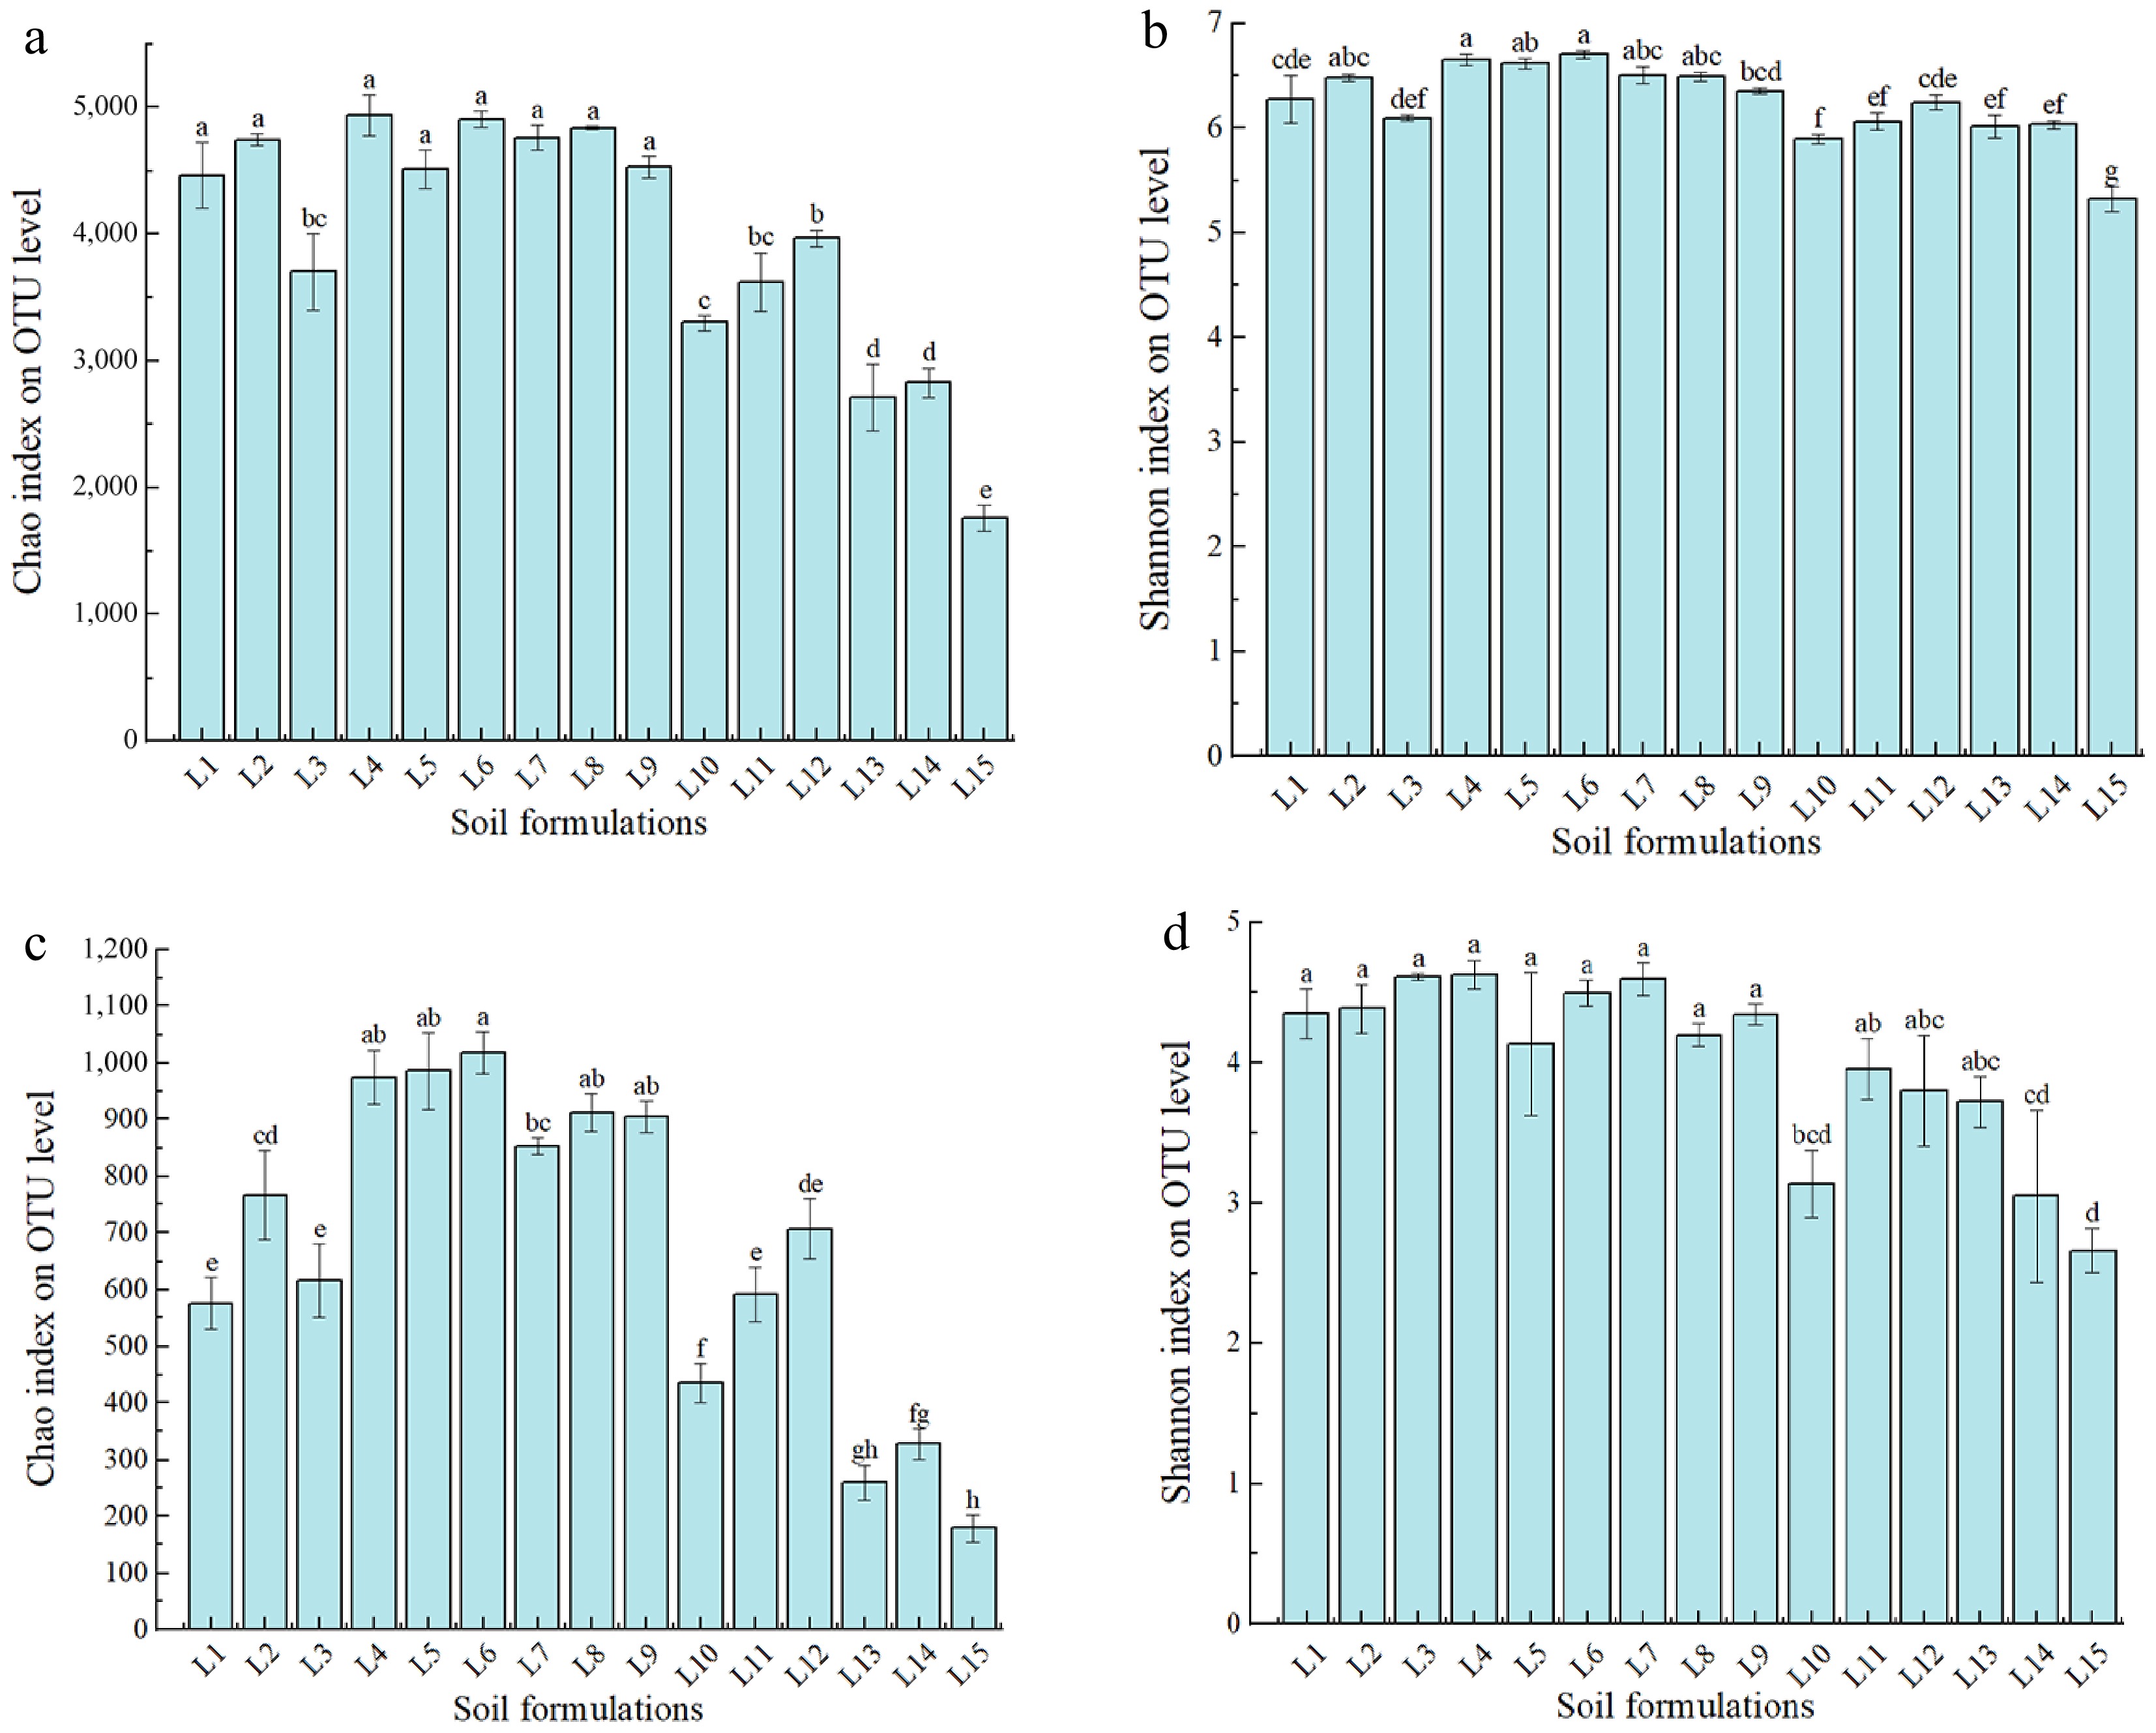
Figure 5.
Estimates of alpha diversity of the bacterial and fungal communities at the level of operational taxonomic units (OTUs) in different waste-mixed soils. (a) Chao index of bacteria. (b) Shannon index of bacteria. (c) Chao index of fungi. (d) Shannon index of fungi.
-
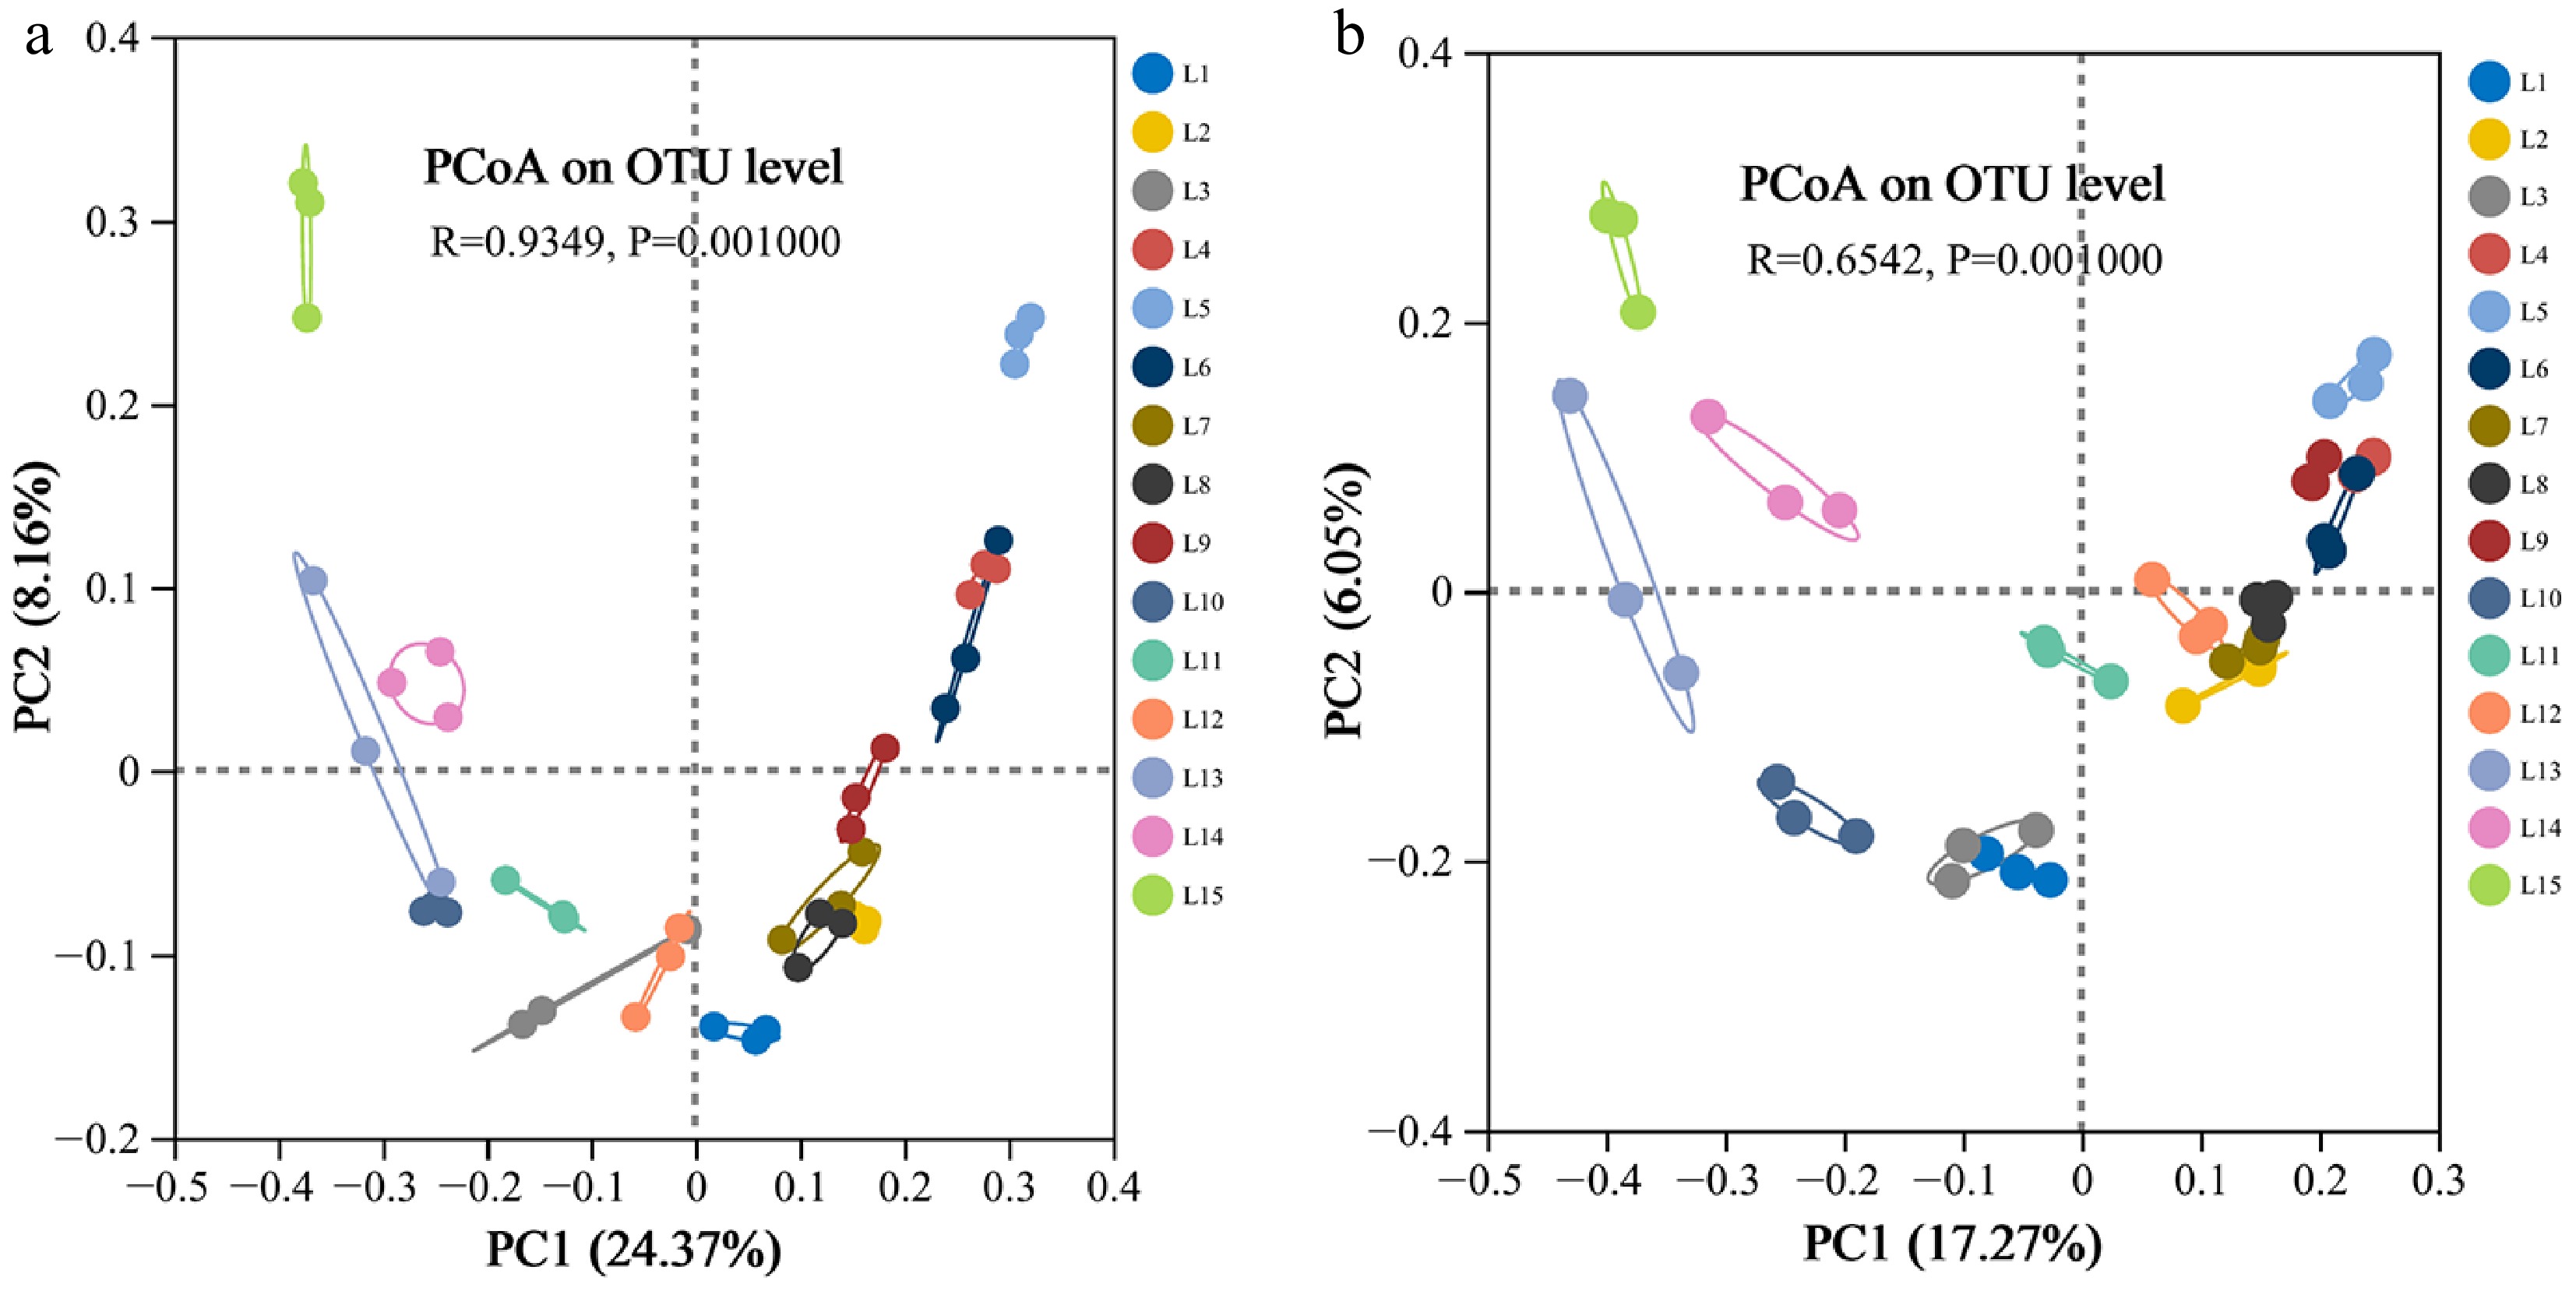
Figure 6.
Principal coordinates analysis (PCoA) of different treatments based on (a) bacterial, and (b) fungal operational taxonomic units (OTUs) abundance based on the Bray-Curtis heterogeneity.
-
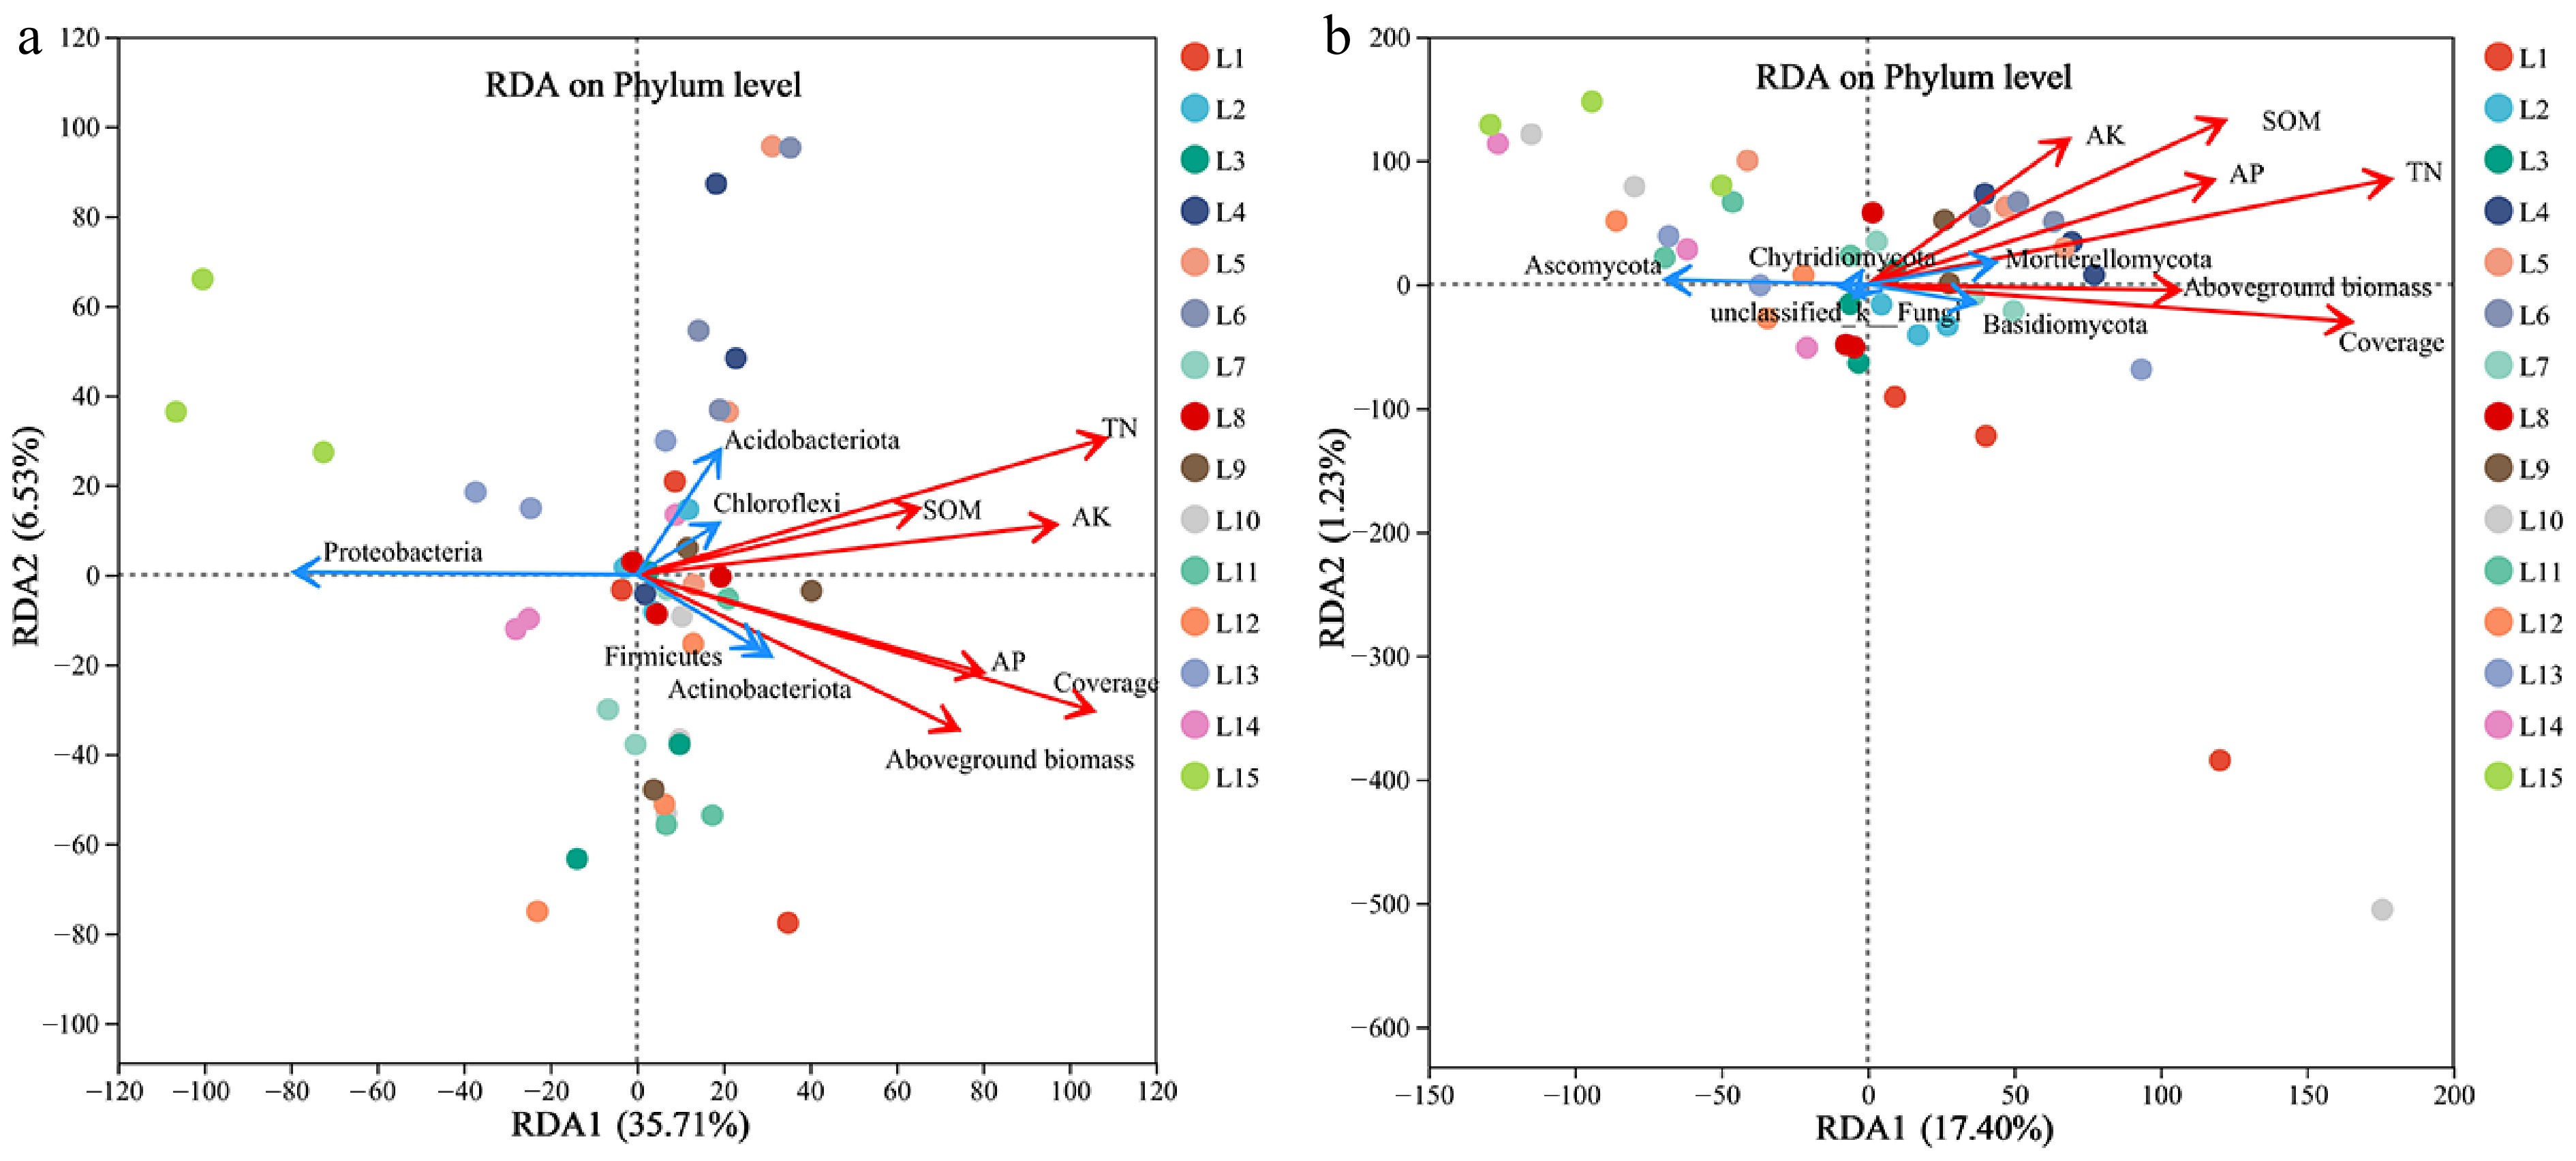
Figure 7.
Redundancy analysis of the relative abundance of soil bacterial (a) and fungal (b) phyla (top five), soil nutrients and plant growth indices under different treatments.
-
Serial number Soil ratios Waste slag
soil (%)Subgrade
soil (%)Guest soil +
Reclamation soil (%)L1 0 0 100 L2 25 75 L3 50 50 L4 75 25 L5 100 0 L6 25 0 75 L7 25 50 L8 50 25 L9 75 0 L10 50 0 50 L11 25 25 L12 50 0 L13 75 0 25 L14 25 0 L15 100 0 0 Table 1.
Soil formulations and mixture proportions used in the 15 treatments (L1–L15) evaluated in this study.
-
Soil type Soil bulk weight (g·cm−3) Soil moisture content (%) Soil organic matter content (g·kg−1) Waste slag soil 1.54 ± 0.02 5.61 ± 0.42 15.18 ± 0.23 Subgrade soil 1.30 ± 0.03 16.35 ± 1.06 18.69 ± 0.12 Reclamation 1.41 ± 0.04 9.83 ± 1.27 13.44 ± 0.61 Guest soil 1.31 ± 0.03 17.82 ± 0.45 11.36 ± 0.73 Table 2.
Partial physical and chemical properties of the four soils.
Figures
(7)
Tables
(2)