-
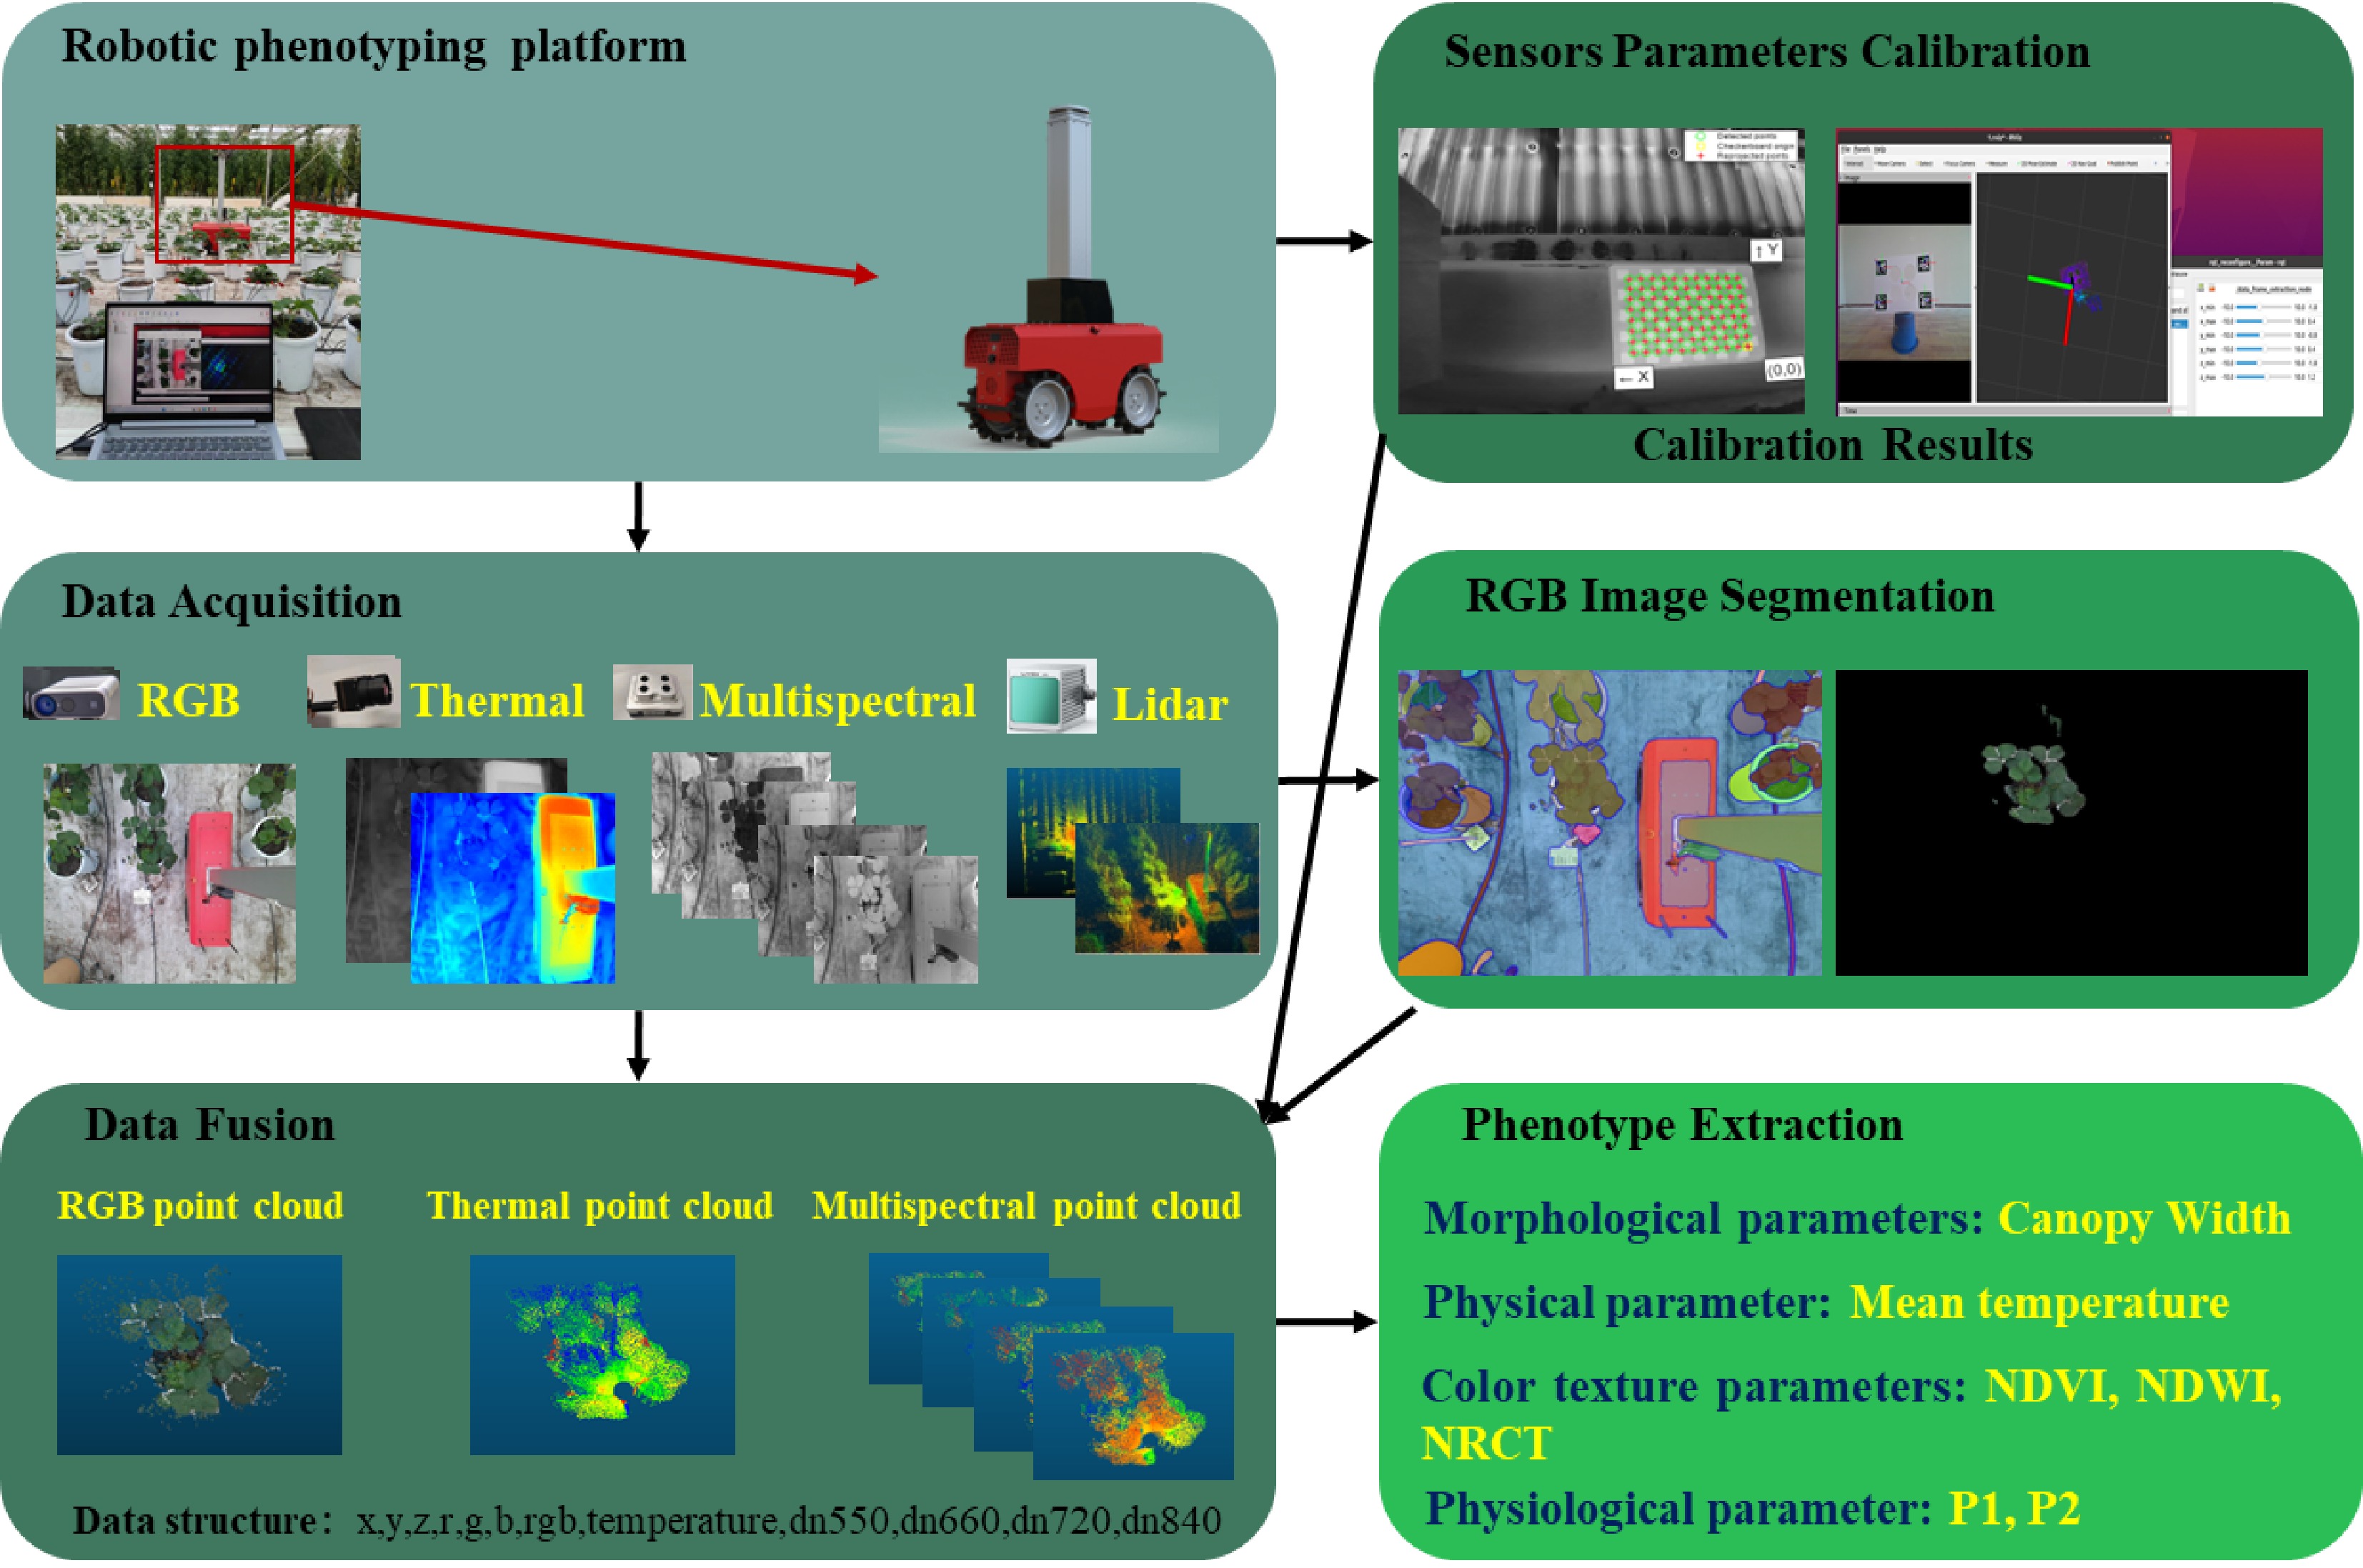
Figure 1.
Flow from data acquisition to data processing.
-
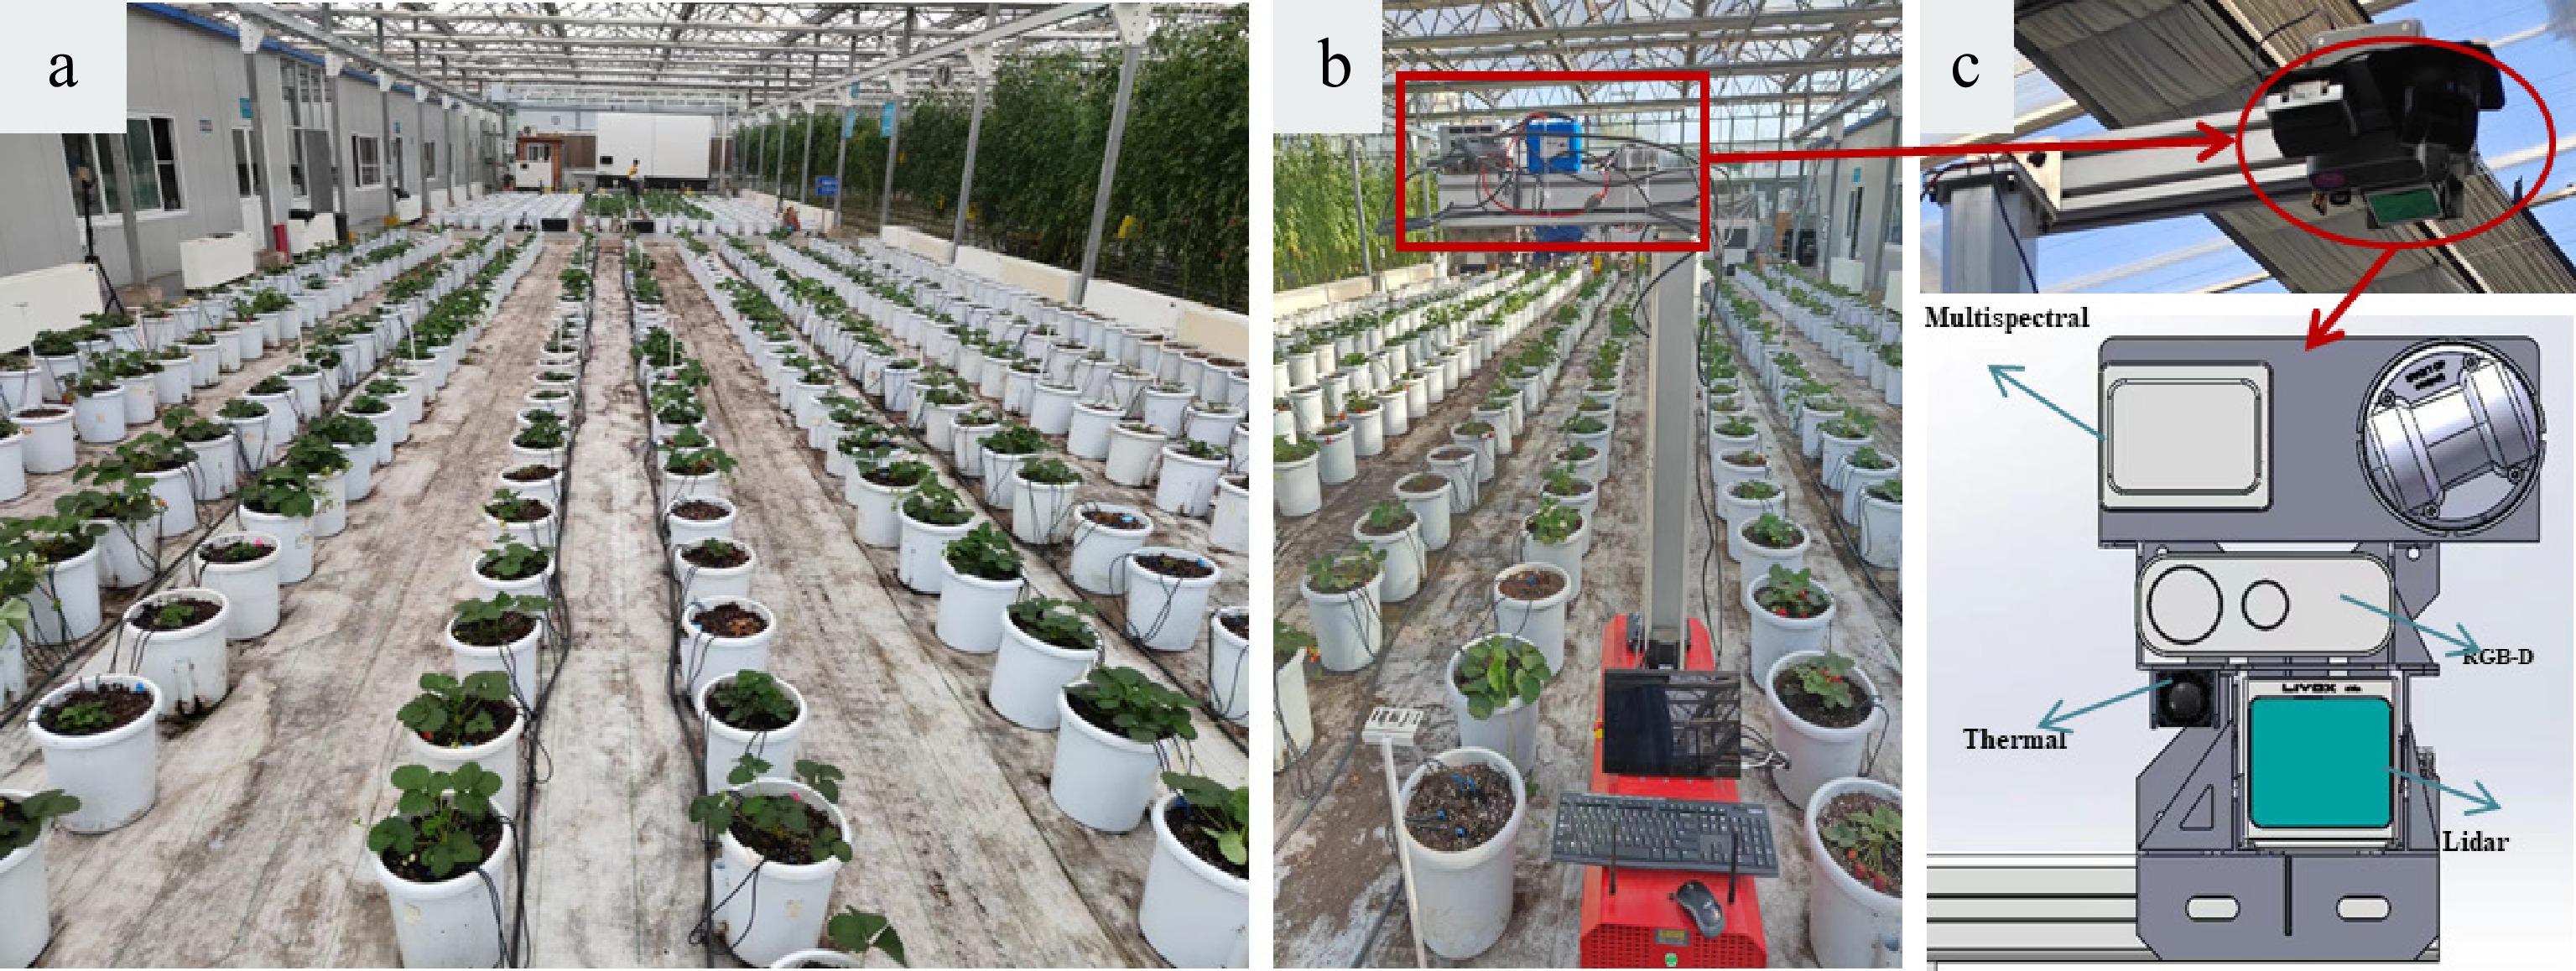
Figure 2.
(a) Strawberry planting distribution map; (b) Our platform; (c) Multi-source sensor layout.
-
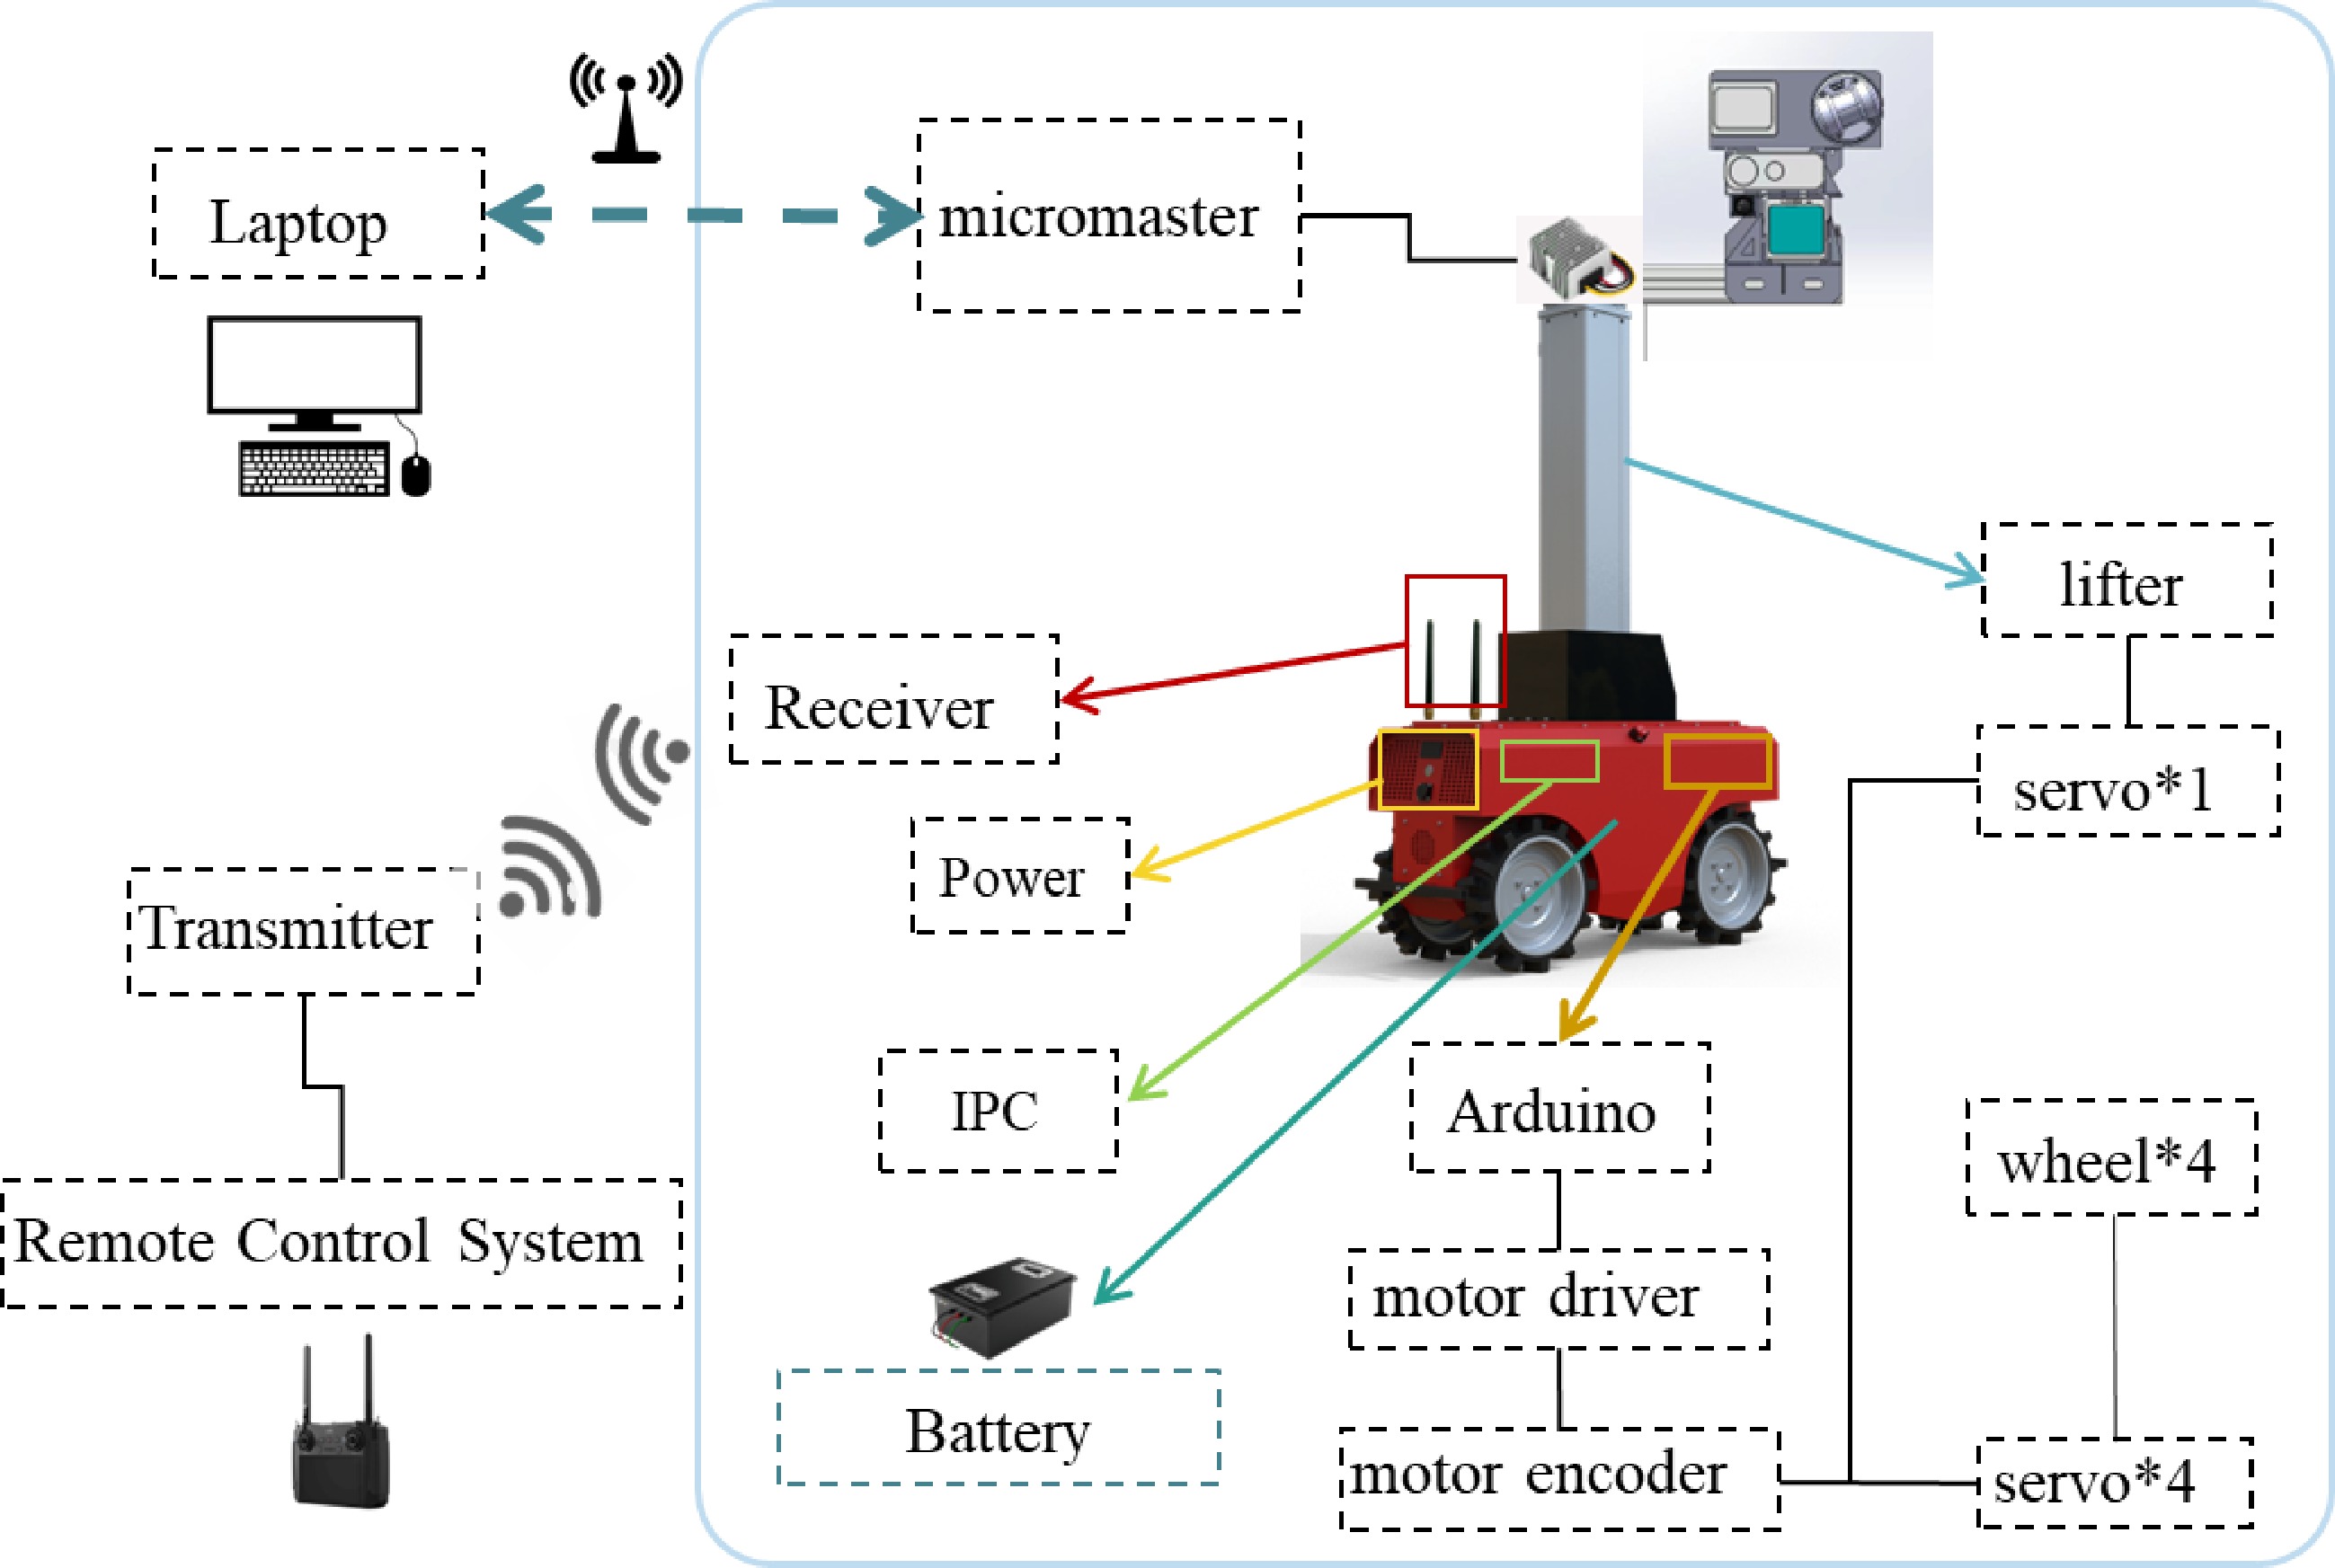
Figure 3.
Control system.
-
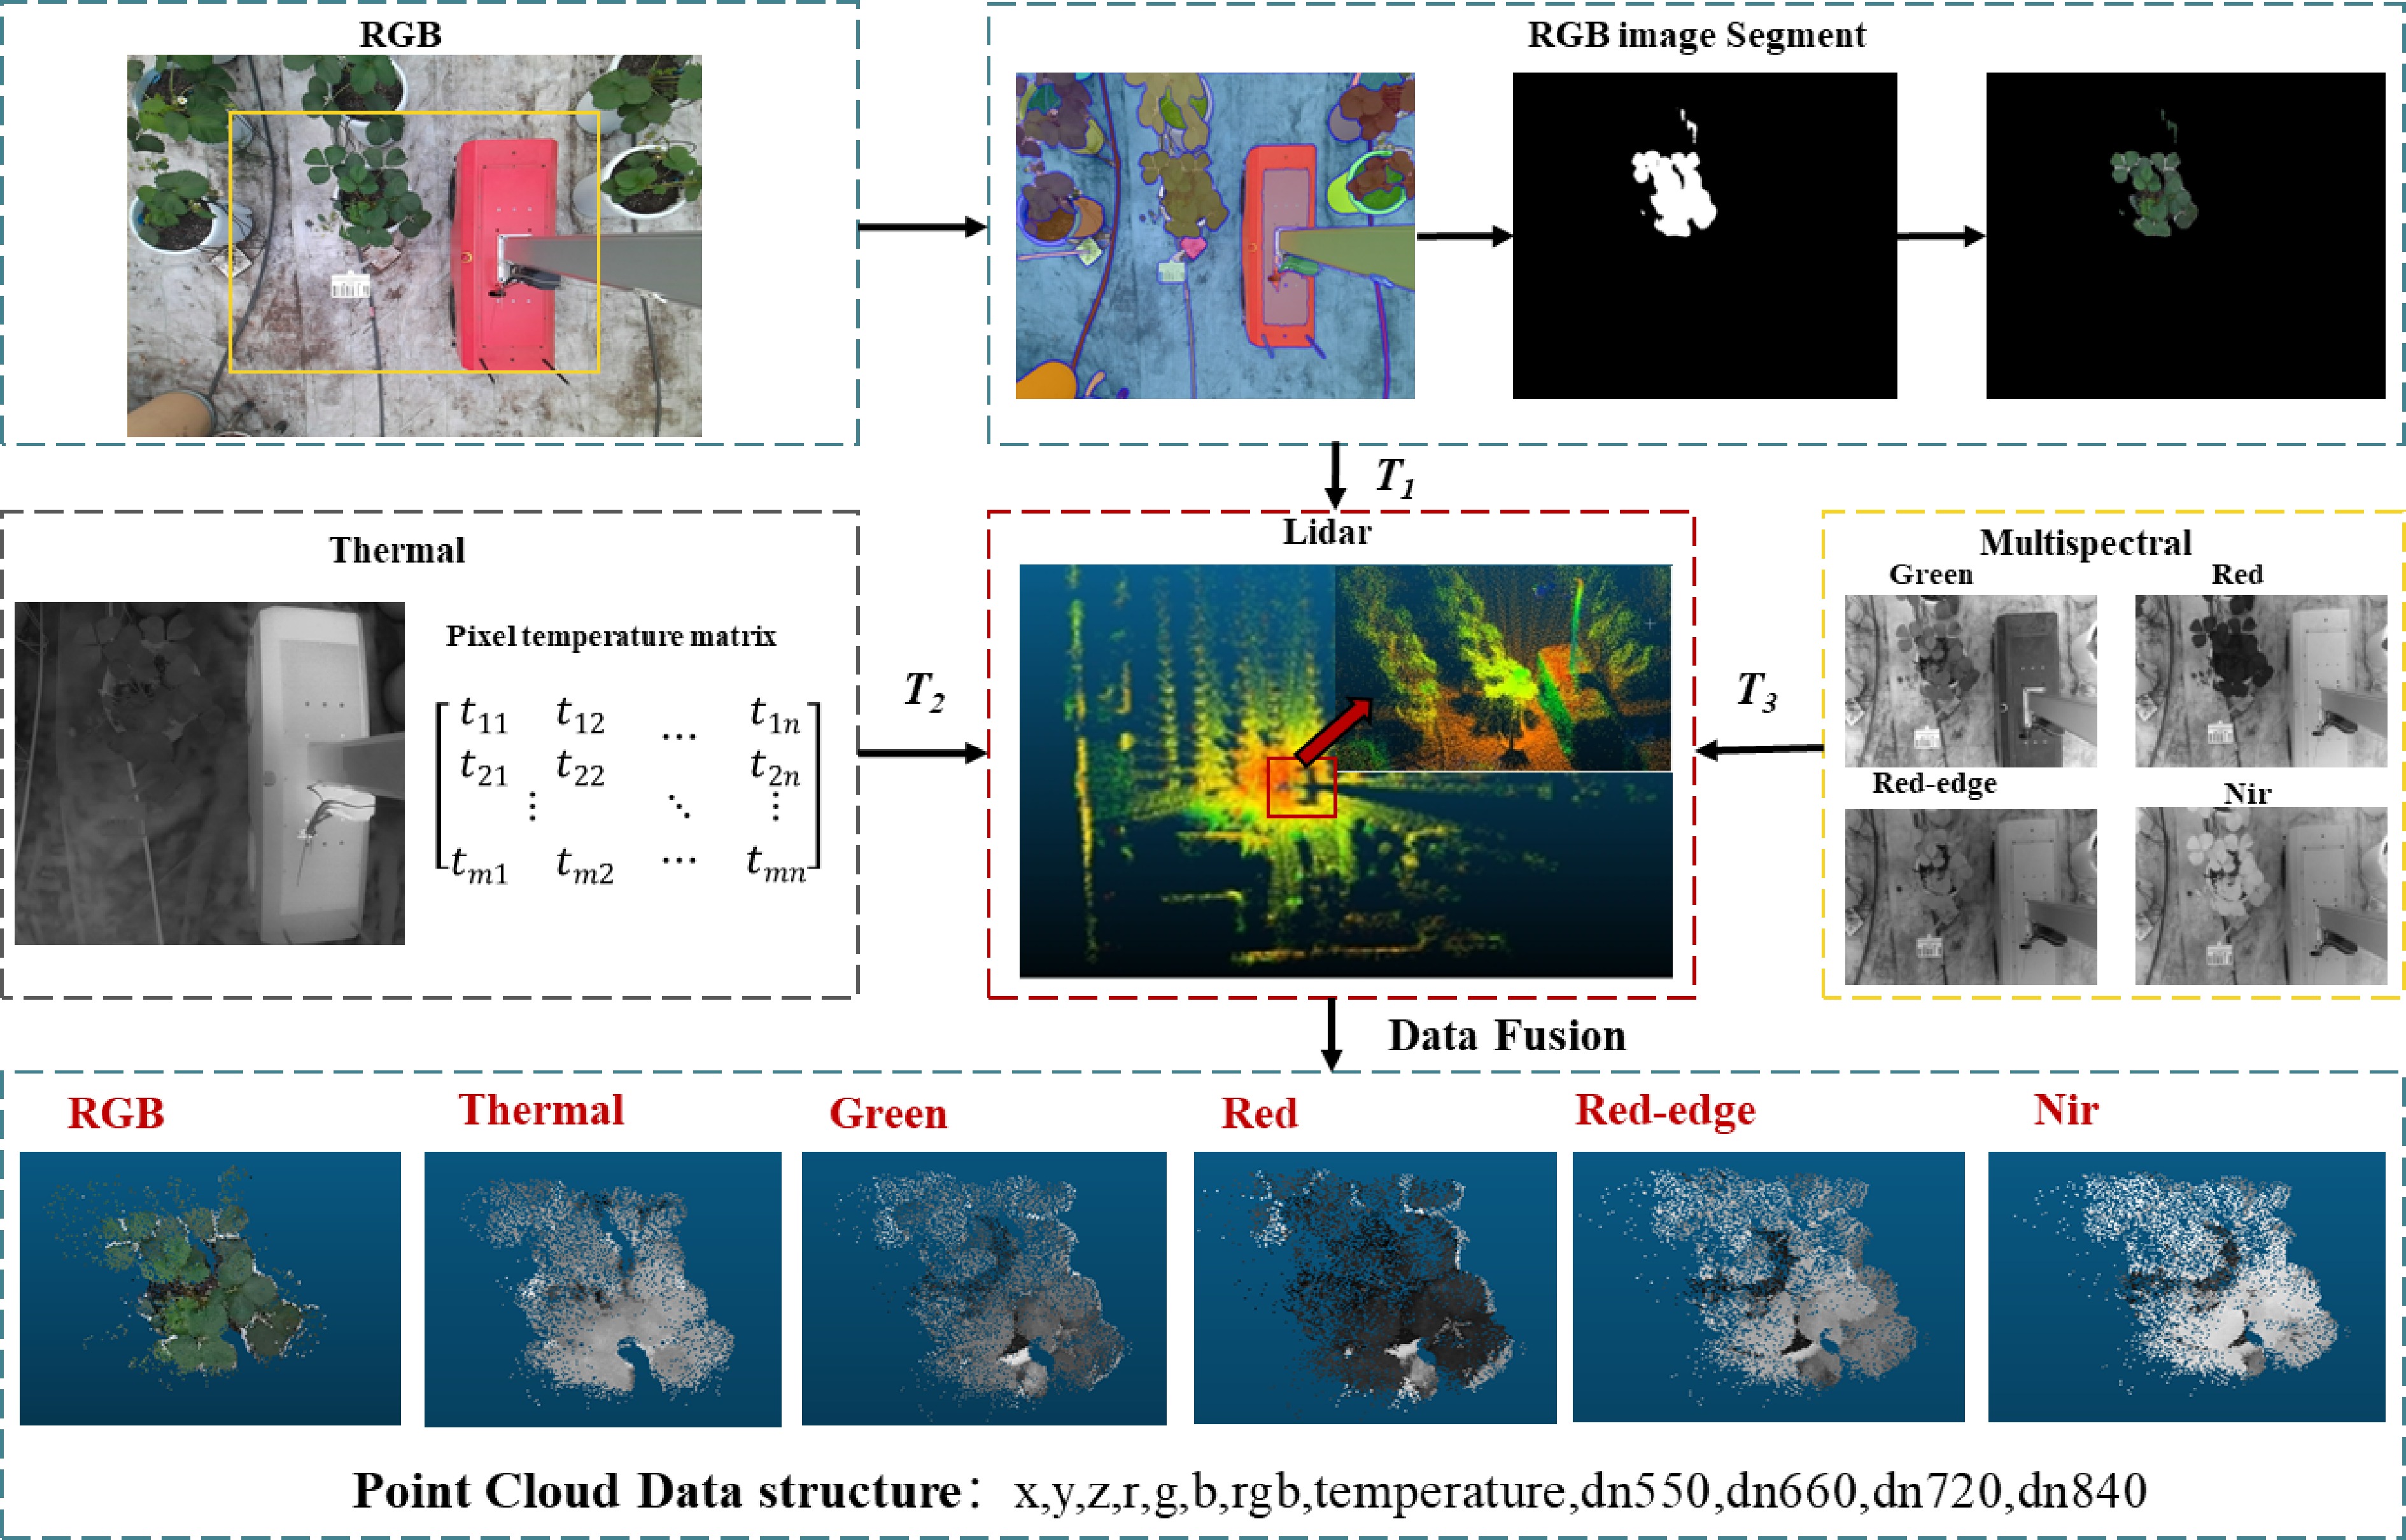
Figure 4.
The synchronized data fusion process involves the pixel matrices m and n of the thermal infrared image, which represent the image width and height. Transformation matrices T1, T2, and T3 correspond to the transformations from the RGB camera, thermal infrared camera, and multispectral camera, respectively, to the LiDAR coordinate system.
-
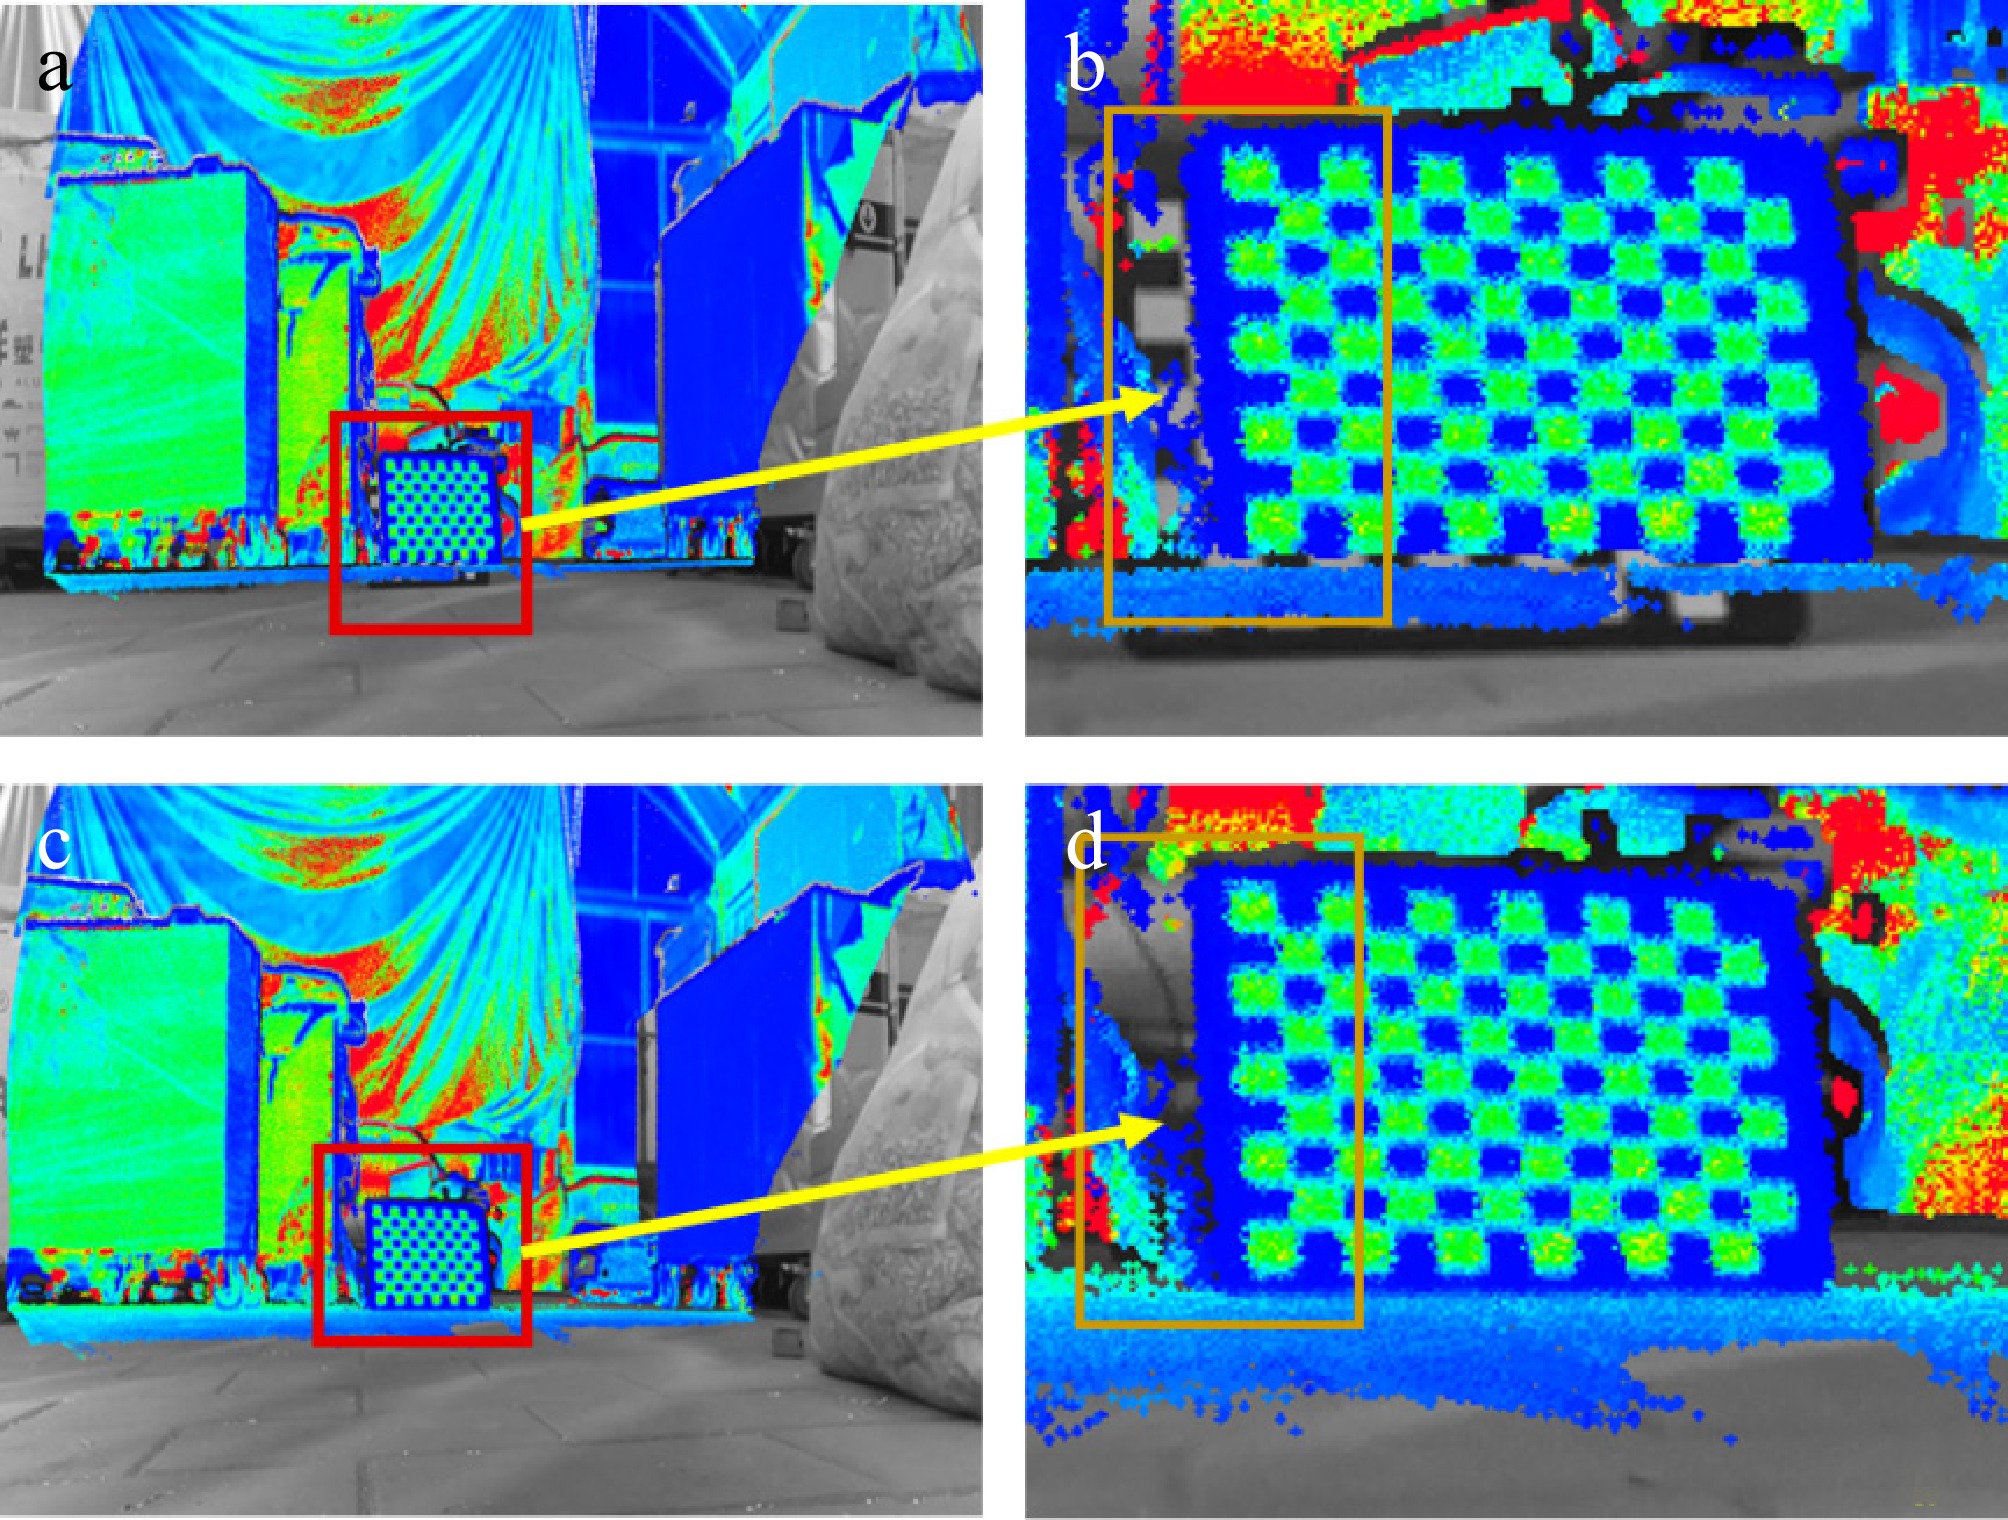
Figure 5.
Schematic diagram of the fine-tuned external parameter: (a) before adjustment; (b) after adjustment; (c) local zoom in before adjustment; (d) local zoom in after adjustment.
-
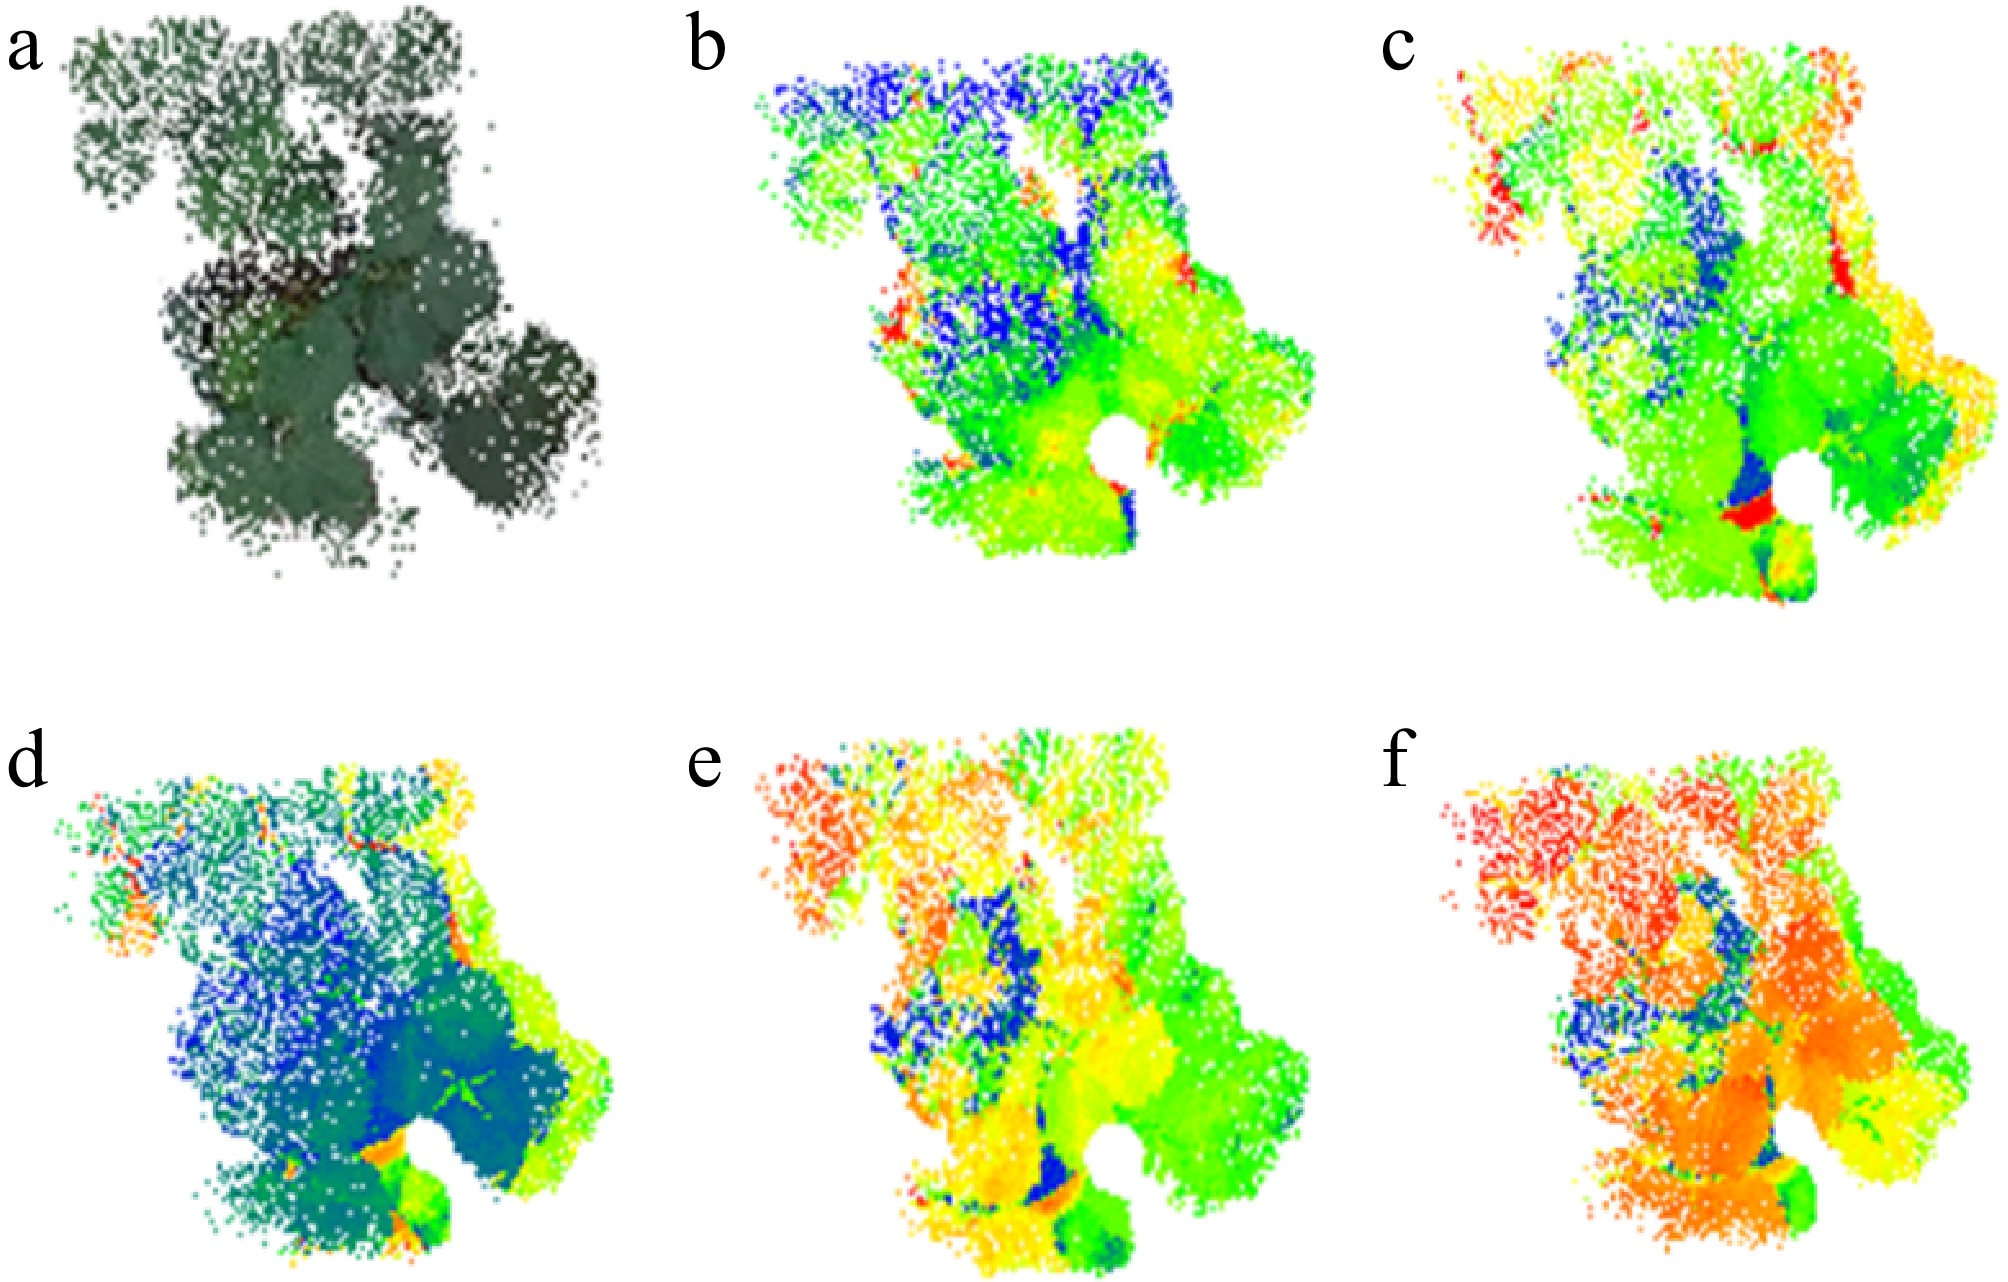
Figure 6.
Acquisition of plant ROI by RGB image segmentation after fusion of individual component point clouds: (a) RGB; (b) thermal; (c) green light band; (d) red light band; (e) red edge band; (f) NIR band.
-
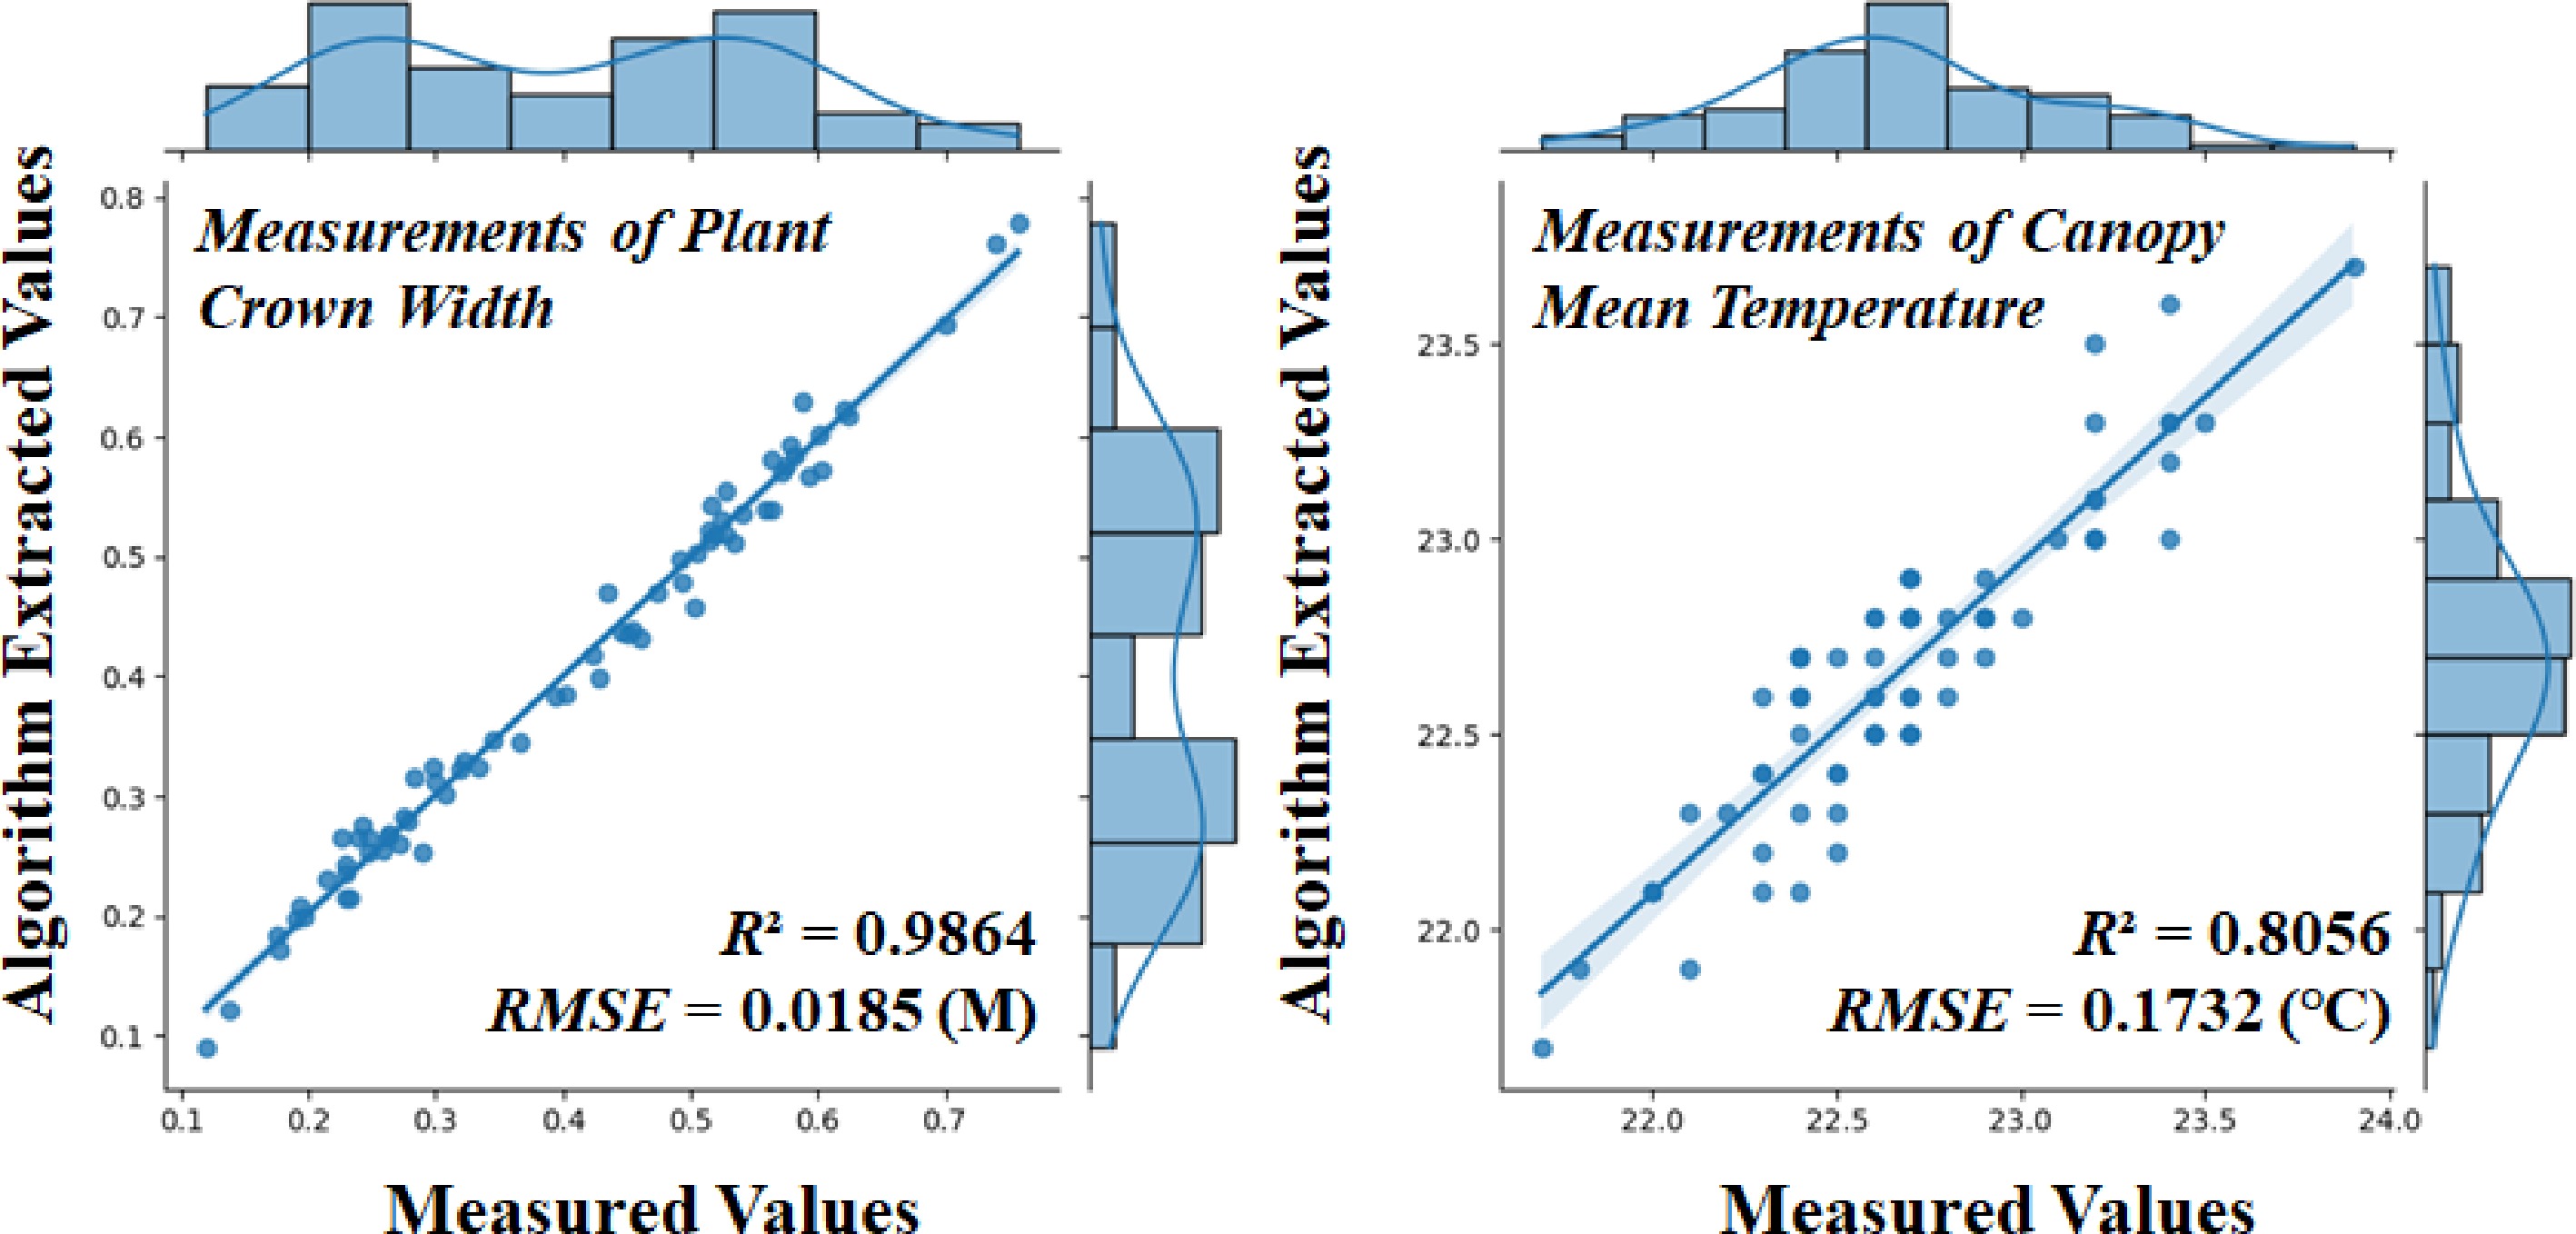
Figure 7.
Linear fit of the algorithm to the manually measured values of canopy width, and mean temperature for 72 strawberry plants.
-
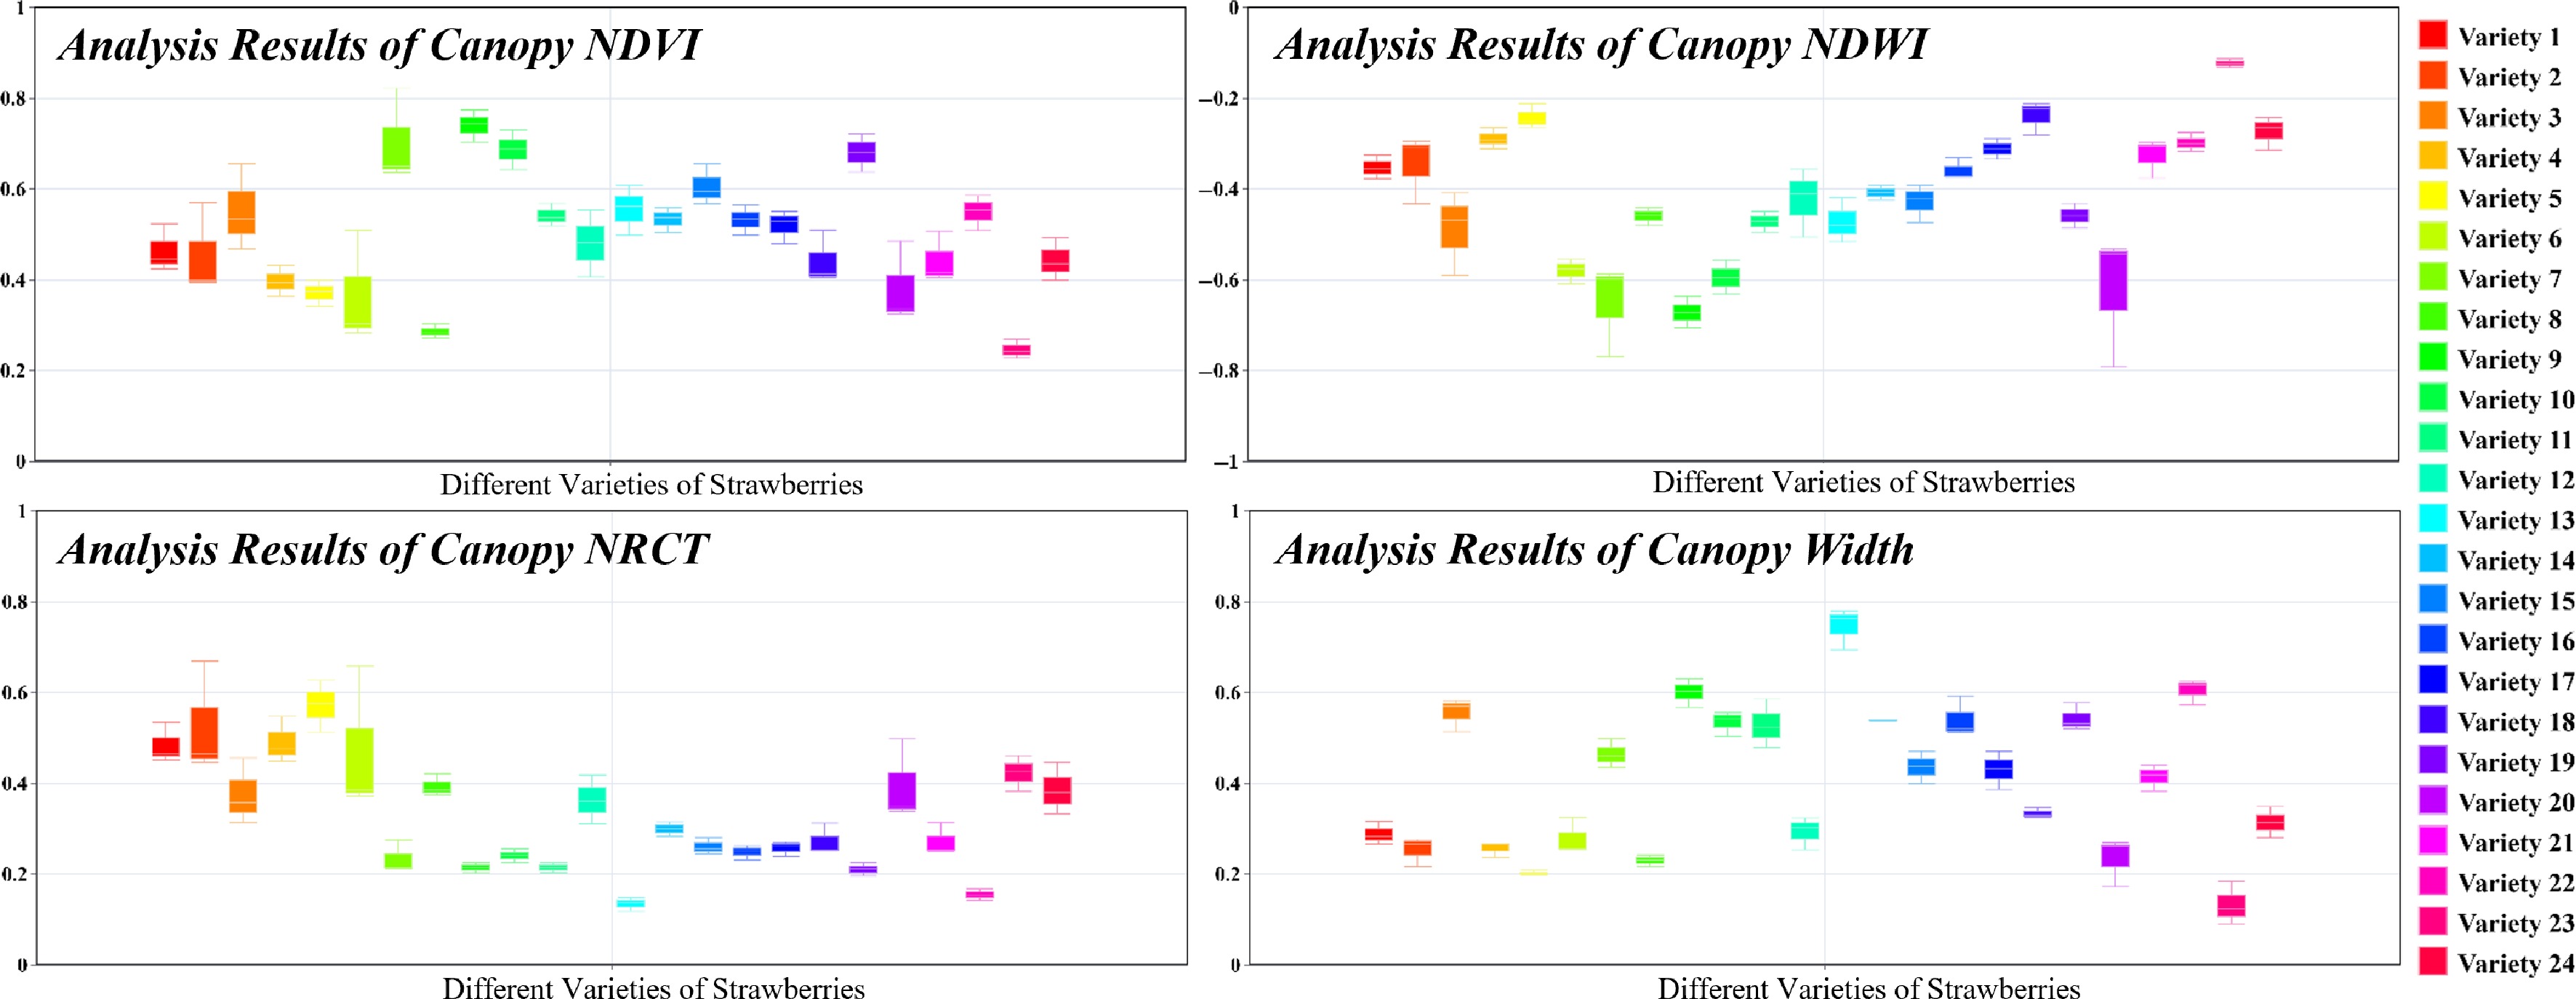
Figure 8.
Variability of NDVI, NDWI, NRCT, and width among varieties with consistency among the same varieties.
-
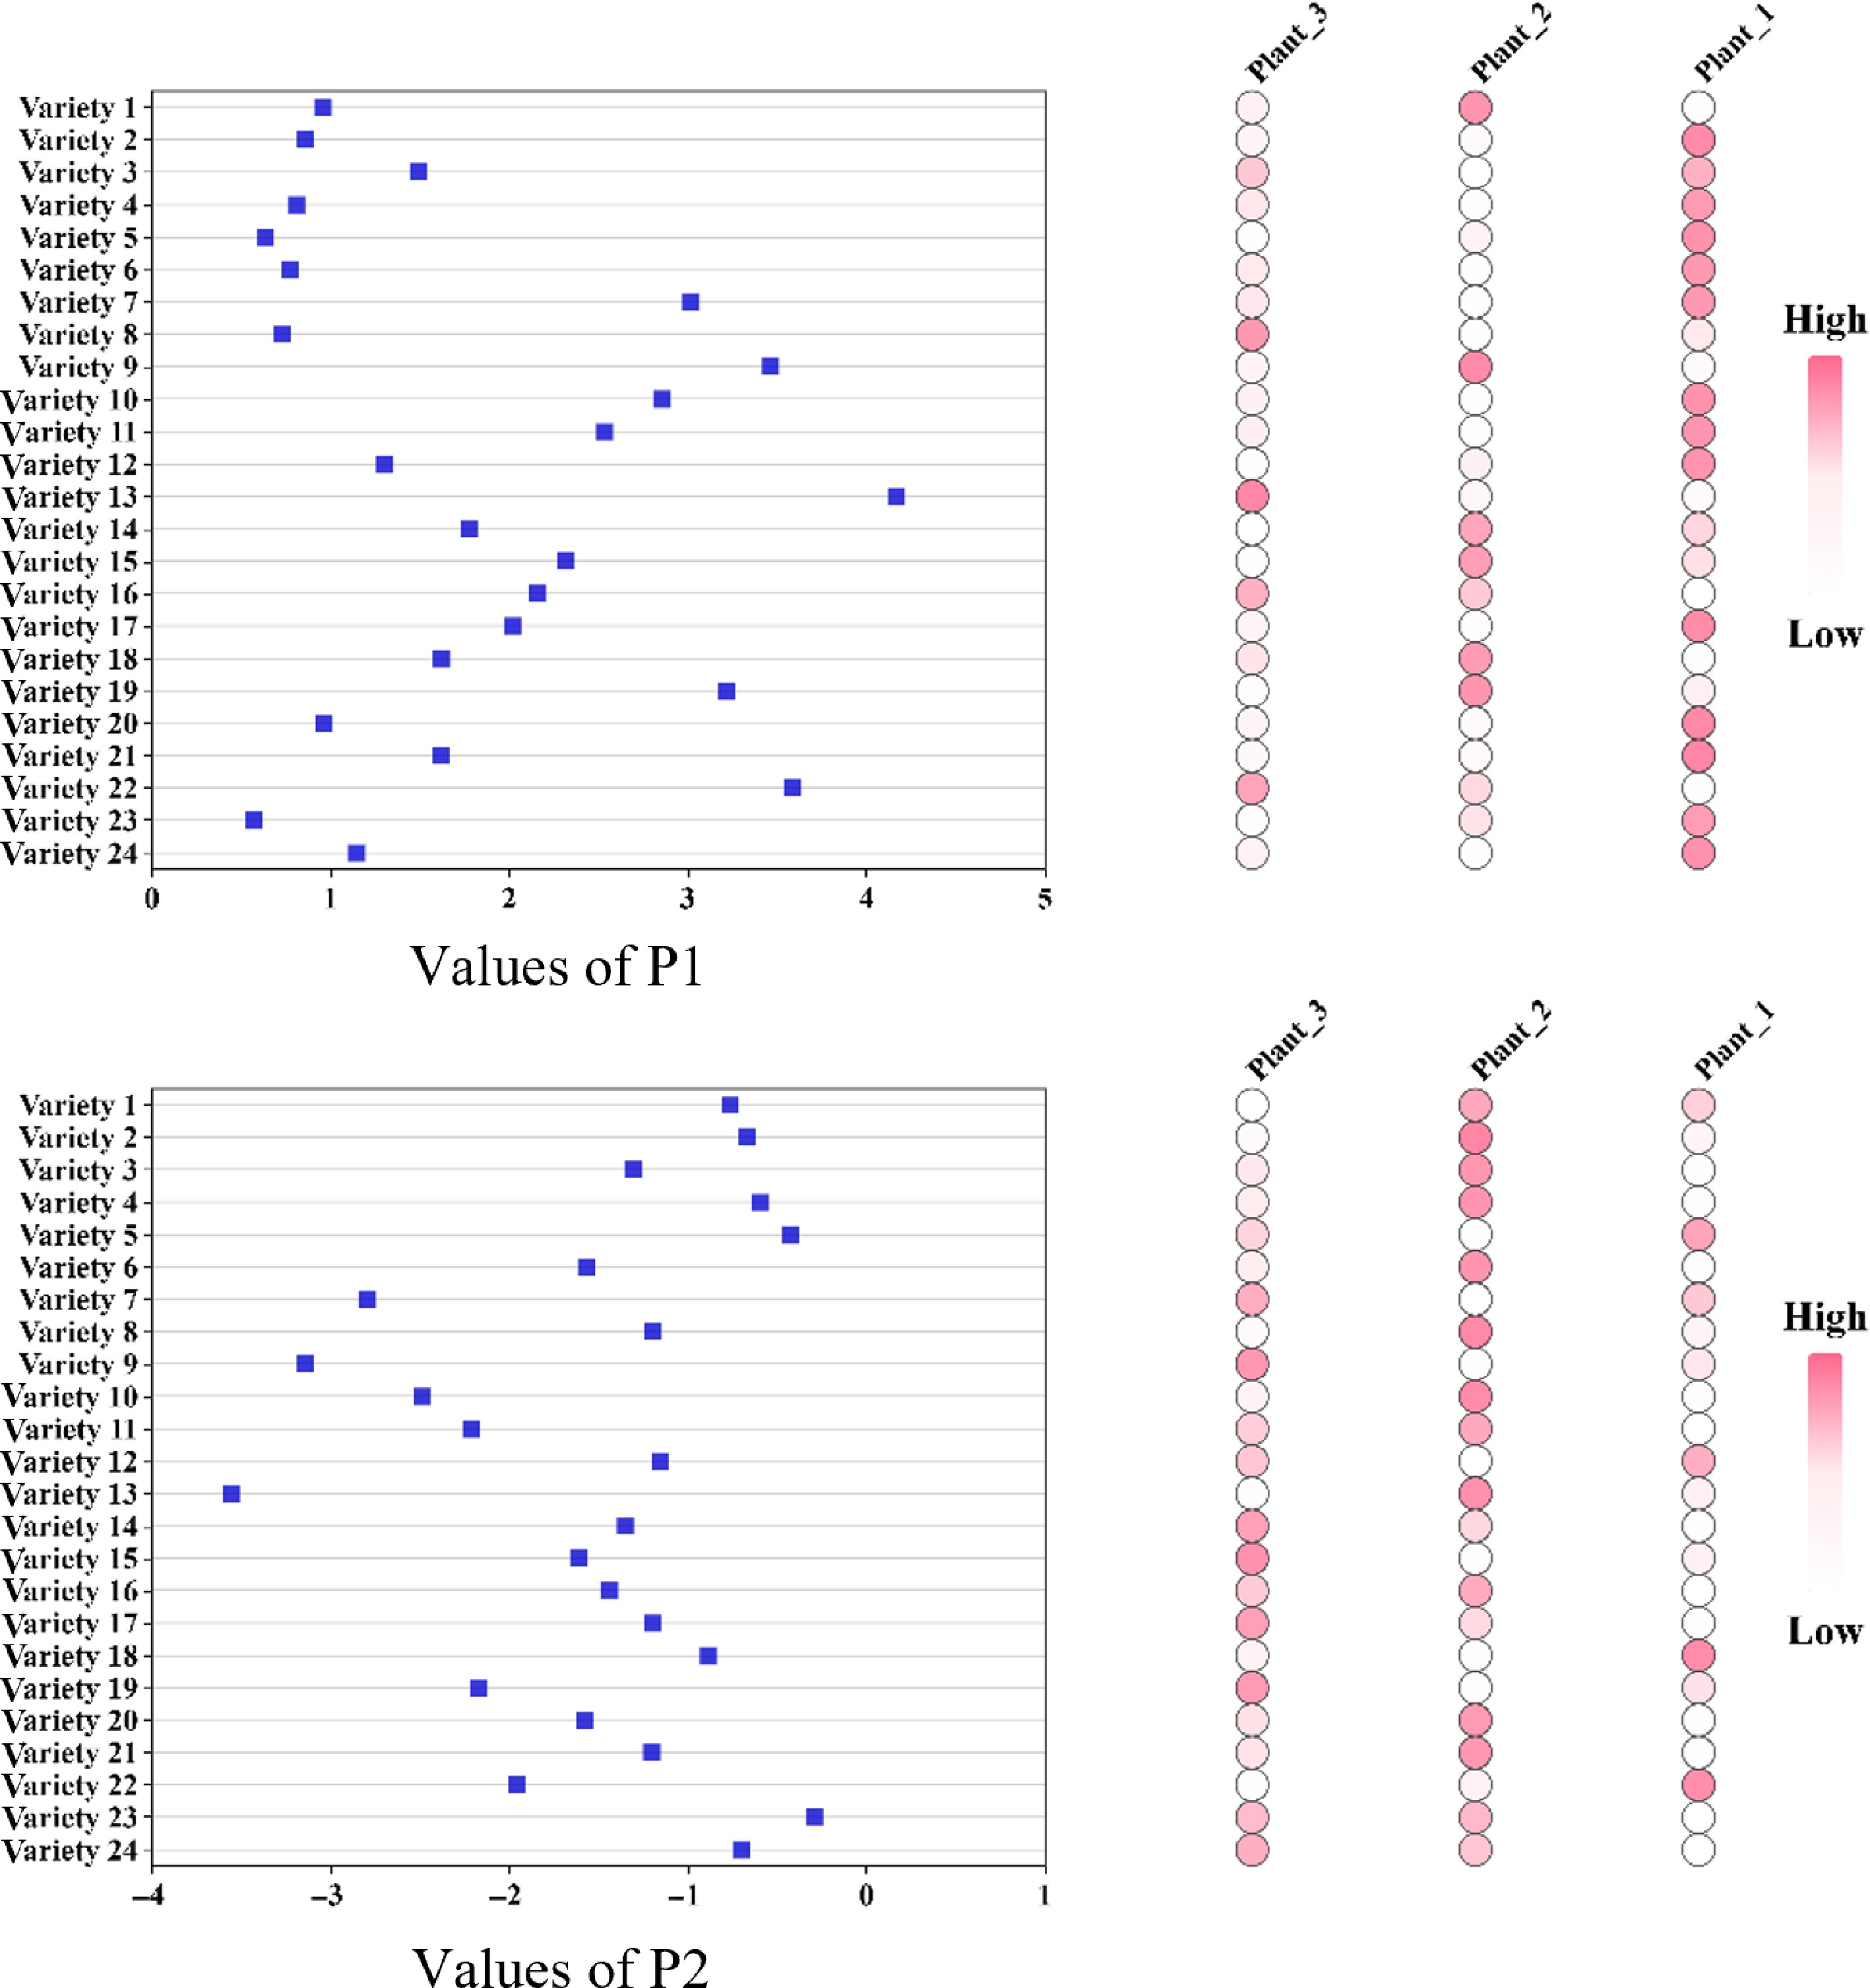
Figure 9.
Differences in P1 and P2 between varieties and consistency between the same varieties.
-
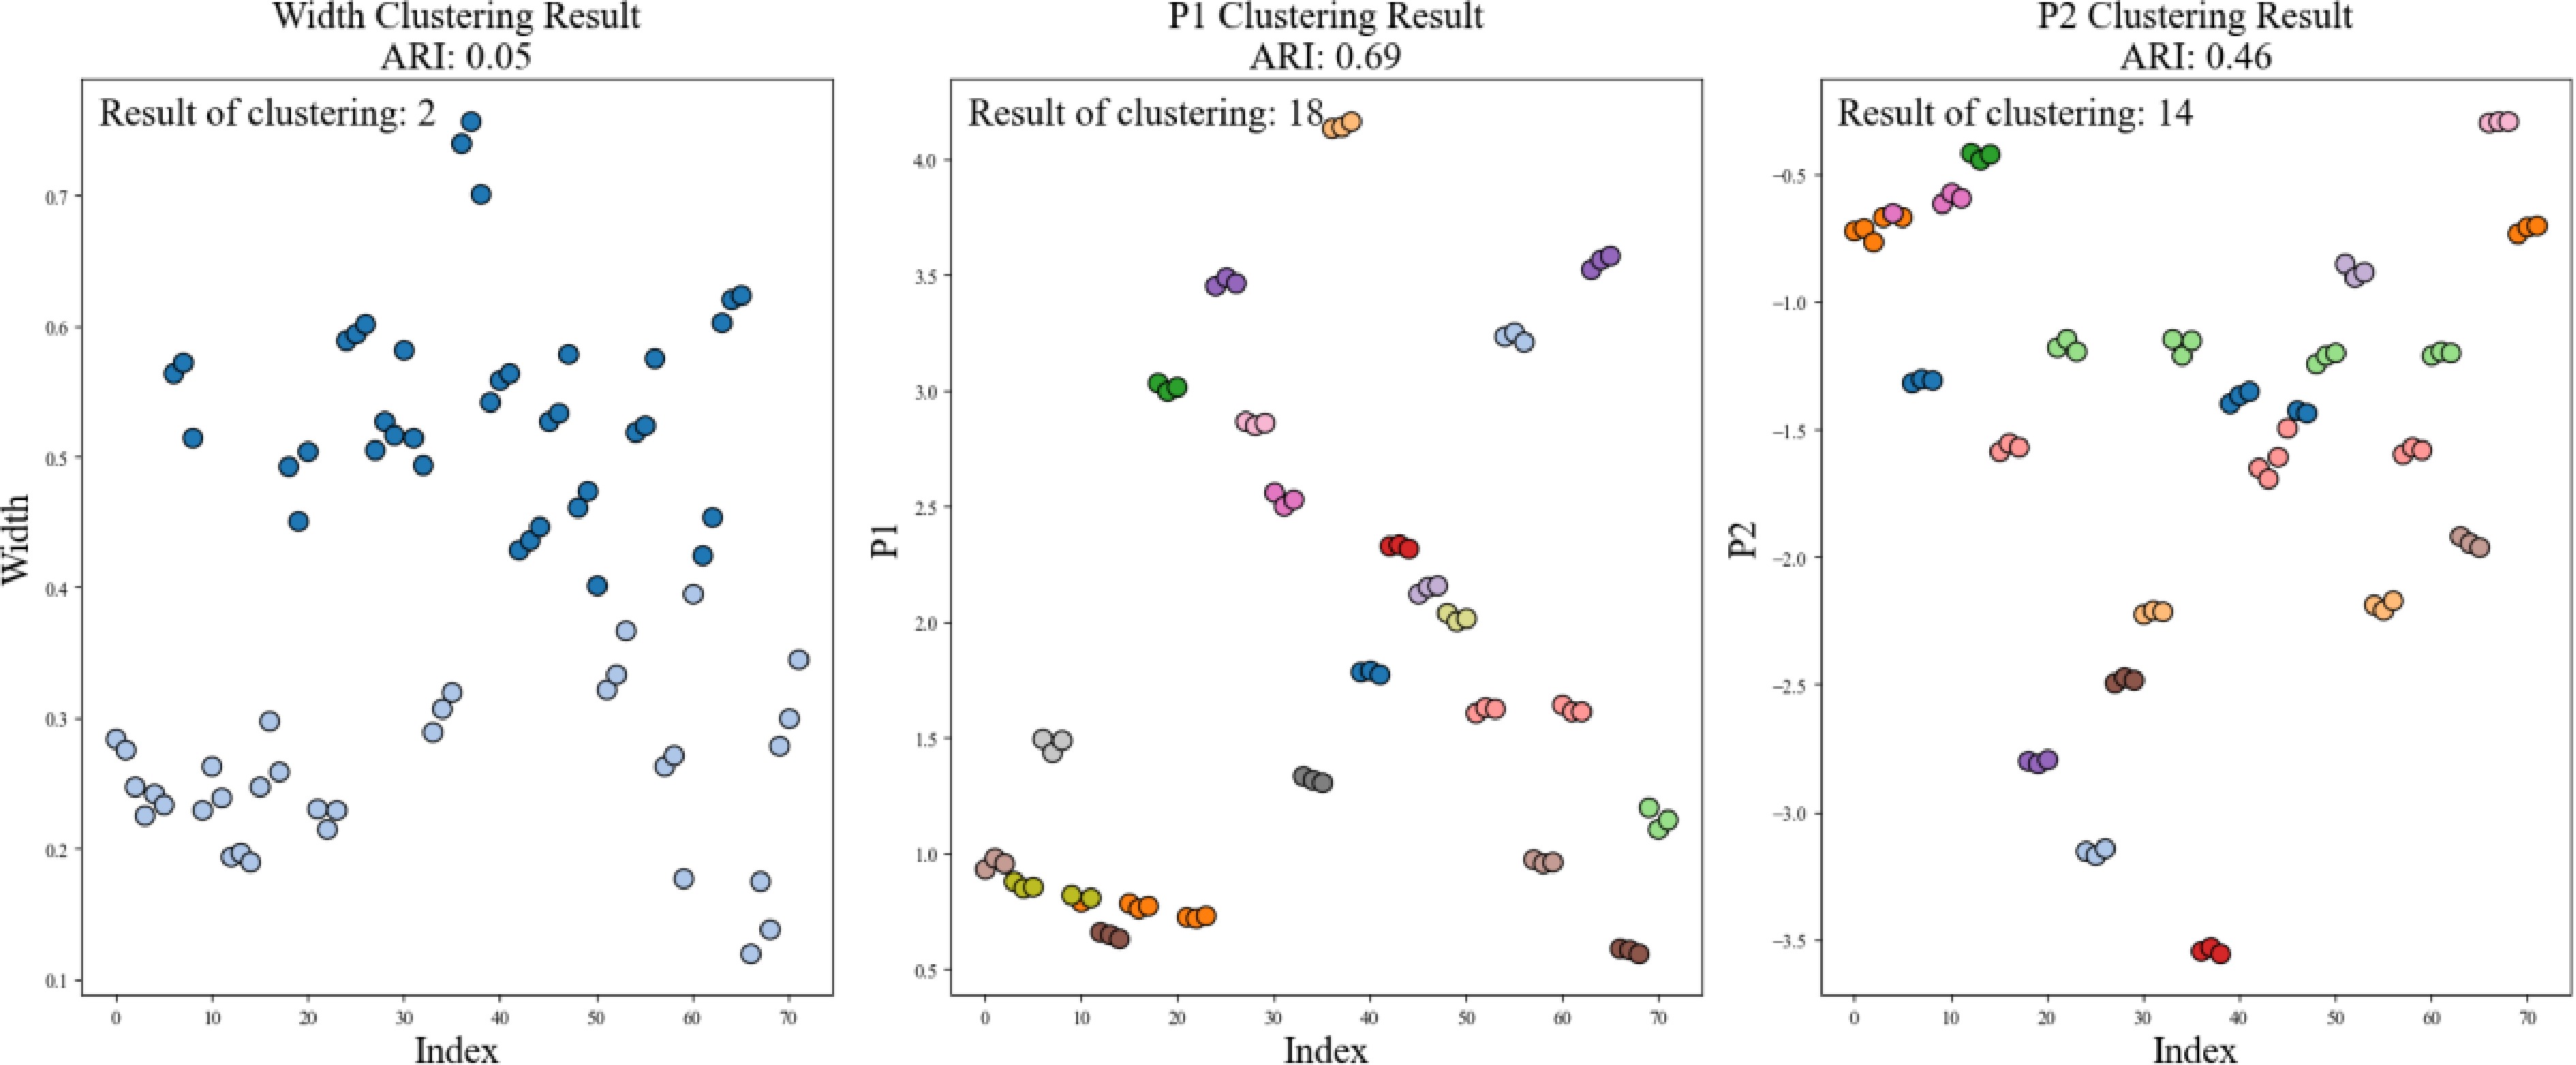
Figure 10.
Width, P1, and P2 were analyzed for individual clustering.
-
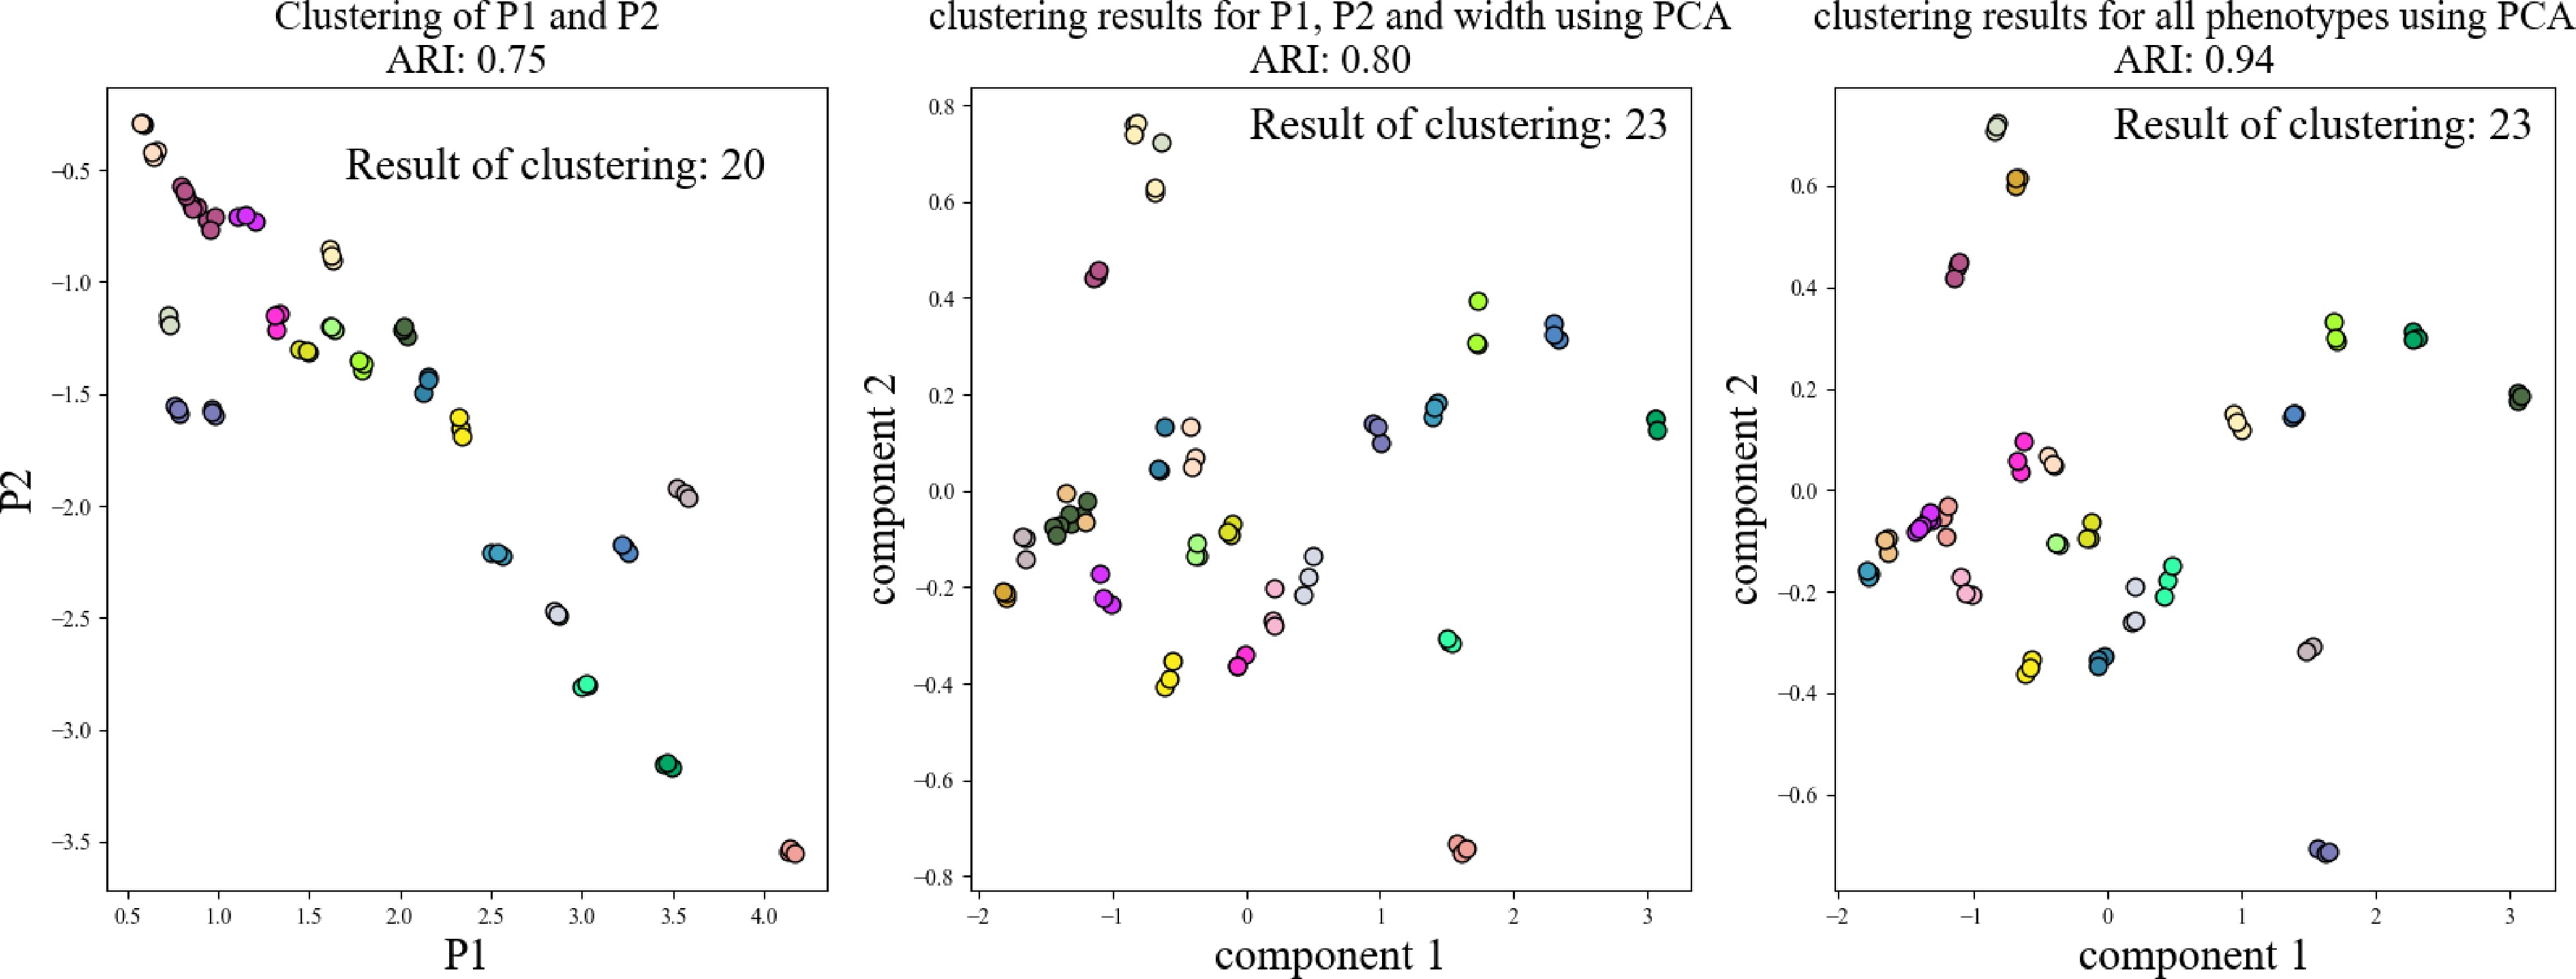
Figure 11.
Combination of NDVI, NDWI, NRCT, width, P1, and P2 followed by cluster analysis.
-
Parameters Description Size 1,006 mm × 340 mm × 521 mm Motor specification 200 W, servo motor Battery specification 48 V 35 AH Quantity 80 kg Running speed 0.5 m/s Maximum load of the lifting system 10 kg Height of the top from the ground 1.5~3.1 m Table 1.
Robotics platform related parameters.
-
Comparison term Ours UGV-Lidar[5] Efficiency of data acquisition 600 plants/h 810 plants/h Pipeline processing time 2,894 ms/plant 13,672 ms/plant Cost ( ${\$} $ 8,200 11,780 Efficiency of phenotyping High Low Data consistency High Low Data extension High Low Storage space usage Small Large Table 2.
Comparison of various performance aspects of the robotic phenotyping platform with the UGV-LiDAR.
Figures
(11)
Tables
(2)