-
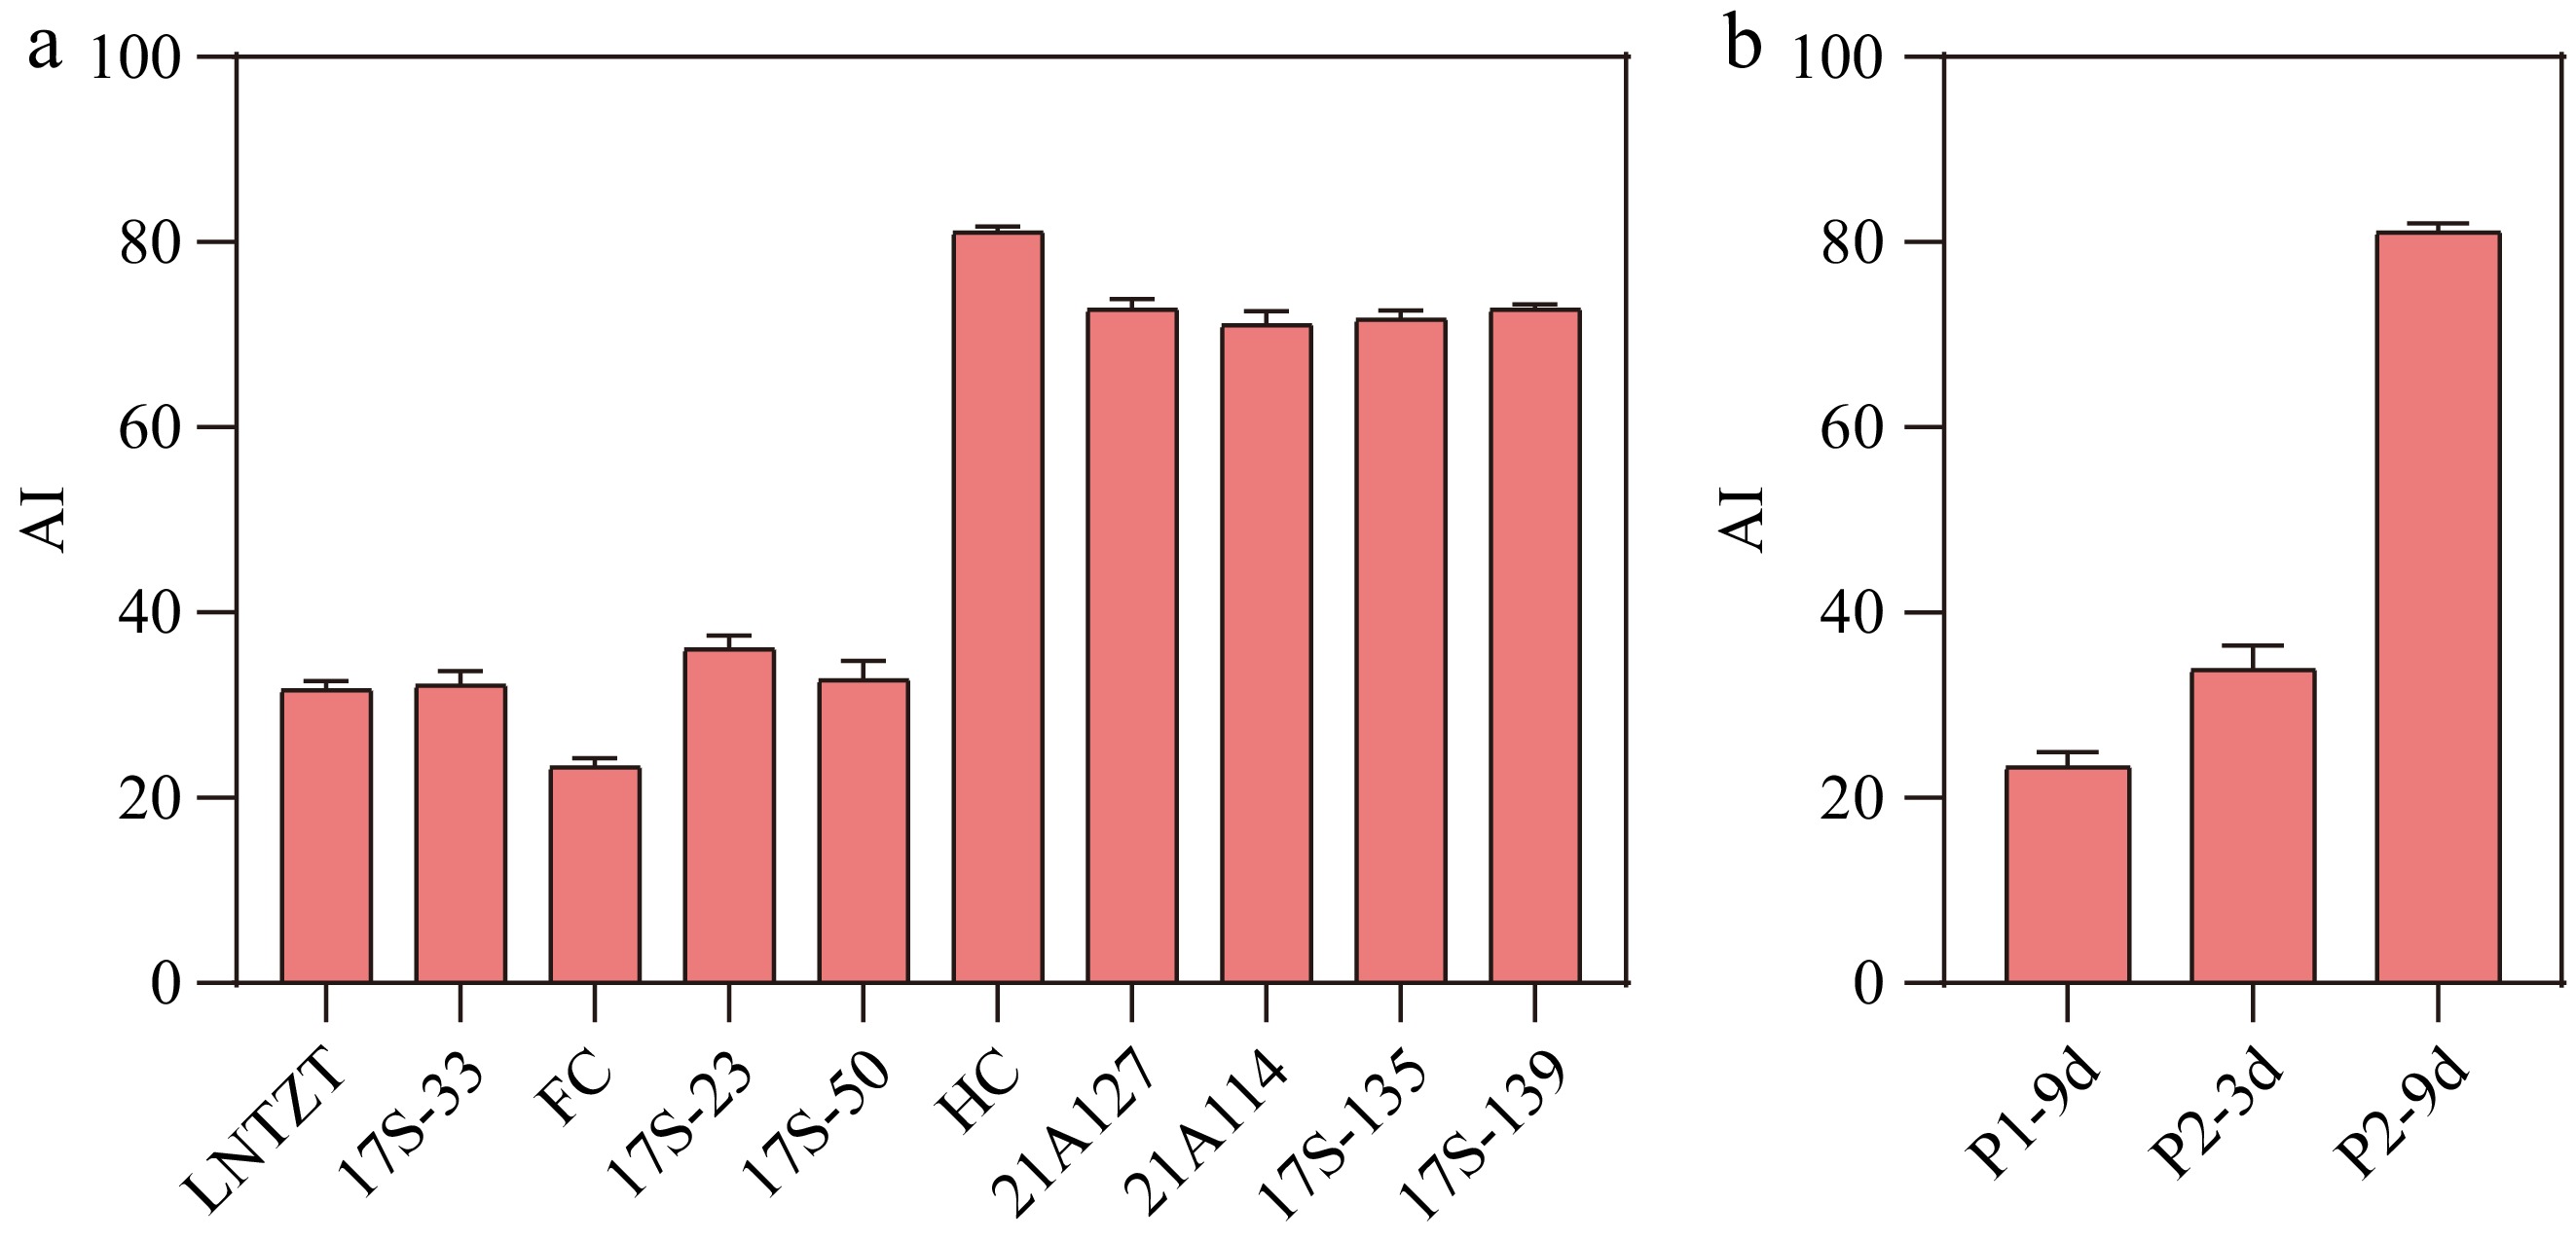
Figure 1.
(a) Evaluation of astringency levels for different cucumber fruits. (b) Evaluation of astringency levels for P1-9d, P2-3d, and P2-9d. AI: Astringency Index. Data are presented as the mean ± SD of three biological replicates.
-
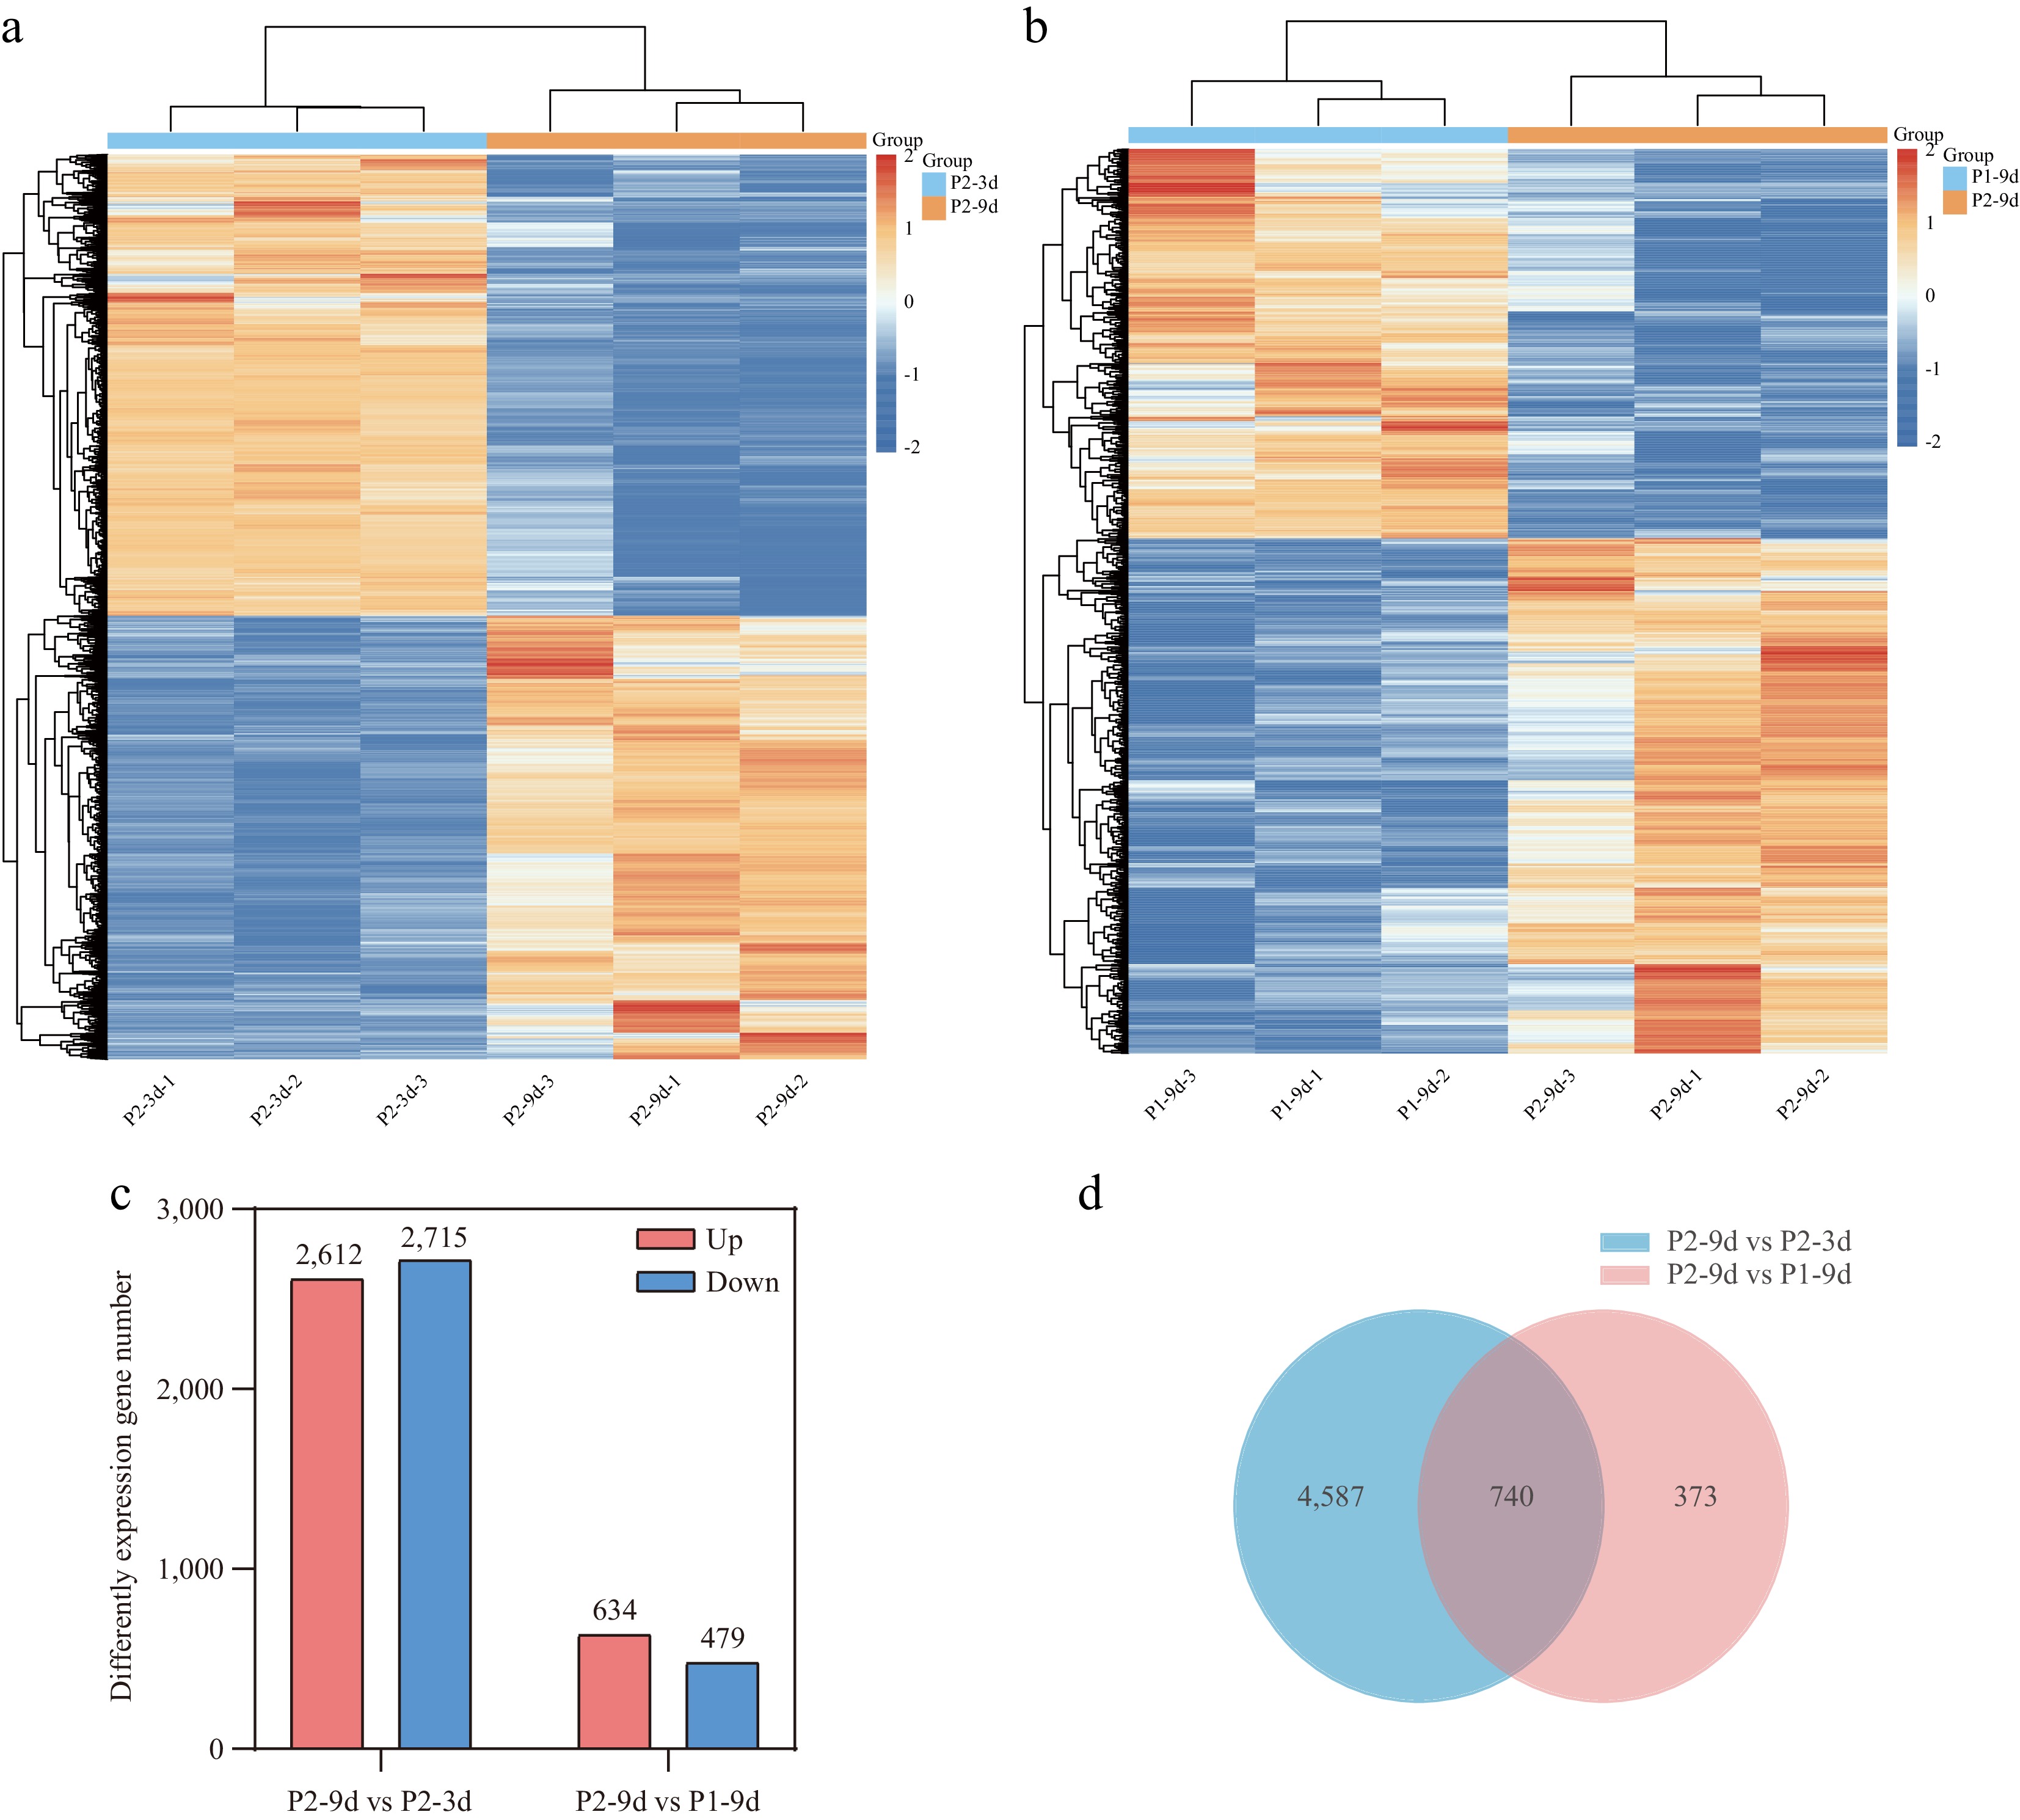
Figure 2.
Transcriptome analysis of cucumber fruits with different astringency levels. (a), (b) Clustered map of DEGs. (c) The number of upregulated and downregulated DEGs in P2-9d vs P2-3d, and P2-9d vs P1-9d comparisons. (d) Venn diagram showing common DEGs in P2-9d vs P2-3d, and P2-9d vs P1-9d comparisons.
-
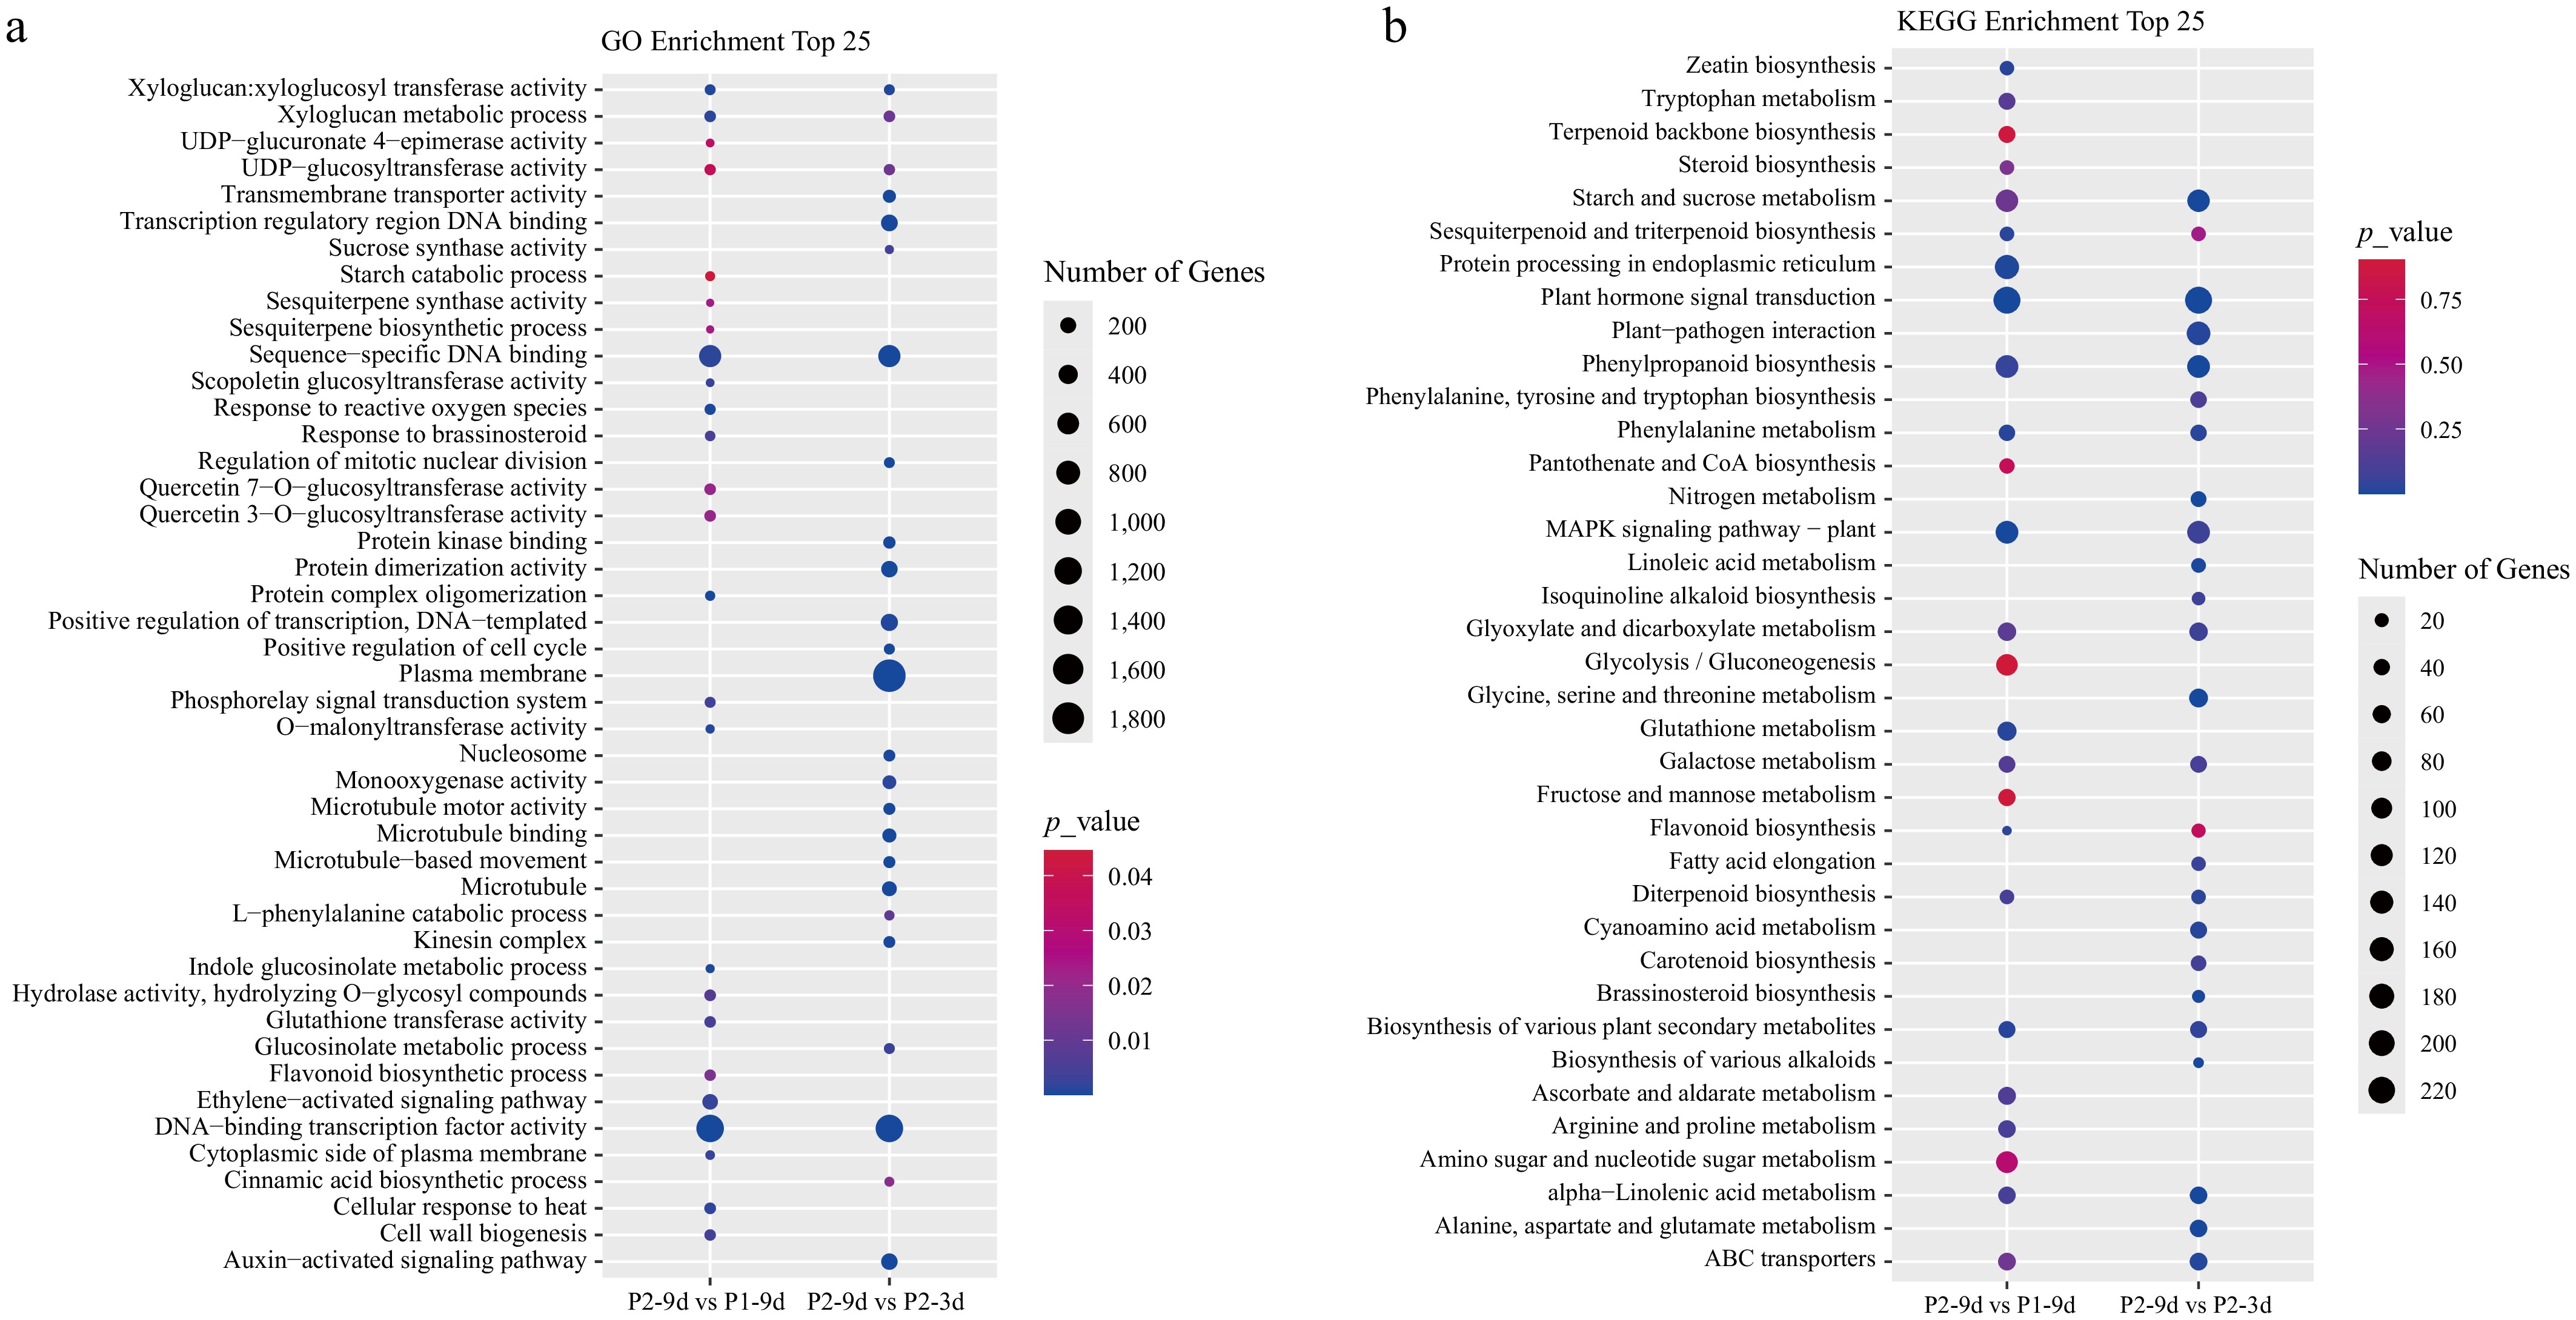
Figure 3.
(a) GO, and (b) KEGG enrichment analyses of DEGs in P2-9d vs P1-9d, and P2-9d vs P2-3d comparisons.
-
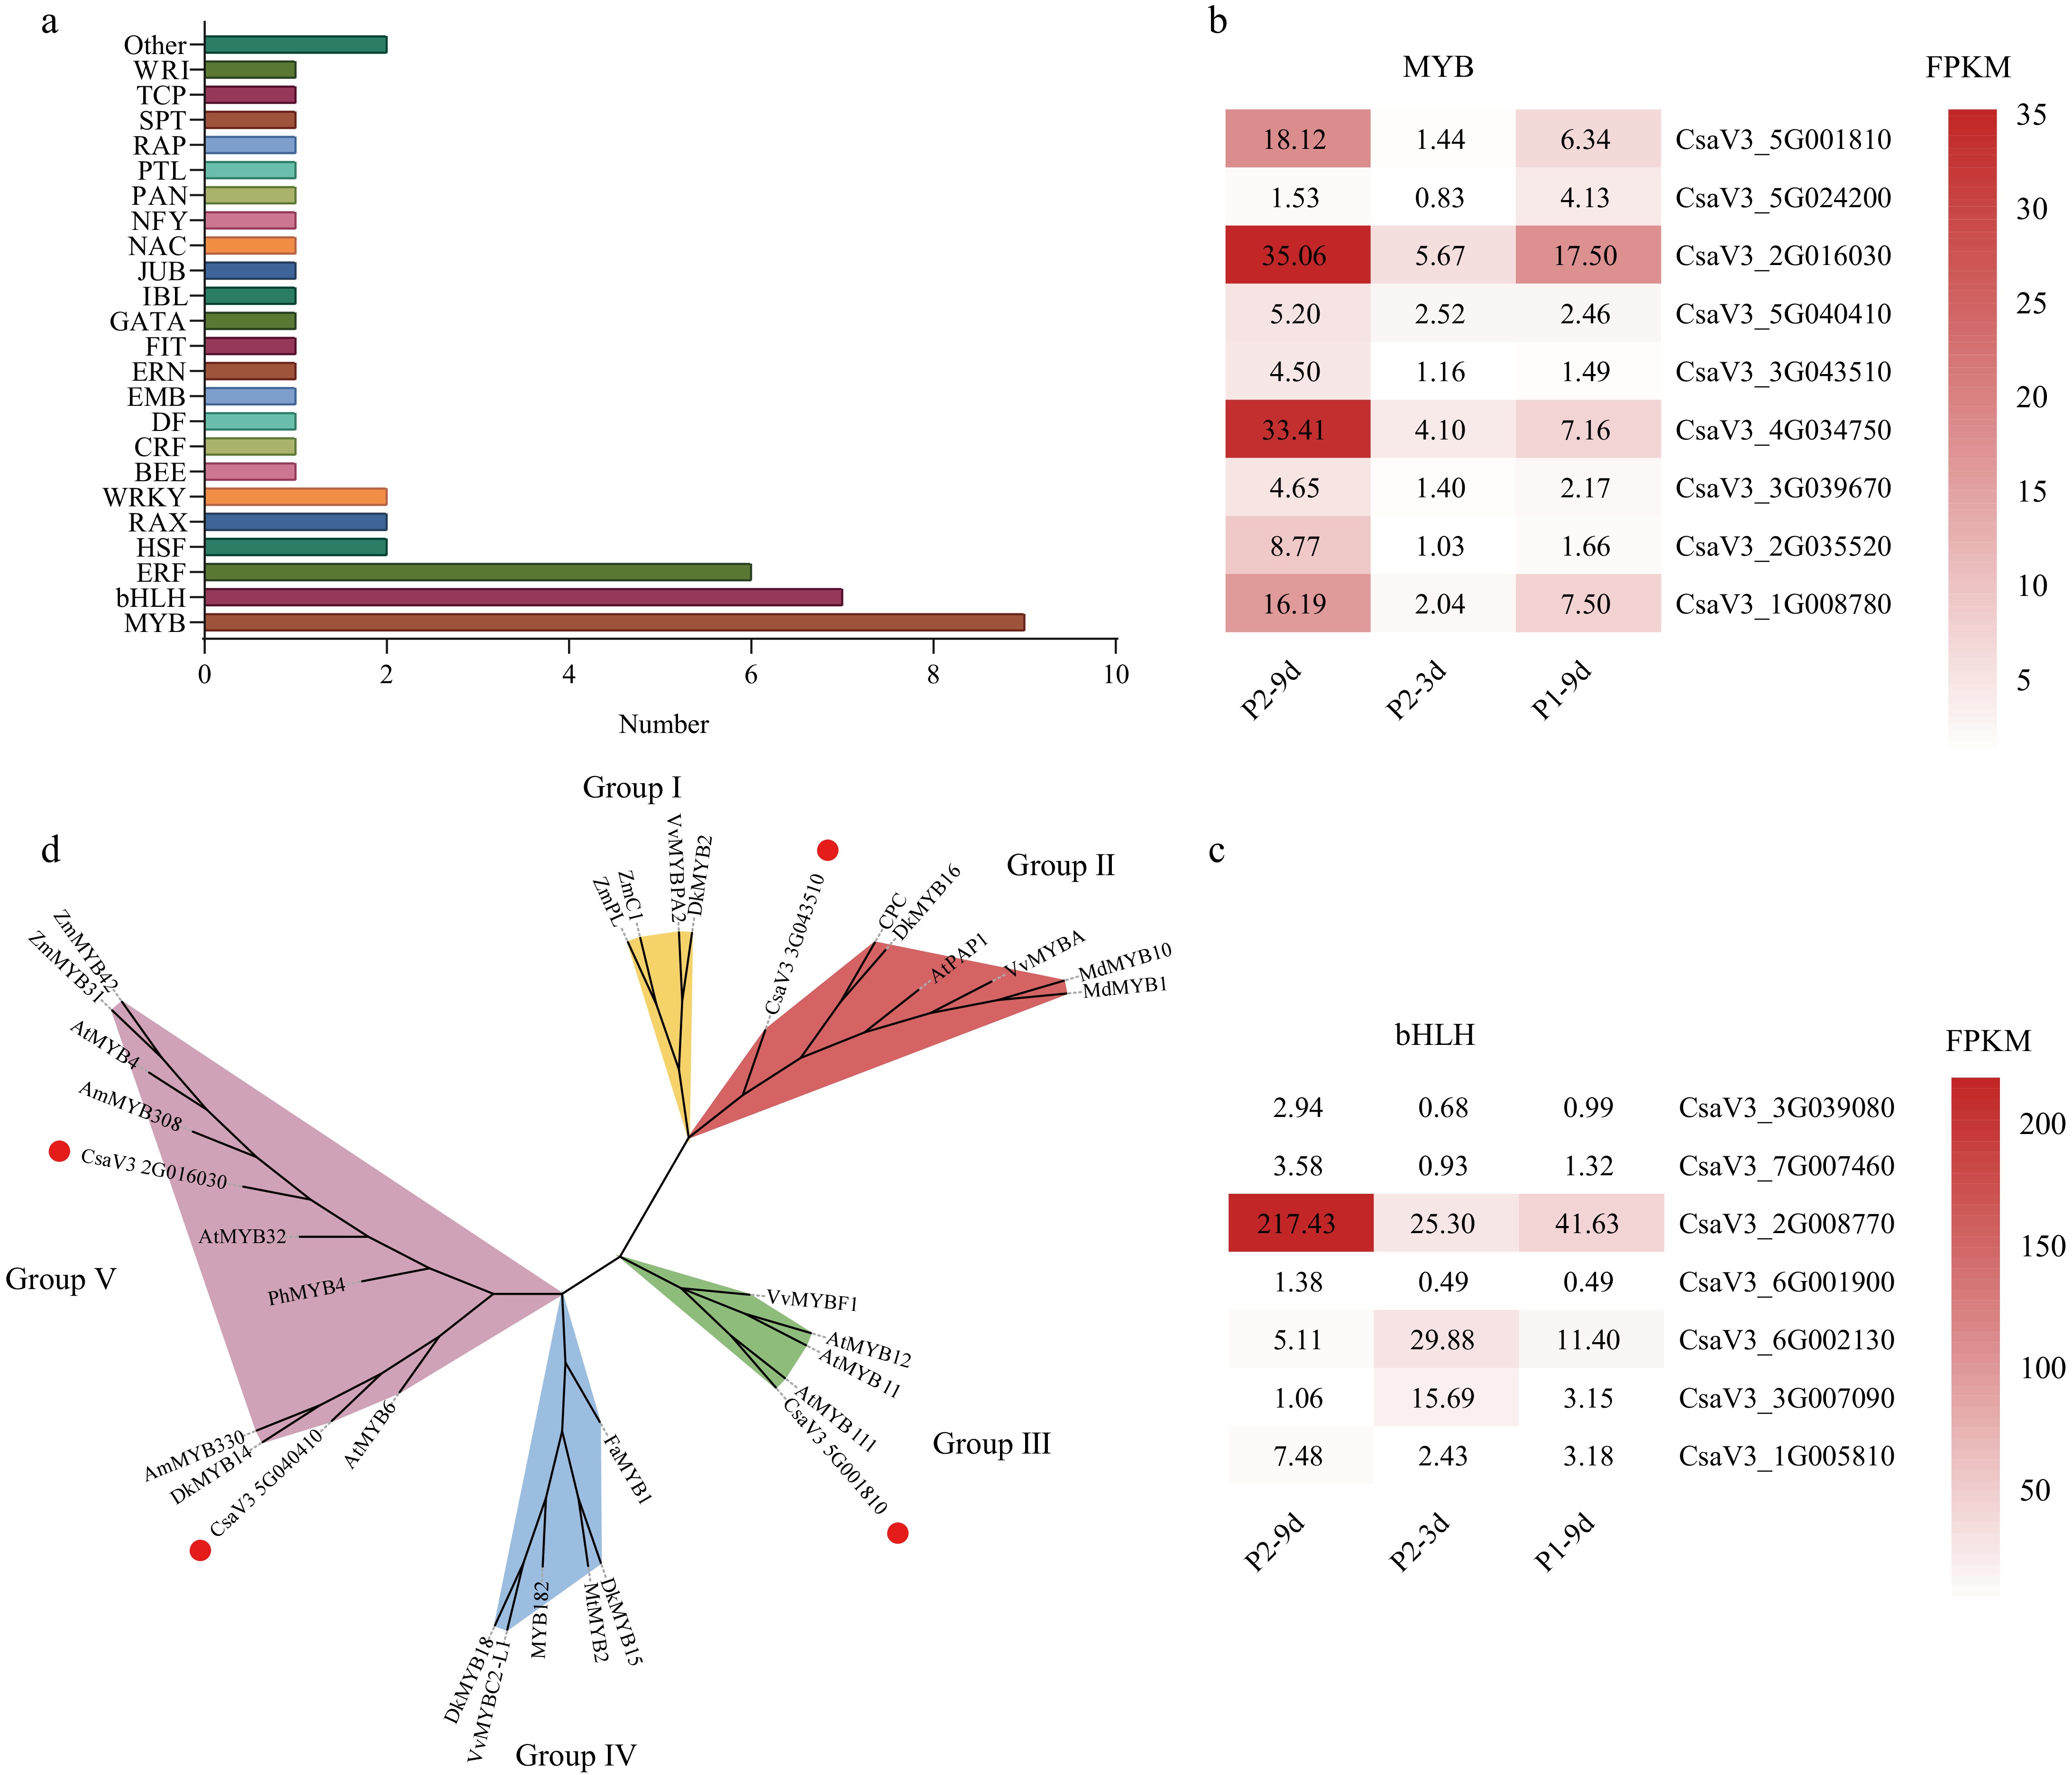
Figure 4.
Differentially expressed transcription factors (TFs) common to both comparisons. (a) Distribution of TF families. Gene expression levels indicated by color bars, showing expression trends of (b) MYB family TFs, and (c) bHLH family TFs. (d) A maximum likelihood phylogenetic tree was inferred for cucumber CsMYBs and orthologous flavonoid biosynthesis regulators from other plant species, incorporating 1,000 bootstrap replicates. Solid red dots represent MYBs isolated in our study; Groups I, II, III, IV, and V indicate proanthocyanidin activators, anthocyanidin, flavonol activators, flavonoid repressors, and phenylpropanoid repressors, respectively. All protein sequence accession numbers from GenBank are tabulated in Supplementary Table S5.
-
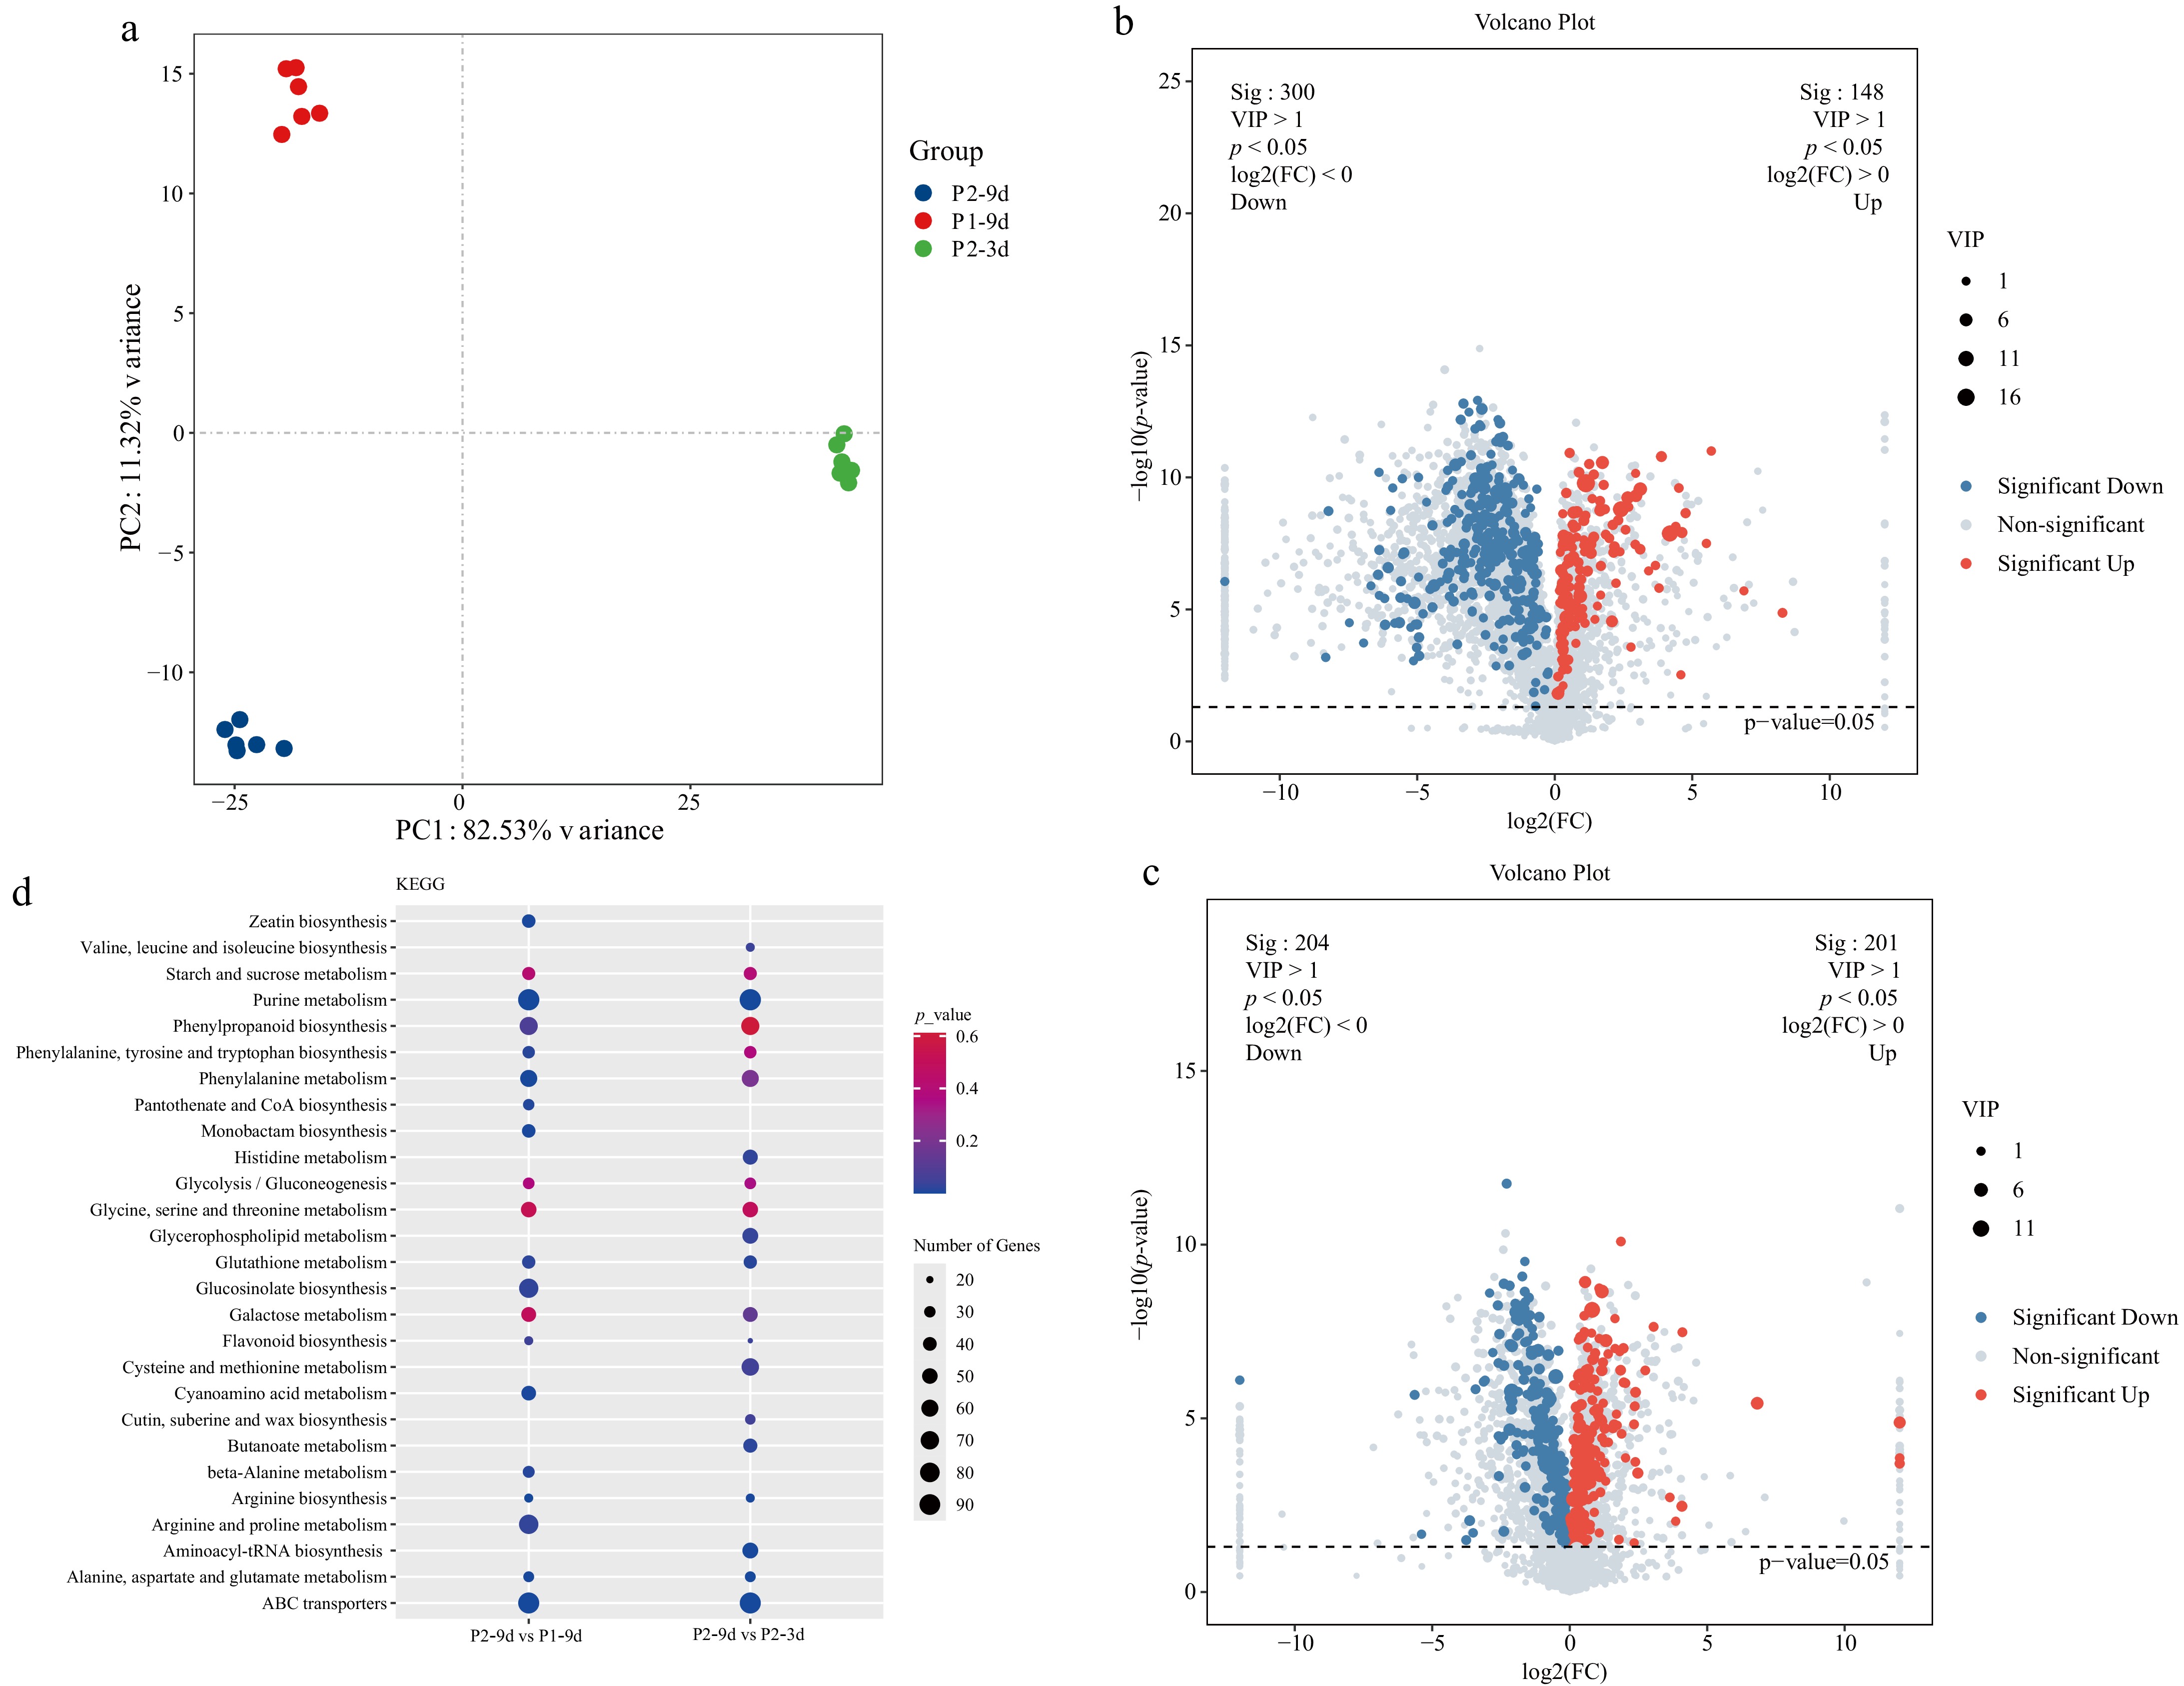
Figure 5.
Metabolomics analysis of different astringency cucumber. (a) PCA score scatter plots of metabolites, with different colors representing different sample groups. (b) Volcano plots of the DAMs for P2-9d vs P1-9d. (c) Volcano plots of the DAMs for P2-9d vs P2-3d. (d) Top 20 KEGG enrichment terms for P2-9d vs P1-9d, and P2-9d vs P2-3d comparisons; dot size in the plot indicates the number of DEGs.
-
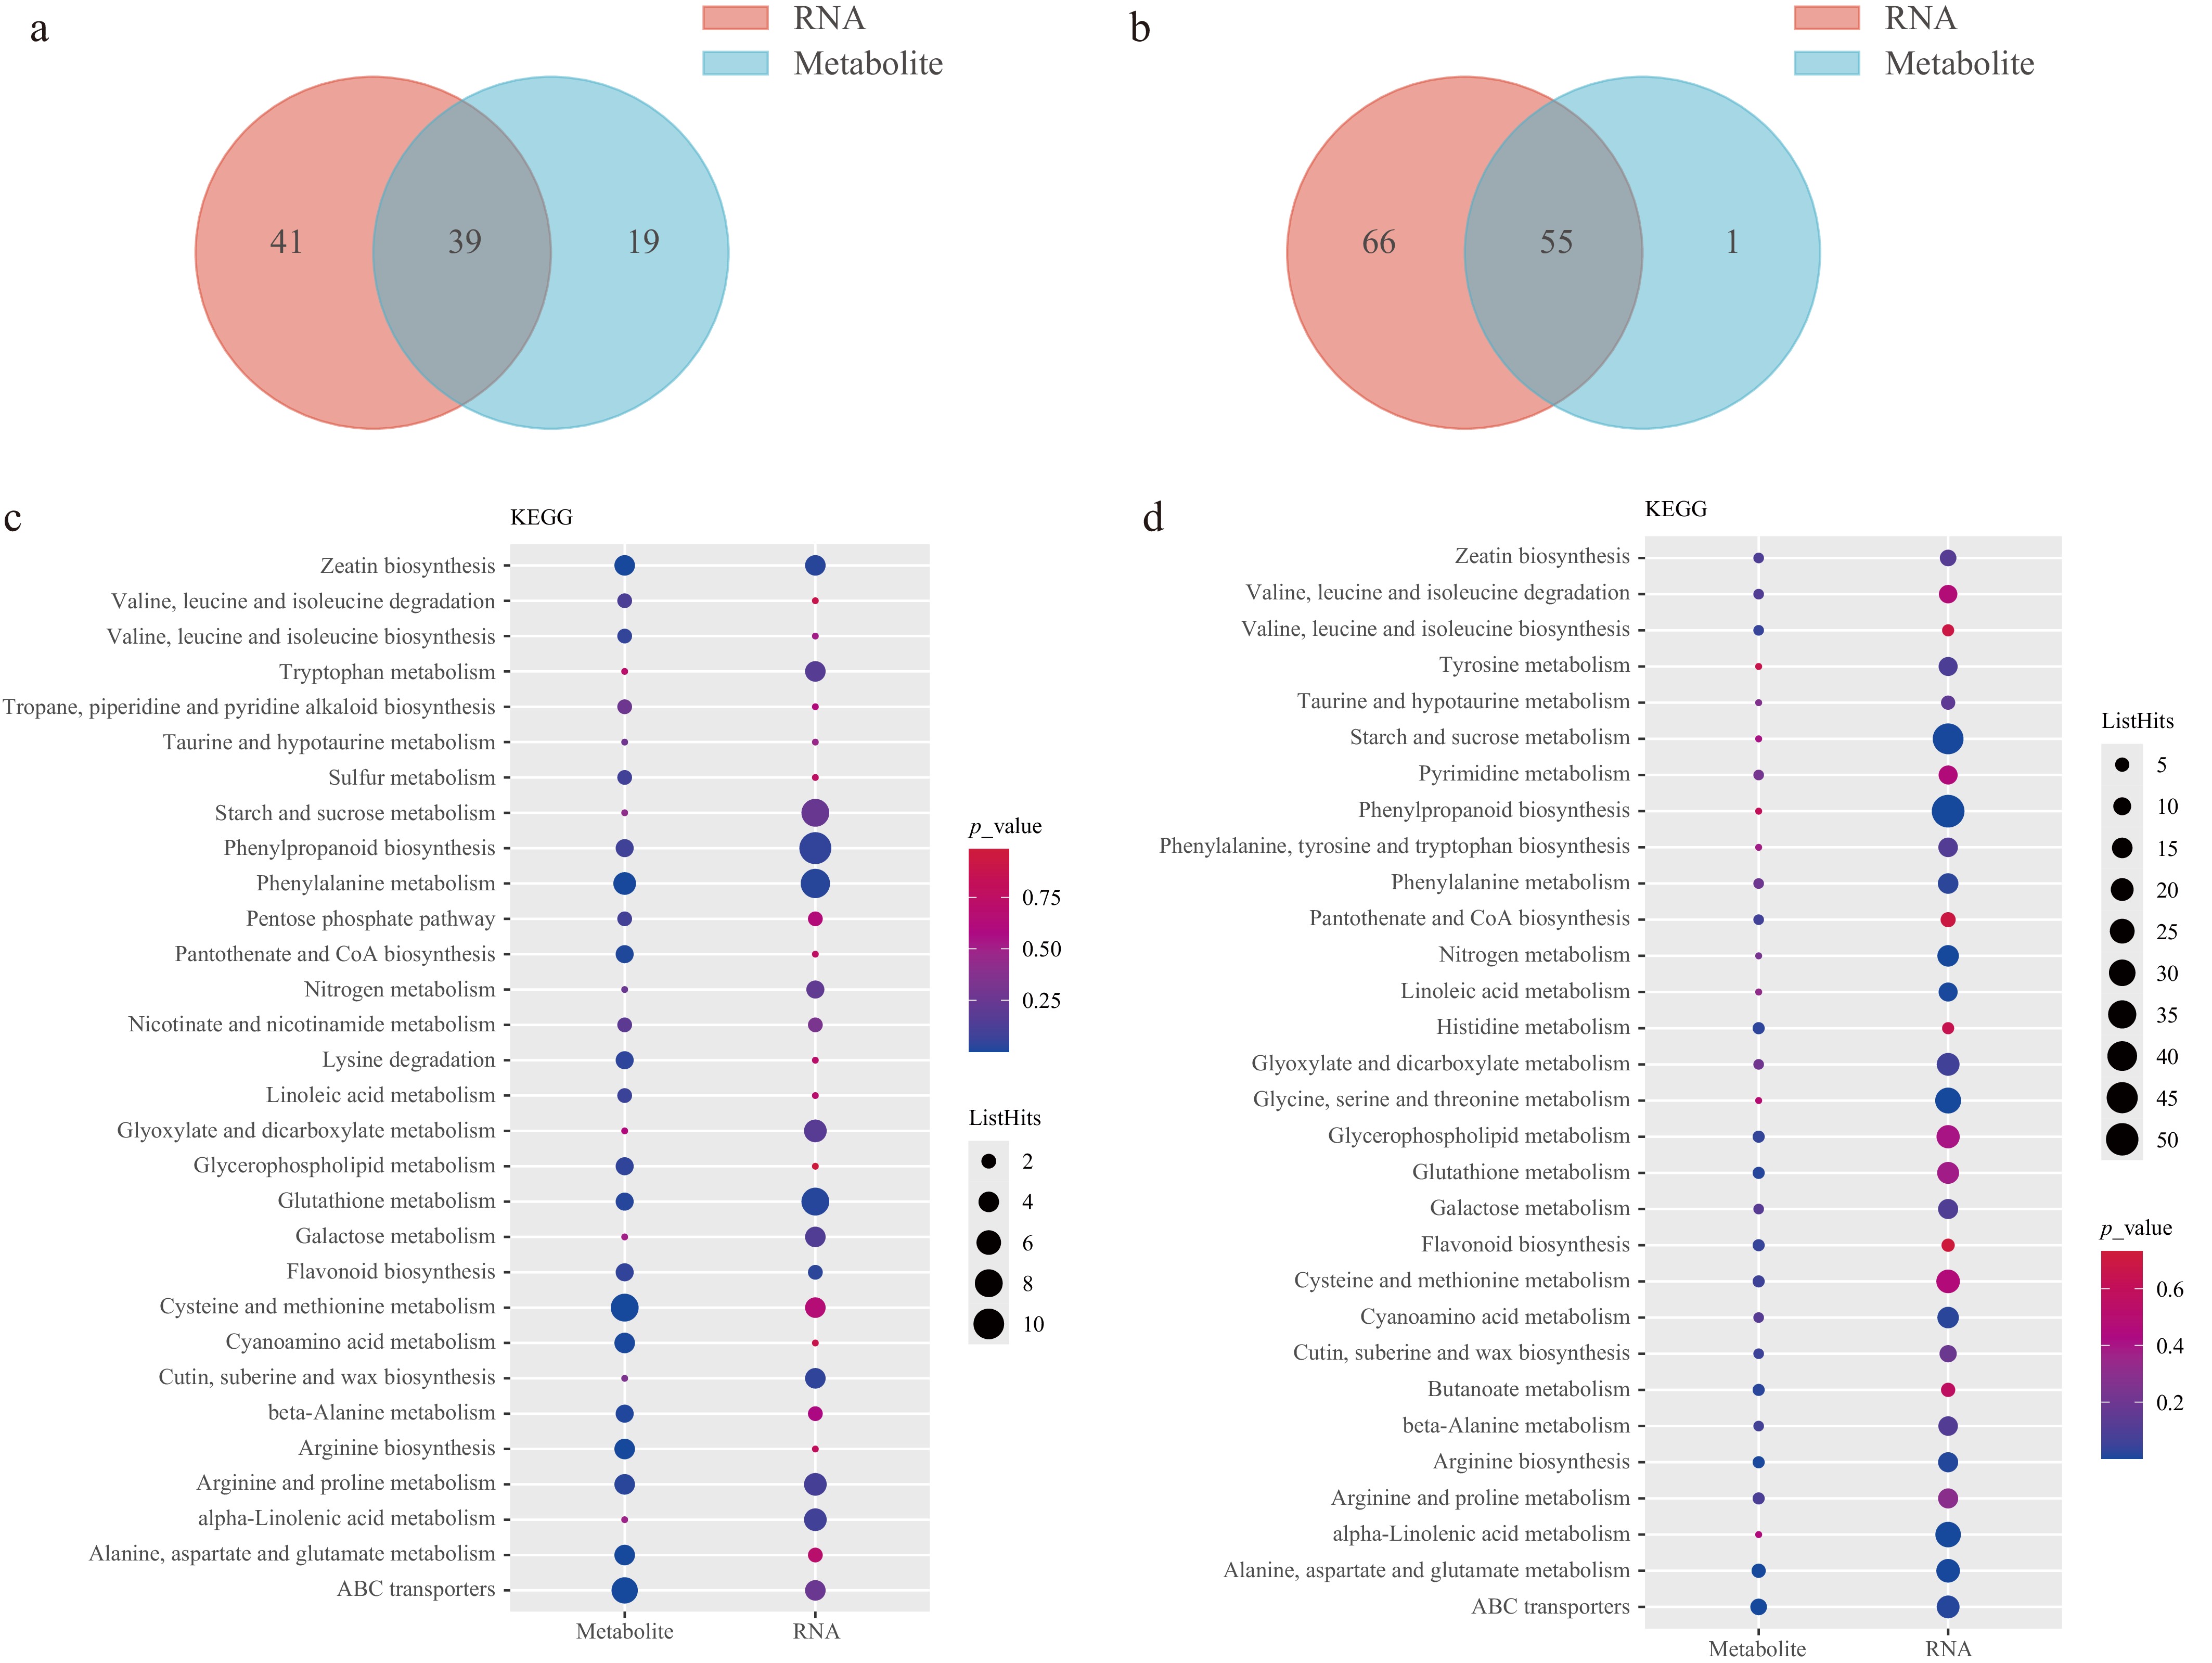
Figure 6.
Integrated analysis of transcriptome and metabolome data. (a), (b) Venn diagram of the mapping pathways of genes and metabolites for P2-9d vs P1-9d, and P2-9d vs P2-3d, respectively. (c), (d) Top 30 KEGG enrichment terms of DEGs and DAMs for P2-9d vs P1-9d, and P2-9d vs P2-3d comparisons, respectively.
-
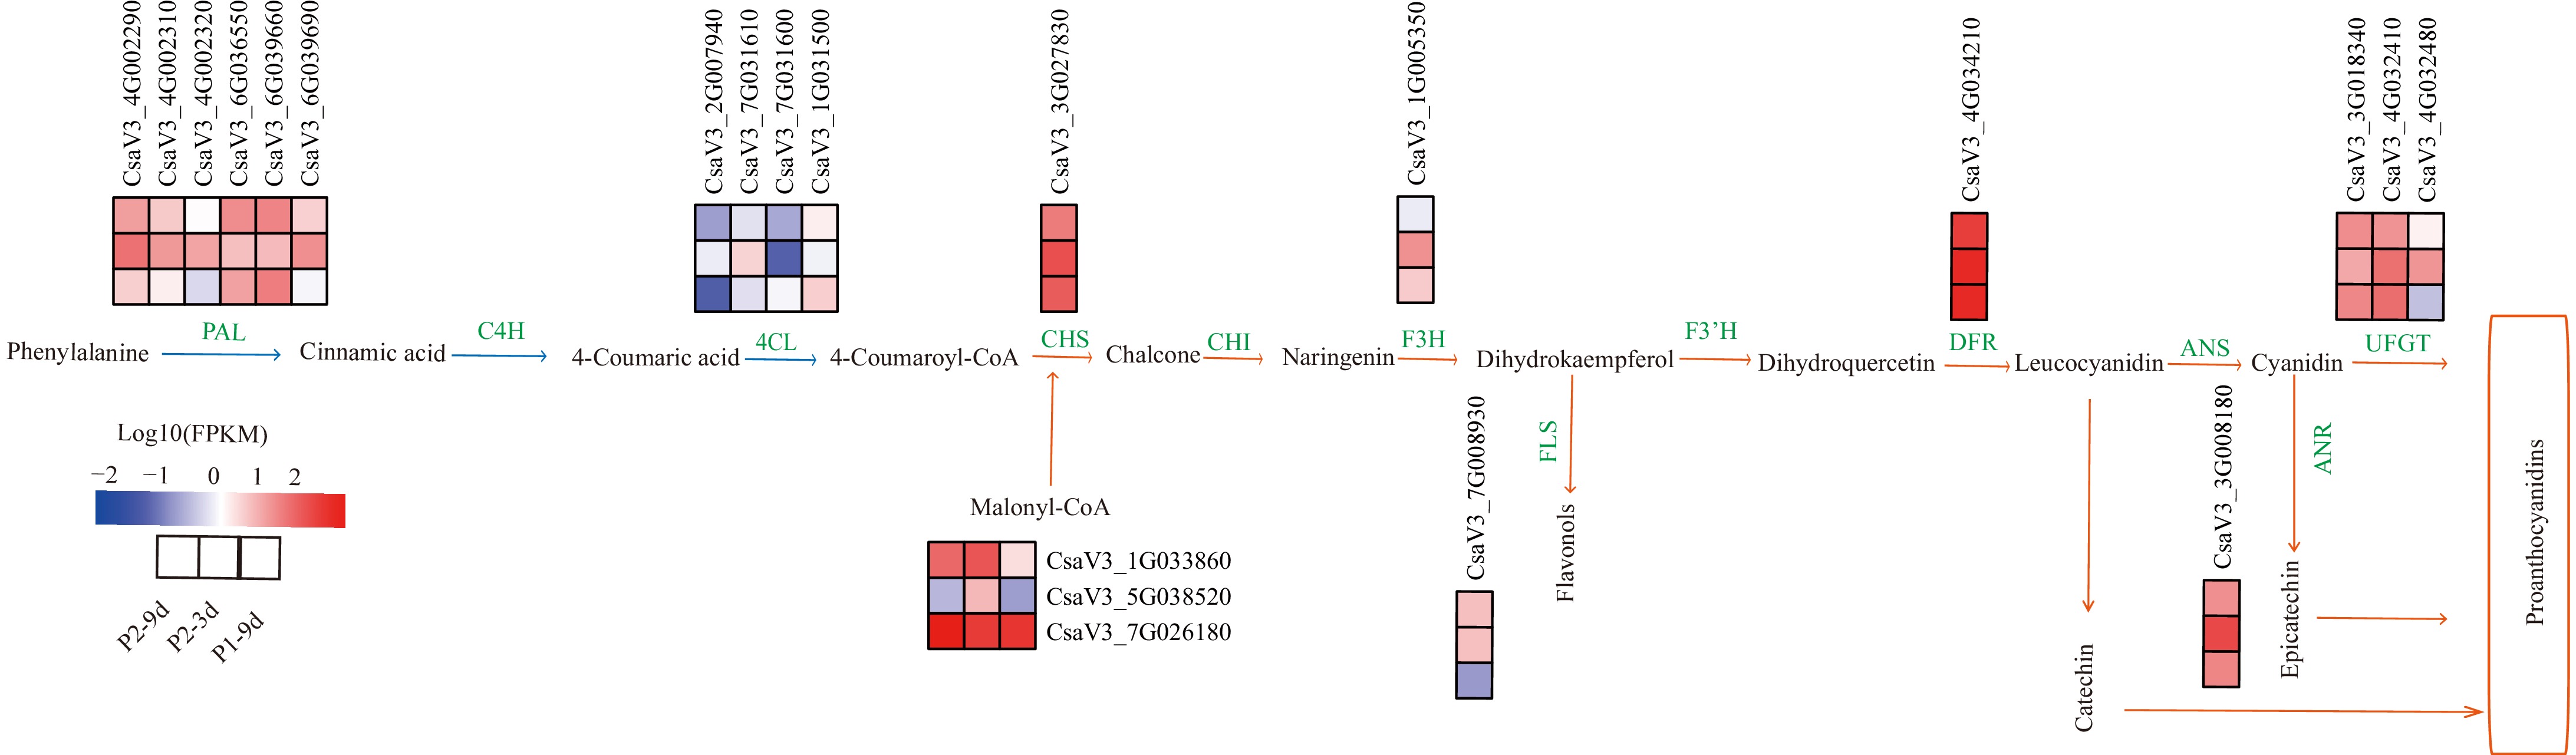
Figure 7.
DEGs involved in flavonoid biosynthetic pathways. The phenylpropanoid metabolic pathway is indicated by blue arrows, the flavonoid metabolic pathway by orange arrows, and green words indicate enzymes in the metabolic process. The red block represents upregulation, and the blue represents downregulation of gene expression. Enzyme annotation: PAL (Phenylalanine ammonia-lyase), C4H (Cinnamate4-hydroxylase), 4CL (4-coumarate CoA ligase), CHS (Chalcone synthase), CHI (Chalcone isomerase), F3H (Flavonoid 3-hydroxylase), FLS (Flavonol synthase), F3'H (Flavonoid 3'-hydroxylase), DFR (Dihydroflavonol 4- reductase), LAR (Leucocyanidin reductase), ANR (Anthocyanidin reductase), ANS (Anthocyanidin synthase), UFGT (UDP-flavonoid 3-O-glucosyltransferase).
-
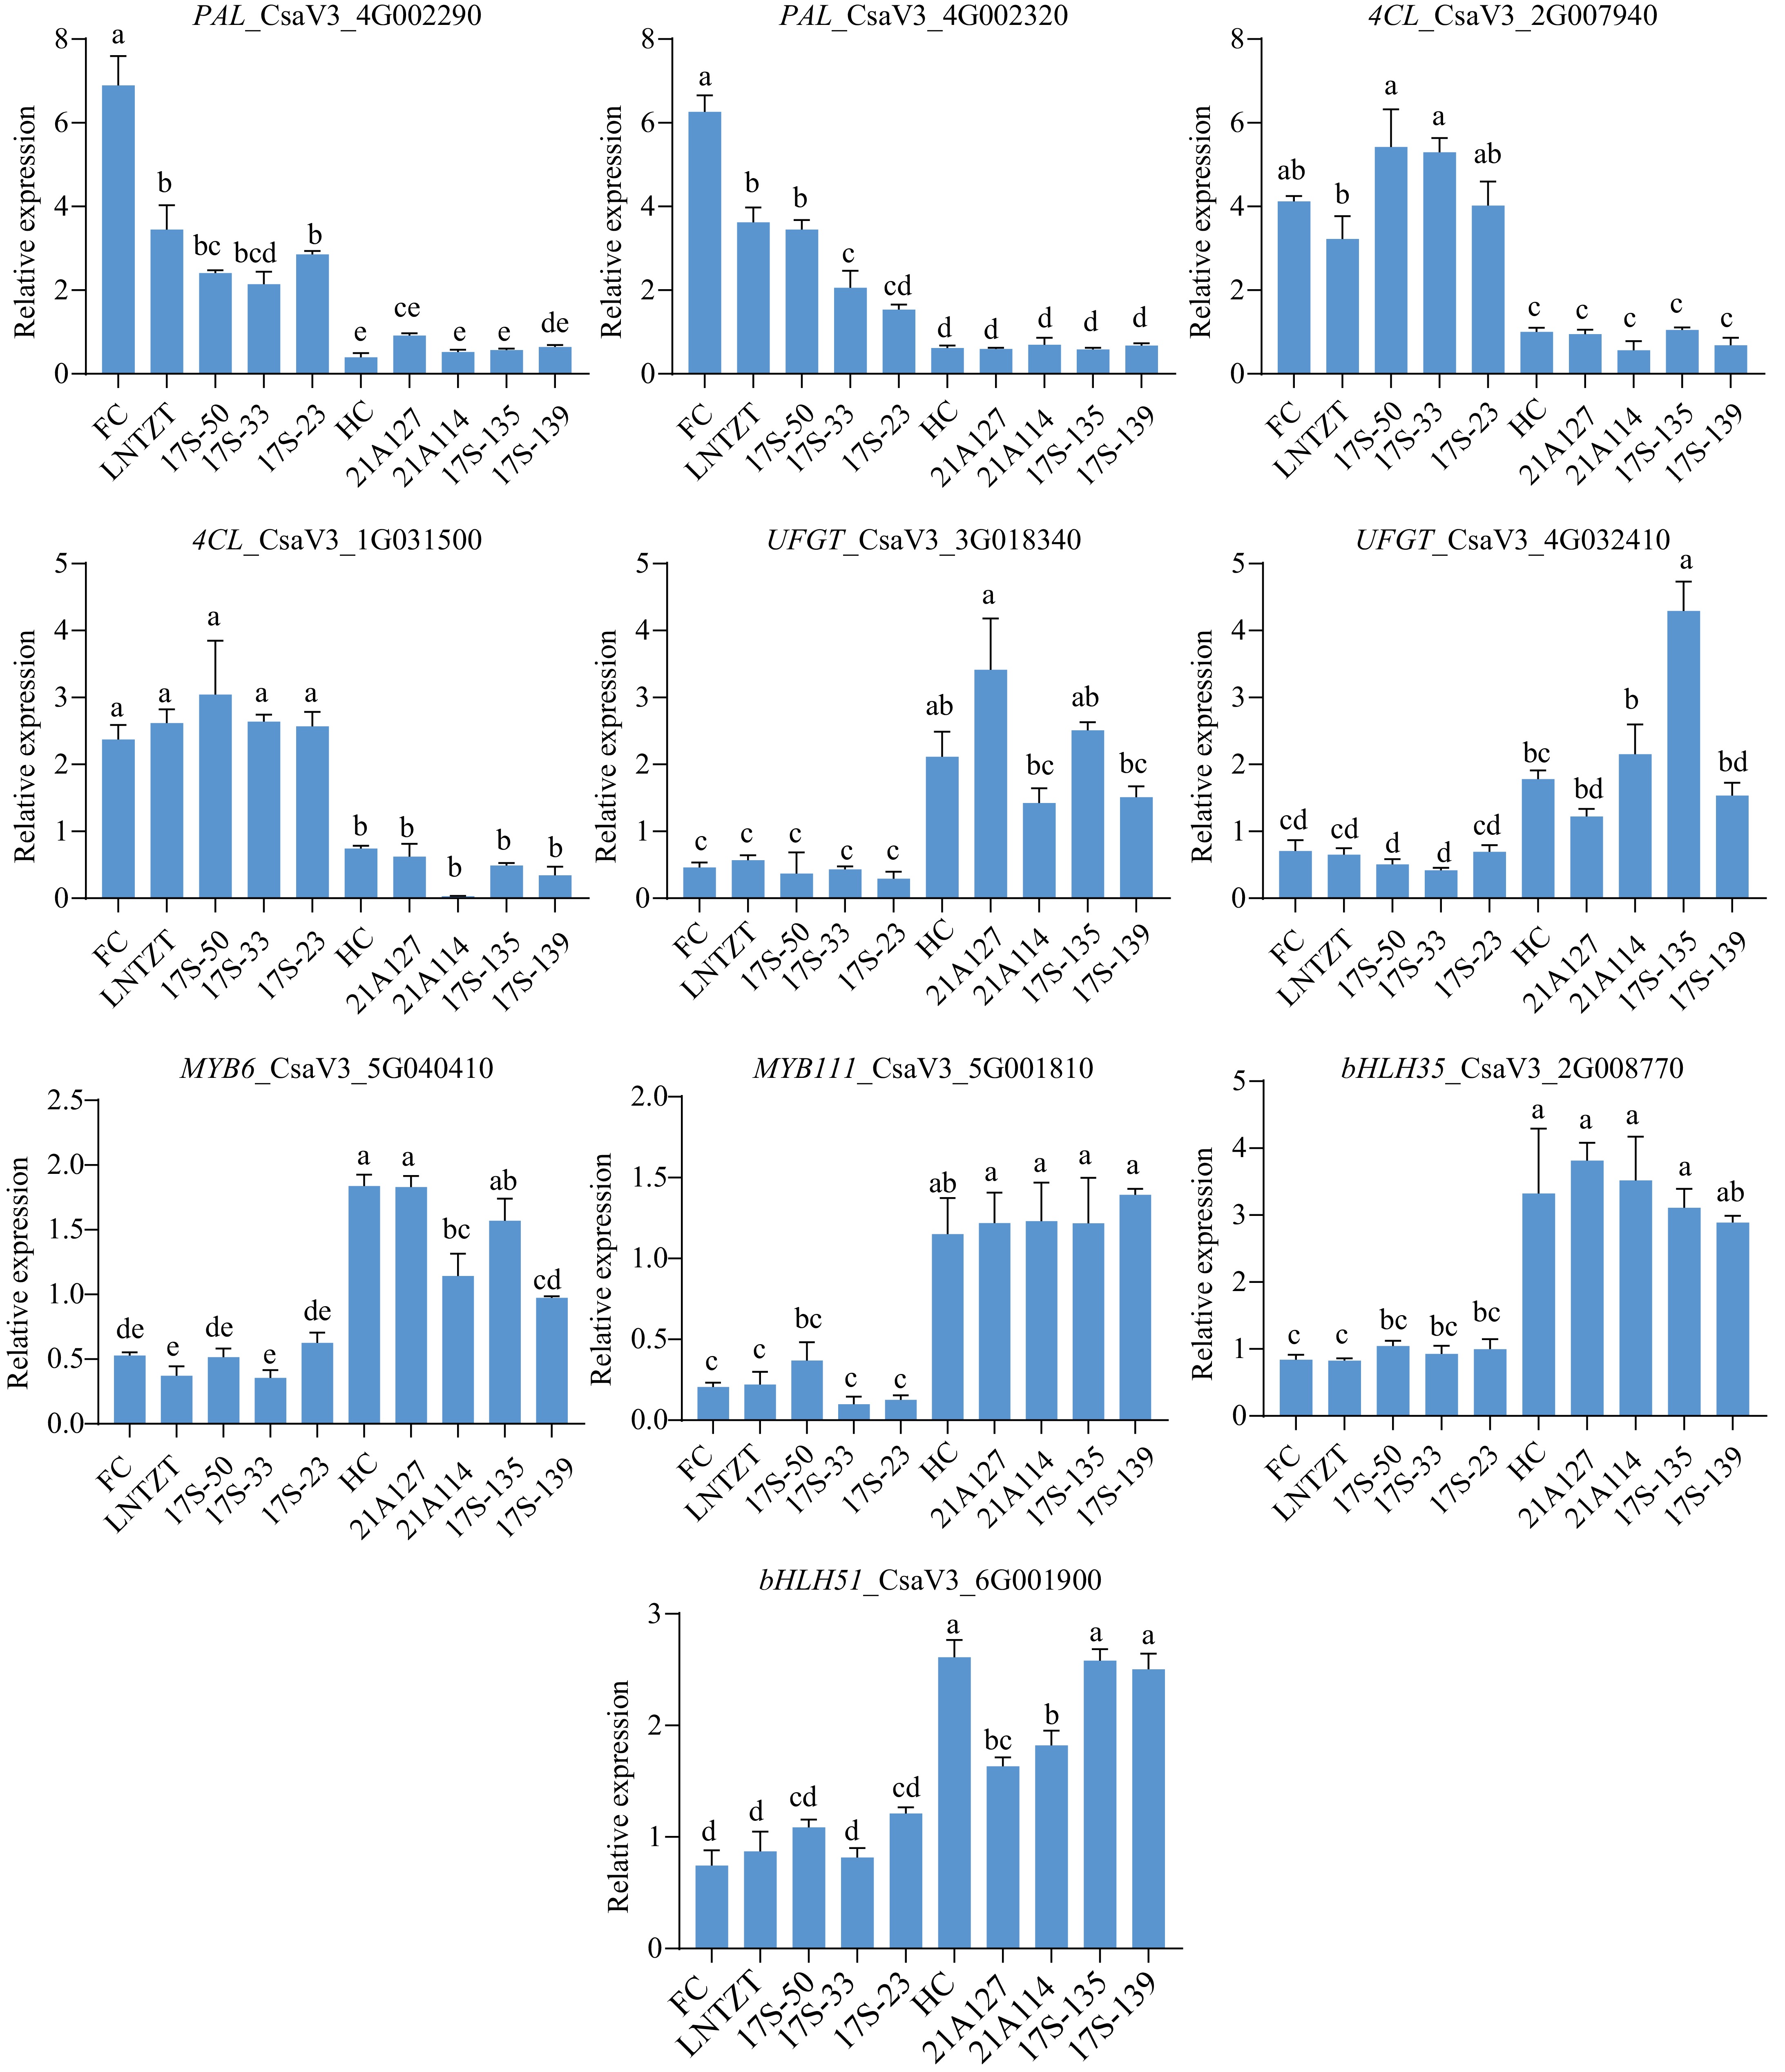
Figure 8.
qRT-PCR analysis of the ten candidate genes. Cucumber UBIQUITIN was selected as the housekeeping gene for expression normalization. Data are presented as the mean ± SD of three biological replicates, and statistical significance was calculated by one-way ANOVA followed by Tukey's test (p ≤ 0.05).
Figures
(8)
Tables
(0)