-
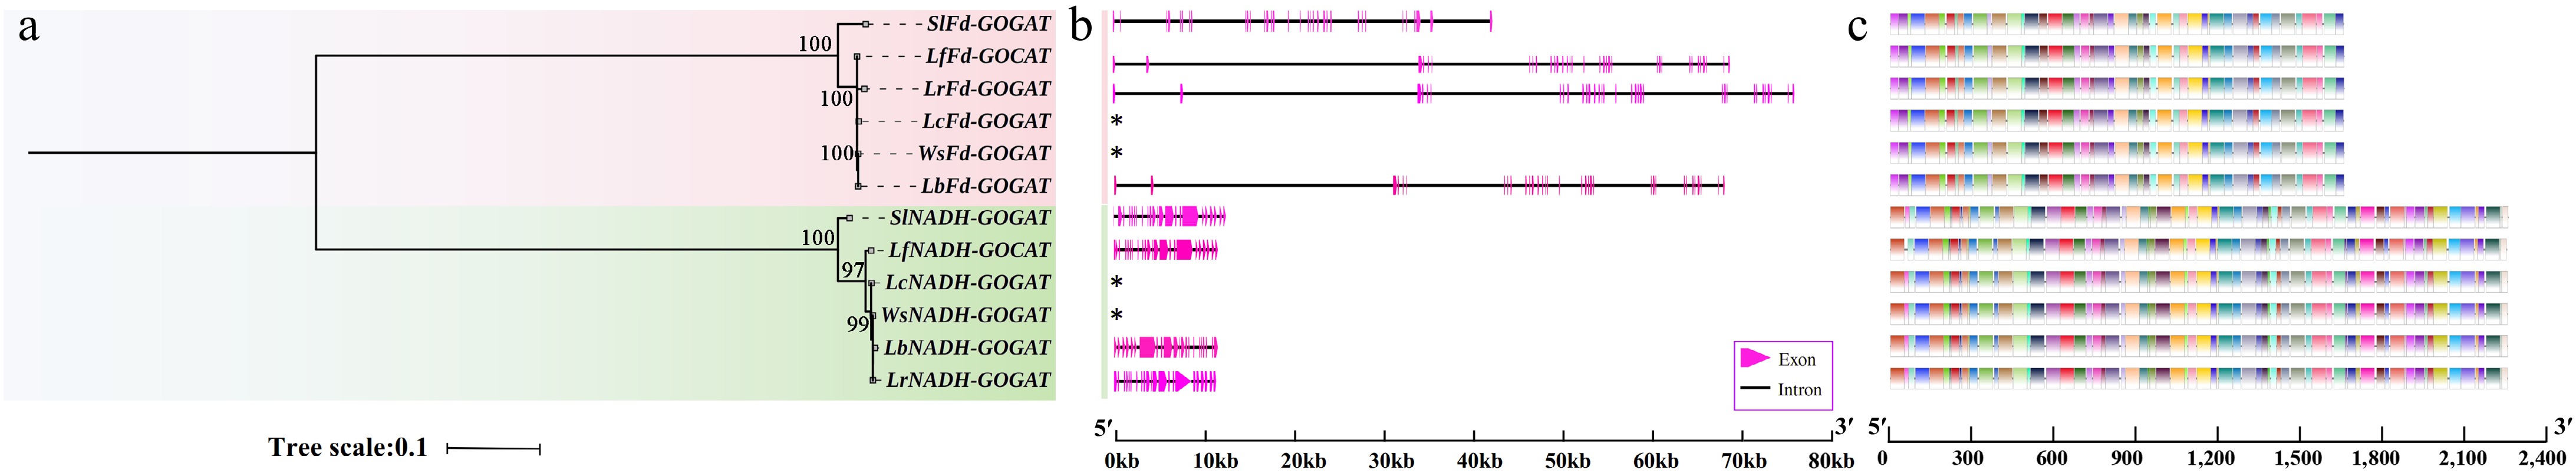
Figure 1.
Phylogenetic tree, gene structure, and motifs of the GOGAT genes in Lycium species. (a) Phylogenetic tree. (b) Gene structure. (c) Motif distribution diagram. See the legend within the figure for details.
-
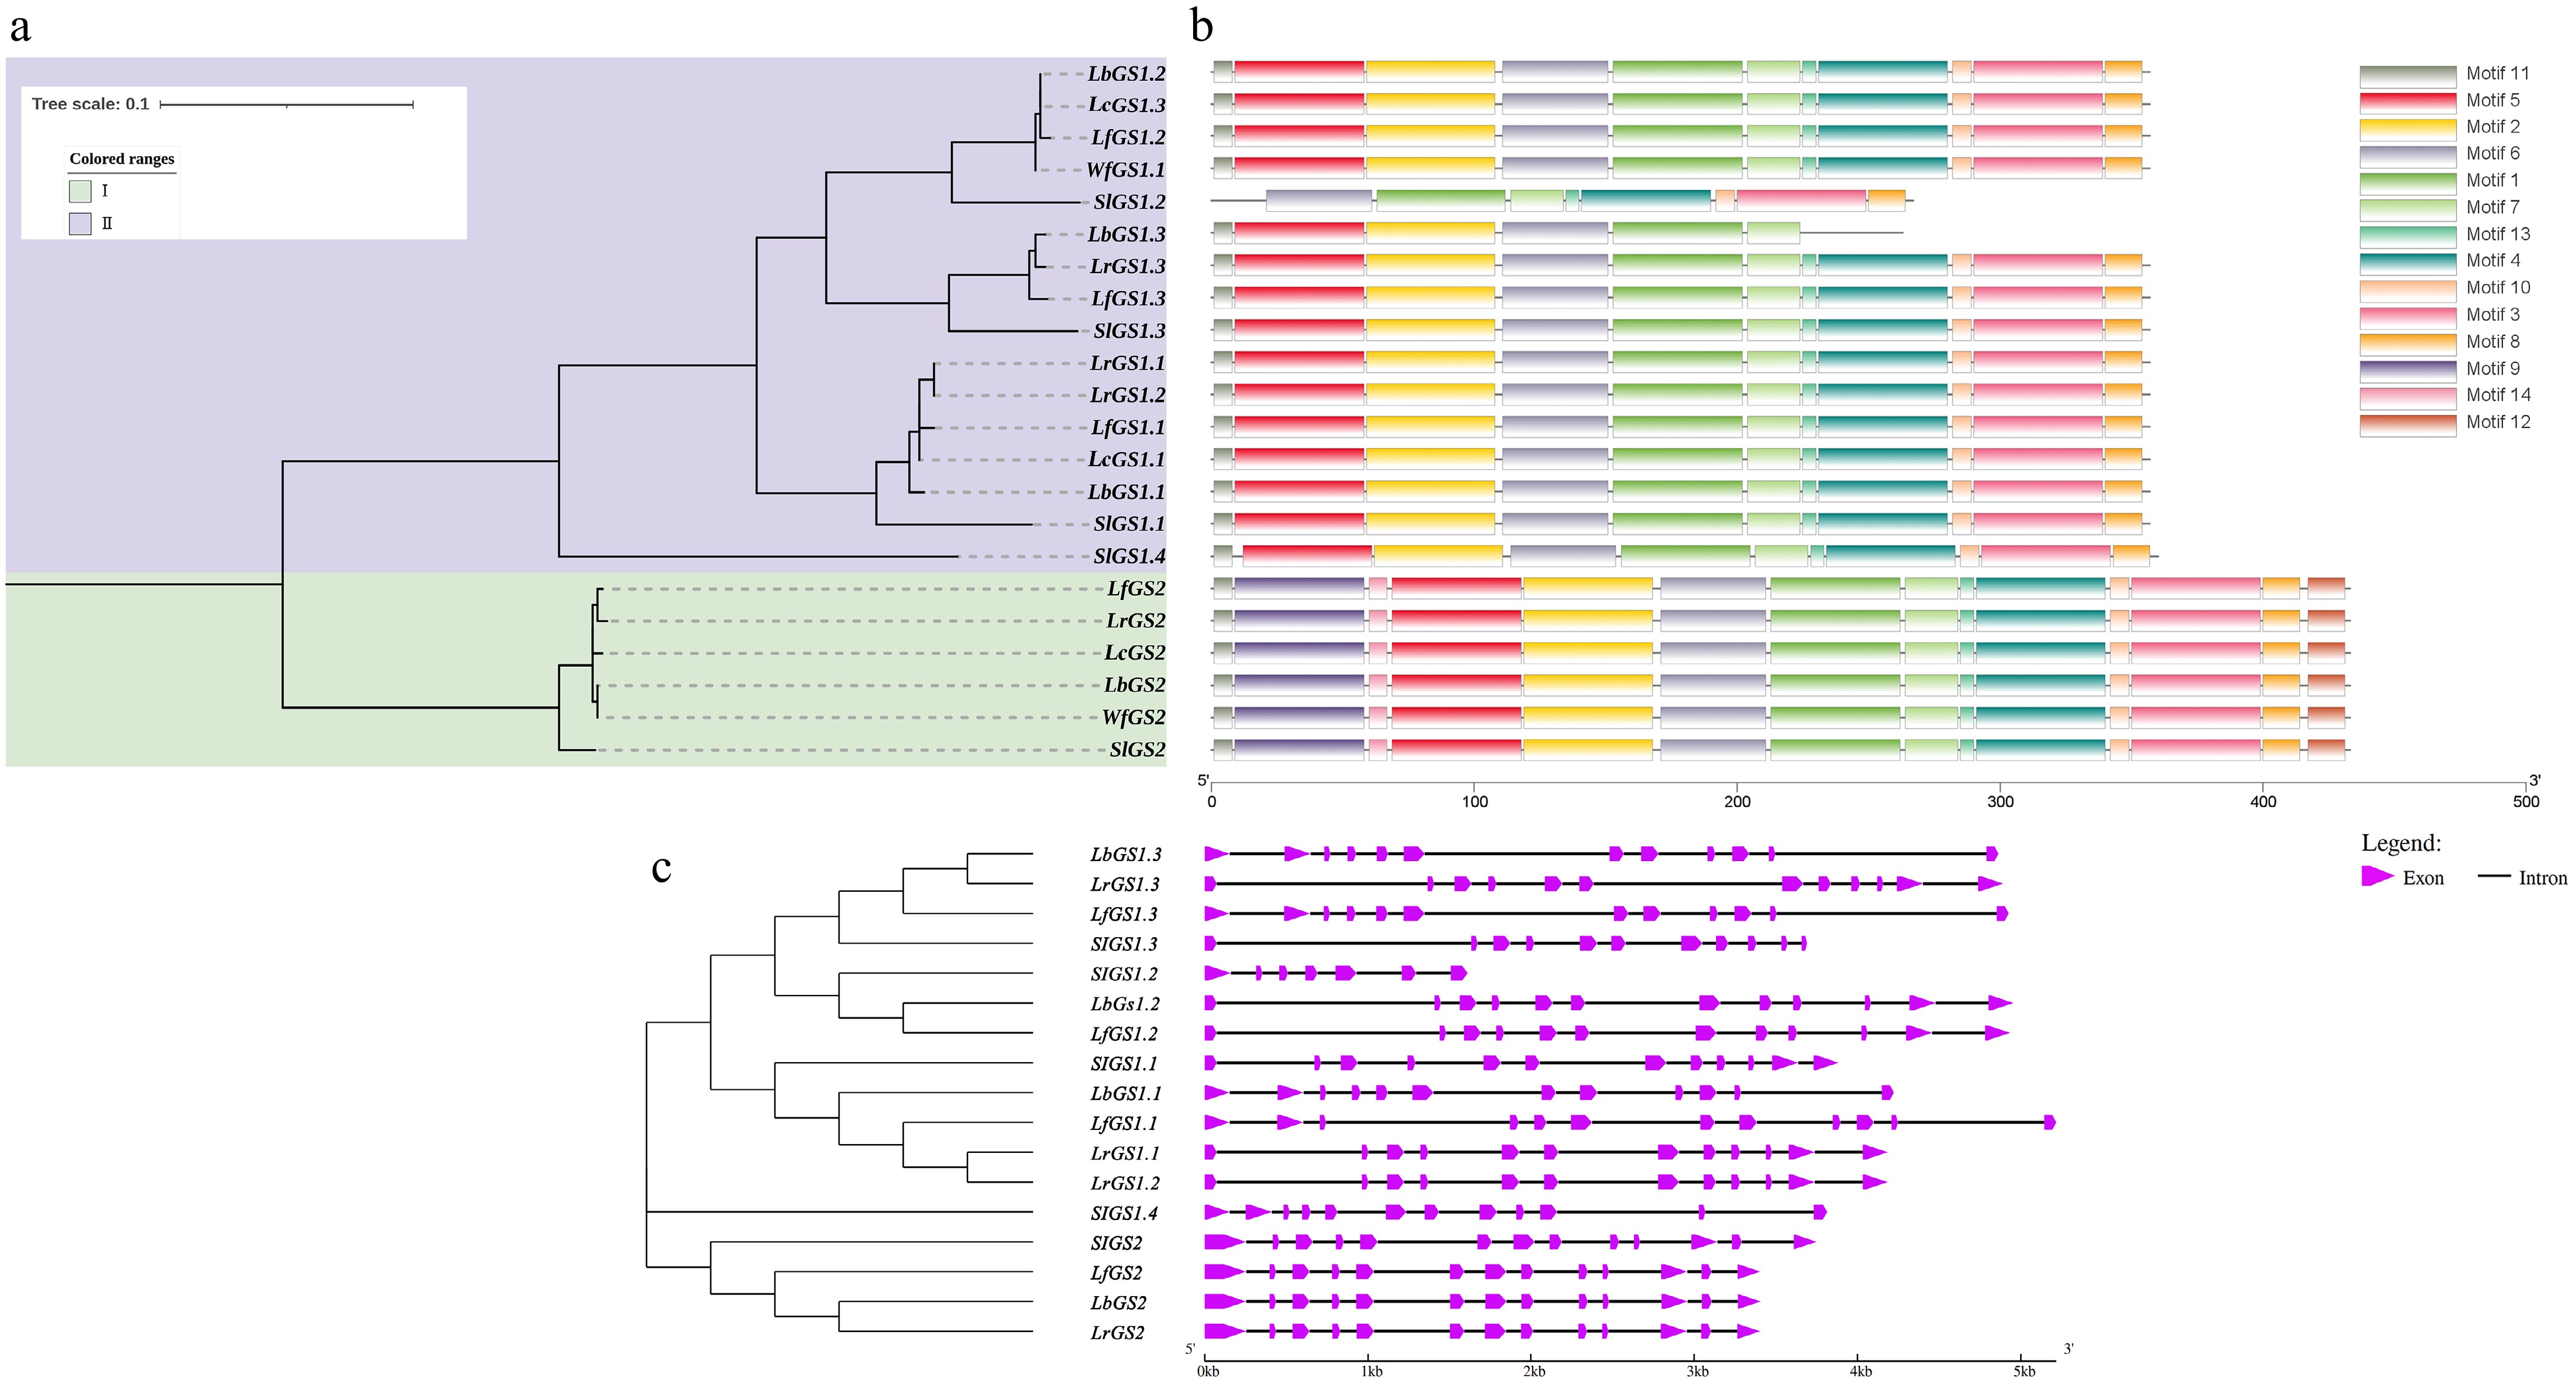
Figure 2.
Phylogenetic tree, gene structure, and motifs of the GS genes in Lycium species. (a) Represents the phylogenetic tree. (b) Depicts the motif distribution diagram. (c) Illustrates the gene structure.
-
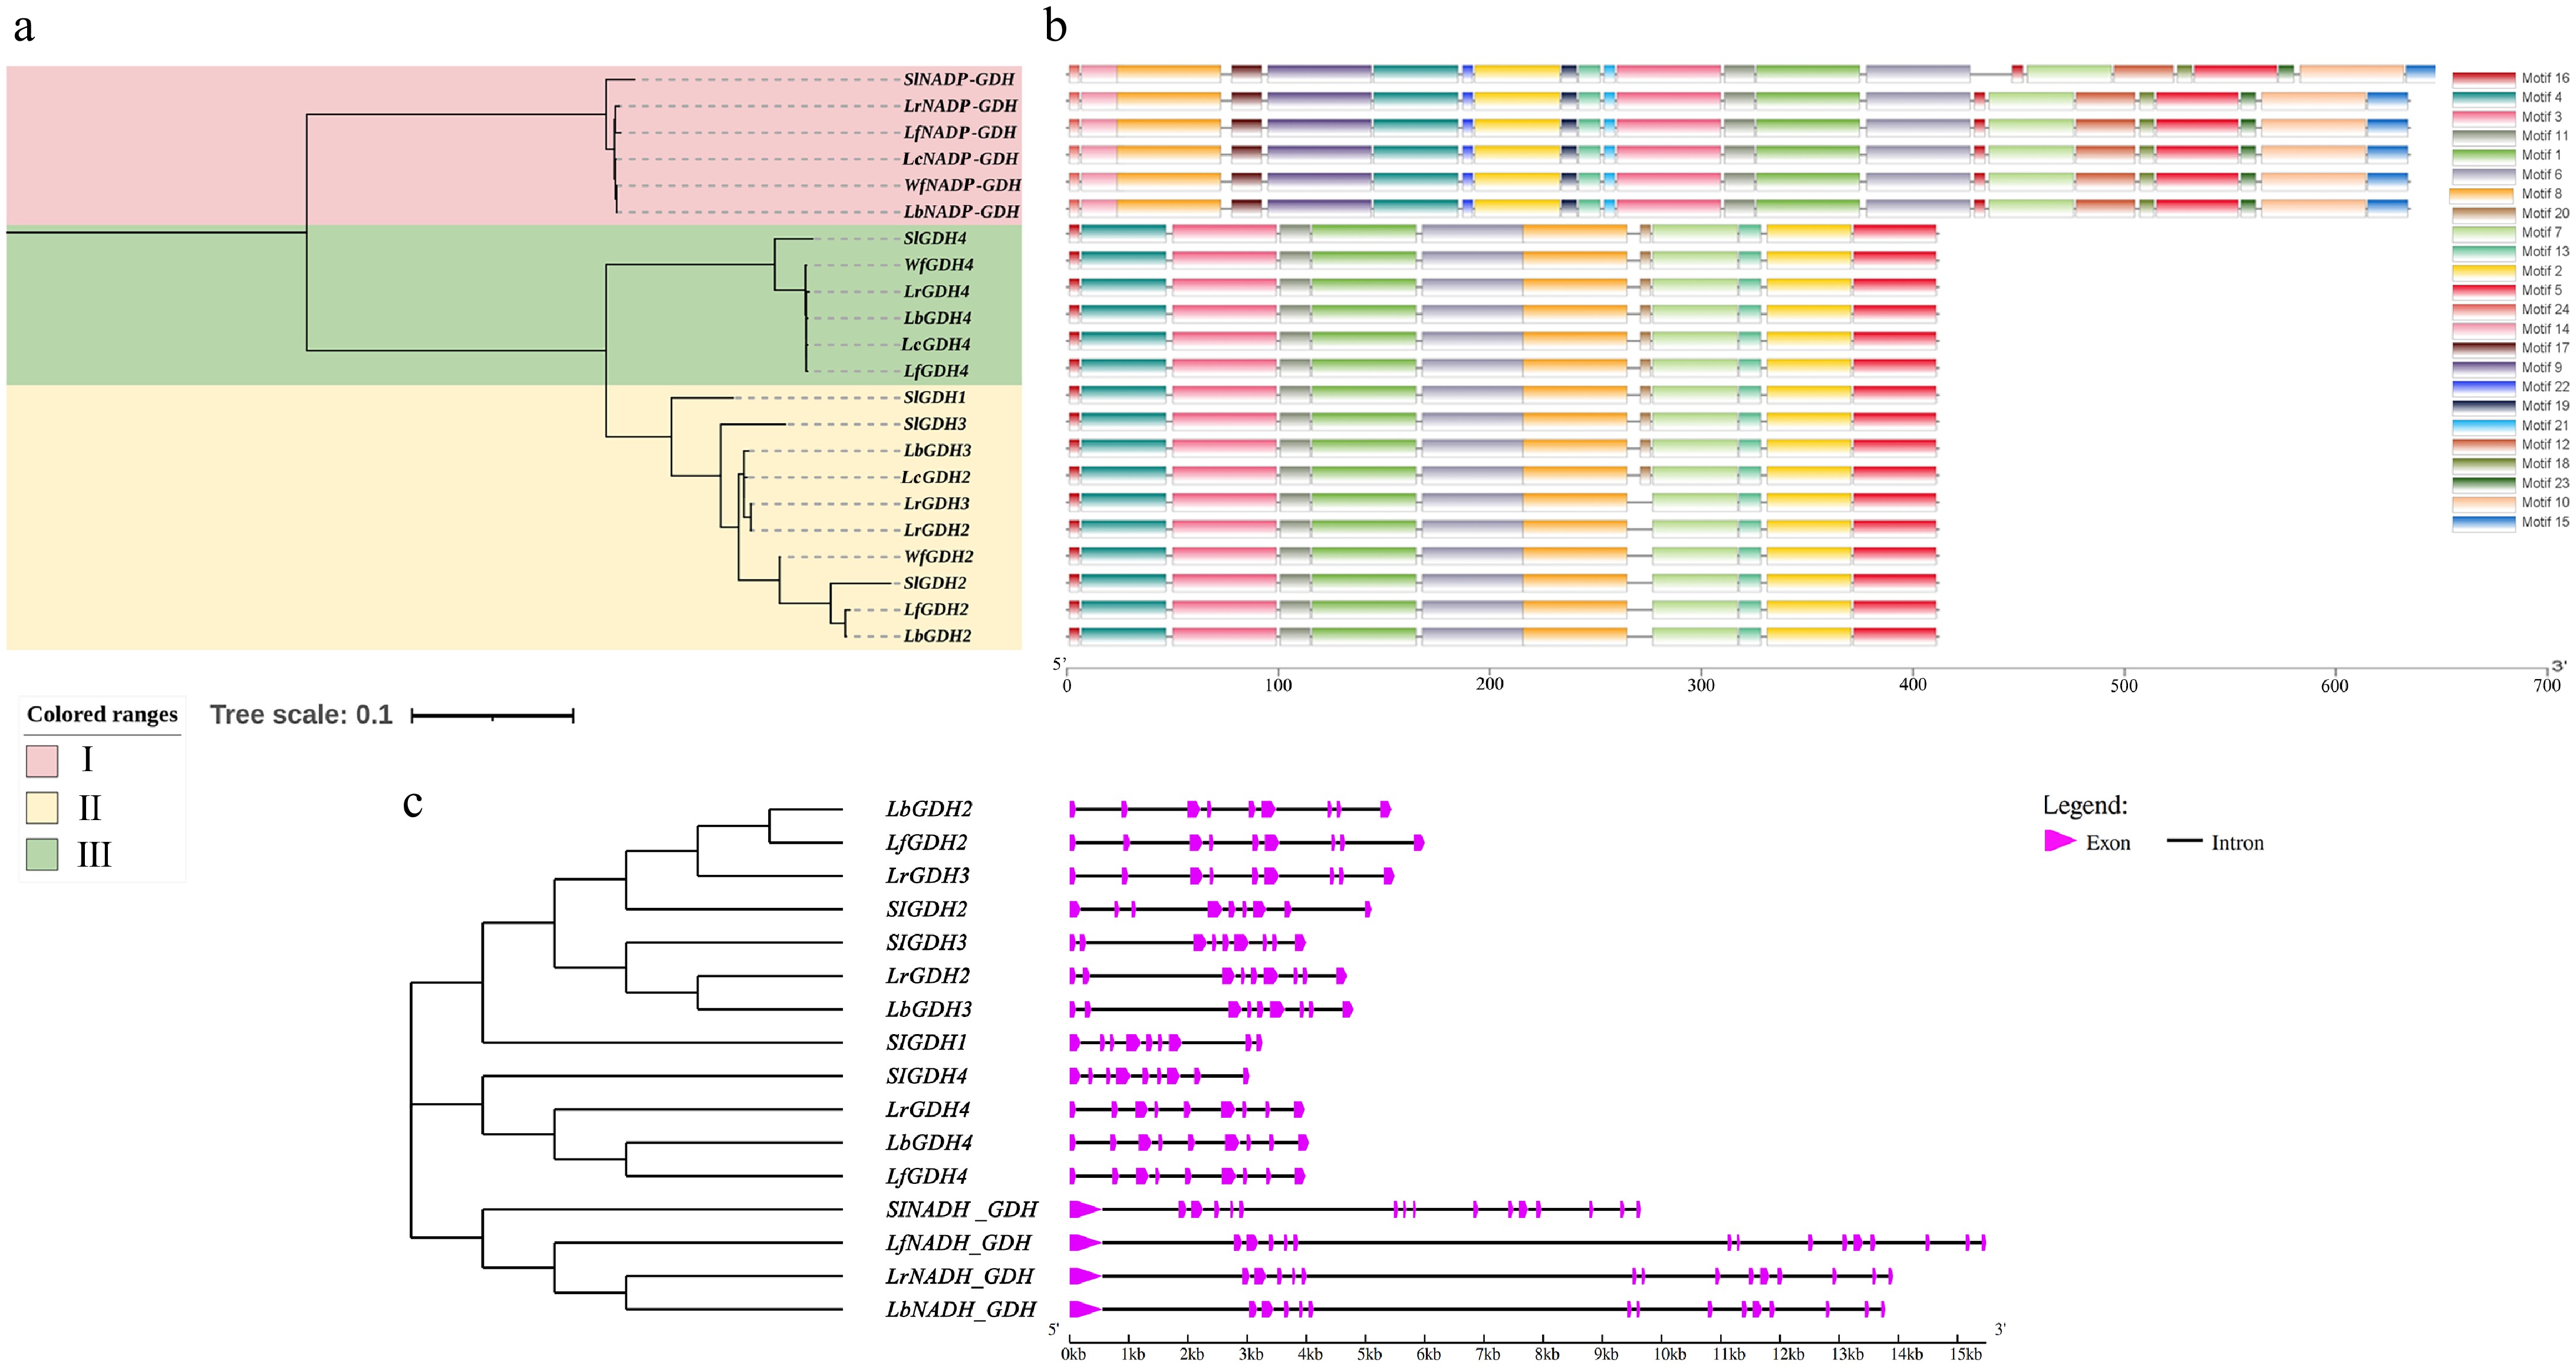
Figure 3.
Phylogenetic tree, gene structure, and motifs of the GDH genes in Lycium species. (a) Phylogenetic tree. (b) Motif distribution diagram. (c) Gene structure.
-
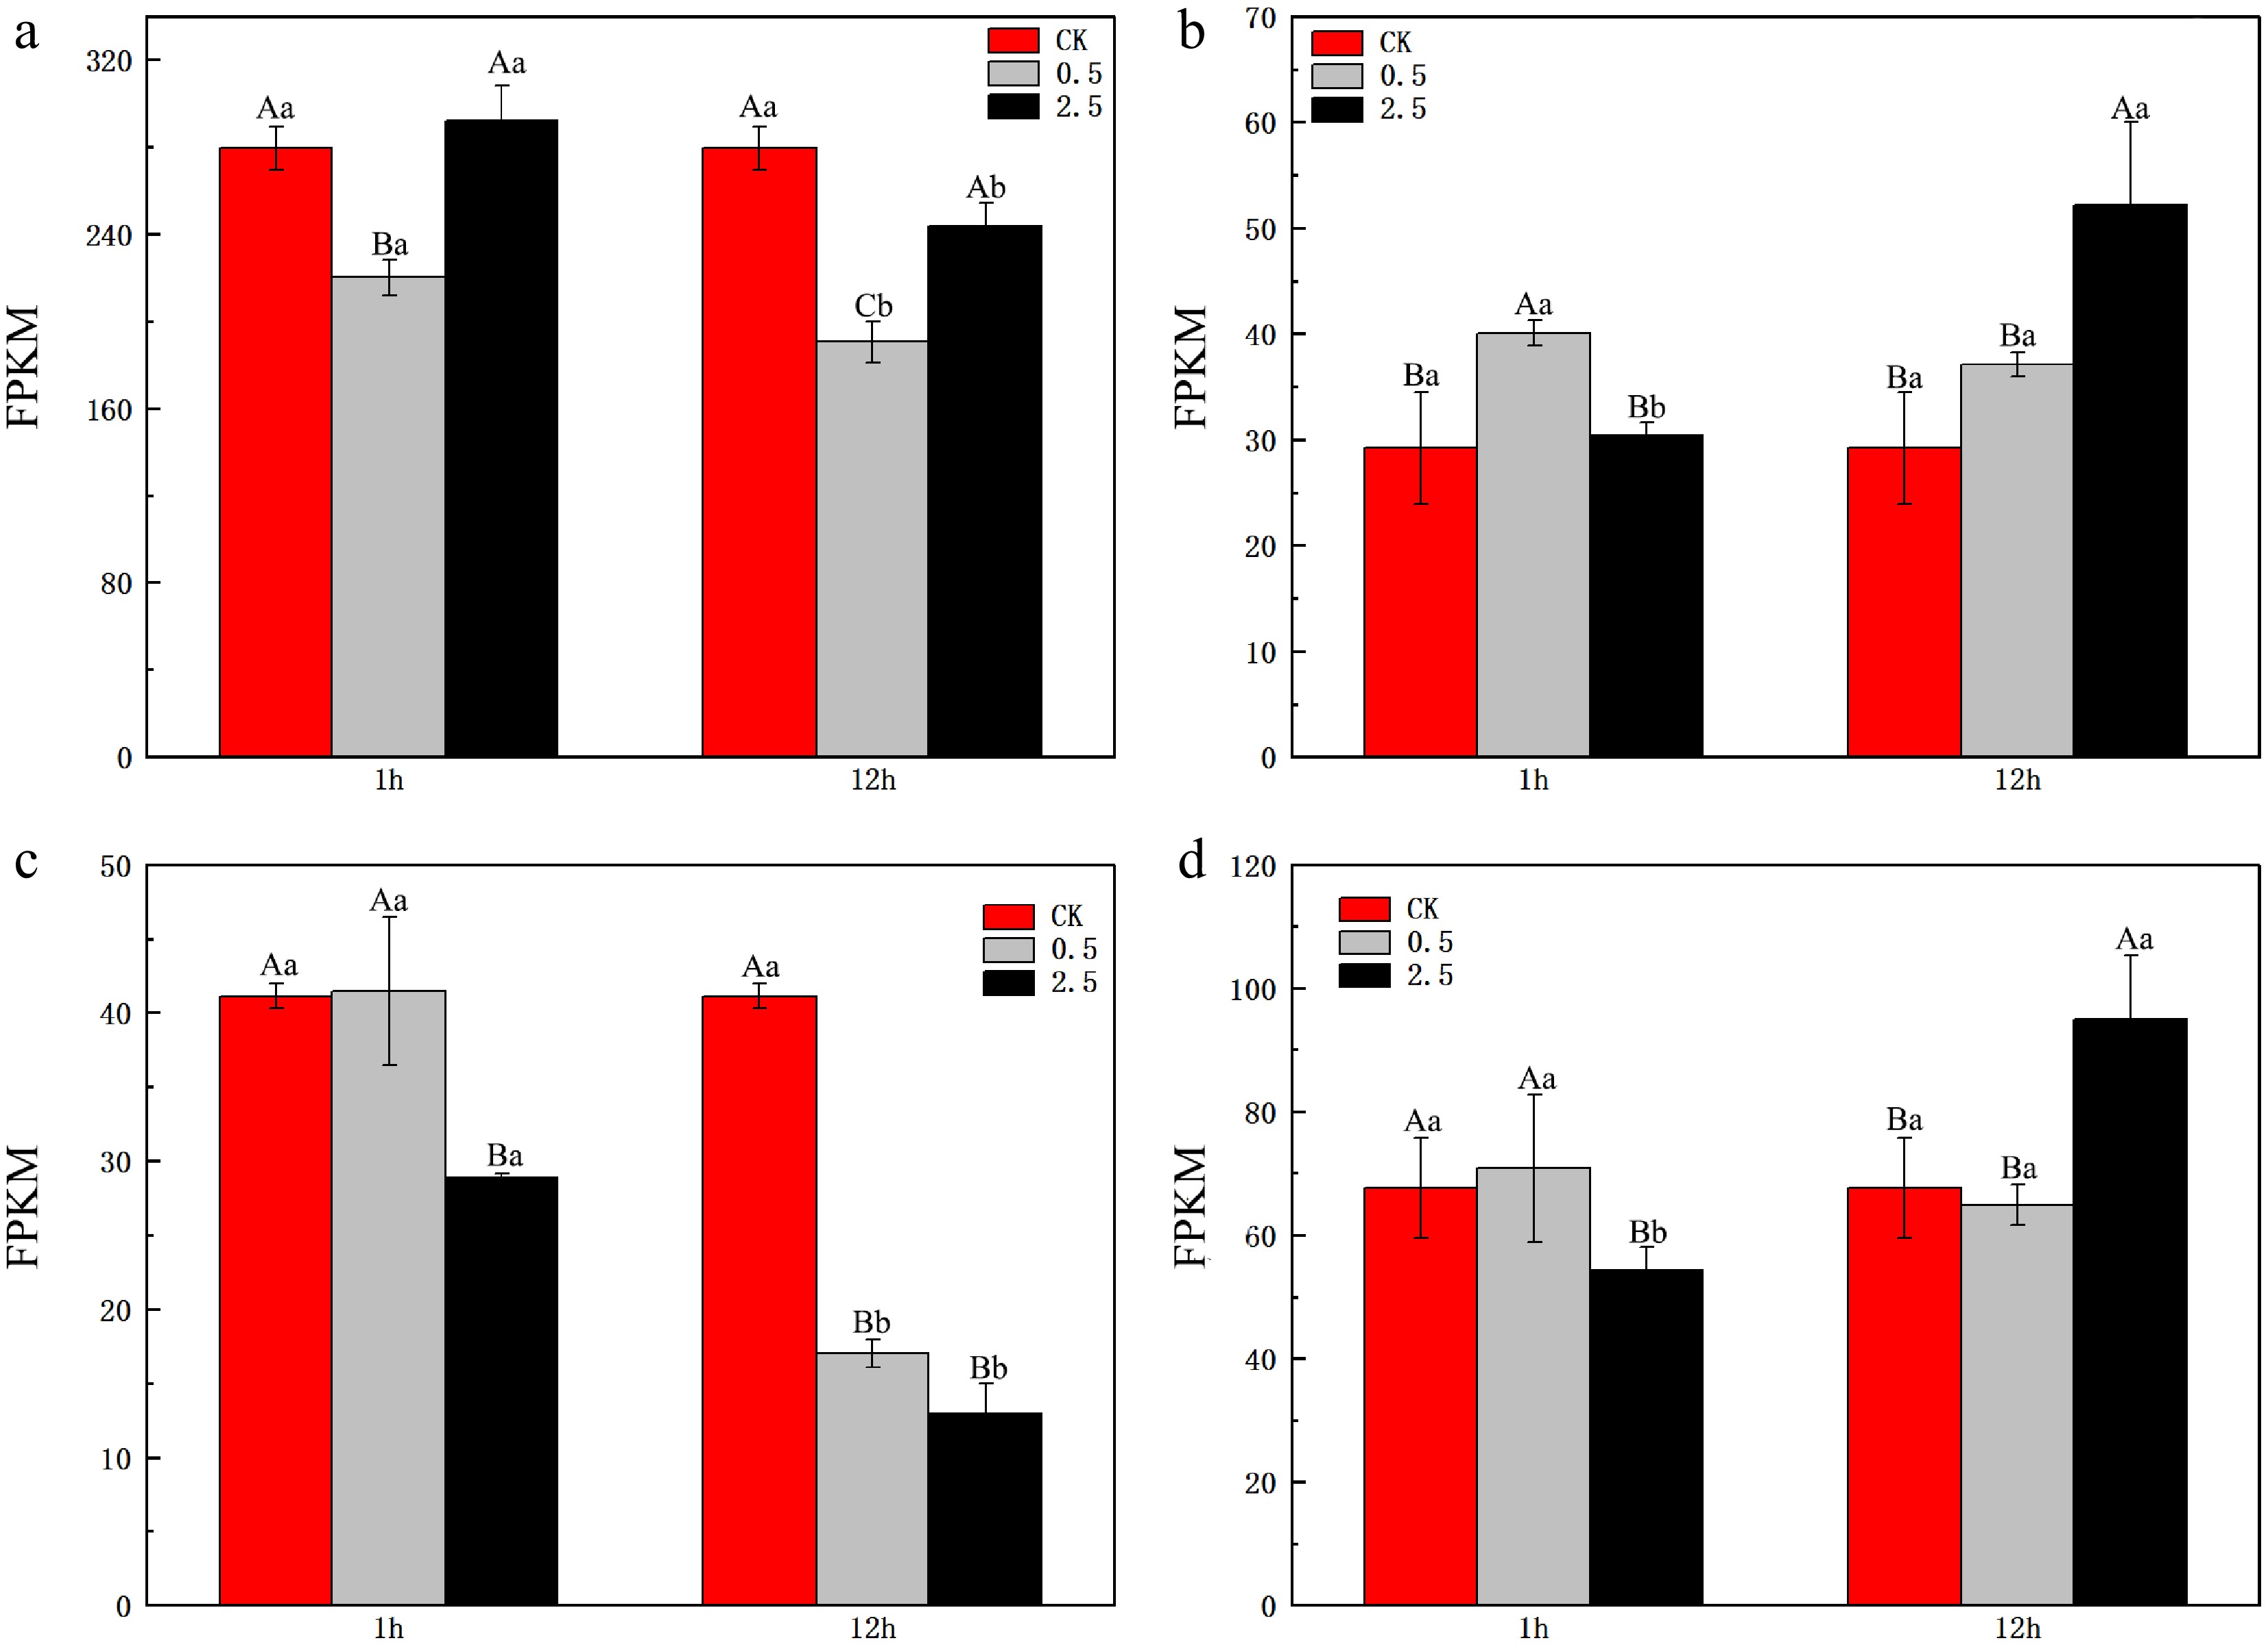
Figure 4.
Expression levels of GOGAT in the leaves and roots of L. ruthenicum under NaCl treatment. (a) Expression level of LrFd-GOGAT in leaf tissues. (b) Expression level of LrFd-GOGAT in root tissues. (c) Expression level of LrNADH-GOGAT in leaf tissues. (d) Expression level of LrNADH-GOGAT in root tissues. Different uppercase letters (A, B, C) within the same subfigure indicate statistically significant differences (p < 0.05) among samples within a group, while distinct lowercase letters (a, b, c) represent significant differences (p < 0.05) between different groups.
-
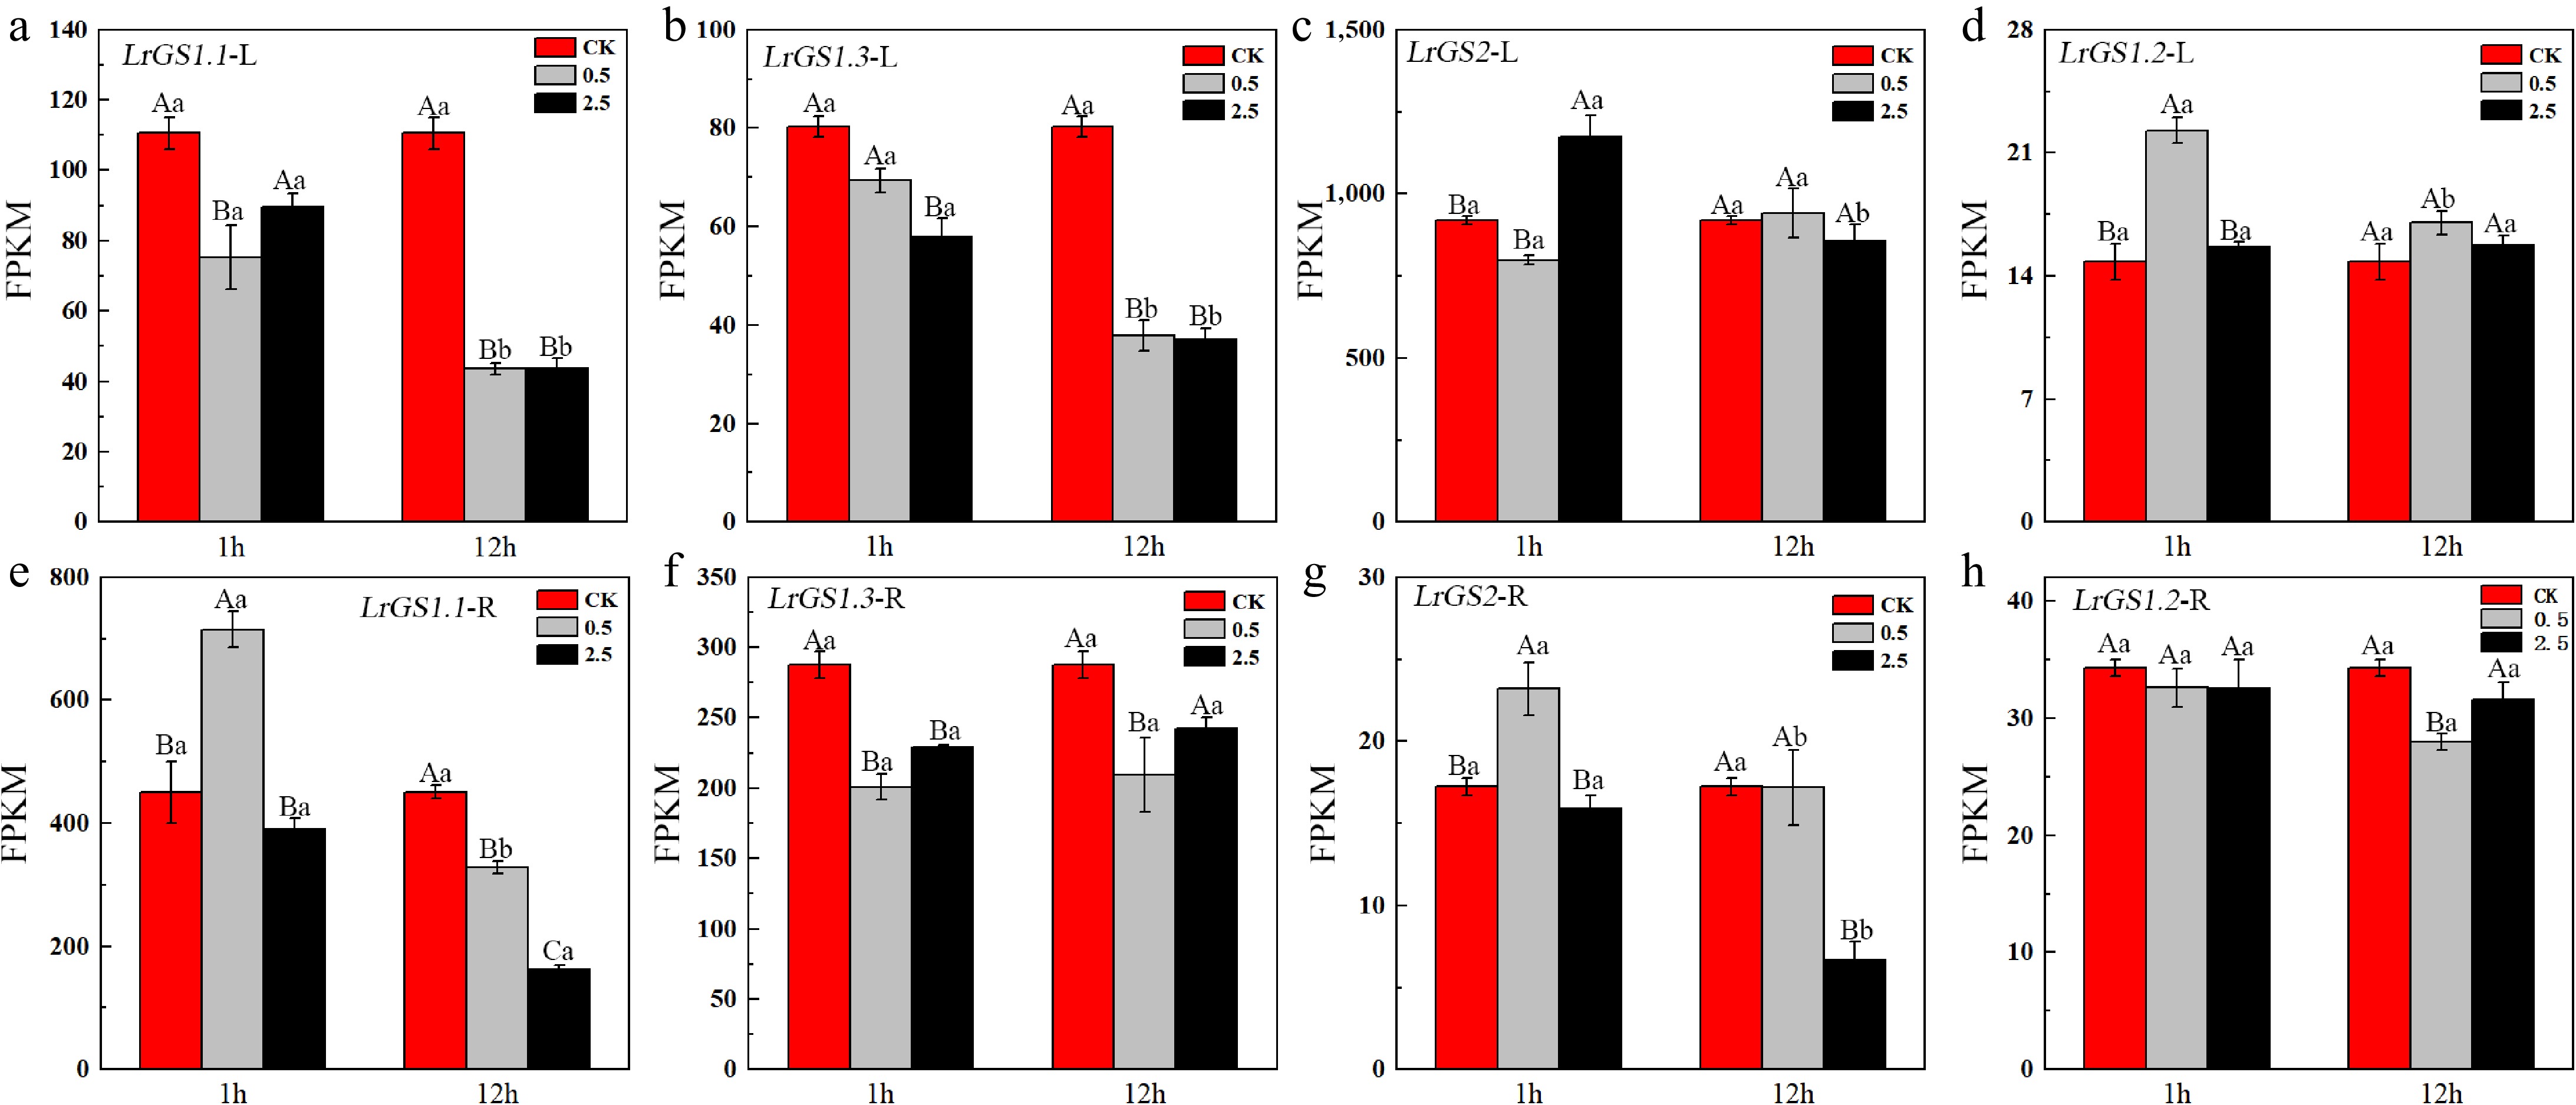
Figure 5.
Expression levels of GS in the leaves and roots of L. ruthenicum under NaCl treatment. Different uppercase letters (A, B, C) within the same subfigure indicate statistically significant differences (p < 0.05) among samples within a group, while distinct lowercase letters (a, b, c) represent significant differences (p < 0.05) between different groups. 'L' is leaf, 'R' is root.
-
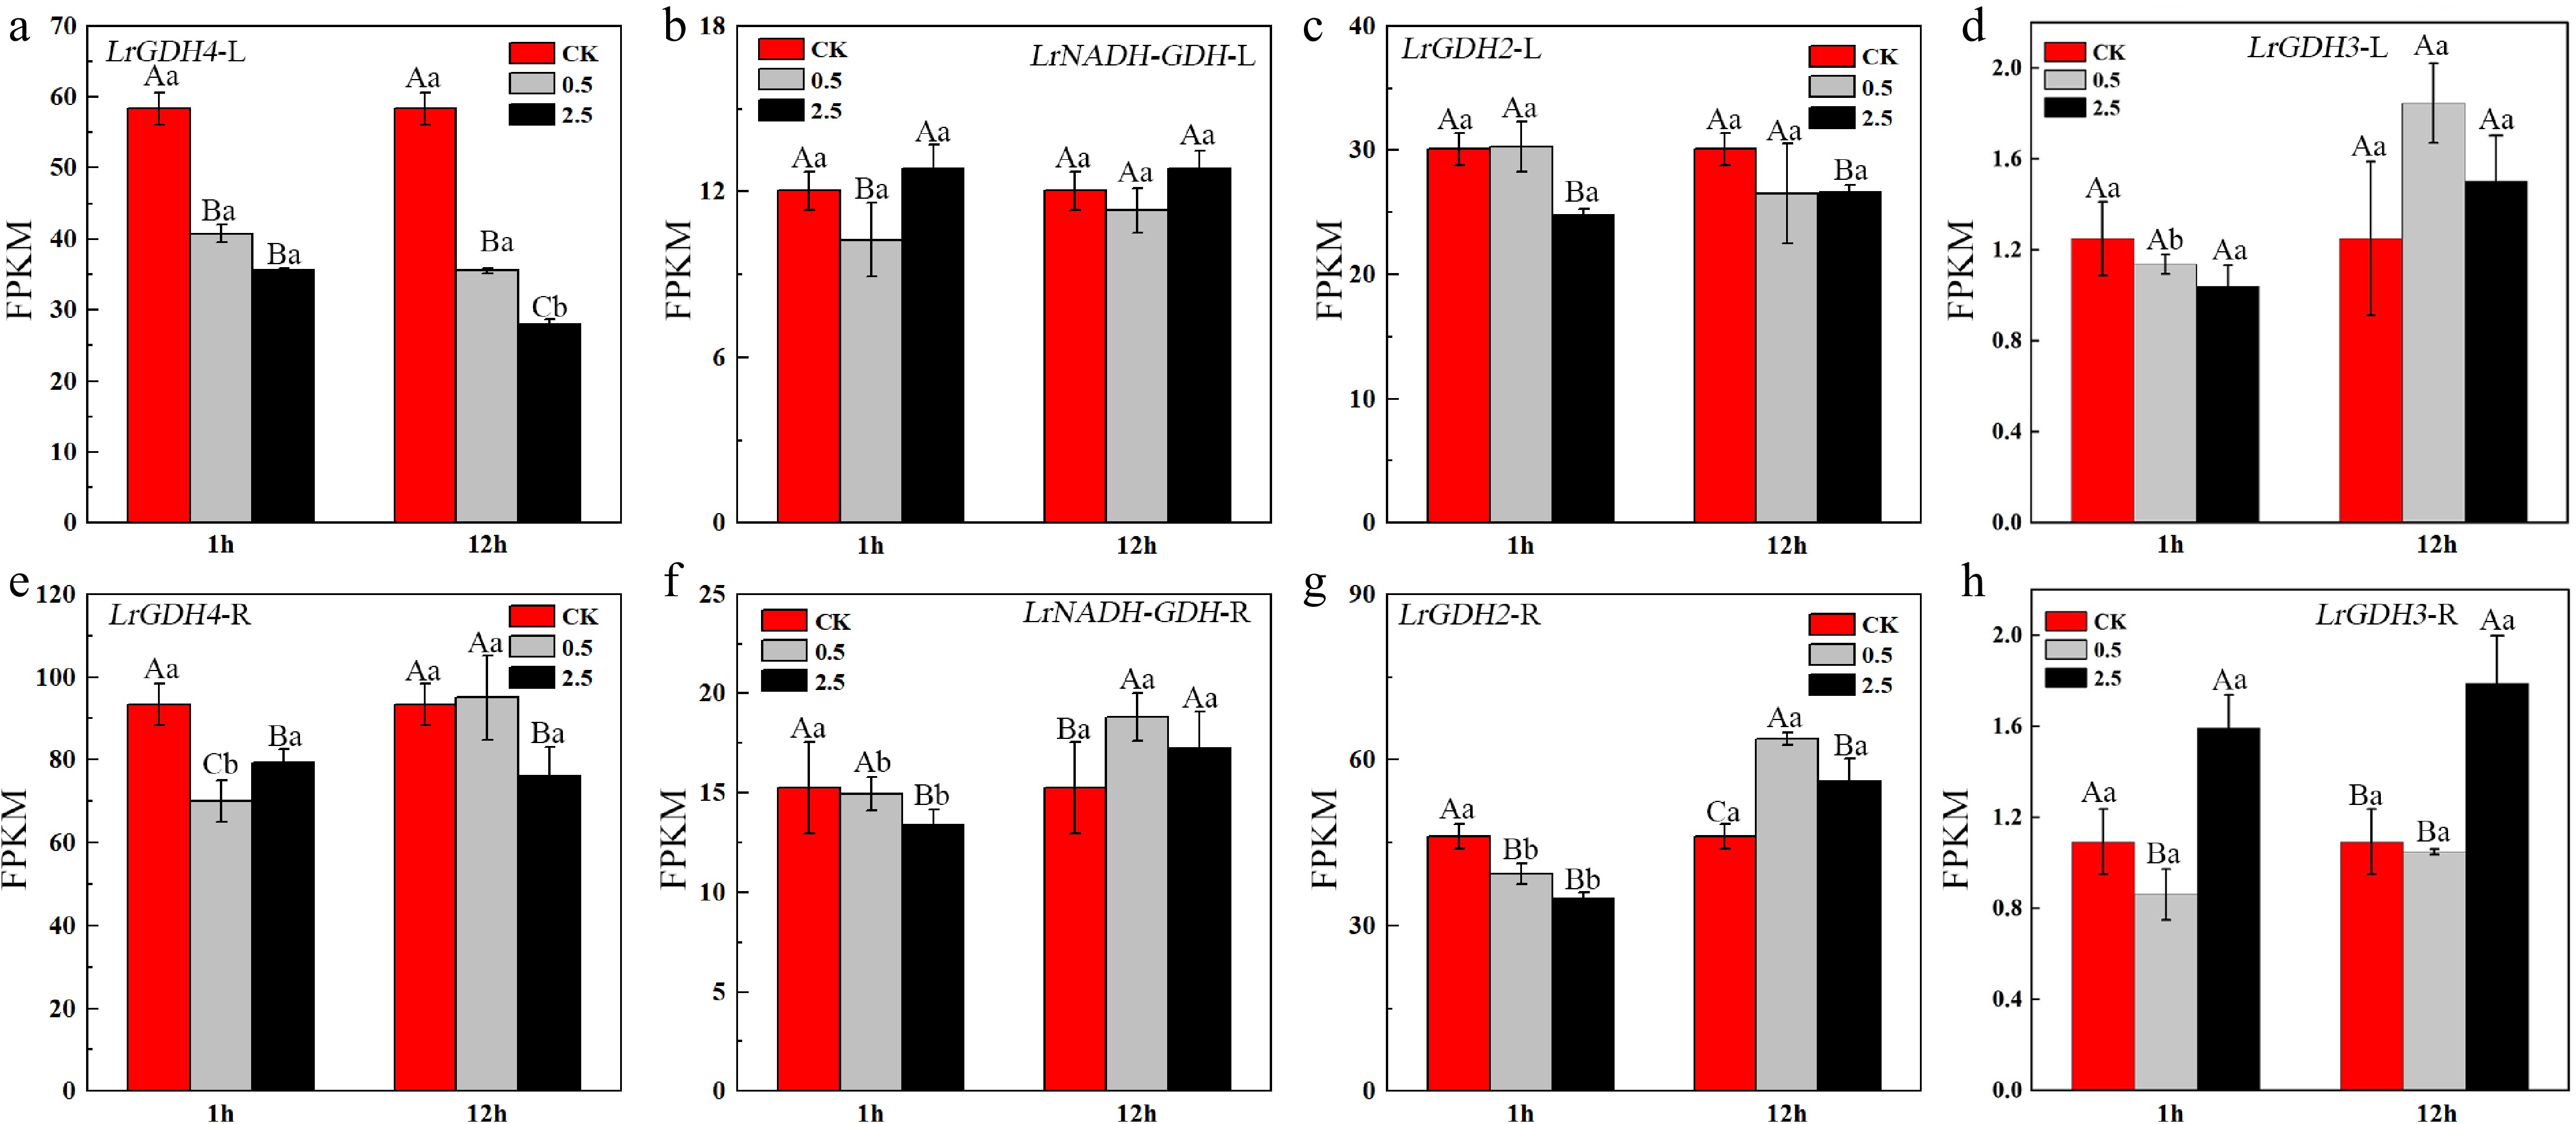
Figure 6.
Expression levels of GDH in the leaves and roots of L. ruthenicum under NaCl treatment. Different uppercase letters (A, B, C) within the same subfigure indicate statistically significant differences (p < 0.05) among samples within a group, while distinct lowercase letters (a, b, c) represent significant differences (p < 0.05) between different groups. 'L' is leaf, 'R' is root.
-
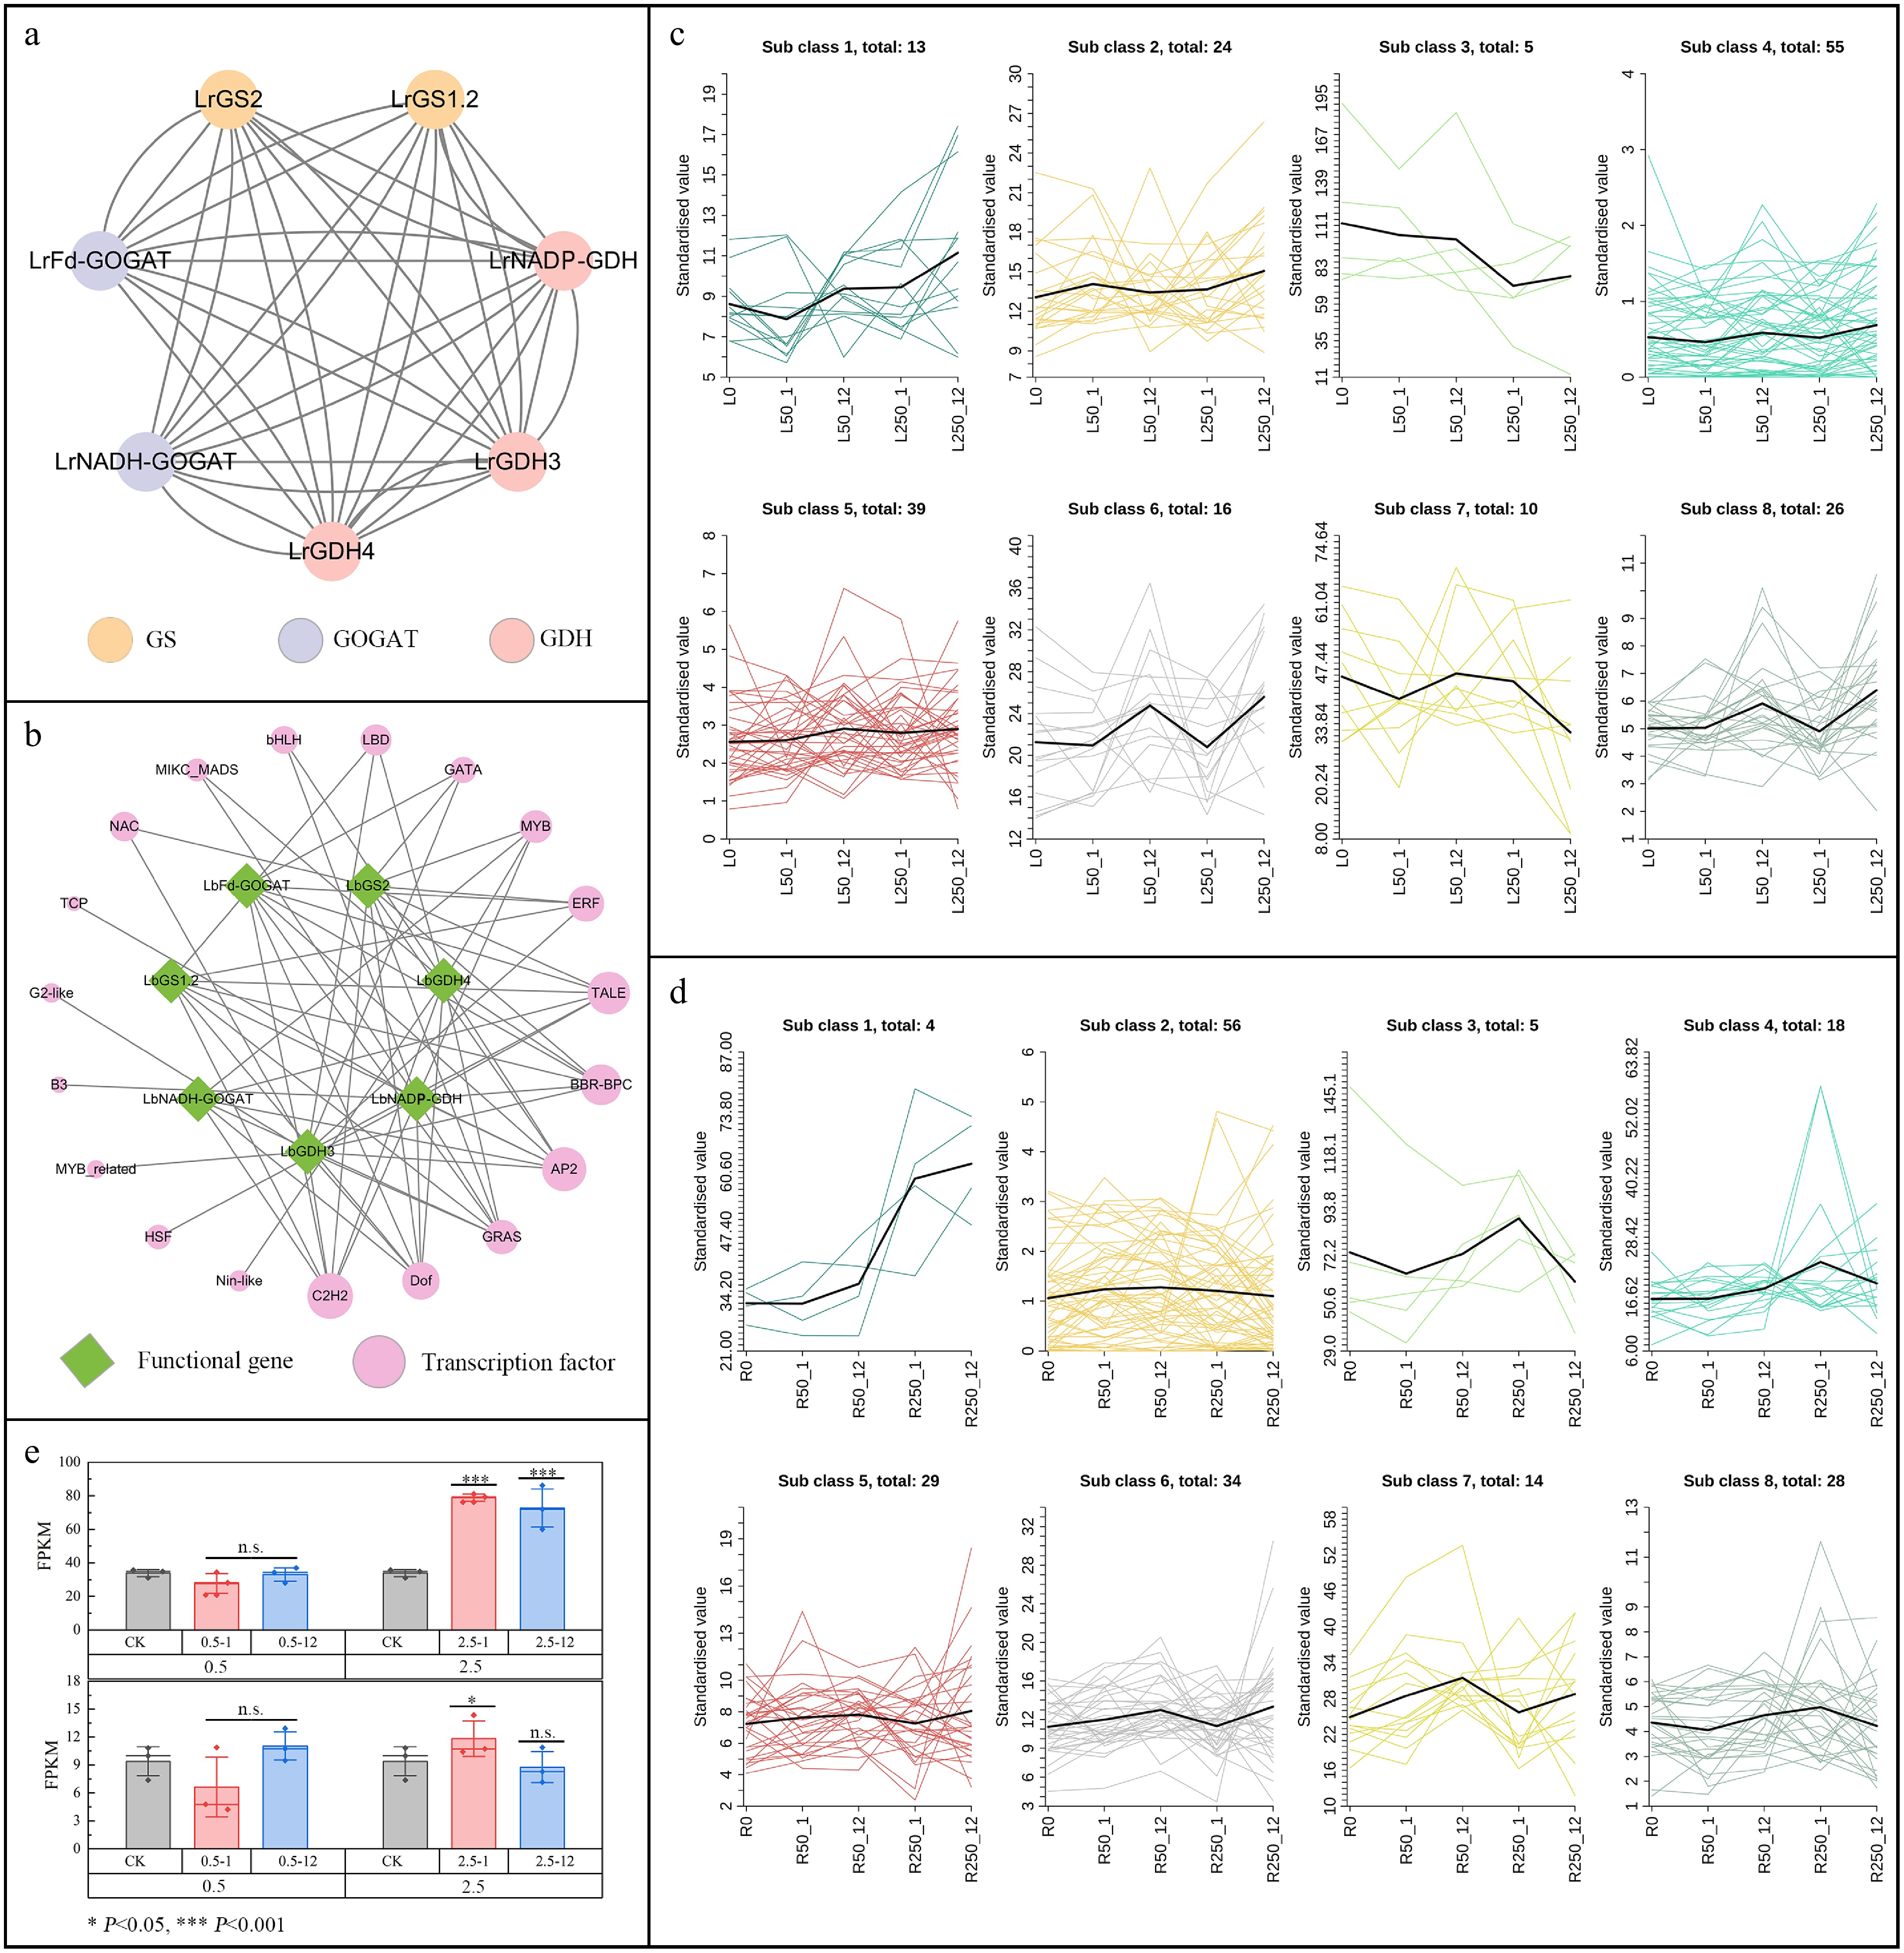
Figure 7.
Transcription regulatory network and correlation analysis of GOGAT, GS, and GDH in L. ruthenicum. (a) Protein interaction networks of GOGAT, GS, and GDH. (b) Transcription factor regulatory network for protein interaction. (c) Expression pattern of TFs under salt stress in leaves. (d) Expression pattern of TFs under salt stress in root. (e) Expression of C2H2-63 under salt stress.
-
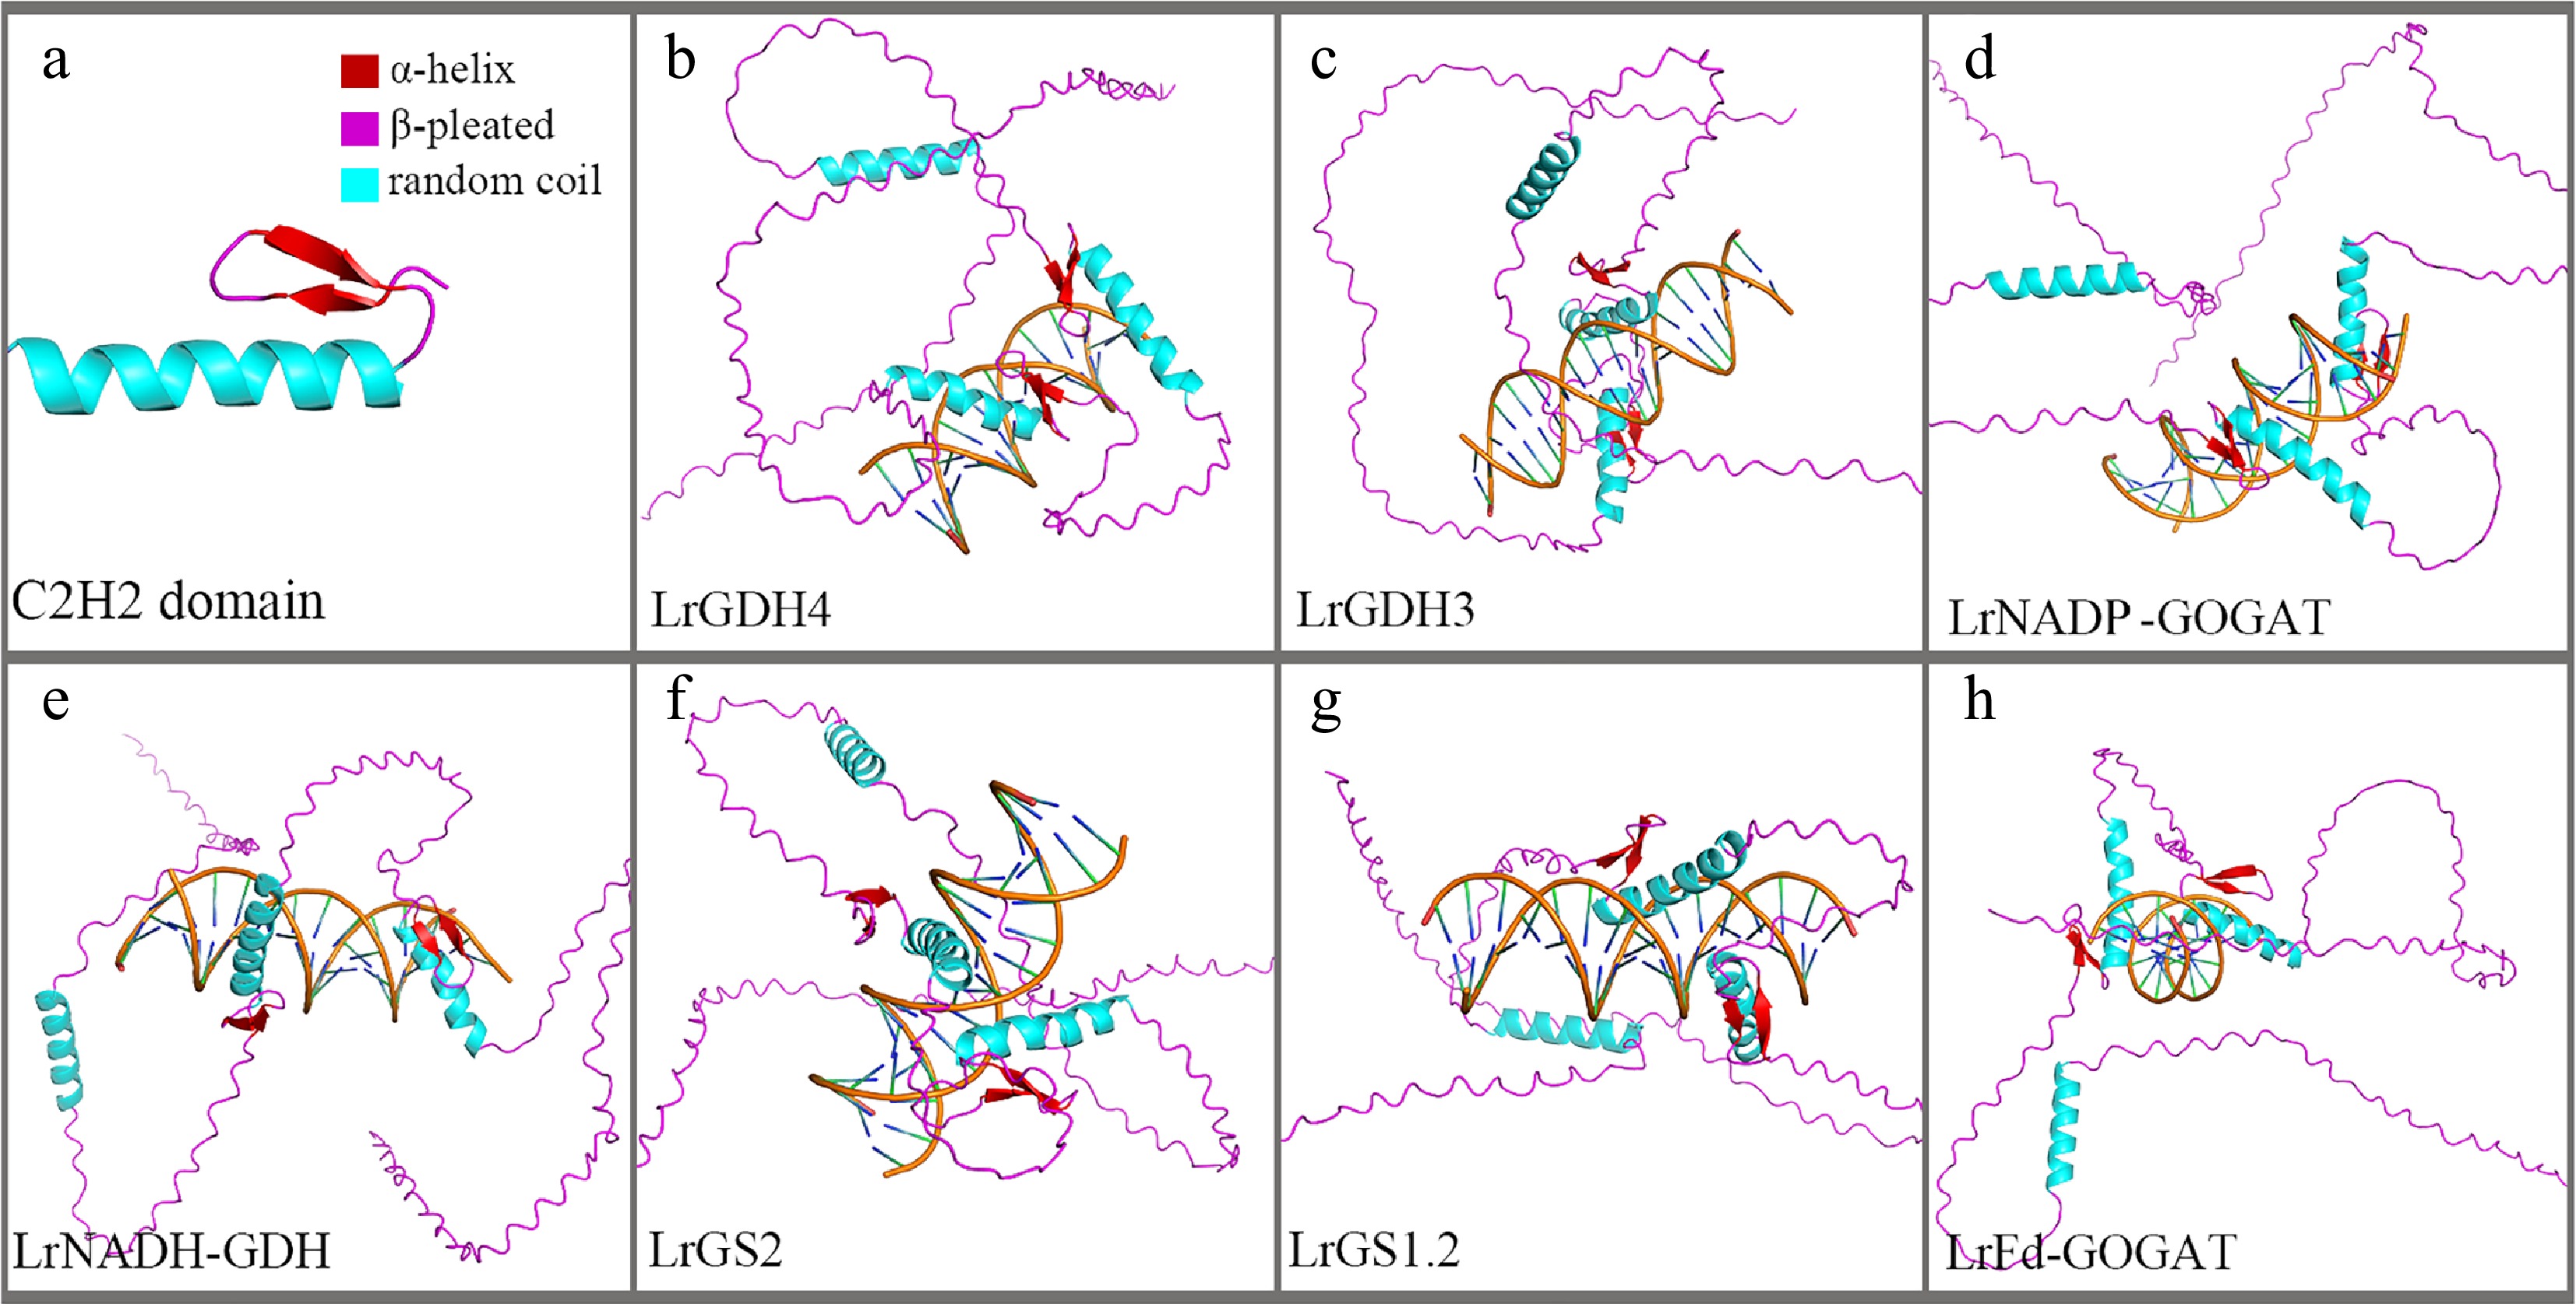
Figure 8.
TF-DNA docking diagram. (a) Tertiary structure of the C2H2 domain. (b)–(h) Binding conformations with promoter regions of different genes.
-
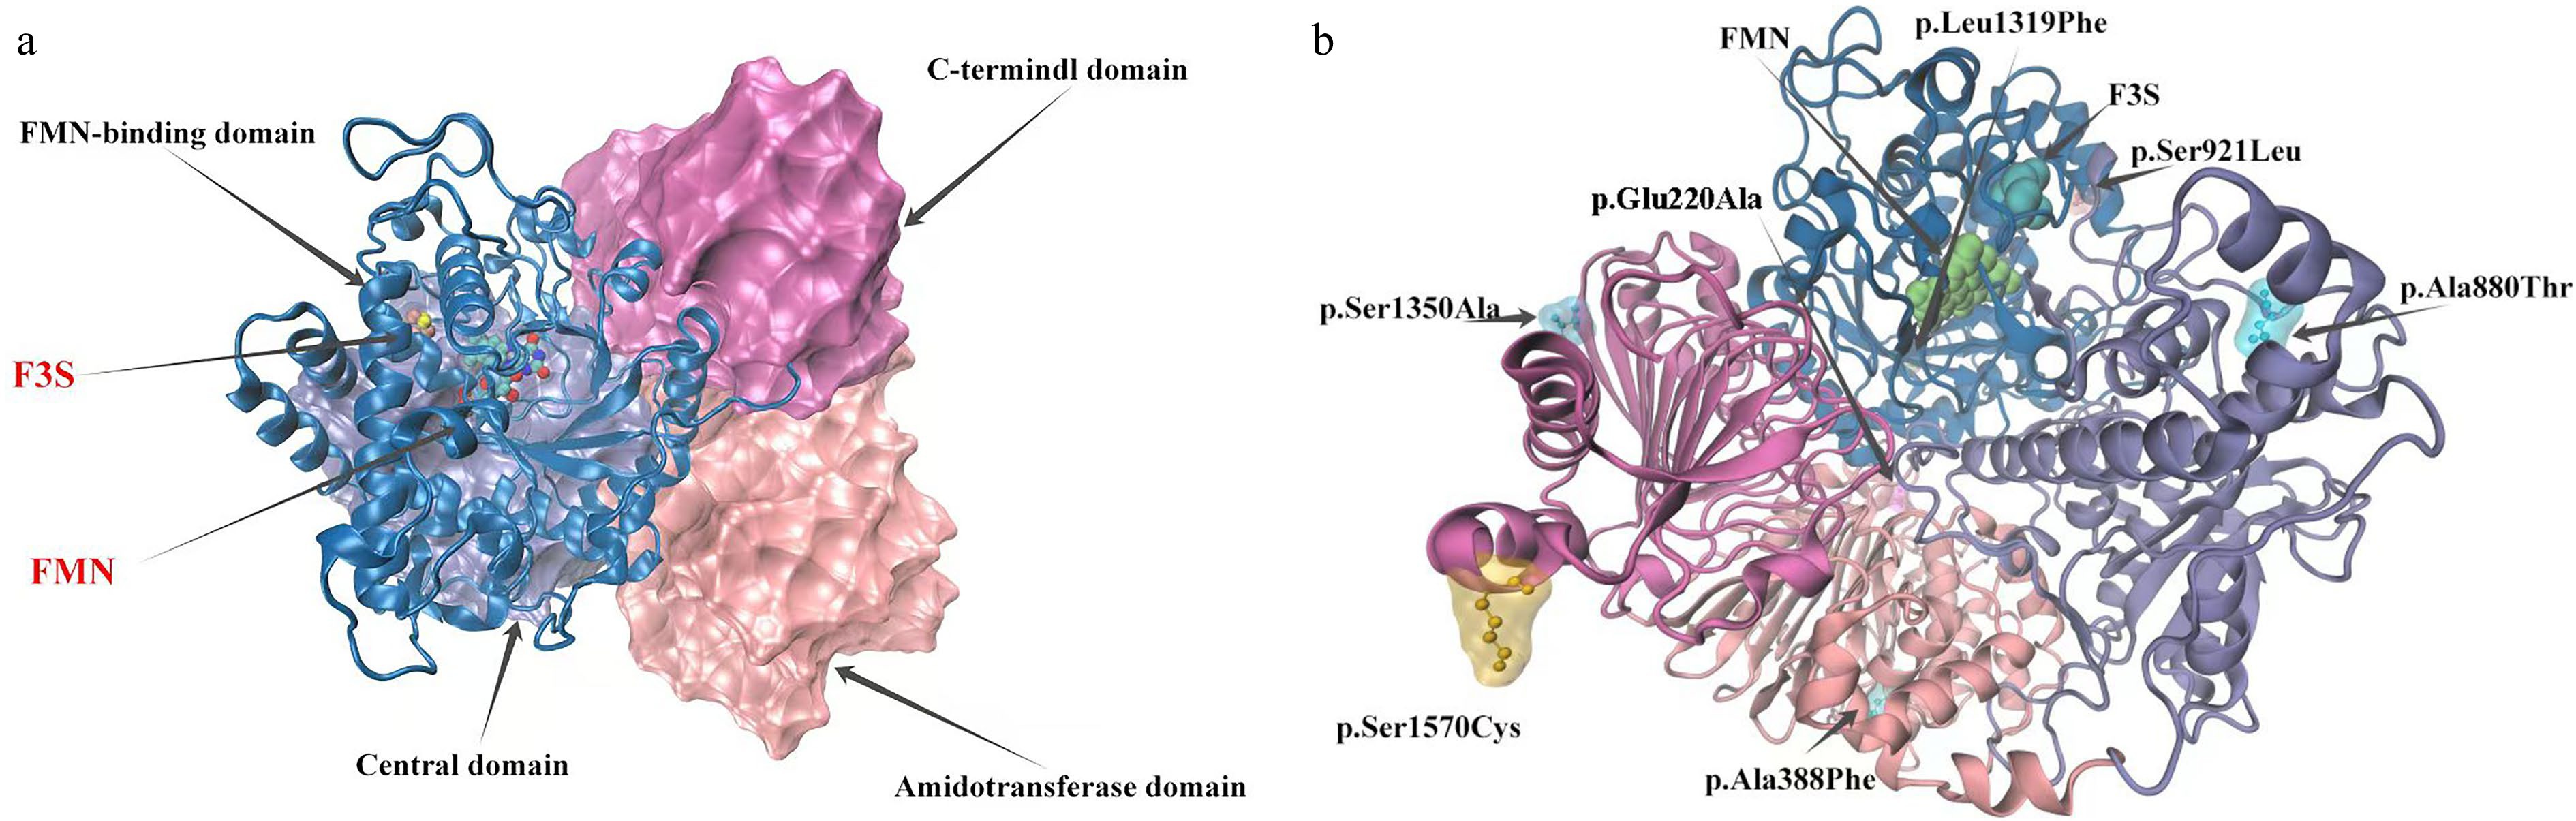
Figure 9.
Model of LrFd-GOGAT protein structure and distribution of mutation sites. (a) Structural model of the LrFd-GOGAT protein. (b) Distribution of amino acid mutation sites in the LrFd-GOGAT protein.
-
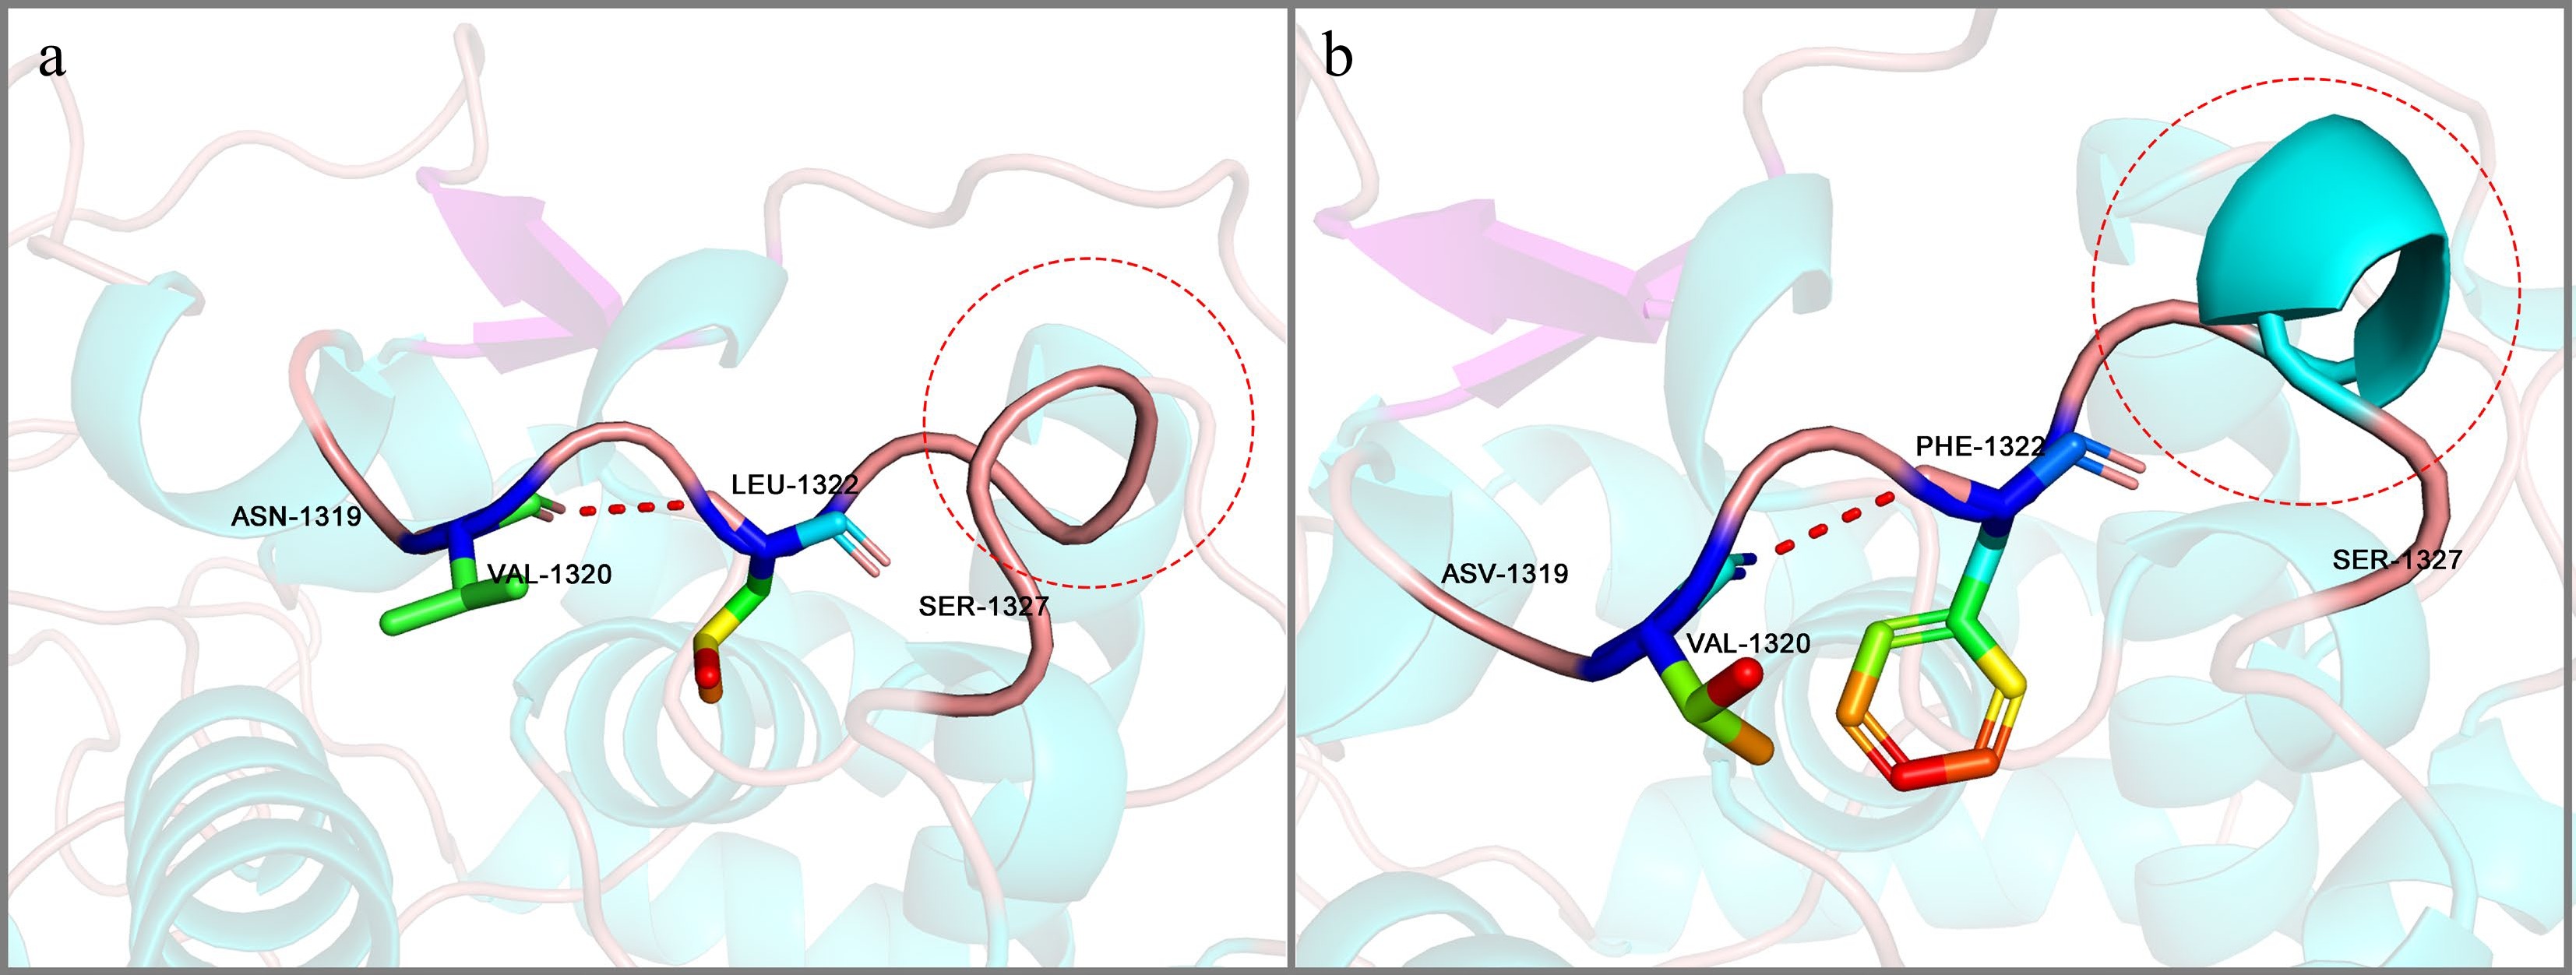
Figure 10.
Protein conformation at the p.Leu1322Phe position. (a) Conformational structure of the Leu 1322 region in LbFd-GOGAT. (b) Corresponding Phe1322 region conformation in LrFd-GOGAT.
-
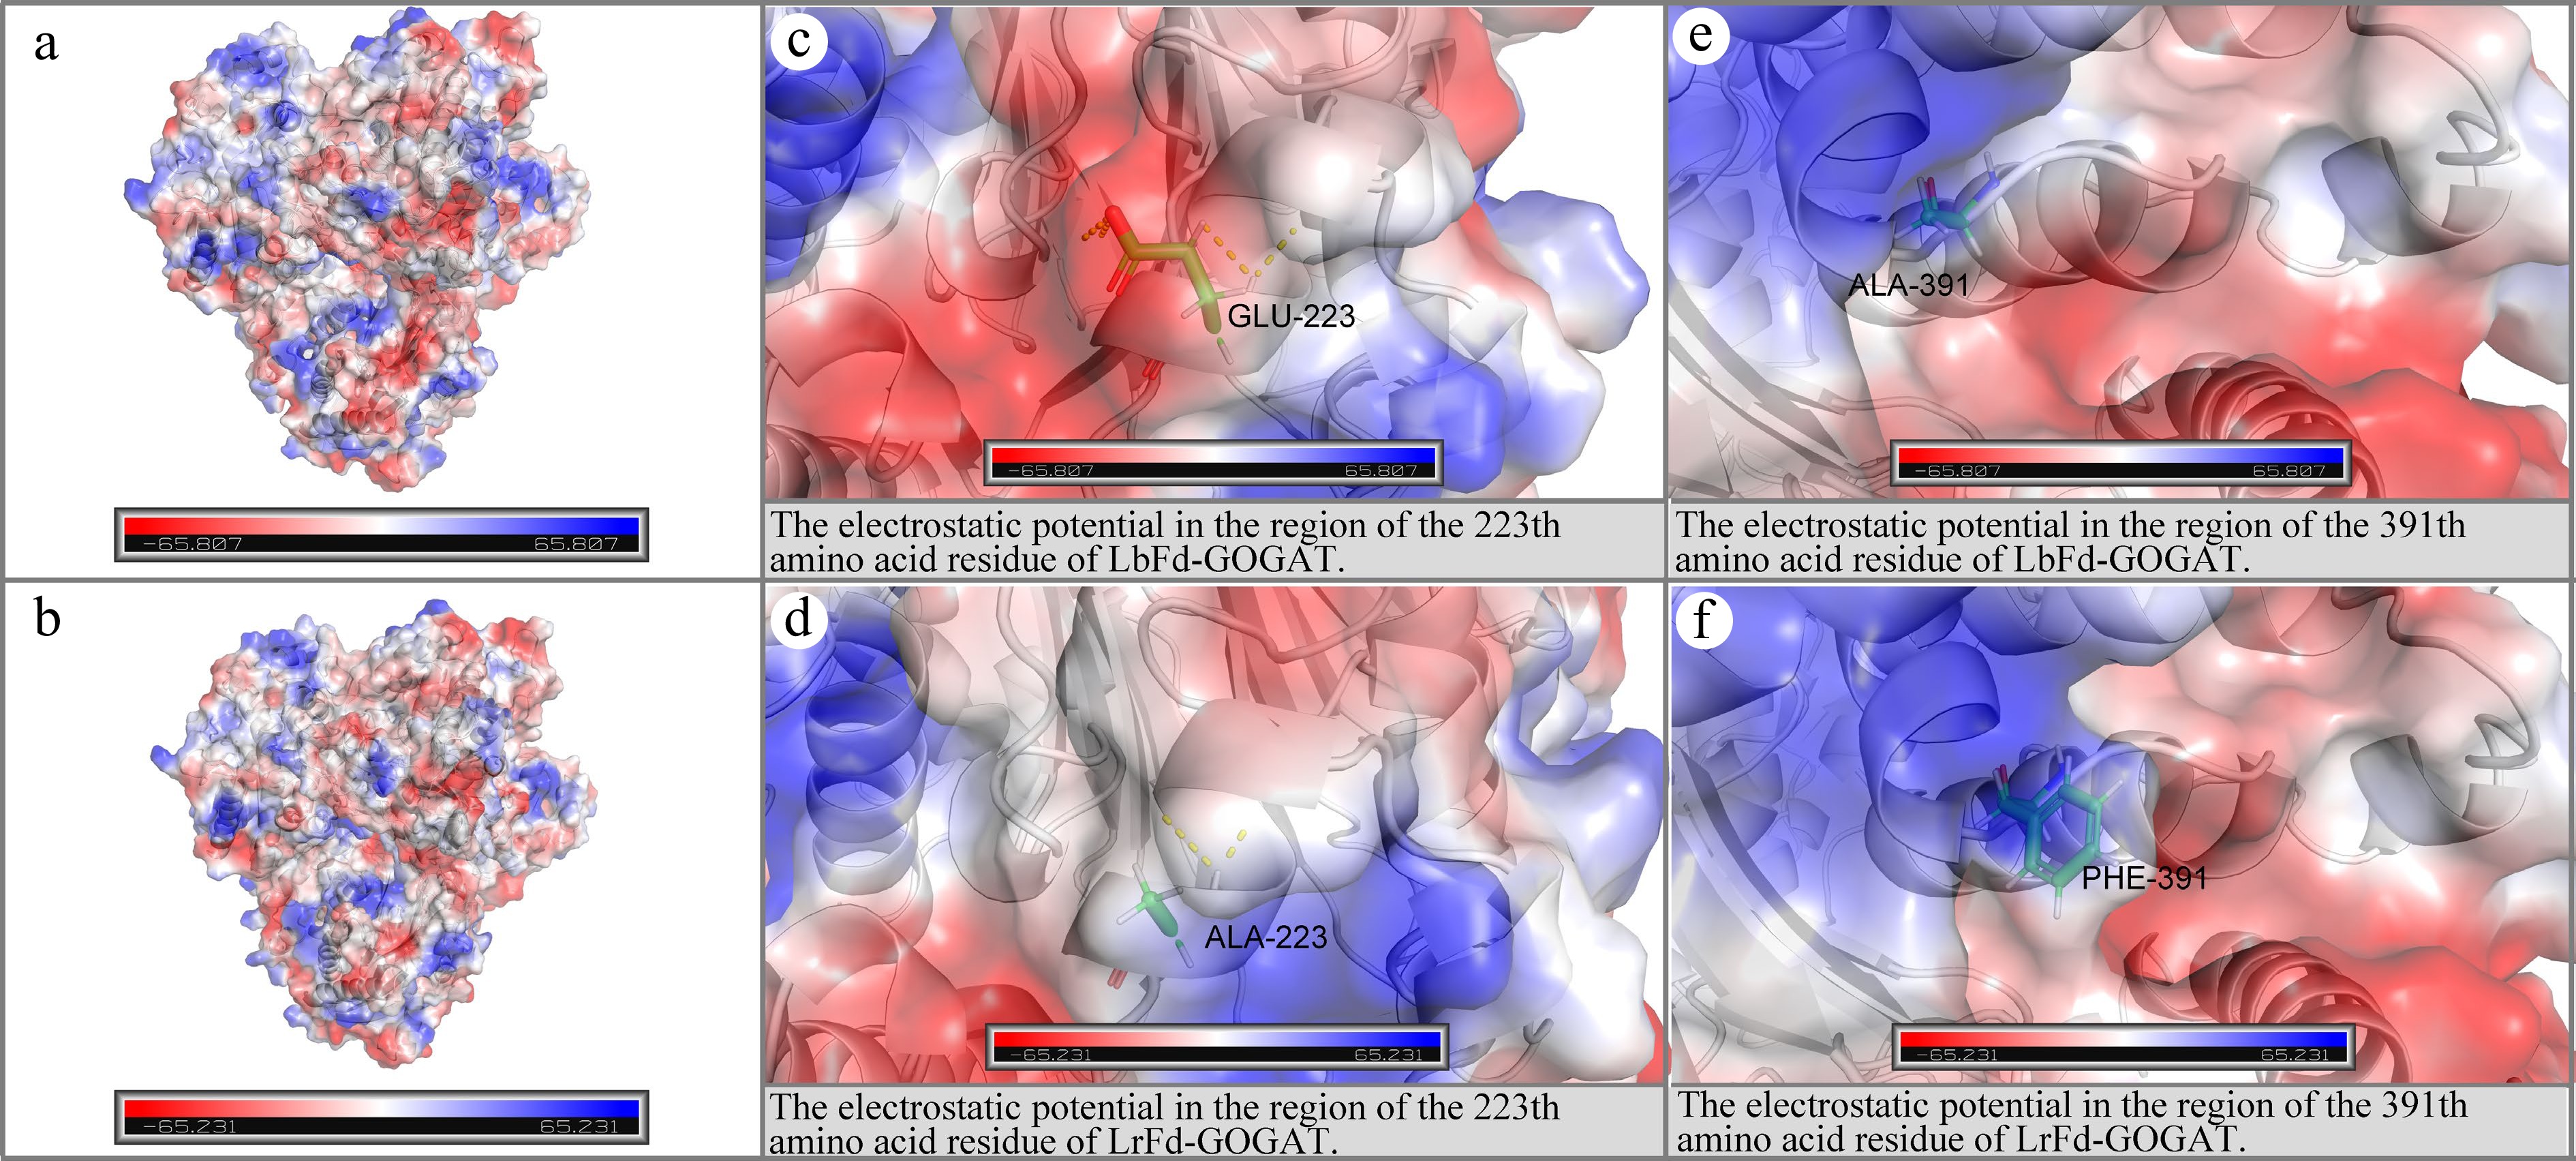
Figure 11.
Electrostatic potential distribution in the regions of p.Glu223Ala and p.Ala391Phe. (a) and (b) depict the electrostatic potential distributions on the molecular surfaces of LbFd-GOGAT and LrFd-GOGAT proteins, respectively; (c) and (d) present the localized electrostatic potential distributions surrounding residue 223 in LbFd-GOGAT and LrFd-GOGAT proteins; (e) and (f) illustrate the electrostatic potential profiles near residue 391 in LbFd-GOGAT and LrFd-GOGAT proteins.
-
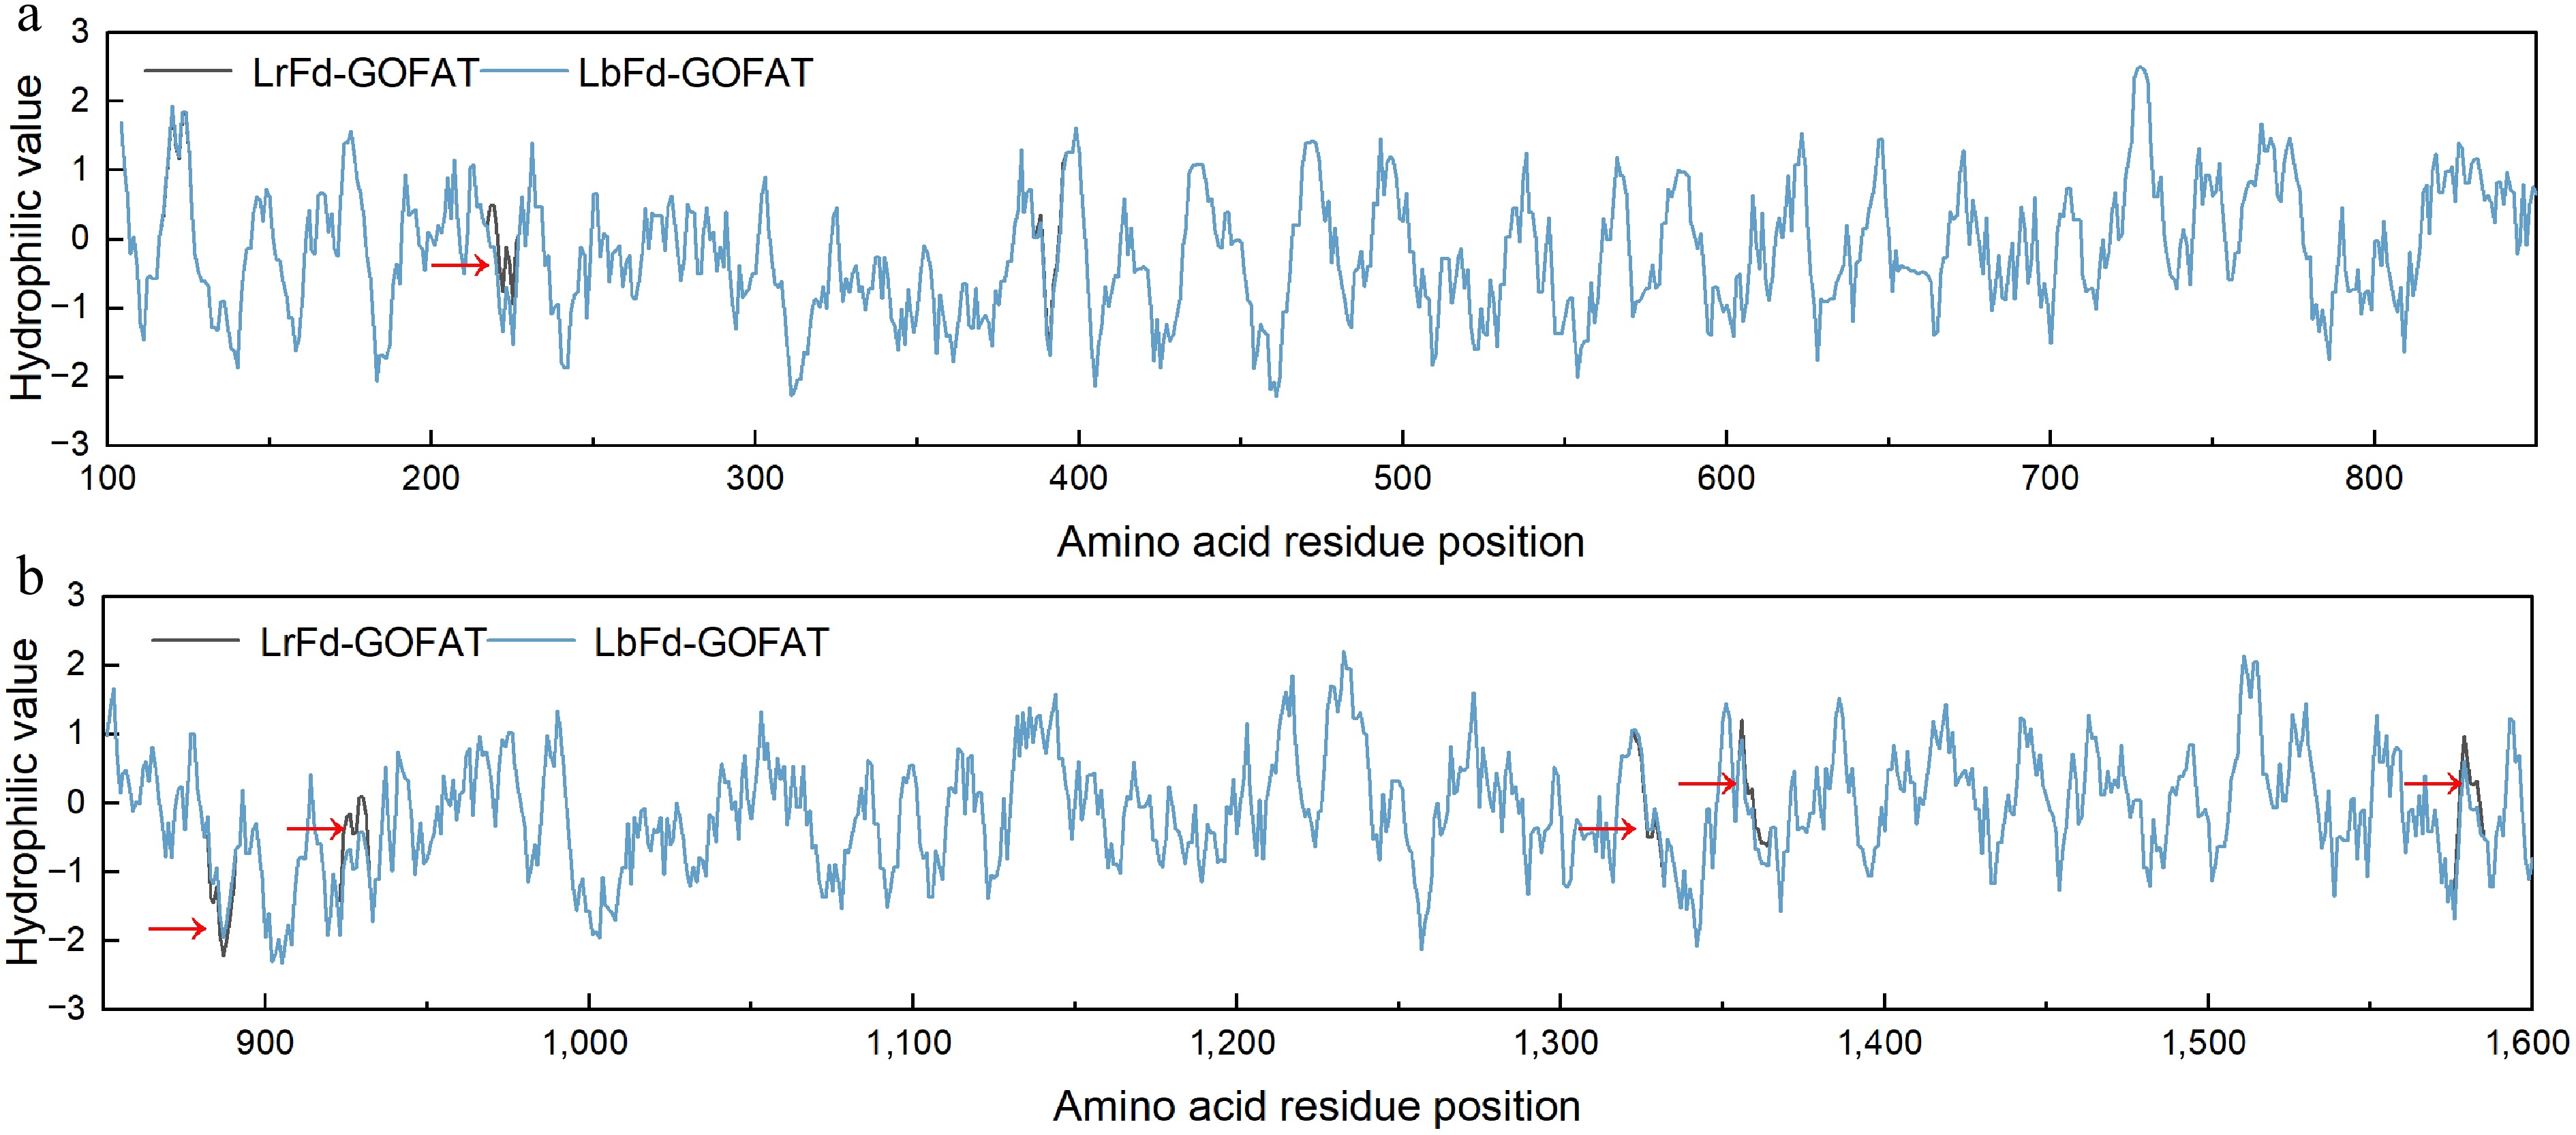
Figure 12.
Hydrophilicity distribution of amino acid residues in LrFd-GOGAT and LbFd-GOGAT proteins. (a) and (b) display the hydrophilicity profiles of amino acid residues 100–850 and 851–1,600, respectively.
-
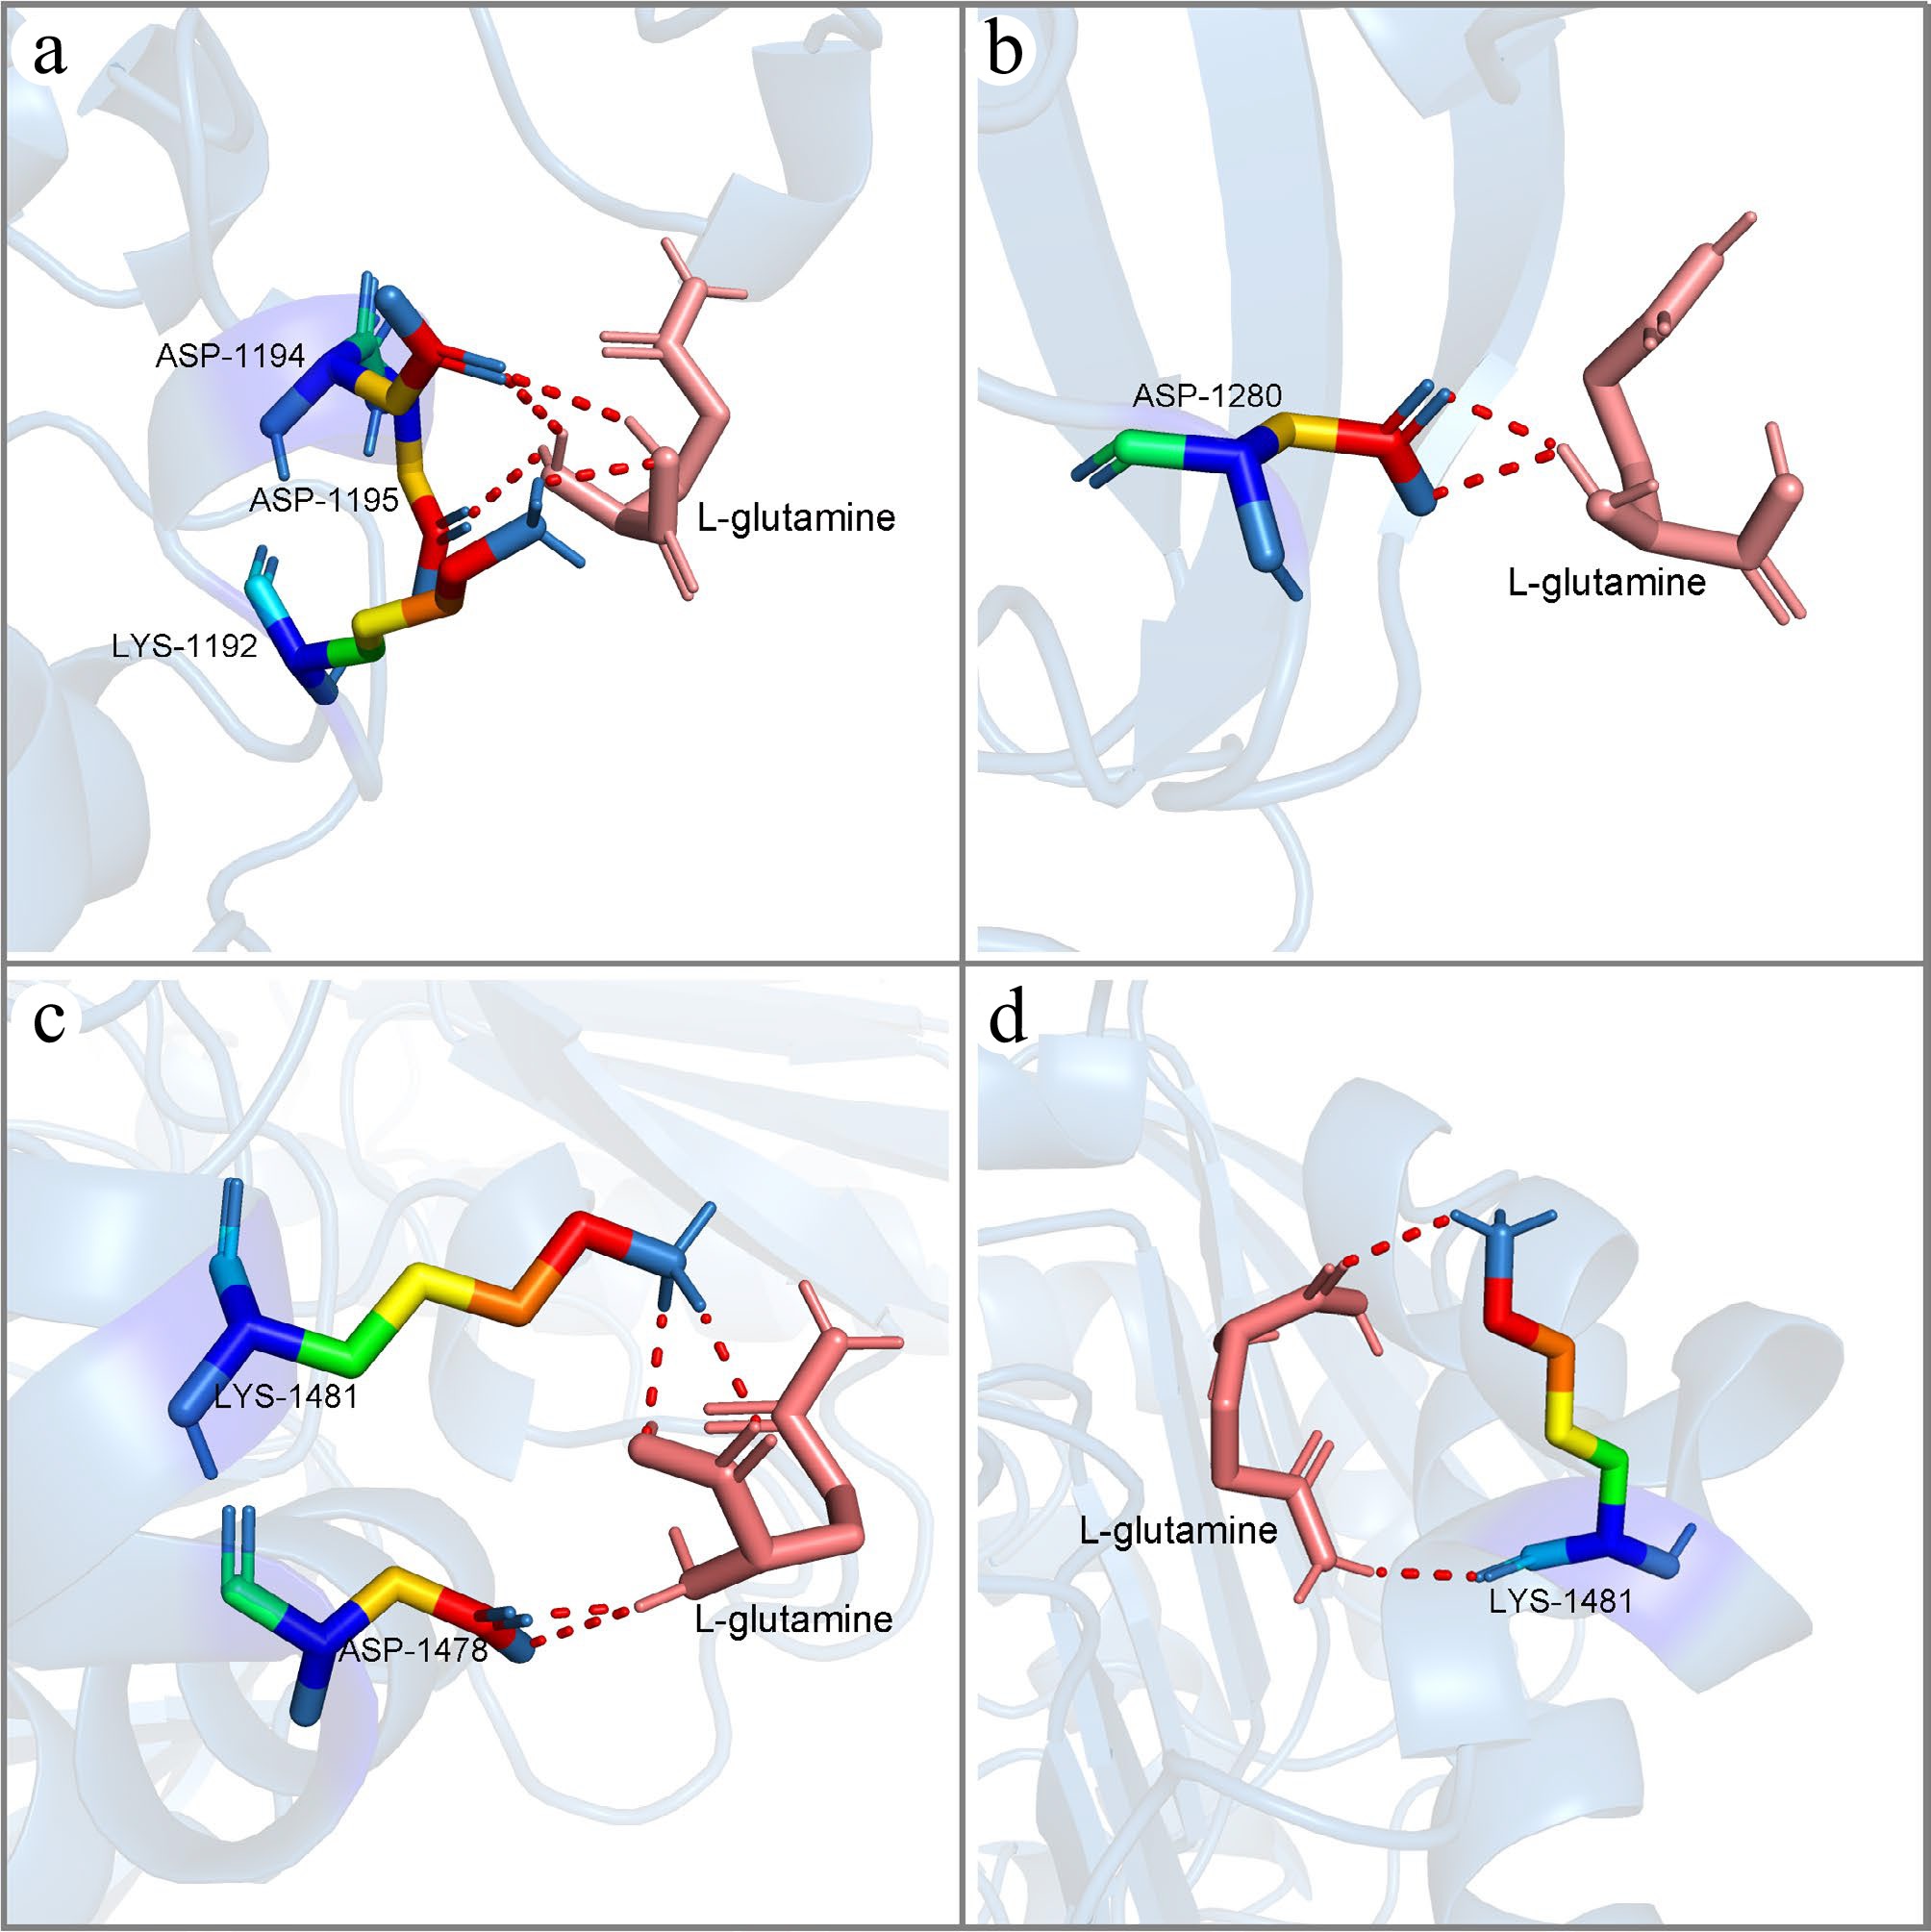
Figure 13.
The molecular conformations of LrFd-GOGAT and LbFd-GOGAT in docking with L-glutamine. (a) and (b) show the two lowest binding energy conformations of LbFd-GOGAT docked with L-glutamine, respectively; (c) and (d) show the two lowest binding energy conformations of LrFd-GOGAT docked with L-glutamine, respectively.
-
Polypeptide chain No. of
amino acidsMolecular weight (Da) pI GRAVY Instability index LrFd-GOGAT 1,623 176,983.22 6.25 −0.15 38.04 LbFd-GOGAT 1,623 176,889.00 6.20 −0.16 38.09 LcFd-GOGAT 1,621 176,704.76 6.11 −0.16 37.80 WfFd-GOGAT 1,623 176,889.00 6.20 −0.16 38.09 LfFd-GOGAT 1,623 176,874.97 6.20 −0.16 38.42 LrNADH-GOGAT 2,208 243,143.78 6.35 −0.28 35.69 LbNADH-GOGAT 2,208 241,918.47 6.31 −0.27 35.85 LcNADH-GOGAT 2,208 241,933.38 6.31 −0.28 35.77 LfNADH-GOGAT 2,205 241,521.06 6.34 −0.28 35.21 WfNADH-GOGAT 2,208 241,913.43 6.34 −0.28 35.85 LbGDH4 411 44,519.79 6.09 −0.16 21.28 LcGDH4 411 44,461.75 6.23 −0.15 20.21 LfGDH4 411 44,504.78 6.23 −0.16 20.21 WfGDH4 411 44,505.76 6.09 −0.16 20.21 LrGDH4 411 44,505.76 6.09 −0.16 20.21 LbNADP-GDH 634 70,618.20 6.65 −0.43 36.73 LfNADP-GDH 634 70,473.98 6.65 −0.43 36.80 LcNADP-GDH 634 70,618.20 6.65 −0.43 36.73 WfNADP-GDH 634 70,634.26 6.65 −0.43 36.30 LrNADP-GDH 634 70,537.10 6.65 −0.43 37.83 LbGDH2 411 44,872.37 6.51 −0.19 20.26 LfGDH2 411 44,886.40 6.51 −0.19 21.51 LcGDH2 411 44,696.36 6.90 −0.15 21.85 WfGDH2 411 44,814.42 8.07 −0.20 21.41 LrGDH2 411 44,755.46 7.65 −0.15 22.13 LrGDH3 411 44,862.38 6.64 −0.19 19.86 LbGDH3 411 44,563.22 7.21 −0.13 21.25 LfGS2 432 47,523.80 6.12 −0.38 42.33 LbGS2 432 47,536.88 6.48 −0.38 42.06 LrGS2 432 47,564.89 6.28 −0.38 42.79 WfGS2 432 47,564.94 6.48 −0.37 42.06 LcGS2 432 47,549.92 6.73 −0.37 40.96 WfGS1.1 356 38,962.82 5.51 −0.44 37.46 LcGS1.1 356 39,160.12 5.65 −0.45 41.05 LrGS1.1 356 39,076.99 5.65 −0.45 39.67 LfGS1.1 356 39,061.03 5.65 −0.44 38.92 LbGS1.1 356 39,161.11 5.53 −0.45 41.13 LrGS1.2 356 39,076.99 5.65 −0.45 39.67 LfGS1.2 356 39,001.00 5.65 −0.40 38.53 LbGS1.2 356 39,005.03 5.79 −0.40 38.10 LbGS1.3 356 38,958.82 5.50 −0.43 37.77 LfGS1.3 356 39,003.82 5.50 −0.46 38.54 LrGS1.3 356 38,972.89 5.61 −0.43 37.46 LcGS1.3 356 39,005.03 5.79 −0.40 38.10 Table 1.
Biophysicochemical properties of GOGAT proteins in the Lycium genus.
-
Gene Mode Estimates of parameters NP InL χ2 df p LrFd-GOGAT Model A0 Proportion 0.79 0.07 0.13 0.01 Background w 0.00 1.00 0.00 1.00 11 −6783.17 Model A0 vs Model A1 Foreground w 0.00 1.00 1.00 1.00 6.2 1 0.01 Model A1 Proportion 0.99 0.00 0.01 0.00 Background w 0.07 1.00 0.07 1.00 12 −6780.07 Foreground w 0.07 1.00 65.77 65.77 LrNADH-GOGAT Model A0 Proportion 0.90 0.10 0.00 0.00 Background w 0.00 1.00 0.00 1.00 15 −9501.4 Model A0 vs Model A1 Foreground w 0.00 1.00 1.00 1.00 0 1 1 Model A1 Proportion 0.90 0.10 0.00 0.00 Background w 0.00 1.00 0.00 1.00 16 −9501.4 Foreground w 0.00 1.00 1.00 1.00 LrGDH2 Model A0 Proportion 0.82 0.07 0.10 0.01 Background w 0.05 1.00 0.05 1.00 15 −2448.84 Model A0 vs Model A1 Foreground w 0.05 1.00 1.00 1.00 0 1 1 Model A1 Proportion 0.90 0.08 0.02 0.00 Background w 0.05 1.00 0.05 1.00 16 −2448.84 Foreground w 0.05 1.00 1.00 1.00 LrGDH3 Model A0 Proportion 0.92 0.08 0.00 0.00 Background w 0.05 1.00 0.05 1.00 15 −2,889.45 Model A0 vs Model A1 Foreground w 0.05 1.00 1.00 1.00 0 1 1 Model A1 Proportion 0.91 0.08 0.01 0.00 Background w 0.05 1.00 0.04 1.00 16 −2889.45 Foreground w 0.05 1.00 1.00 1.00 LrNADP-GDH Model A0 Proportion 0.85 0.15 0.00 0.00 Background w 0.00 1.00 0.00 1.00 11 −2755.77 Model A0 vs Model A1 Foreground w 0.00 1.00 1.00 1.00 0 1 1 Model A1 Proportion 0.85 0.15 0.00 0.00 Background w 0.00 1.00 0.00 1.00 12 −2755.77 Foreground w 0.00 1.00 1.00 1.00 LrGDH4 Model A0 Proportion 0.93 0.07 0.00 0.00 Background w 0.00 1.00 0.00 1.00 11 −1713.21 Model A0 vs Model A1 Foreground w 0.00 1.00 1.00 1.00 0 1 1 Model A1 Proportion 0.93 0.07 0.00 0.00 Background w 0.00 1.00 0.00 1.00 12 −1713.21 Foreground w 0.00 1.00 1.00 1.00 LrGS1.1 Model A0 Proportion 0.74 0.03 0.22 0.01 Background w 0.06 1.00 0.06 1.00 11 −2013.92 Model A0 vs Model A1 Foreground w 0.56 1.00 1.00 1.00 0 1 1 Model A1 Proportion 0.79 0.03 0.17 0.01 Background w 0.06 1.00 0.06 1.00 12 −2013.91 Foreground w 0.06 1.00 1.31 1.31 LrGS2 Model A0 Proportion 0.77 0.16 0.06 0.01 Background w 0.00 1.00 0.00 1.00 11 −1870.56 Model A0 vs Model A1 Foreground w 0.00 1.00 1.00 1.00 0 1 1 Model A1 Proportion 0.77 0.16 0.06 0.01 Background w 0.00 1.00 0.00 1.00 12 −1870.56 Foreground w 0.00 1.00 1.00 1.00 LrGS1.2 Model A0 Proportion 0.89 0.07 0.04 0.00 Background w 0.04 1.00 0.04 1.00 15 −2473.48 Model A0 vs Model A1 Foreground w 0.04 1.00 1.00 1.00 0 1 1 Model A1 Proportion 0.89 0.07 0.04 0.00 Background w 0.04 1.00 0.04 1.00 16 −2473.48 Foreground w 0.04 1.00 1.00 1.00 LrGS1.3 Model A0 Proportion 0.92 0.07 0.00 0.00 Background w 0.04 1.00 0.04 1.00 15 −2474.1 Model A0 vs Model A1 Foreground w 0.04 1.00 1.00 1.00 0 1 1 Model A1 Proportion 0.93 0.07 0.00 0.00 Background w 0.04 1.00 0.04 1.00 16 −2474.1 Foreground w 0.04 1.00 1.00 1.00 Table 2.
Molecular evolutionary analysis based on the branch-site model.
Figures
(13)
Tables
(2)