-
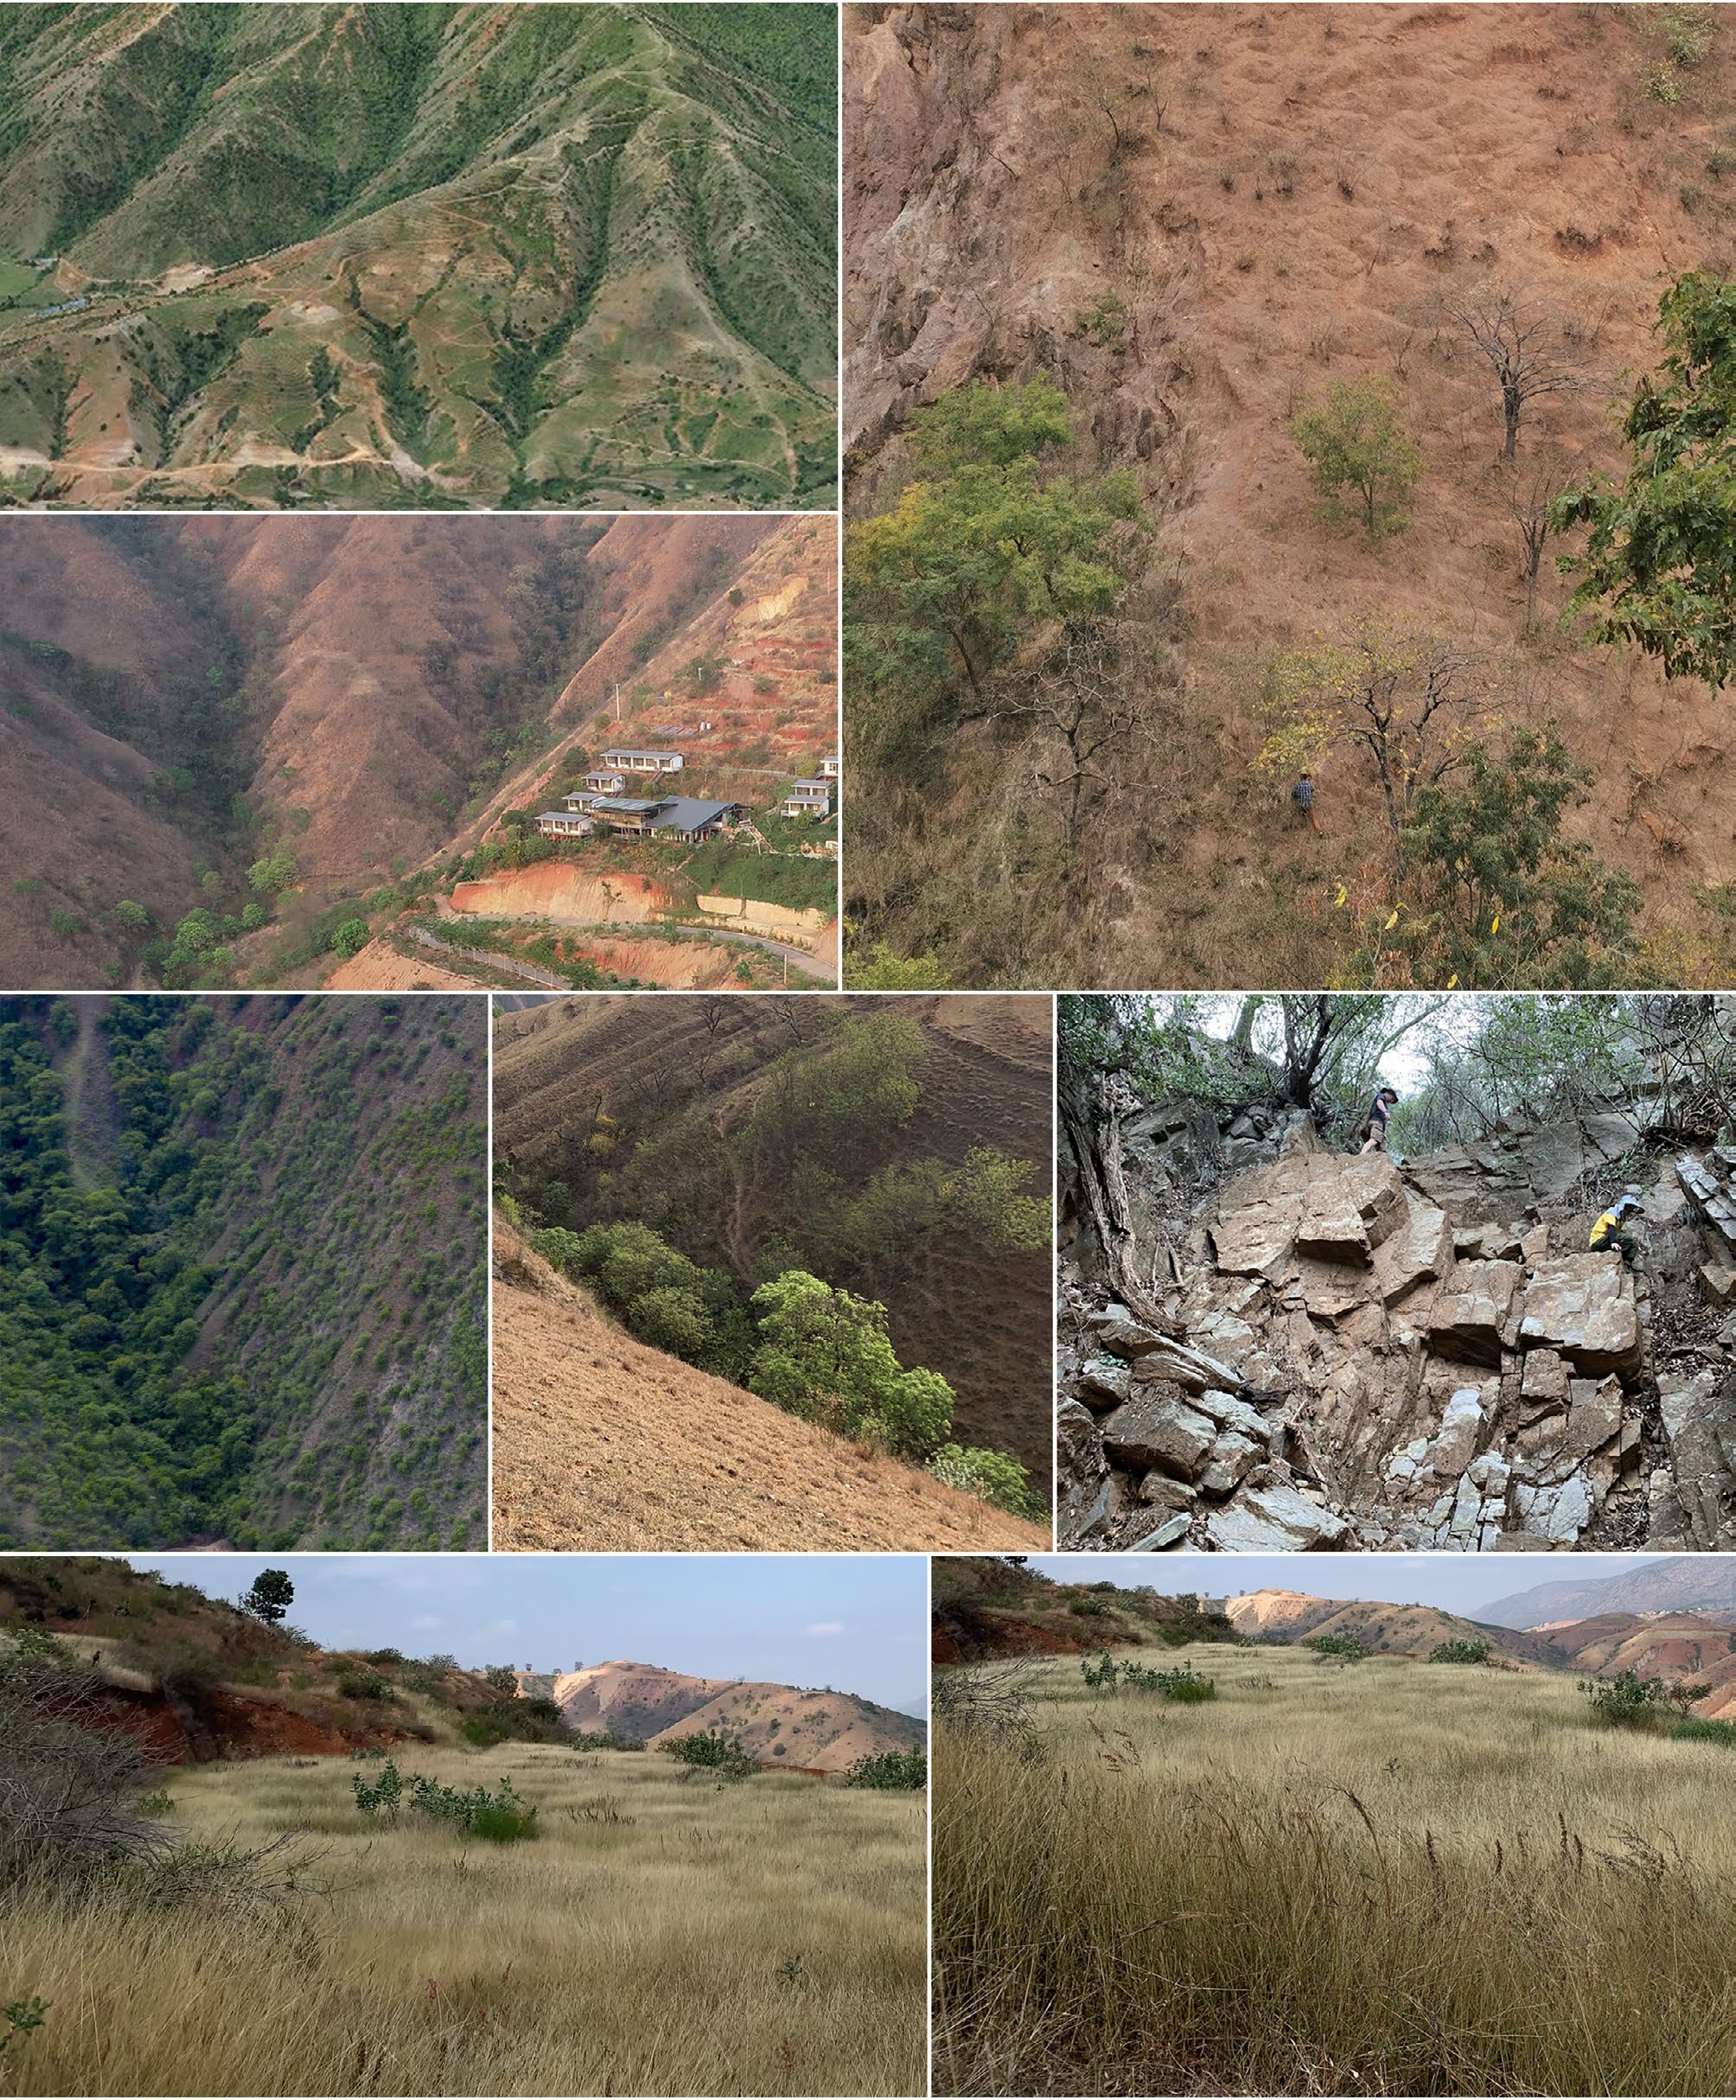
Figure 1.
The local environment showing steep valleys and eroded nutrient-poor soils that characterize the study area.
-
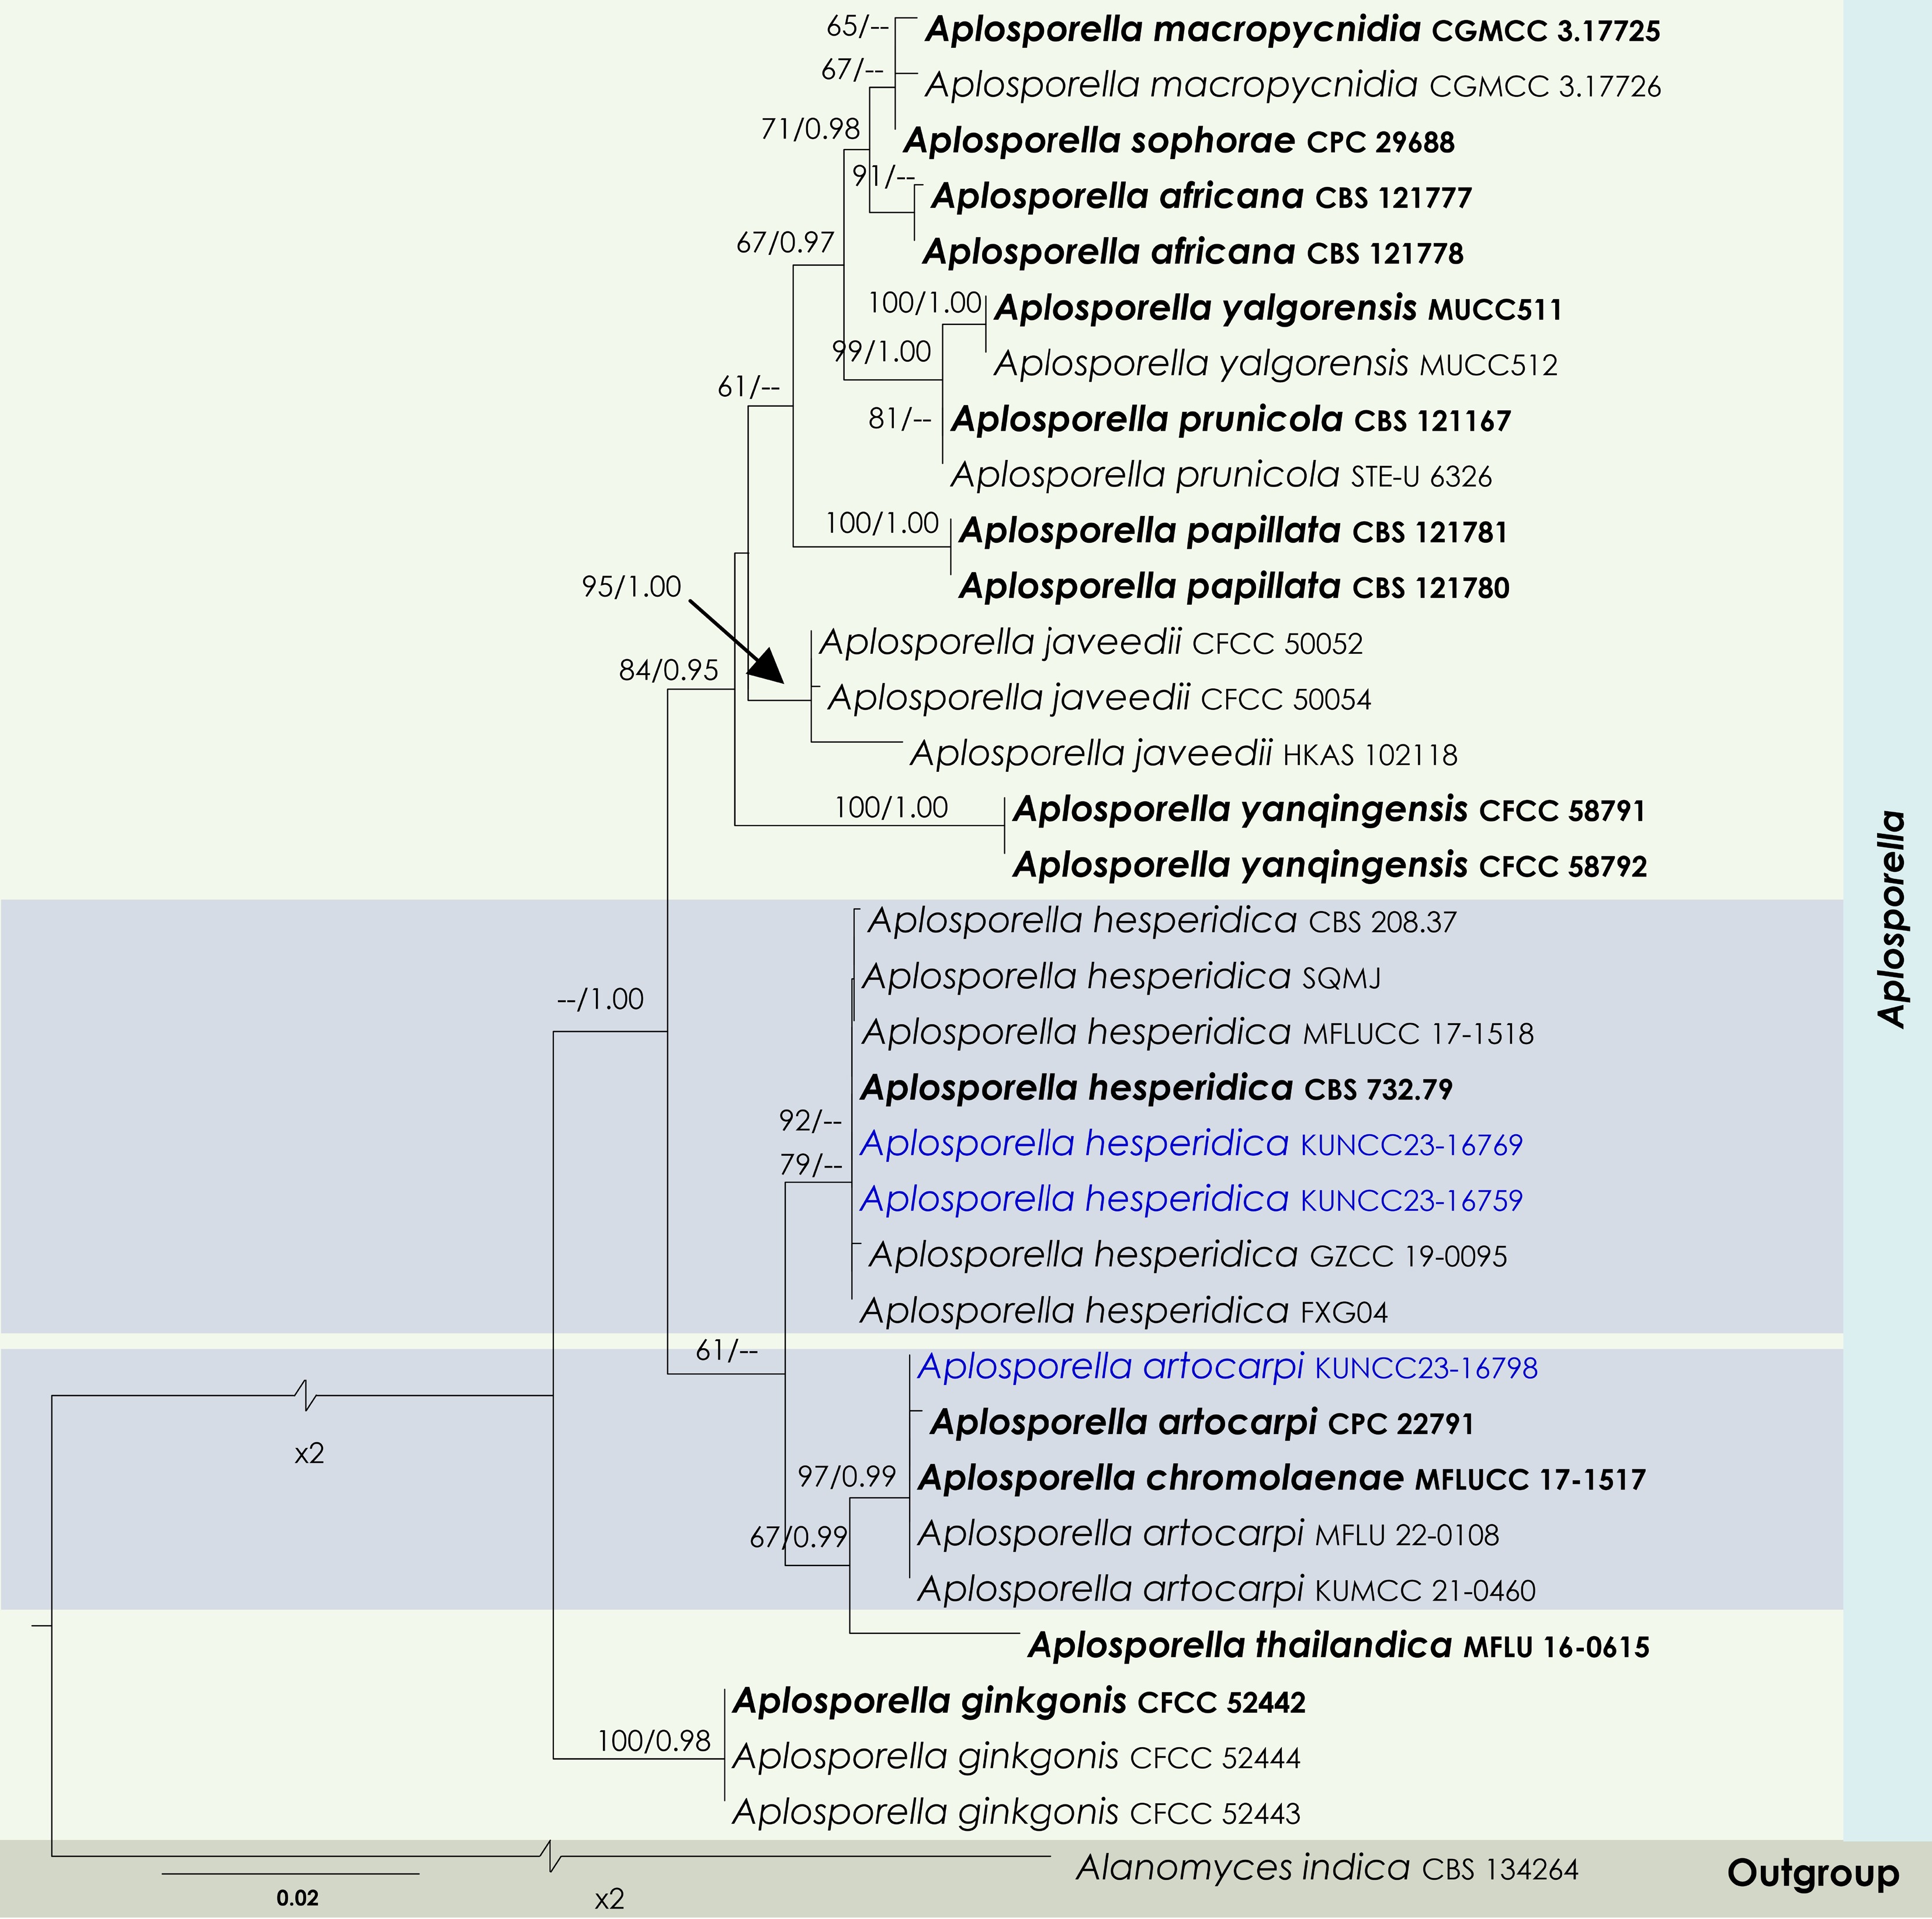
Figure 2.
Maximum Likelihood tree inferred from the concatenated dataset of partial LSU, ITS, and tef1-α sequences representing members of Aplosporellaceae. The phylogeny is rooted with Alanomyces indica (CBS 134264). The final likelihood value is –4,051.526624. The final alignment included 303 unique site patterns, with approximately 25.96% of the positions comprising gaps or ambiguous characters. The estimated nucleotide frequencies were as follows: A = 0.230562, C = 0.245552, G = 0.282555, T = 0.241332. The substitution model yielded the following relative rates: AC = 5.894305, AG = 6.724706, AT = 4.532426, CG = 4.107660, CT = 15.165187 and GT = 1.000000. The proportion of invariable sites (I) was estimated at 0.7274, and the gamma distribution shape parameter (α) was 0.6476. Bayesian inference reached convergence after 623,000 generations, when the average standard deviation of split frequencies dropped below 0.01 (observed value: 0.009918). A total of 3,116 trees were sampled, and 2,337 of these were retained for the final analysis after discarding the initial 25% as burn-in. The alignment also revealed 304 distinct informative sites. In the resulting phylograms, sequences generated in this study are highlighted in blue, while ex-type or type strains are indicated in boldface.
-
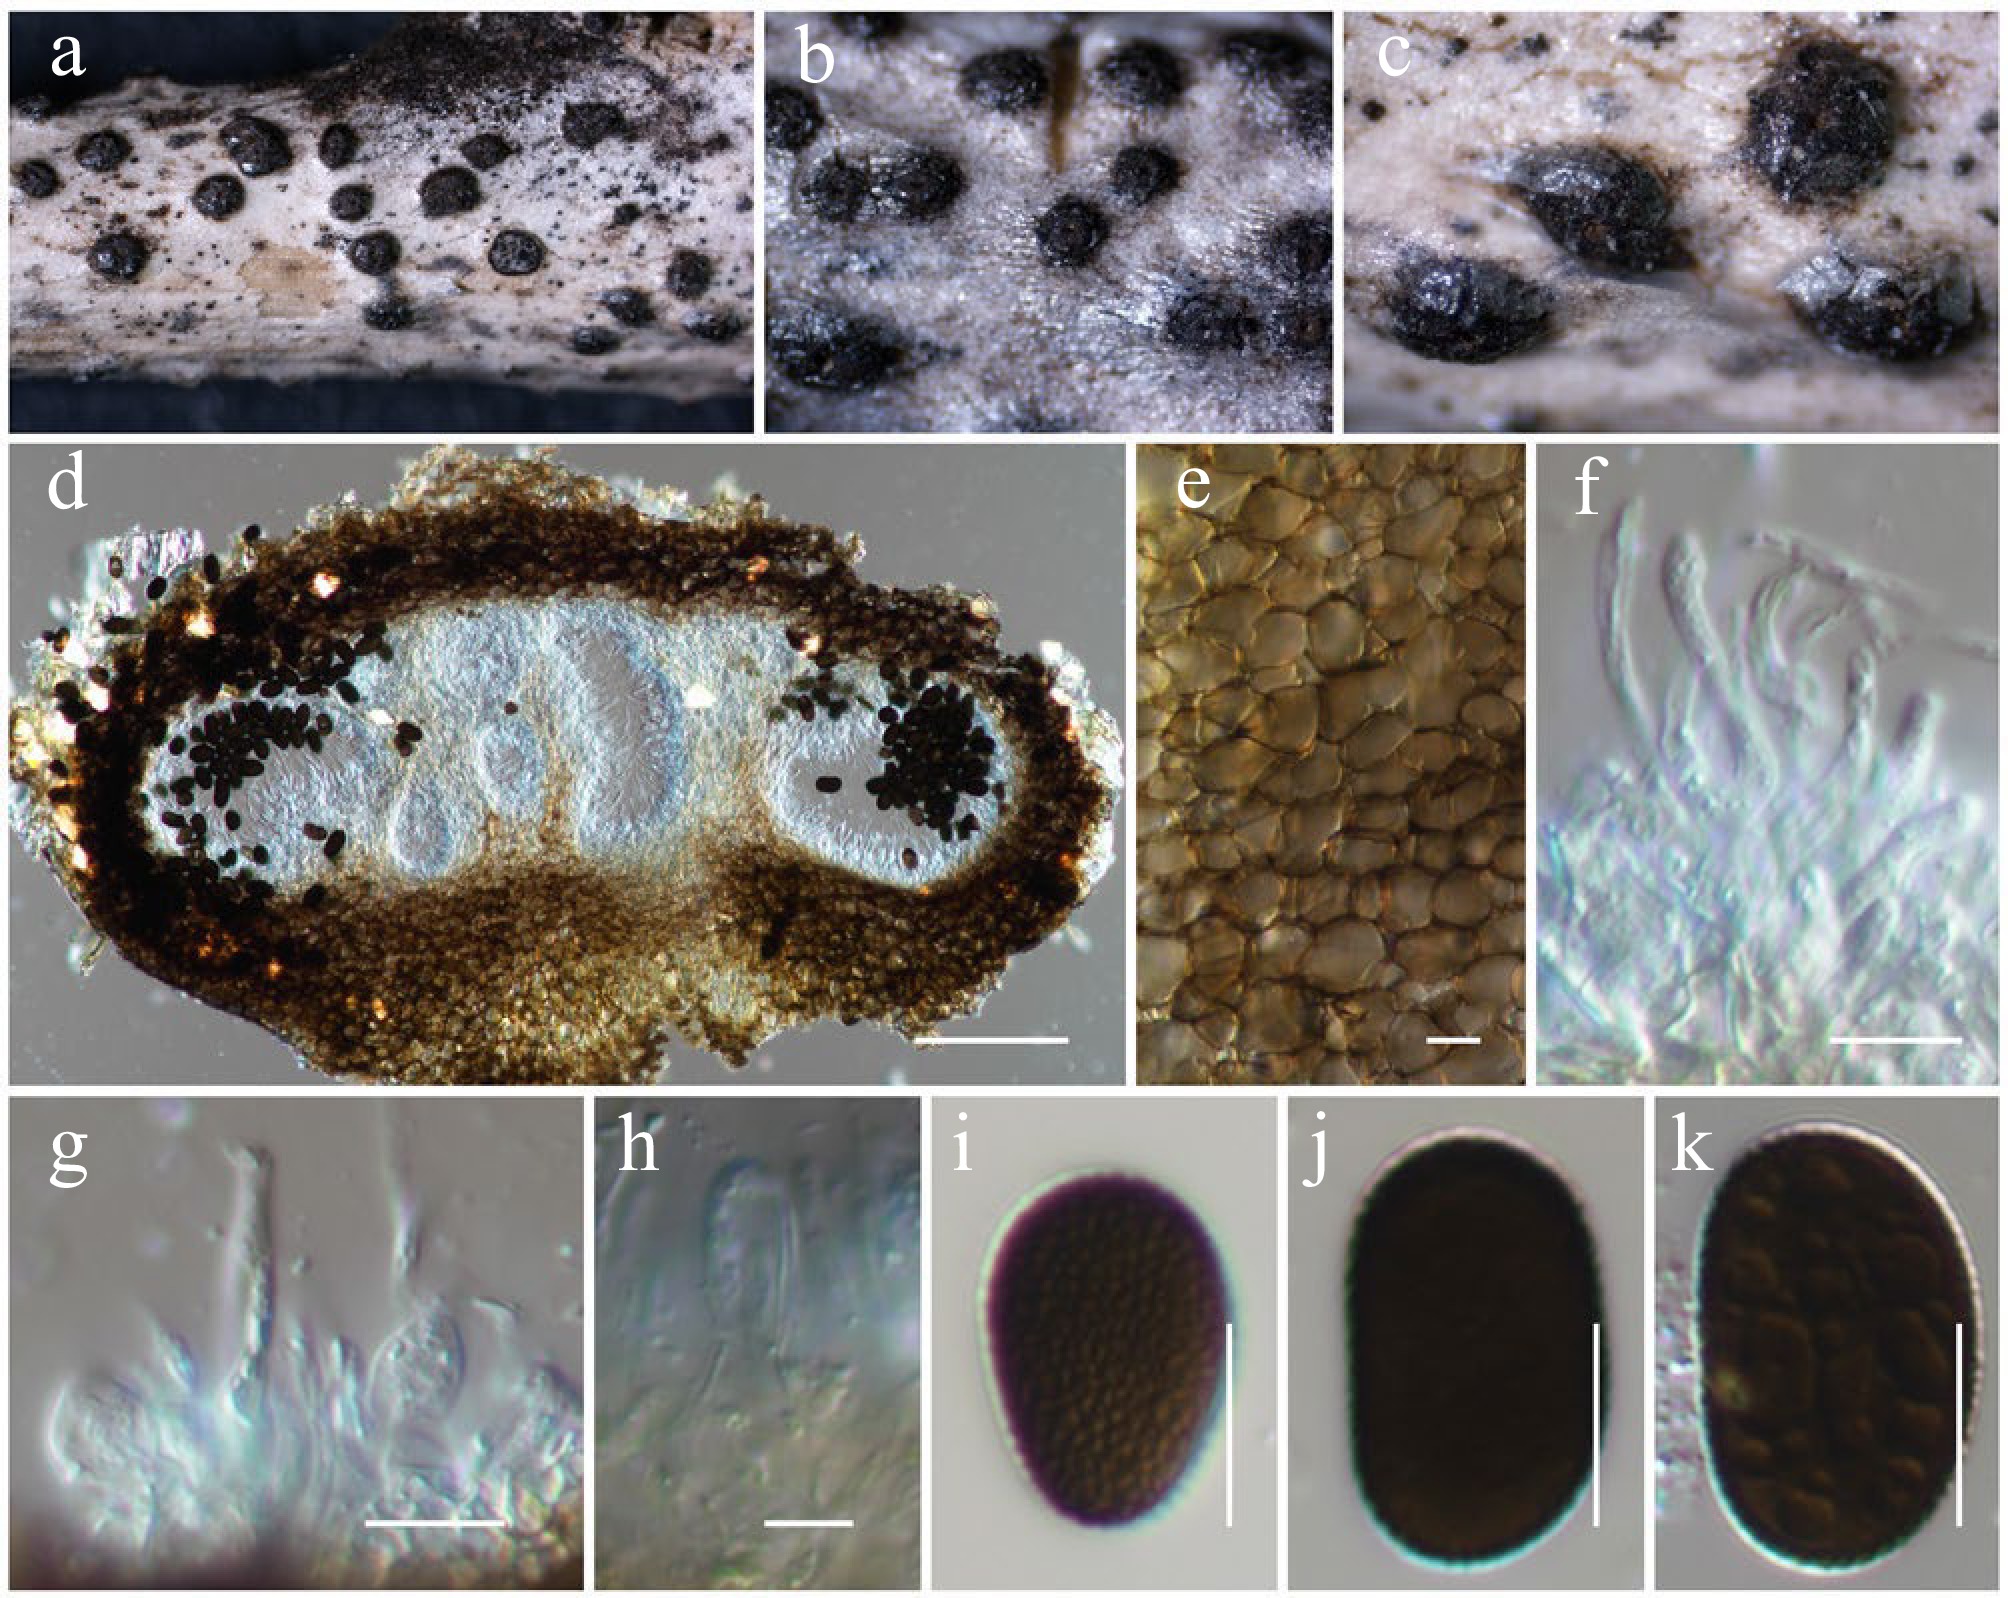
Figure 3.
Aplosporella artocarpi (HKAS146009). (a)–(c) Conidiostromata on host. (d) Cross-section of the conidiostroma. (e) Pycnidial wall. (f) Paraphyses. (g), (h) Conidiogenous cells and developing conidia. (i)–(k) Conidia. Scale bars: (d) = 100 µm, (e)–(k) = 10 µm.
-
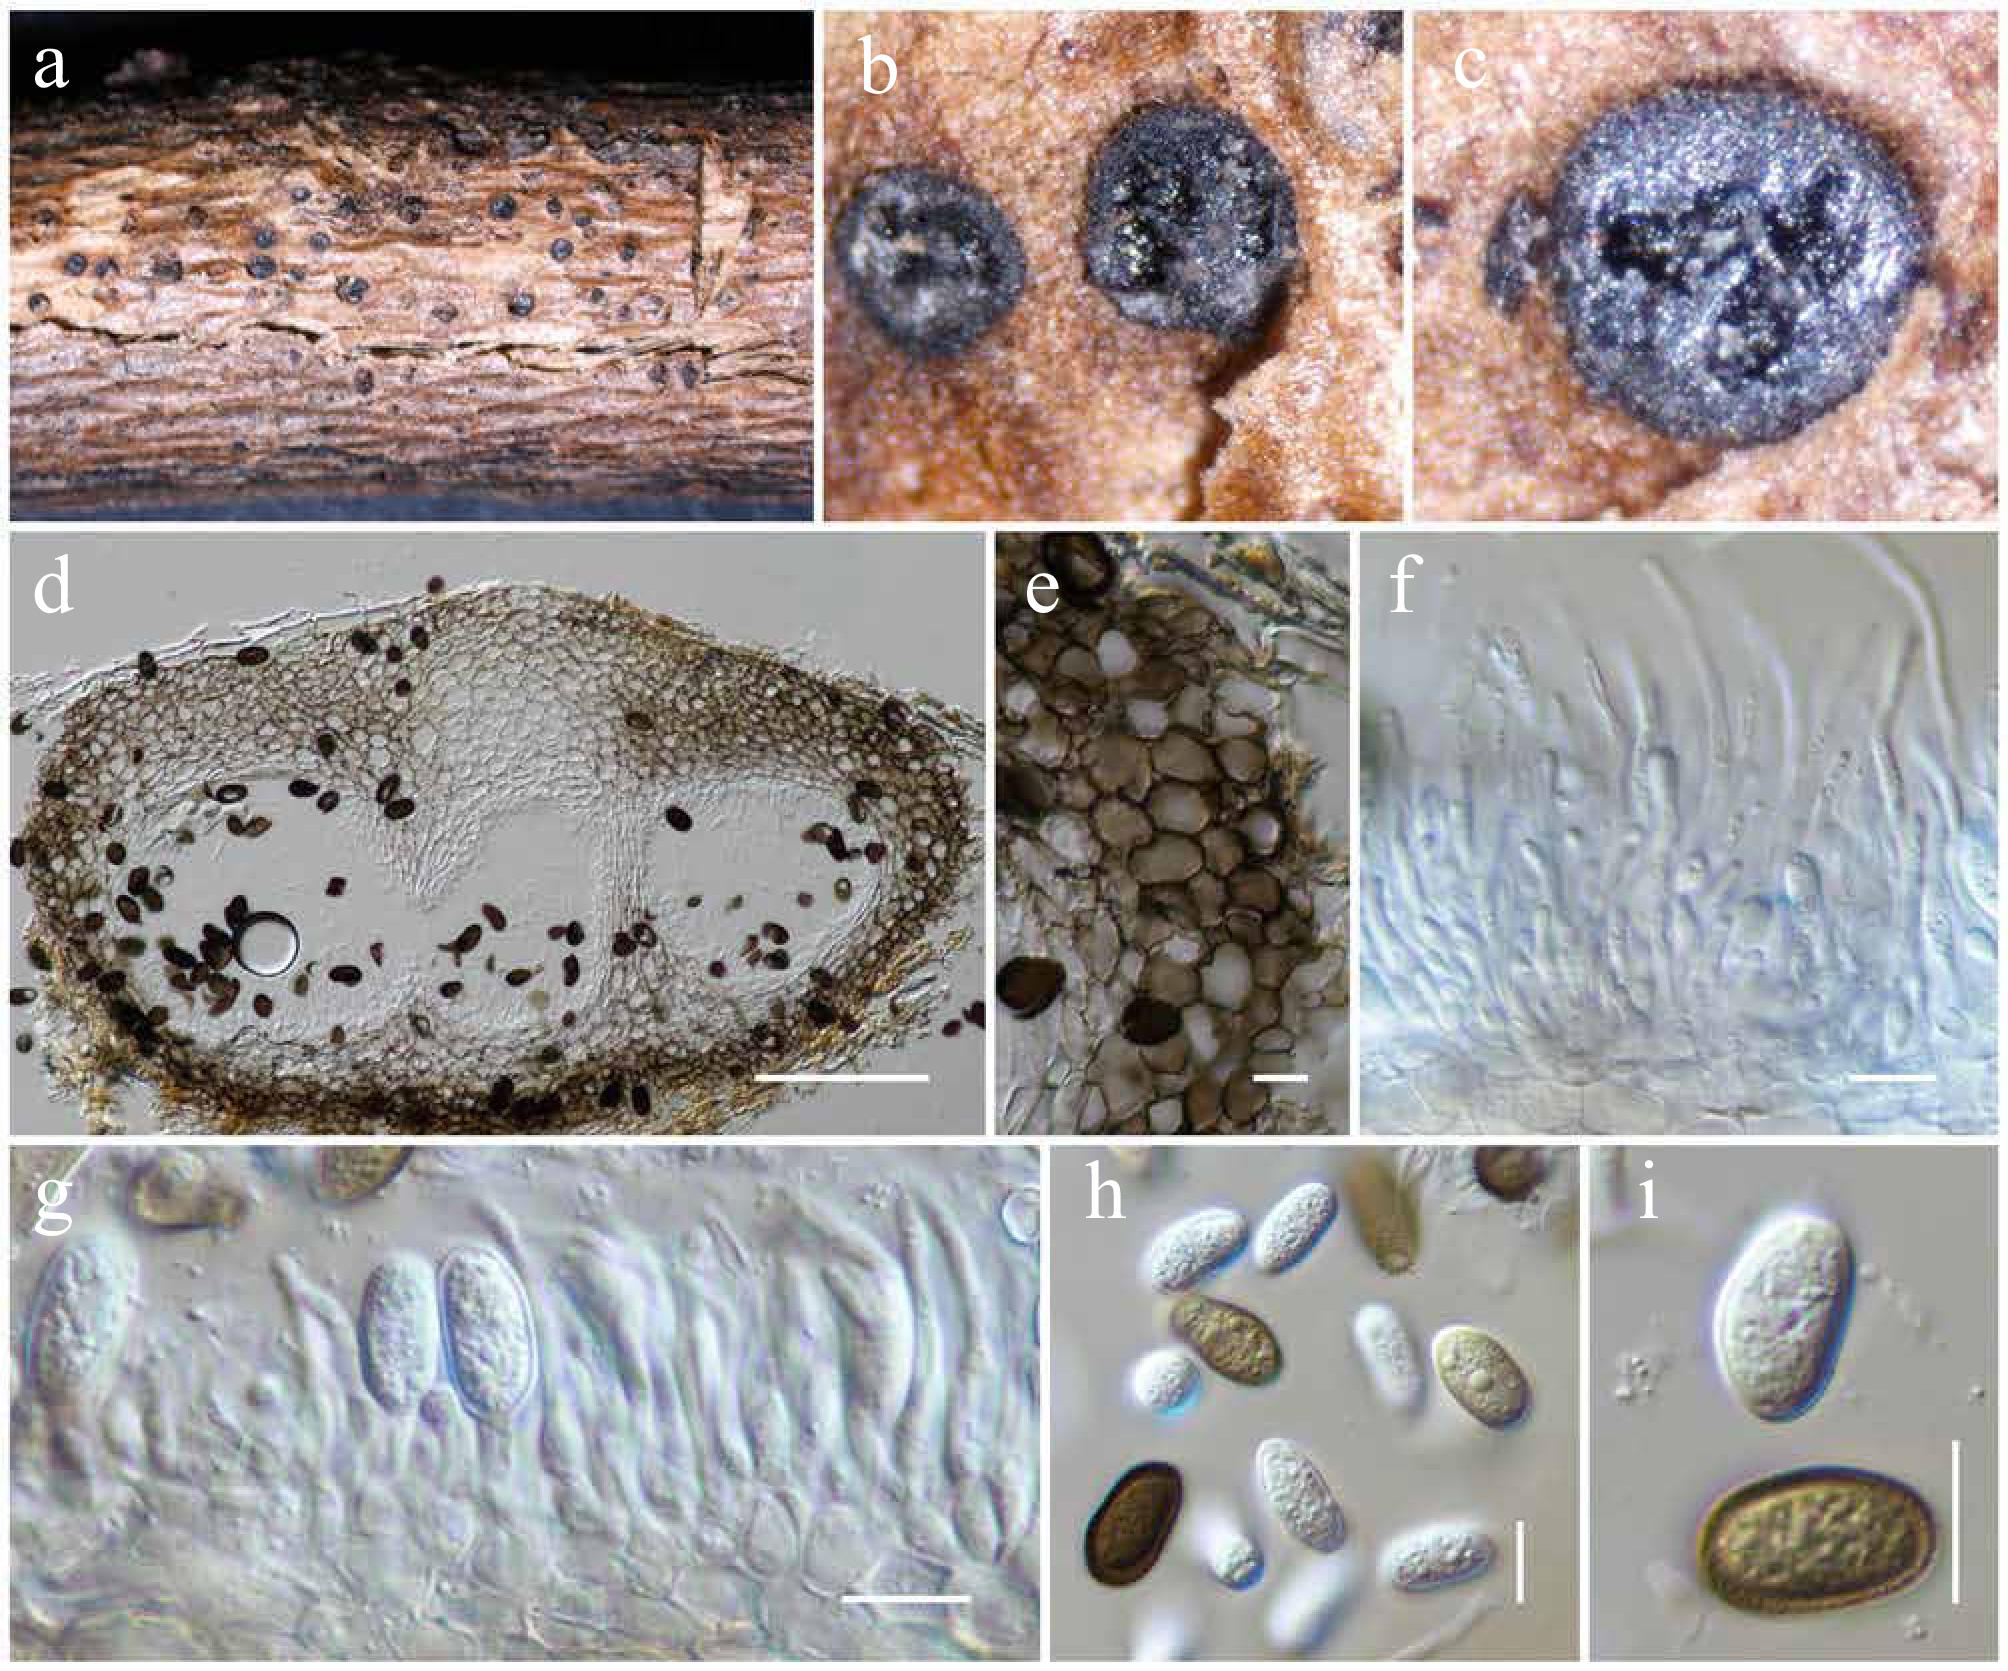
Figure 4.
Aplosporella hesperidica (HKAS146011). (a) Conidiostromata on host. (b)–(d) Cross sections of the conidiostromata. (e) Pycnidial wall. (f) Paraphyses. (g) Conidiogenous cells and developing conidia. (h), (i) Conidia. Scale bars: (d) = 100 µm, (e)–(i) = 10 µm.
-
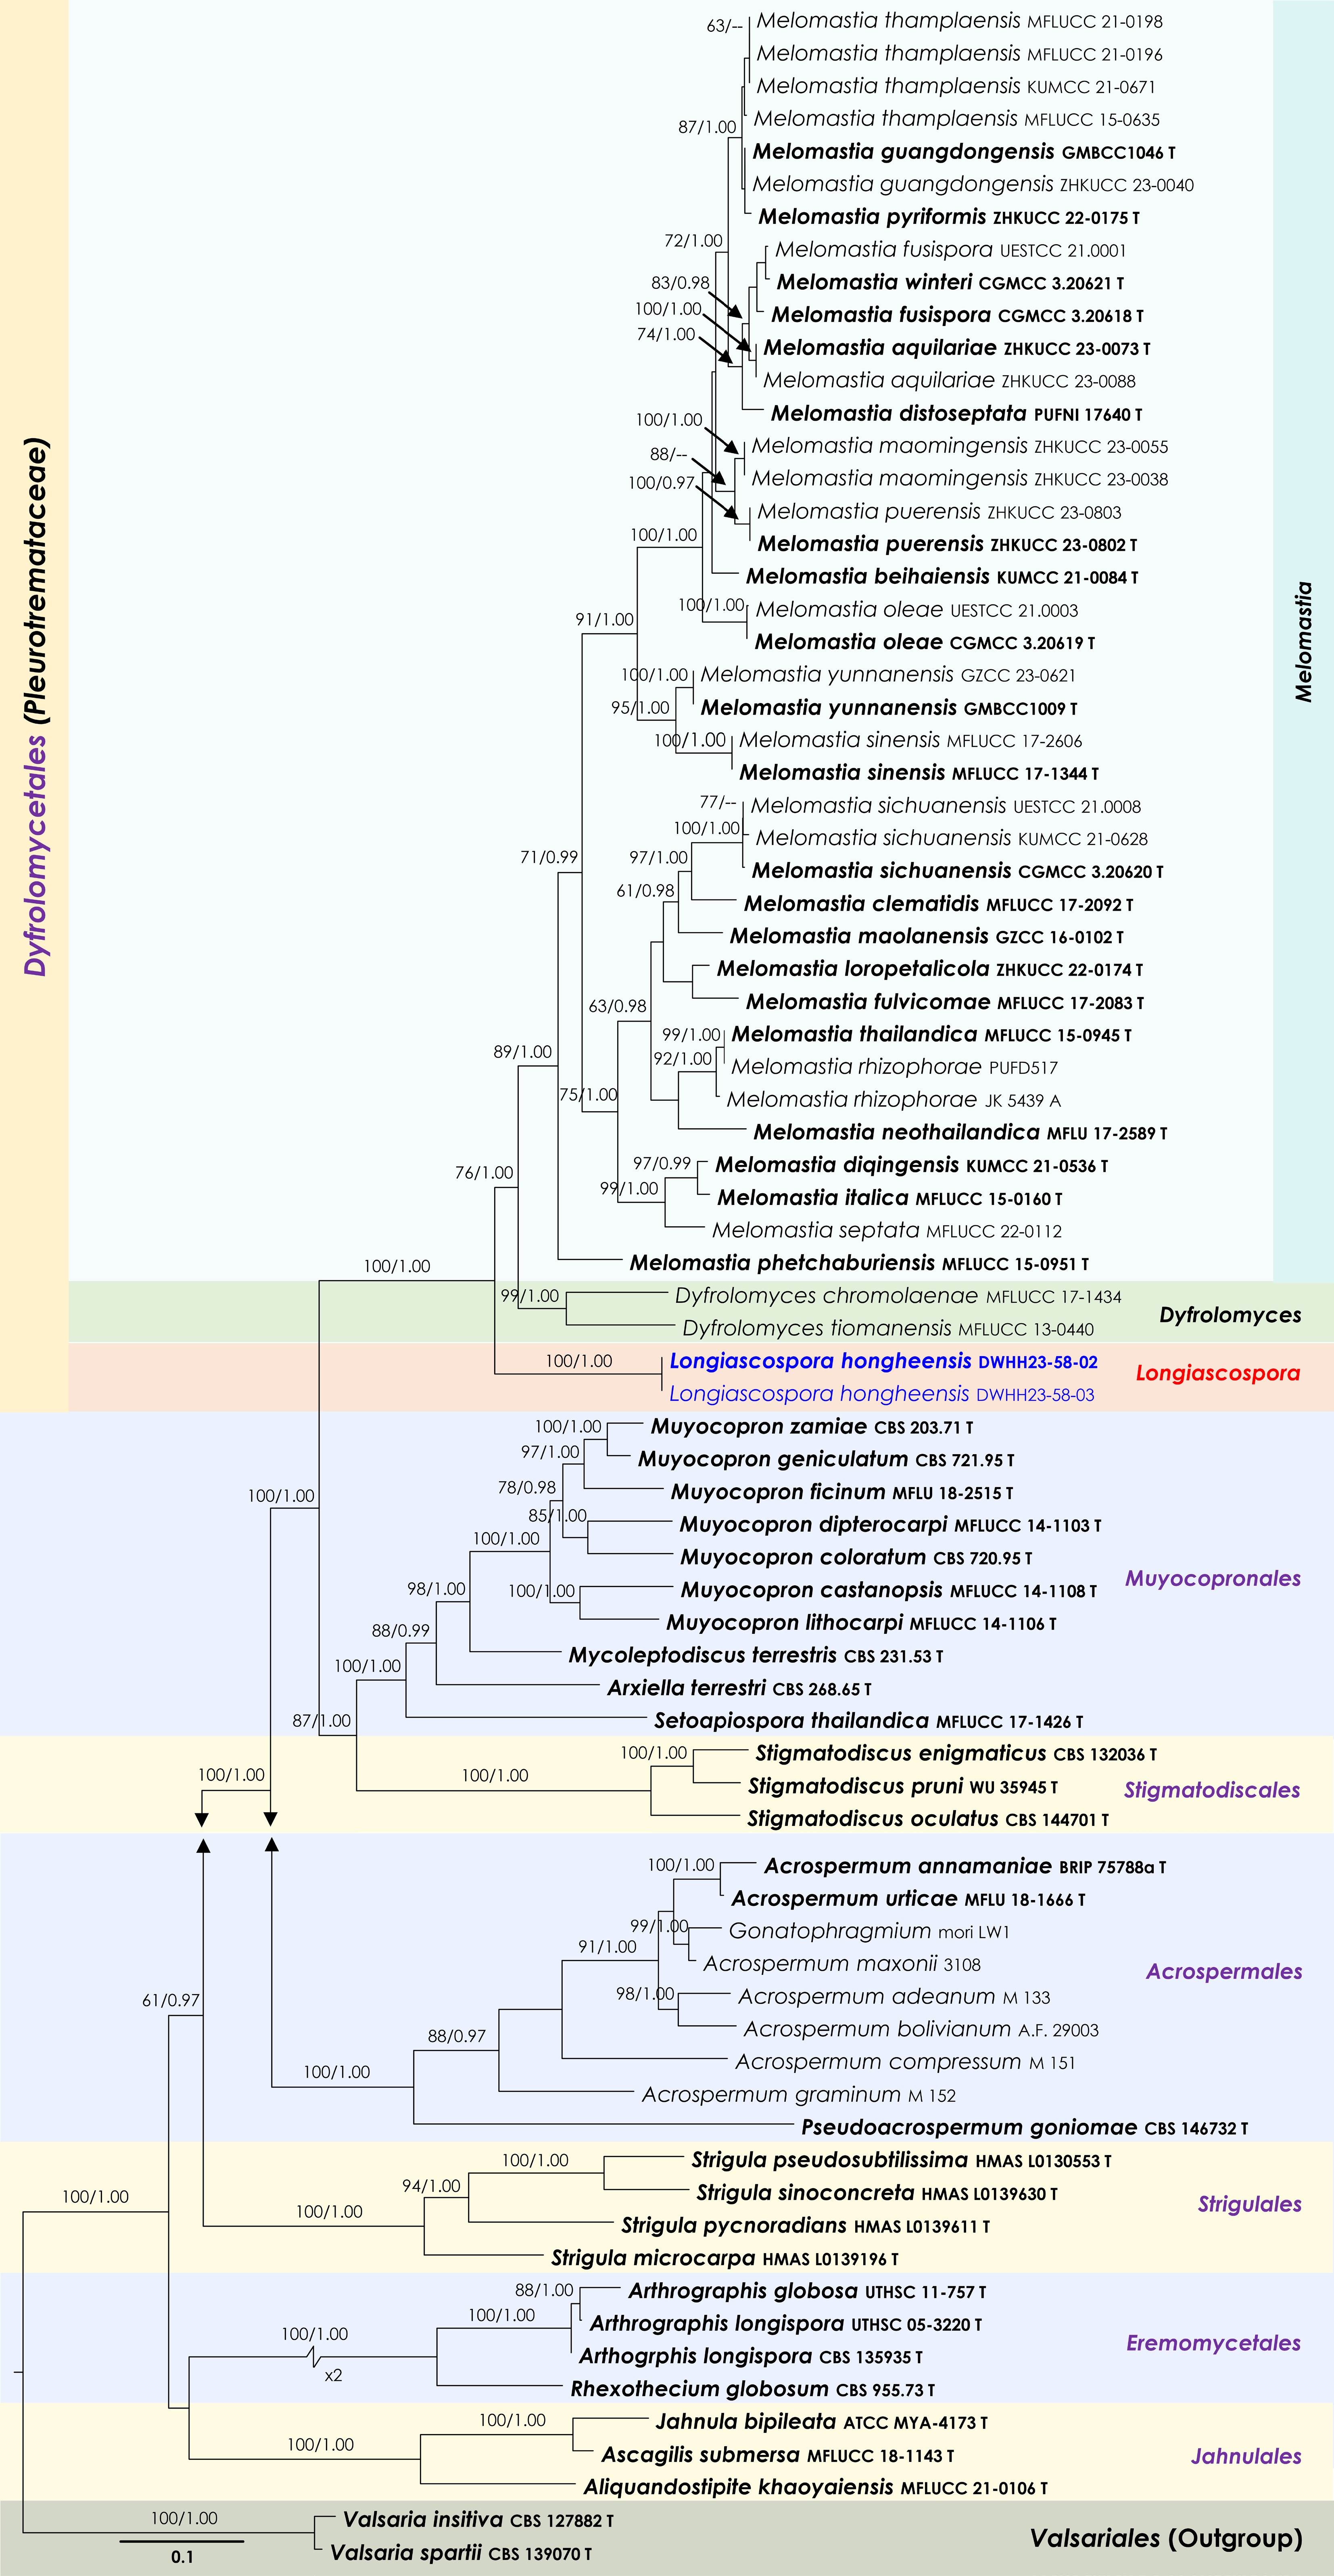
Figure 5.
Maximum Likelihood tree inferred from the concatenated dataset of partial LSU, ITS and rpb2 sequences. The phylogeny is rooted with Valsaria insitiva (CBS 126882) and V. spartii (CBS 139070). The final likelihood value is –48,977.732994. The final alignment included 2,750 unique site patterns, with approximately 44.21% of the positions comprising gaps or ambiguous characters. The estimated nucleotide frequencies were as follows: A = 0.236572, C = 0.265016, G = 0.288031, T = 0.21038. The substitution model yielded the following relative rates: AC = 1.574678, AG = 3.286228, AT = 1.515809, CG = 1.482881, CT = 7.546116, GT = 1.000000. The proportion of invariable sites (I) was estimated at 0.329292 and the gamma distribution shape parameter (α) was 0.554771. Bayesian inference reached convergence after 336,000 generations, when the average standard deviation of split frequencies dropped below 0.01 (observed value: 0.00998). A total of 1,681 trees were sampled, and 1,261 of these were retained for the final analysis after discarding the initial 25% as burn-in. The alignment also revealed 2,751 distinct informative sites. In the resulting phylograms, sequences generated in this study are highlighted in blue, while ex-type or type strains are indicated in boldface.
-
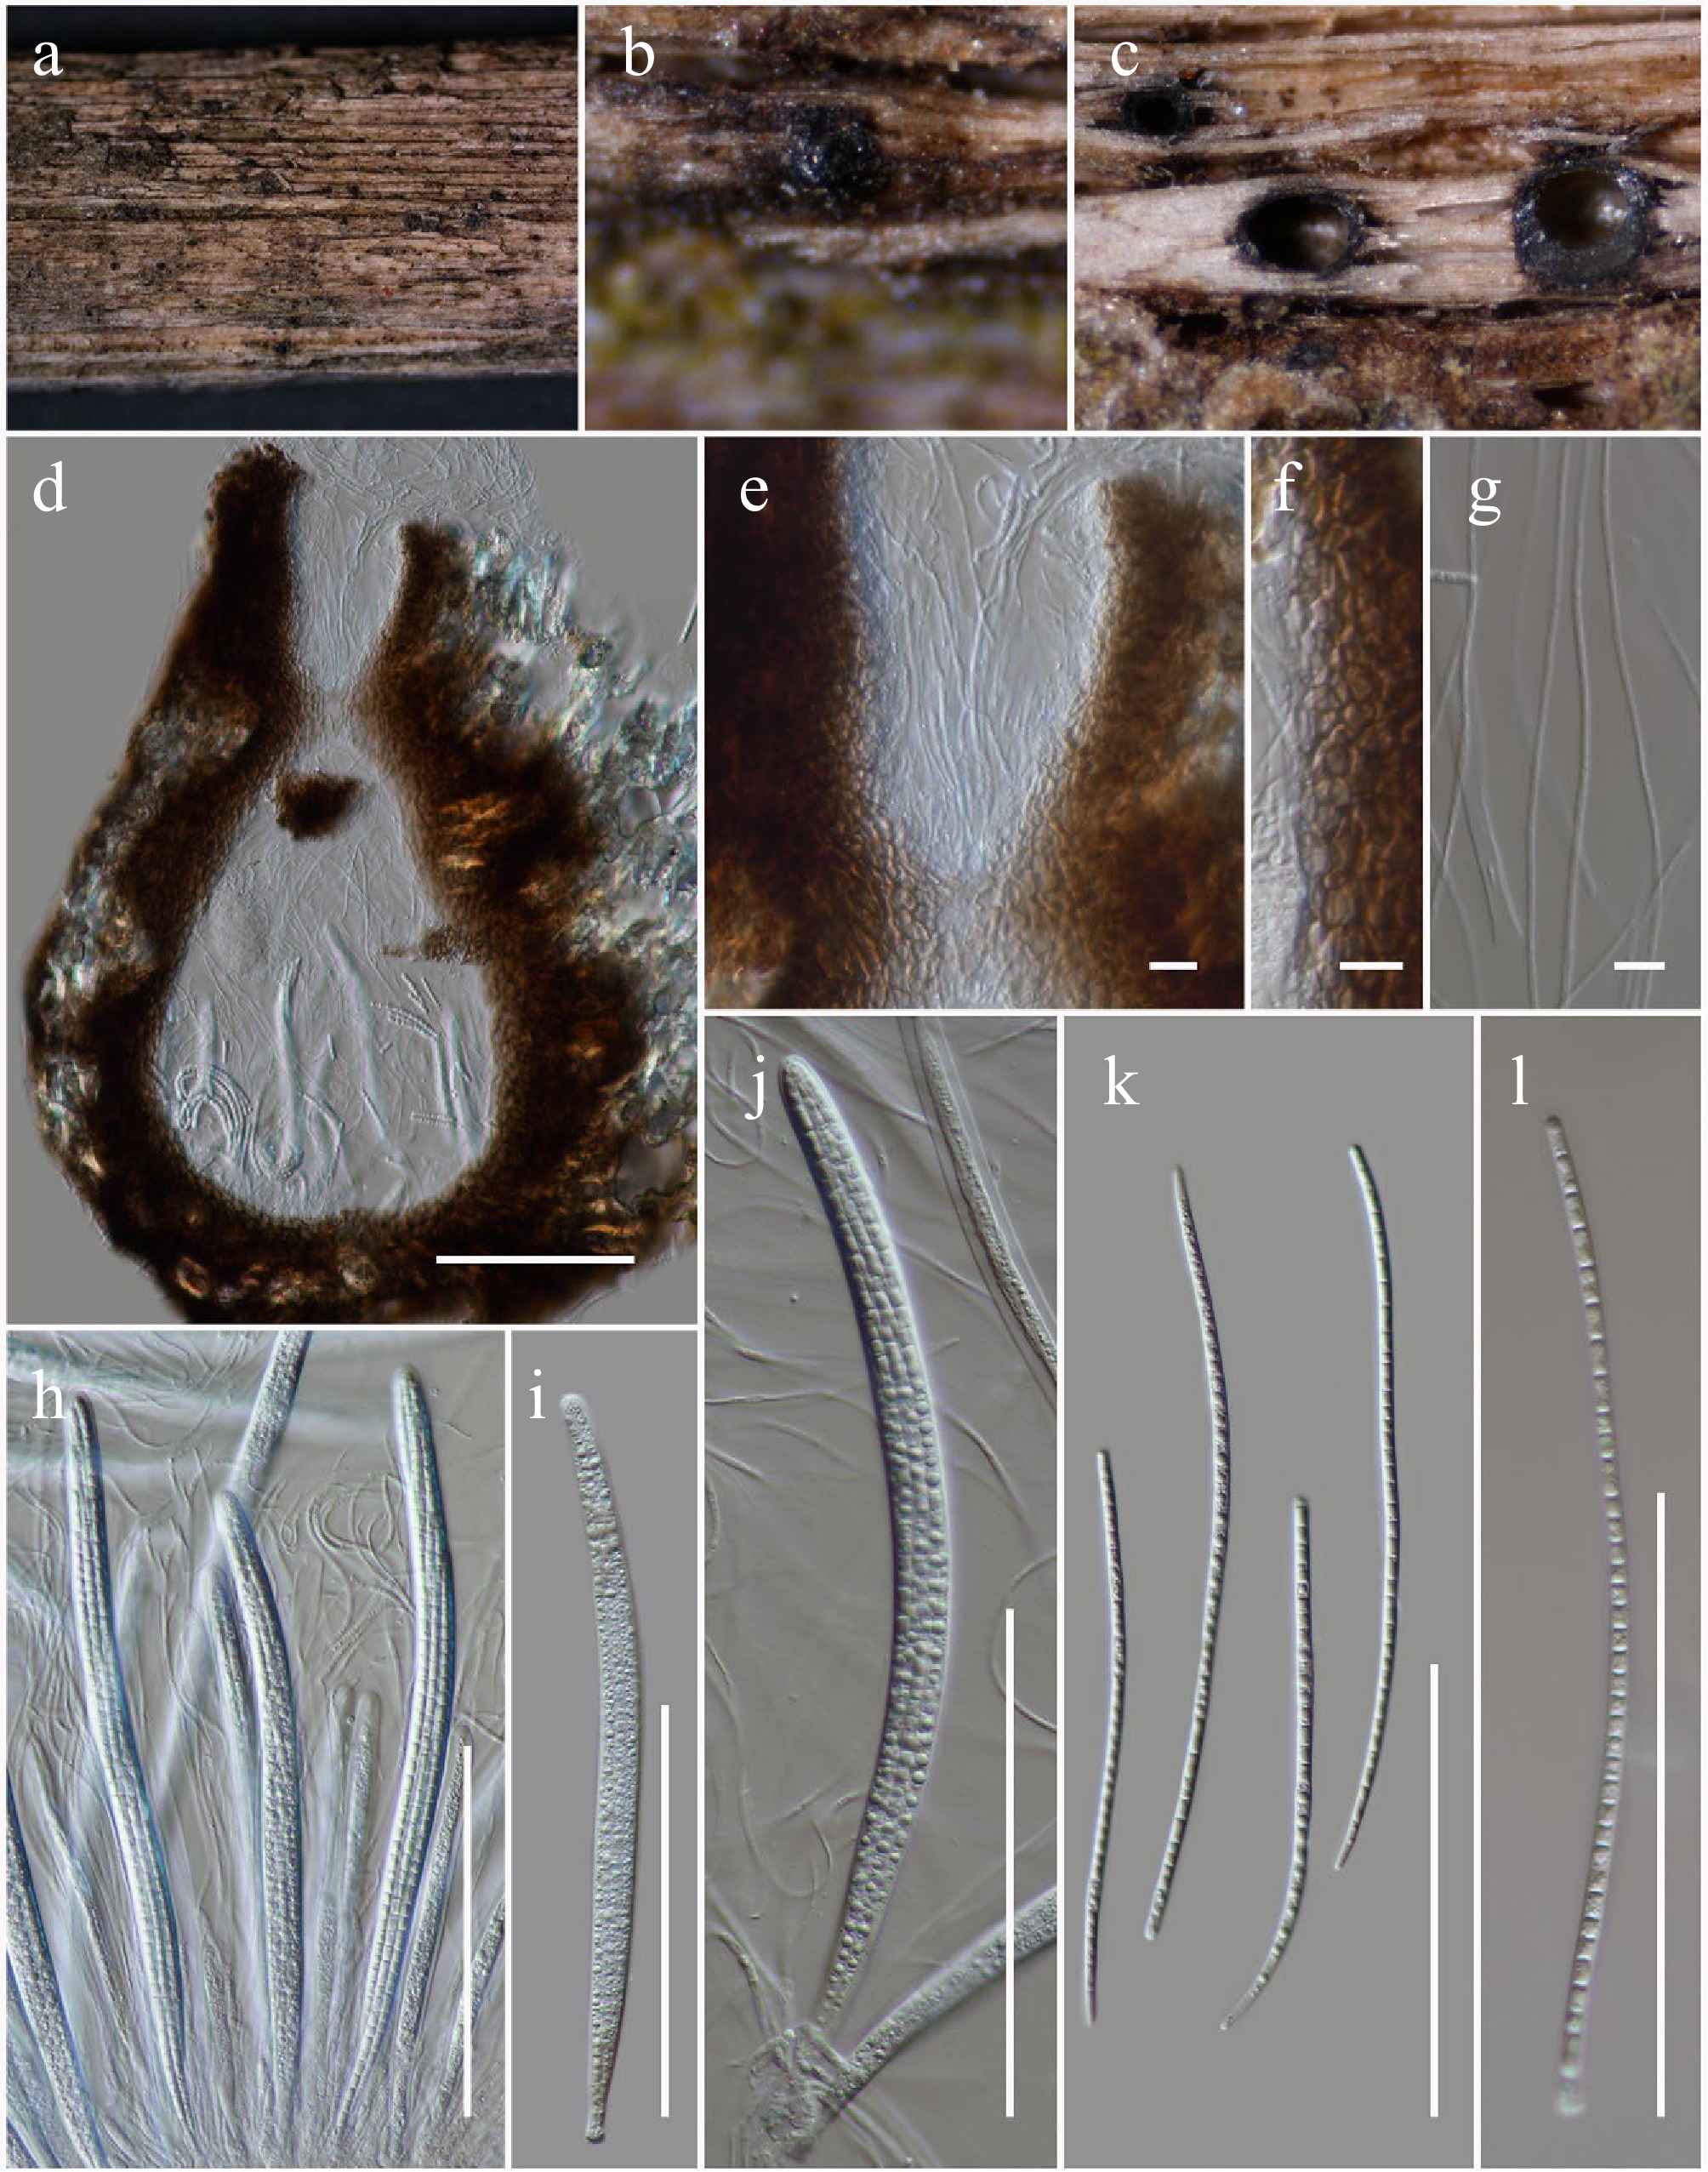
Figure 6.
Longiascospora hongheensis (HKAS146012, holotype). (a), (b) Ascomata on dead woody twigs. (c), (d) Sections of ascomata. (e) Close up of ostiole. (f) Peridium. (g) Pseudoparaphyses. (h)–(j) Asci. (k), (l) Ascospores. Scale bars: (d), (h)–(l) = 100 µm, (e)–(g) = 10 µm.
-
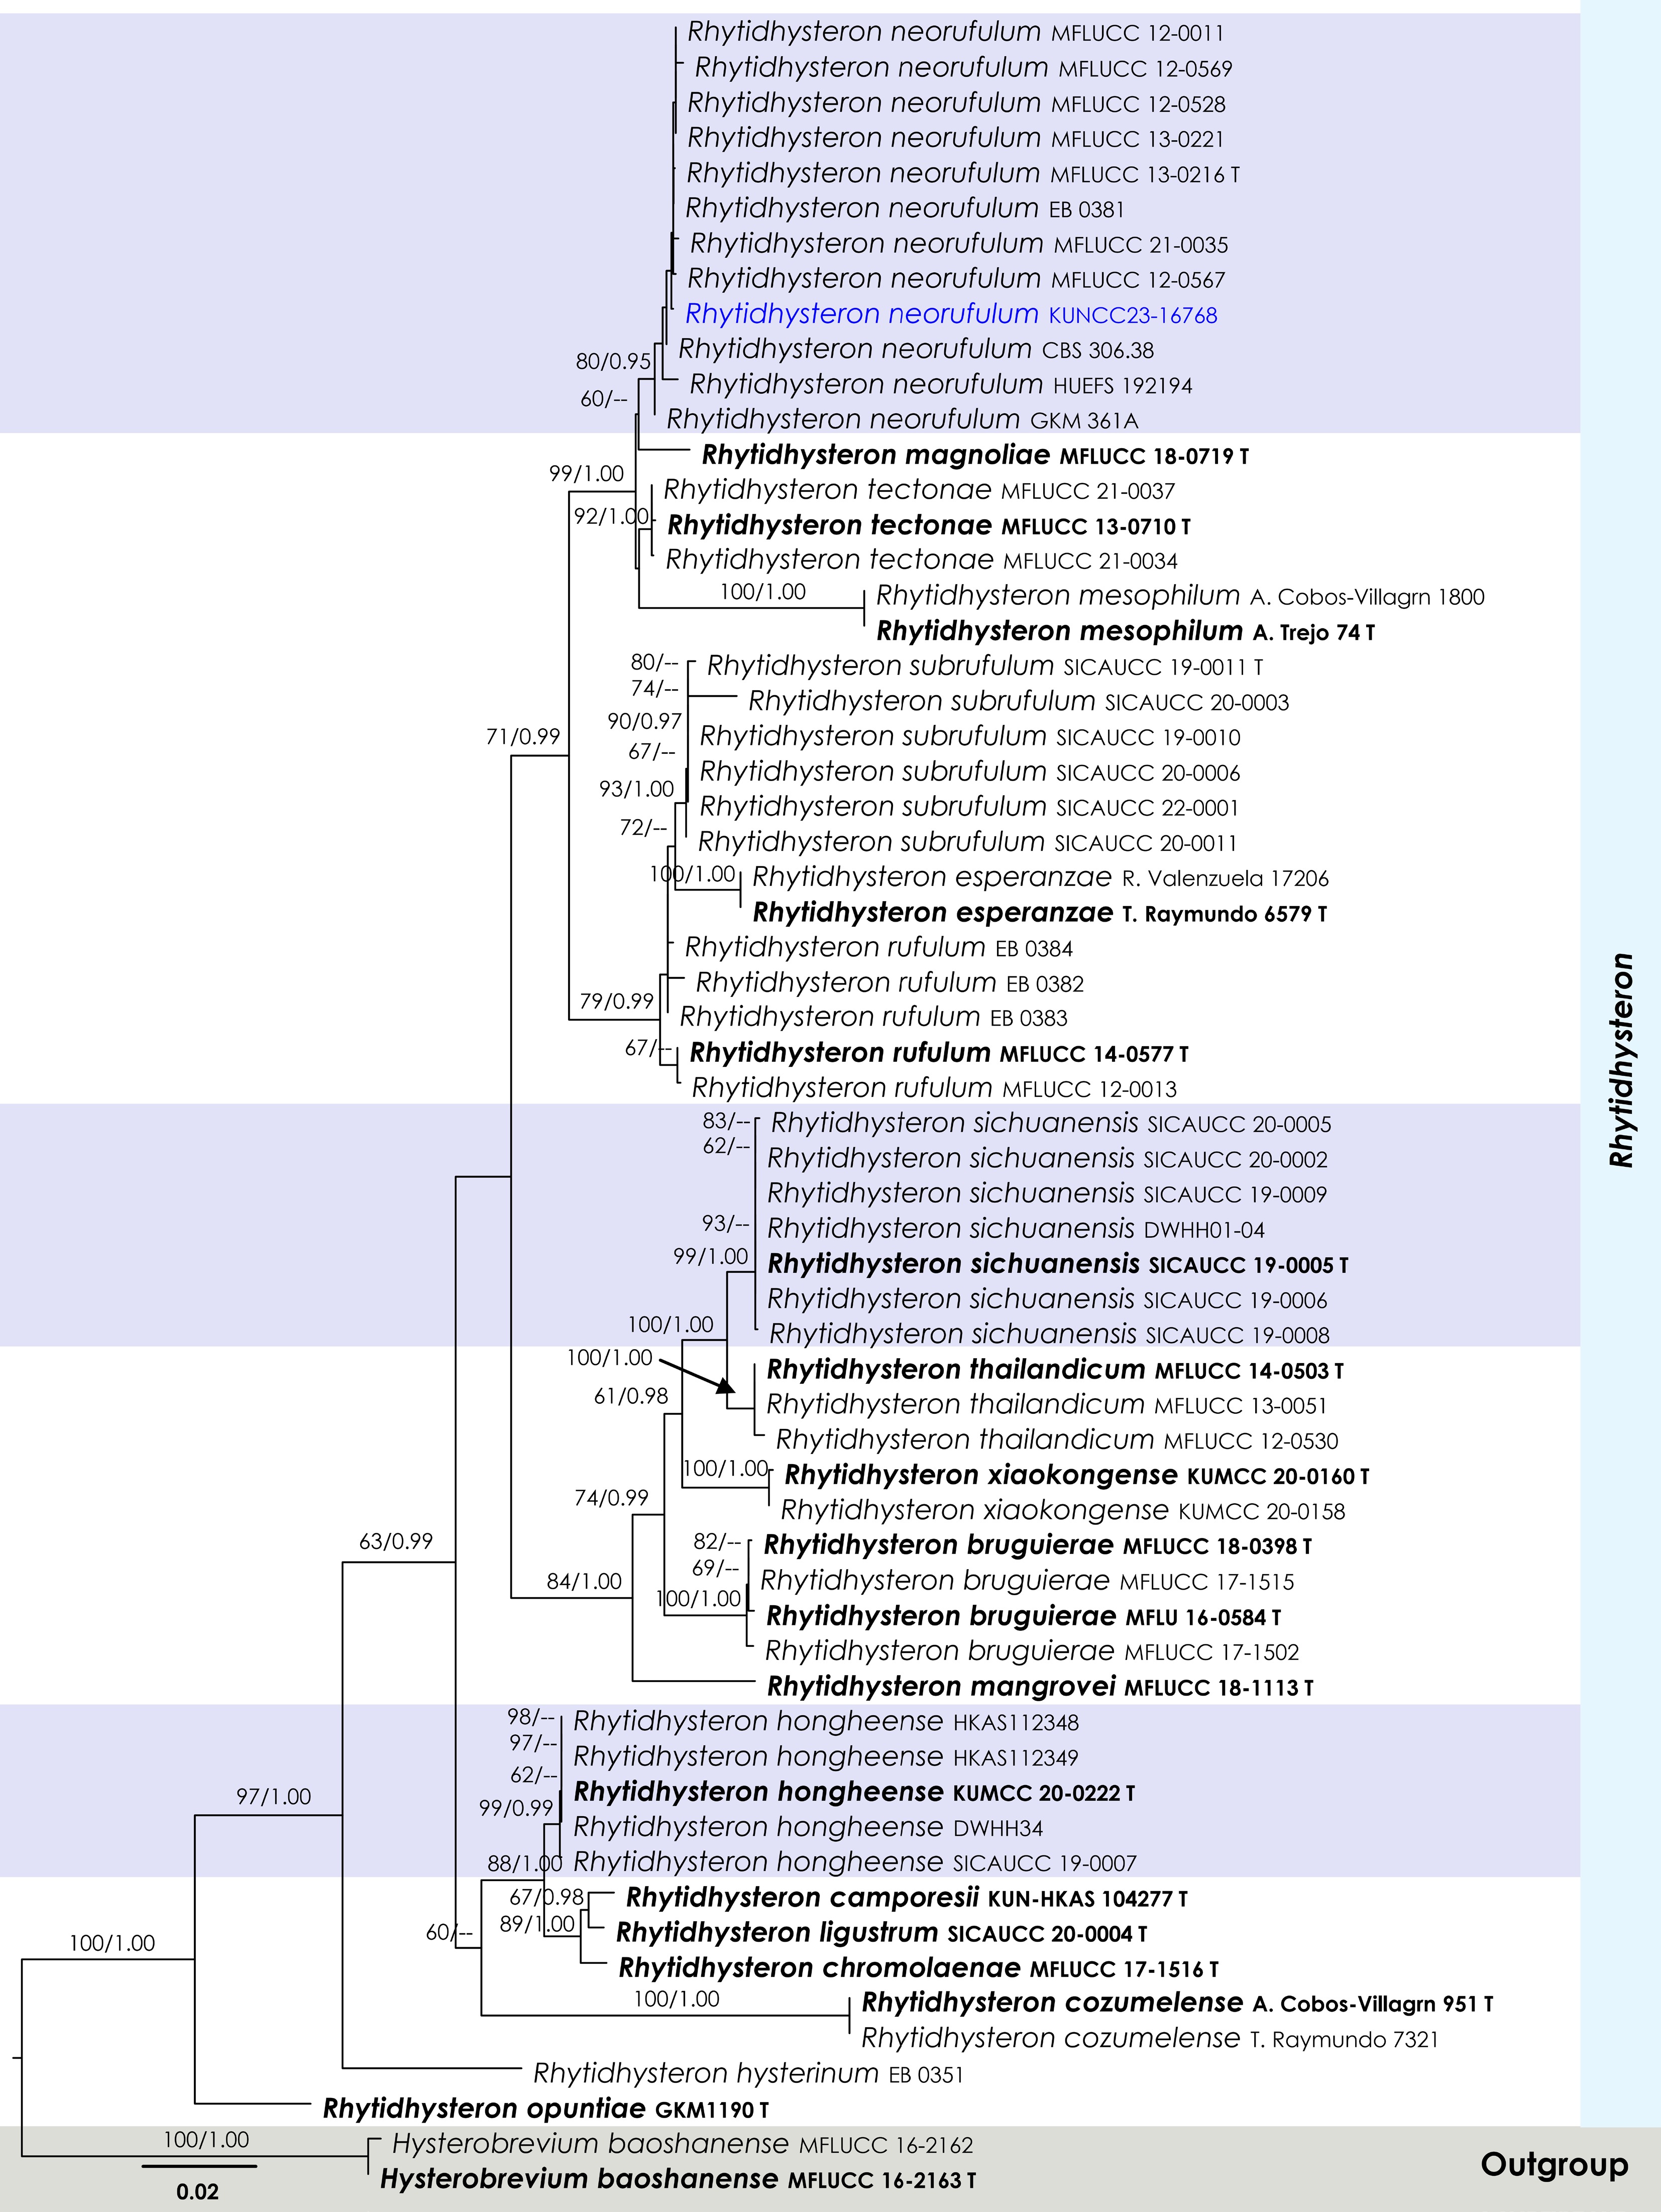
Figure 7.
Maximum Likelihood tree inferred from the concatenated dataset of partial SSU, LSU, ITS, and tef1-α sequences. The phylogeny is rooted with Hysterobrevium baoshanense (MFLUCC 16-2162, MFLUCC 16-2163). The final likelihood value is –10,916.669025. The final alignment included 813 unique site patterns, with approximately 23.31% of the positions comprising gaps or ambiguous characters. The estimated nucleotide frequencies were as follows: A = 0.240255, C = 0.247157, G = 0.276188, T = 0.236399. The substitution model yielded the following relative rates: AC = 1.376740, AG = 2.437005, AT = 1.147691, CG = 0.904034, CT = 5.839891, GT = 1.000000. The proportion of invariable sites (I) was estimated at 0.618399, and the gamma distribution shape parameter (α) was 0.641873. Bayesian inference reached convergence after 761,000 generations, when the average standard deviation of split frequencies dropped below 0.01 (observed value: 0.009903). A total of 7,611 trees were sampled, and 5,709 of these were retained for the final analysis after discarding the initial 25% as burn-in. The alignment also revealed 814 distinct informative sites. In the resulting phylograms, sequences generated in this study are highlighted in blue, while ex-type or type strains are indicated in boldface.
-
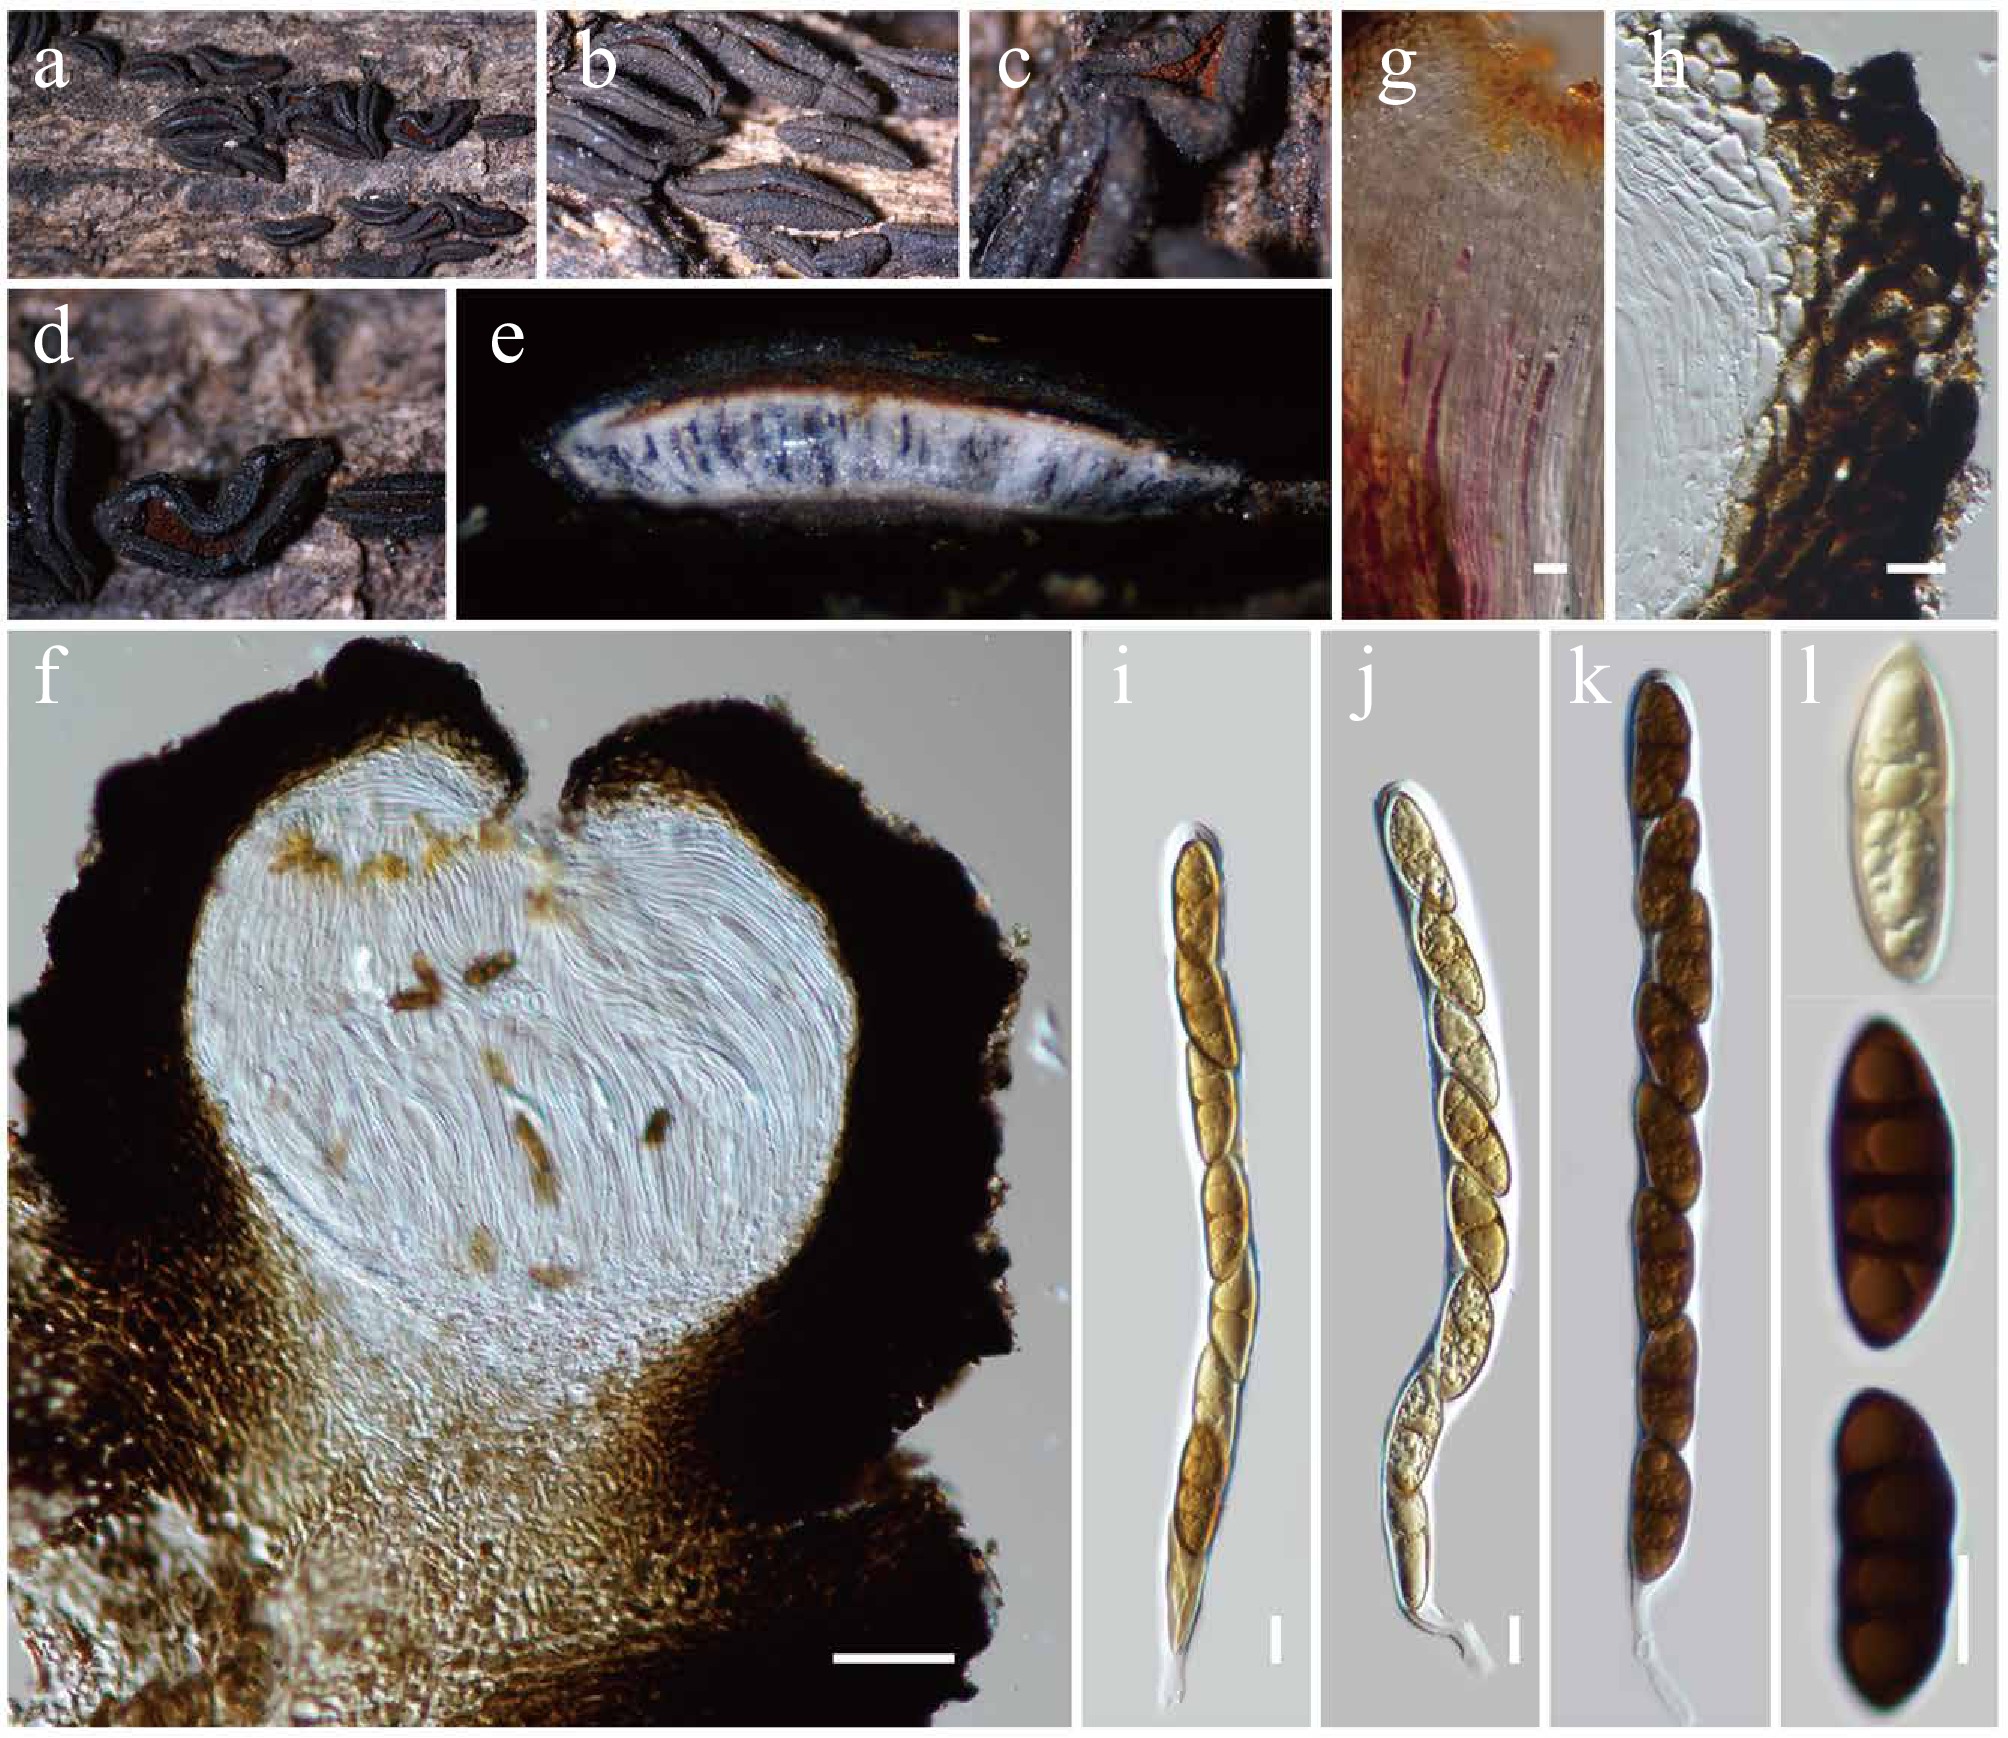
Figure 8.
Rhytidhysteron neorufulum (HKAS146014). (a)–(d) Appearance of hysterothecia on the dead woody twigs. (e) Horizontal section of hysteriothecium. (f) Cross-section of an ascoma. (g) Pseudoparaphyses. (h) Excipulum. (i)–(k) Asci. (l) Ascospores. Scale bars: (f) = 100 µm, (g)–(l) = 10 µm.
-
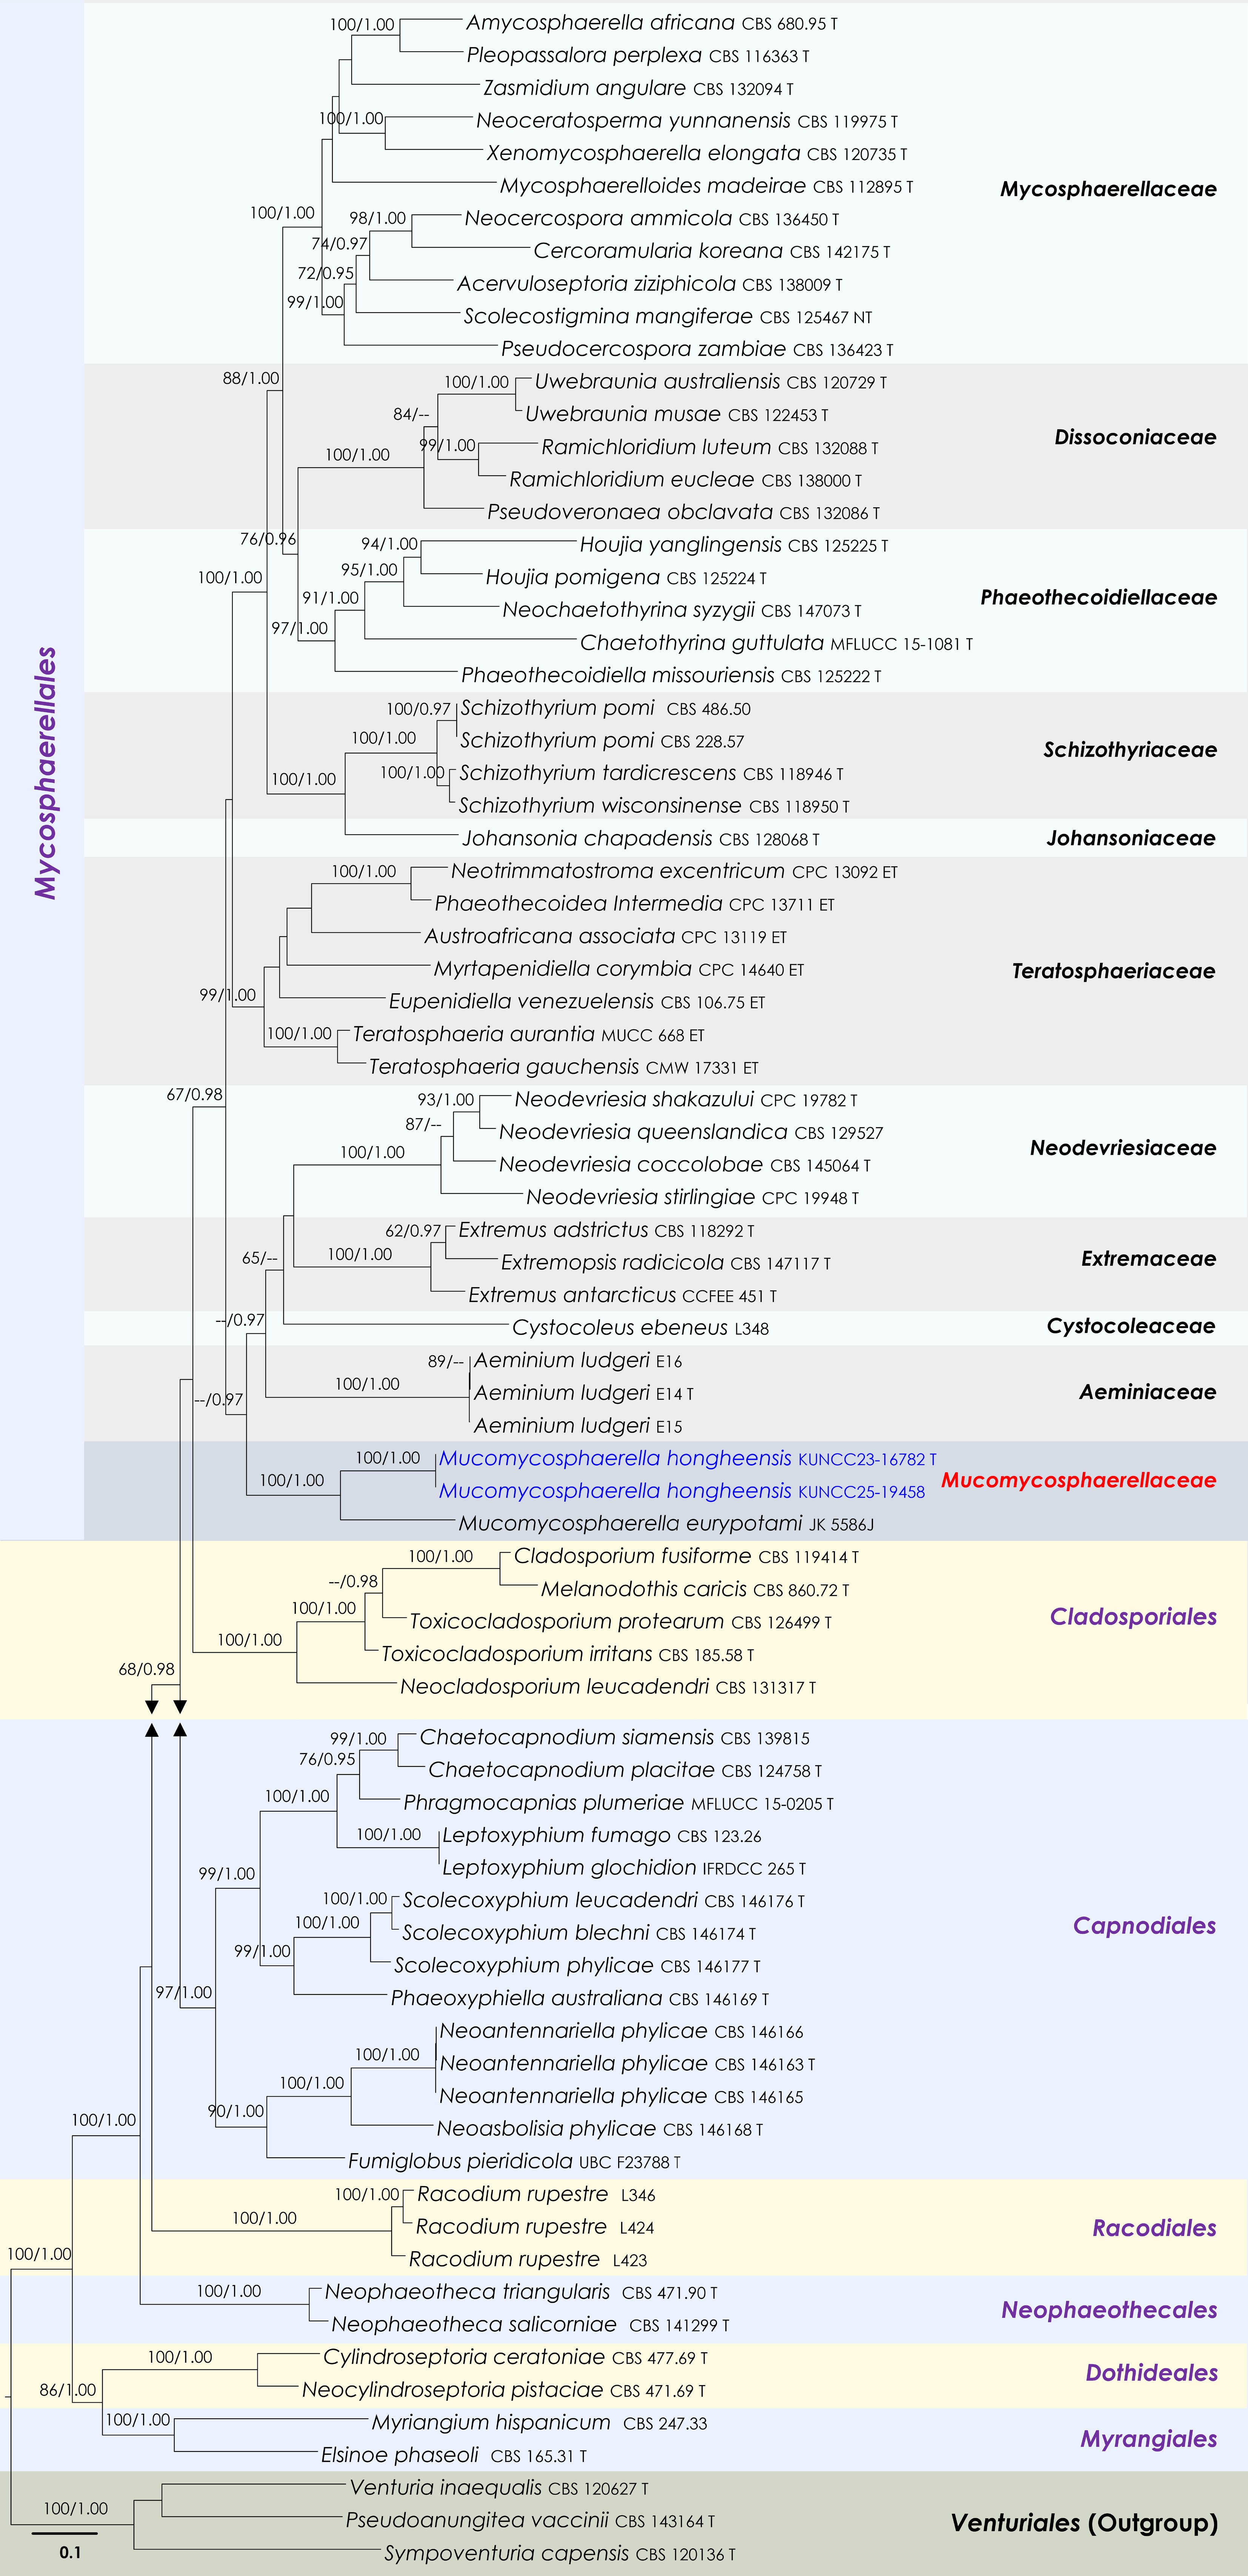
Figure 9.
Maximum Likelihood tree inferred from the concatenated dataset of partial LSU, ITS and rpb2 sequences. The phylogeny is rooted with Pseudoanungitea vaccinii (CBS 143164), Sympoventuria capensis (CBS 120136) and Venturia inaequalis (CBS 120627). The final likelihood value is –46,883.414087. The final alignment included 1,712 unique site patterns, with approximately 28.99% of the positions comprising gaps or ambiguous characters. The estimated nucleotide frequencies were as follows: A = 0.244142, C = 0.249865, G = 0.288498, T = 0.217496. The substitution model yielded the following relative rates: AC = 2.074748, AG = 3.272618, AT = 1.73051, CG = 1.485905, CT = 7.286184, GT = 1.000000. The proportion of invariable sites (I) was estimated at 0.36136 and the gamma distribution shape parameter (α) was 0.702452. Bayesian inference reached convergence after 467,000 generations, when the average standard deviation of split frequencies dropped below 0.01 (observed value: 0.009979). A total of 2,336 trees were sampled, and 1,752 of these were retained for the final analysis after discarding the initial 25% as burn-in. The alignment also revealed 1,714 distinct informative sites. Newly generated sequences are shown in blue. Ex-type and type strains are indicated with a 'T' at the end of the strain number.
-
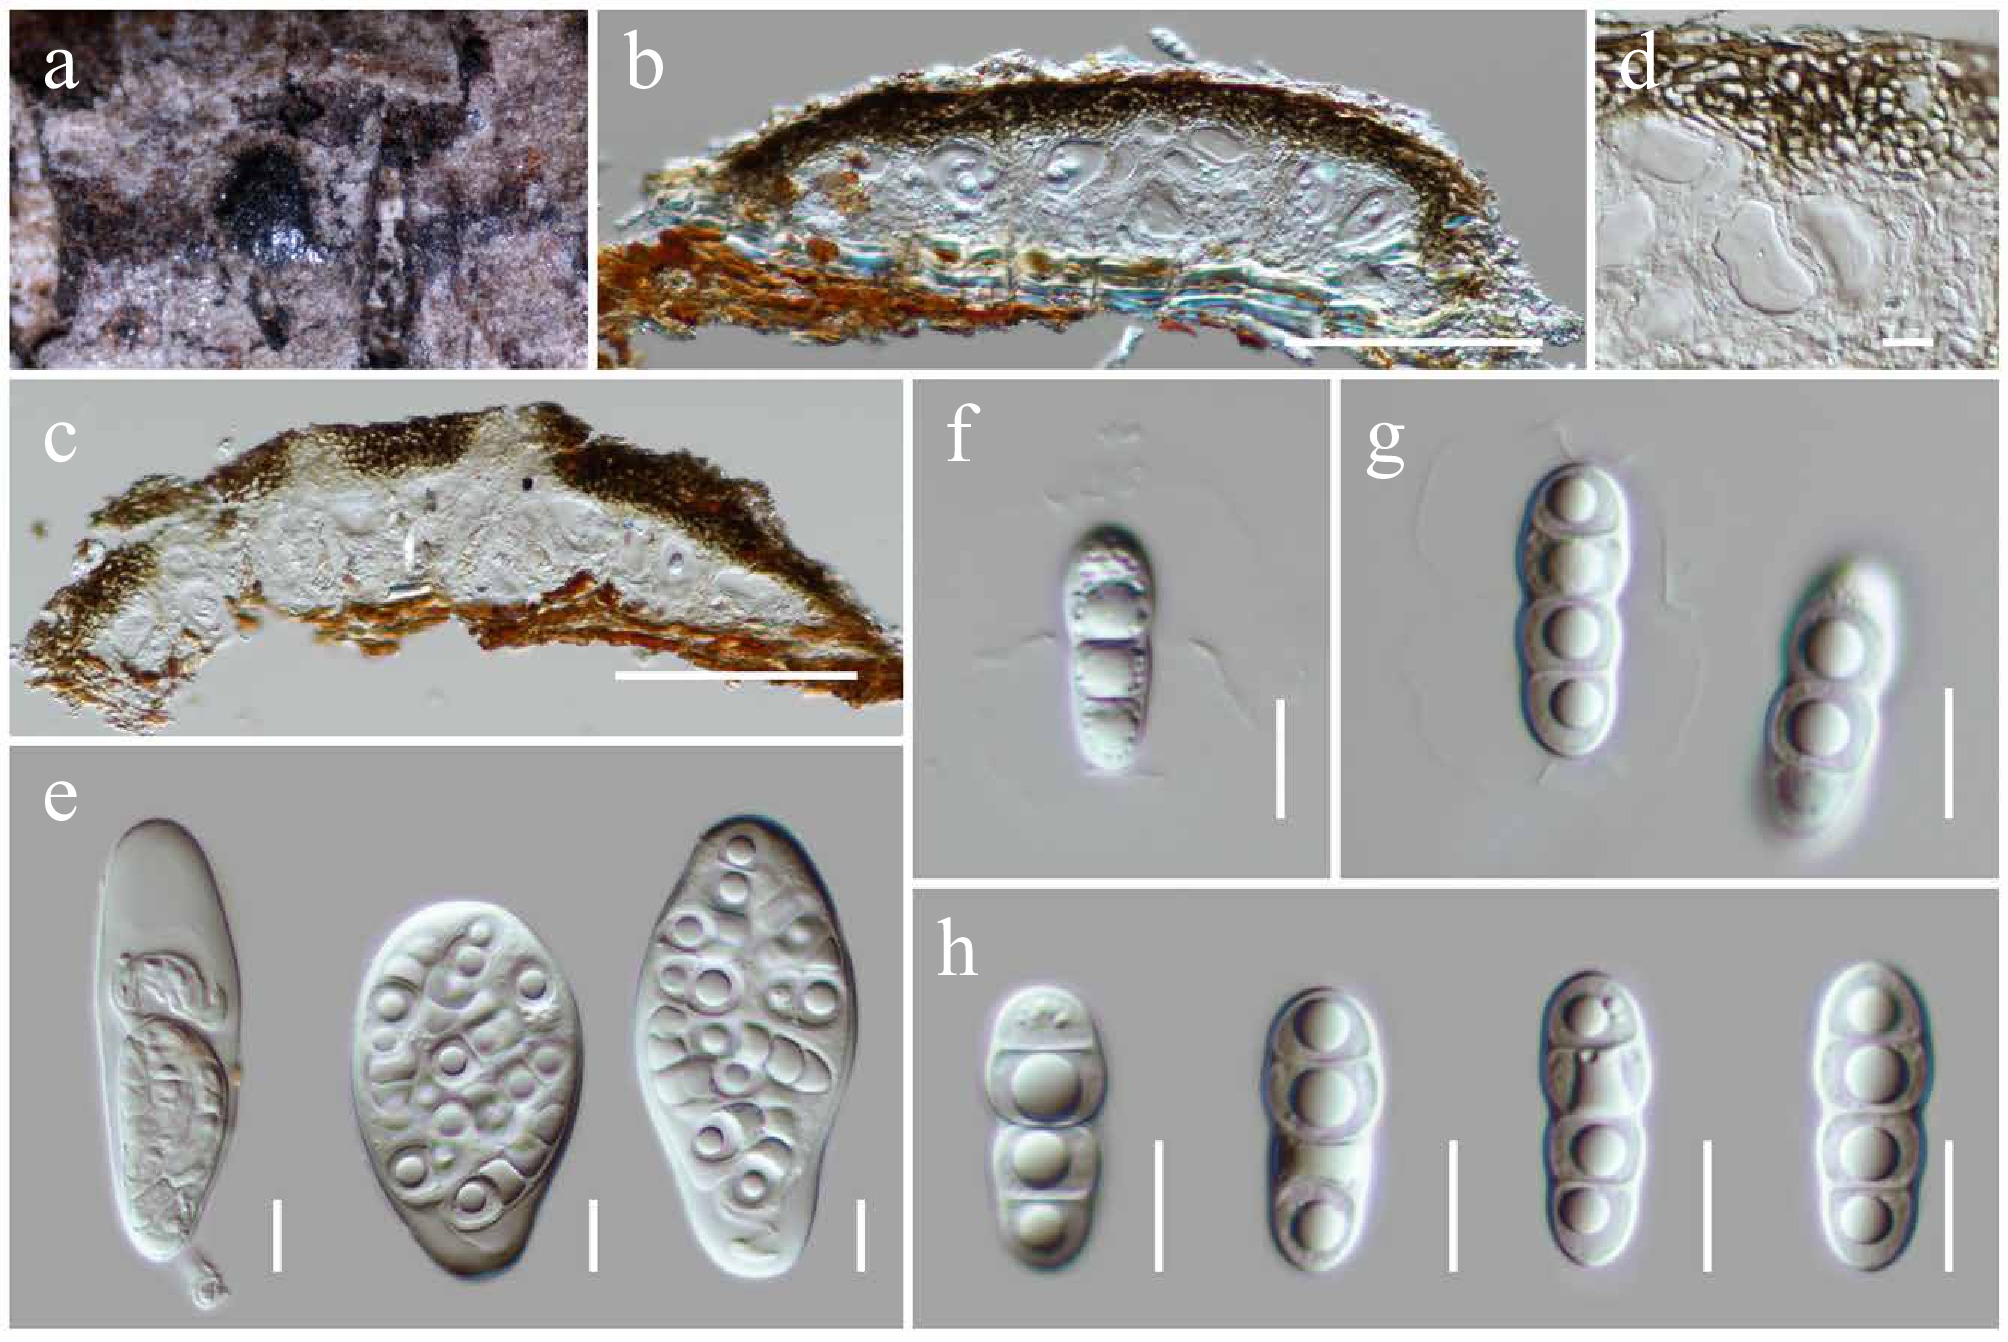
Figure 10.
Mucomycosphaerella hongheensis (HKAS146015, holotype). (a) Ascomata on the dead woody twigs. (b), (c) Cross-section of ascomata. (d) Peridium. (e) Asci. (f)–(h) Ascospores. Scale bars: (b), (c) = 100 µm, (d)–(h) = 10 µm.
-
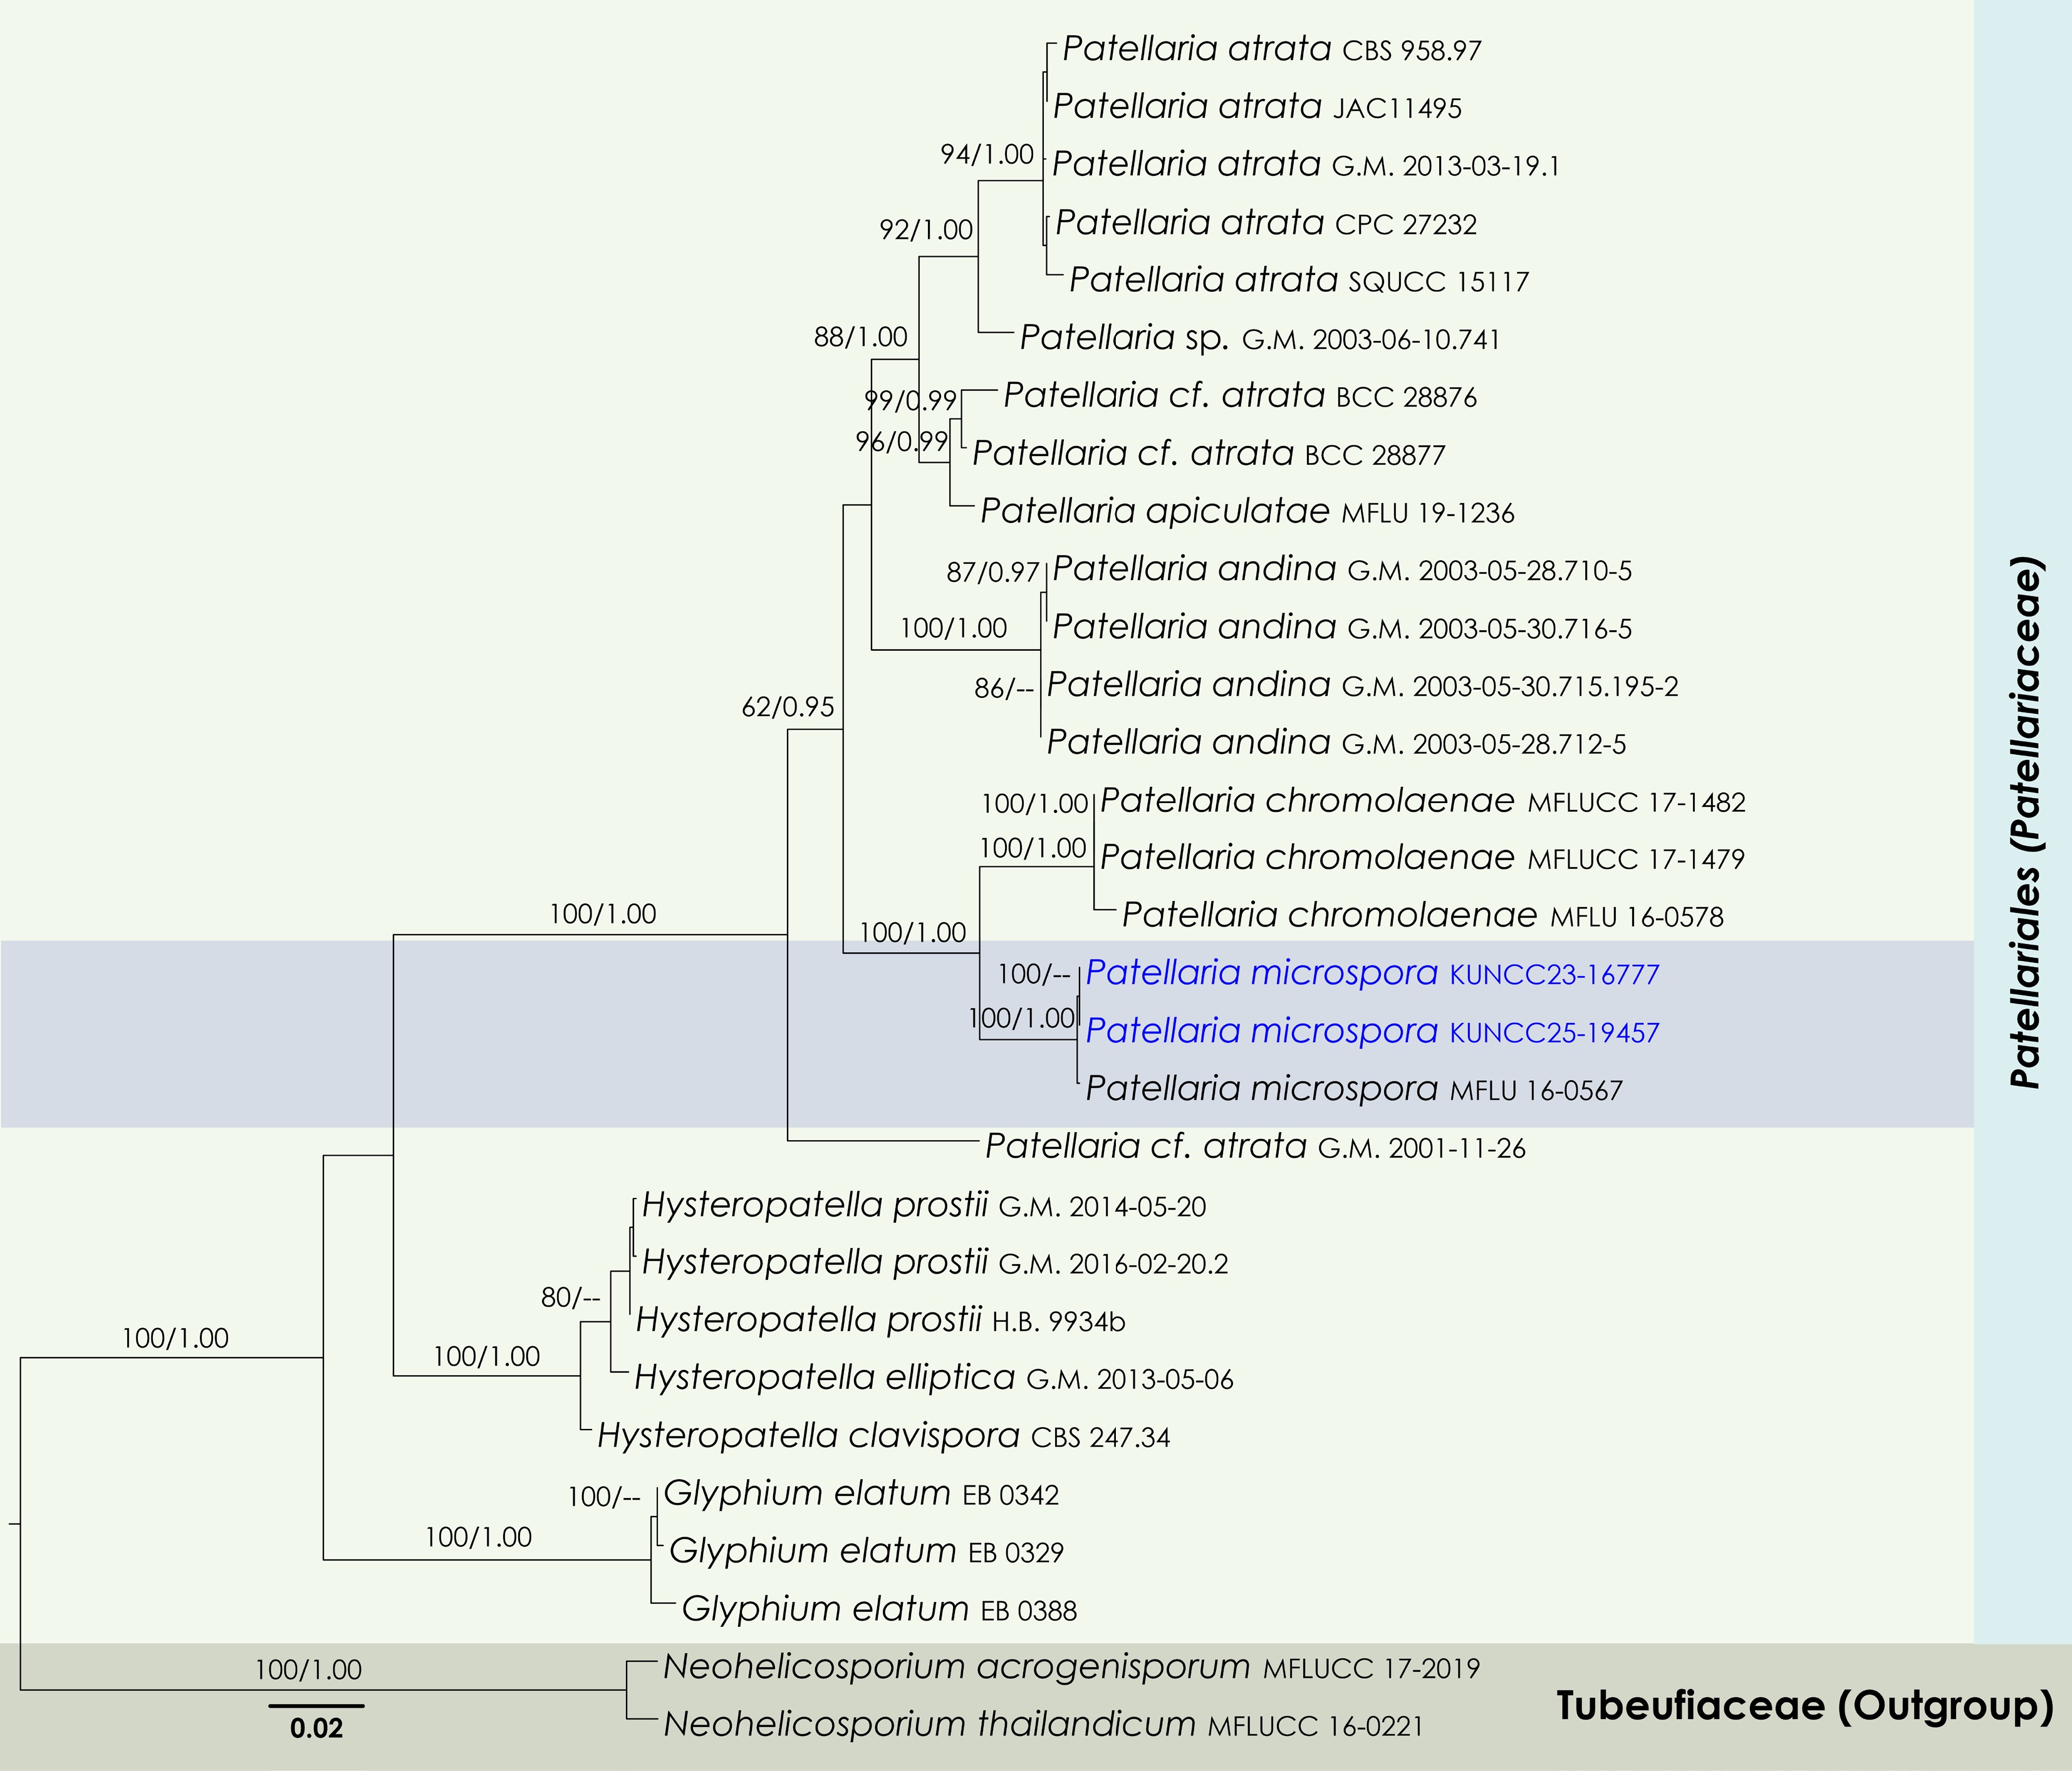
Figure 11.
Maximum Likelihood tree inferred from the concatenated dataset of partial SSU, LSU, ITS, and tef1-α sequences. The phylogeny is rooted with Neohelicosporium acrogenisporum (MFLUCC 17-2019) and N. thailandicum (MFLUCC 16-0221). The final likelihood value is –9911.771441. The final alignment included 749 unique site patterns, with approximately 42.67% of the positions comprising gaps or ambiguous characters. The estimated nucleotide frequencies were as follows: A = 0.245832, C = 0.243333, G = 0.273432, T = 0.237402. The substitution model yielded the following relative rates: AC = 2.866237, AG = 3.728289, AT = 2.673312, CG = 1.344539, CT = 15.427322, GT = 1.000000. The proportion of invariable sites (I) was estimated at 0.580820, and the gamma distribution shape parameter (α) was 0.704216. Bayesian inference reached convergence after 176,000 generations, when the average standard deviation of split frequencies dropped below 0.01 (observed value: 0.009992). A total of 881 trees were sampled, and 661 of these were retained for the final analysis after discarding the initial 25% as burn-in. The alignment also revealed 754 distinct informative sites. In the resulting phylograms, sequences generated in this study are highlighted in blue.
-
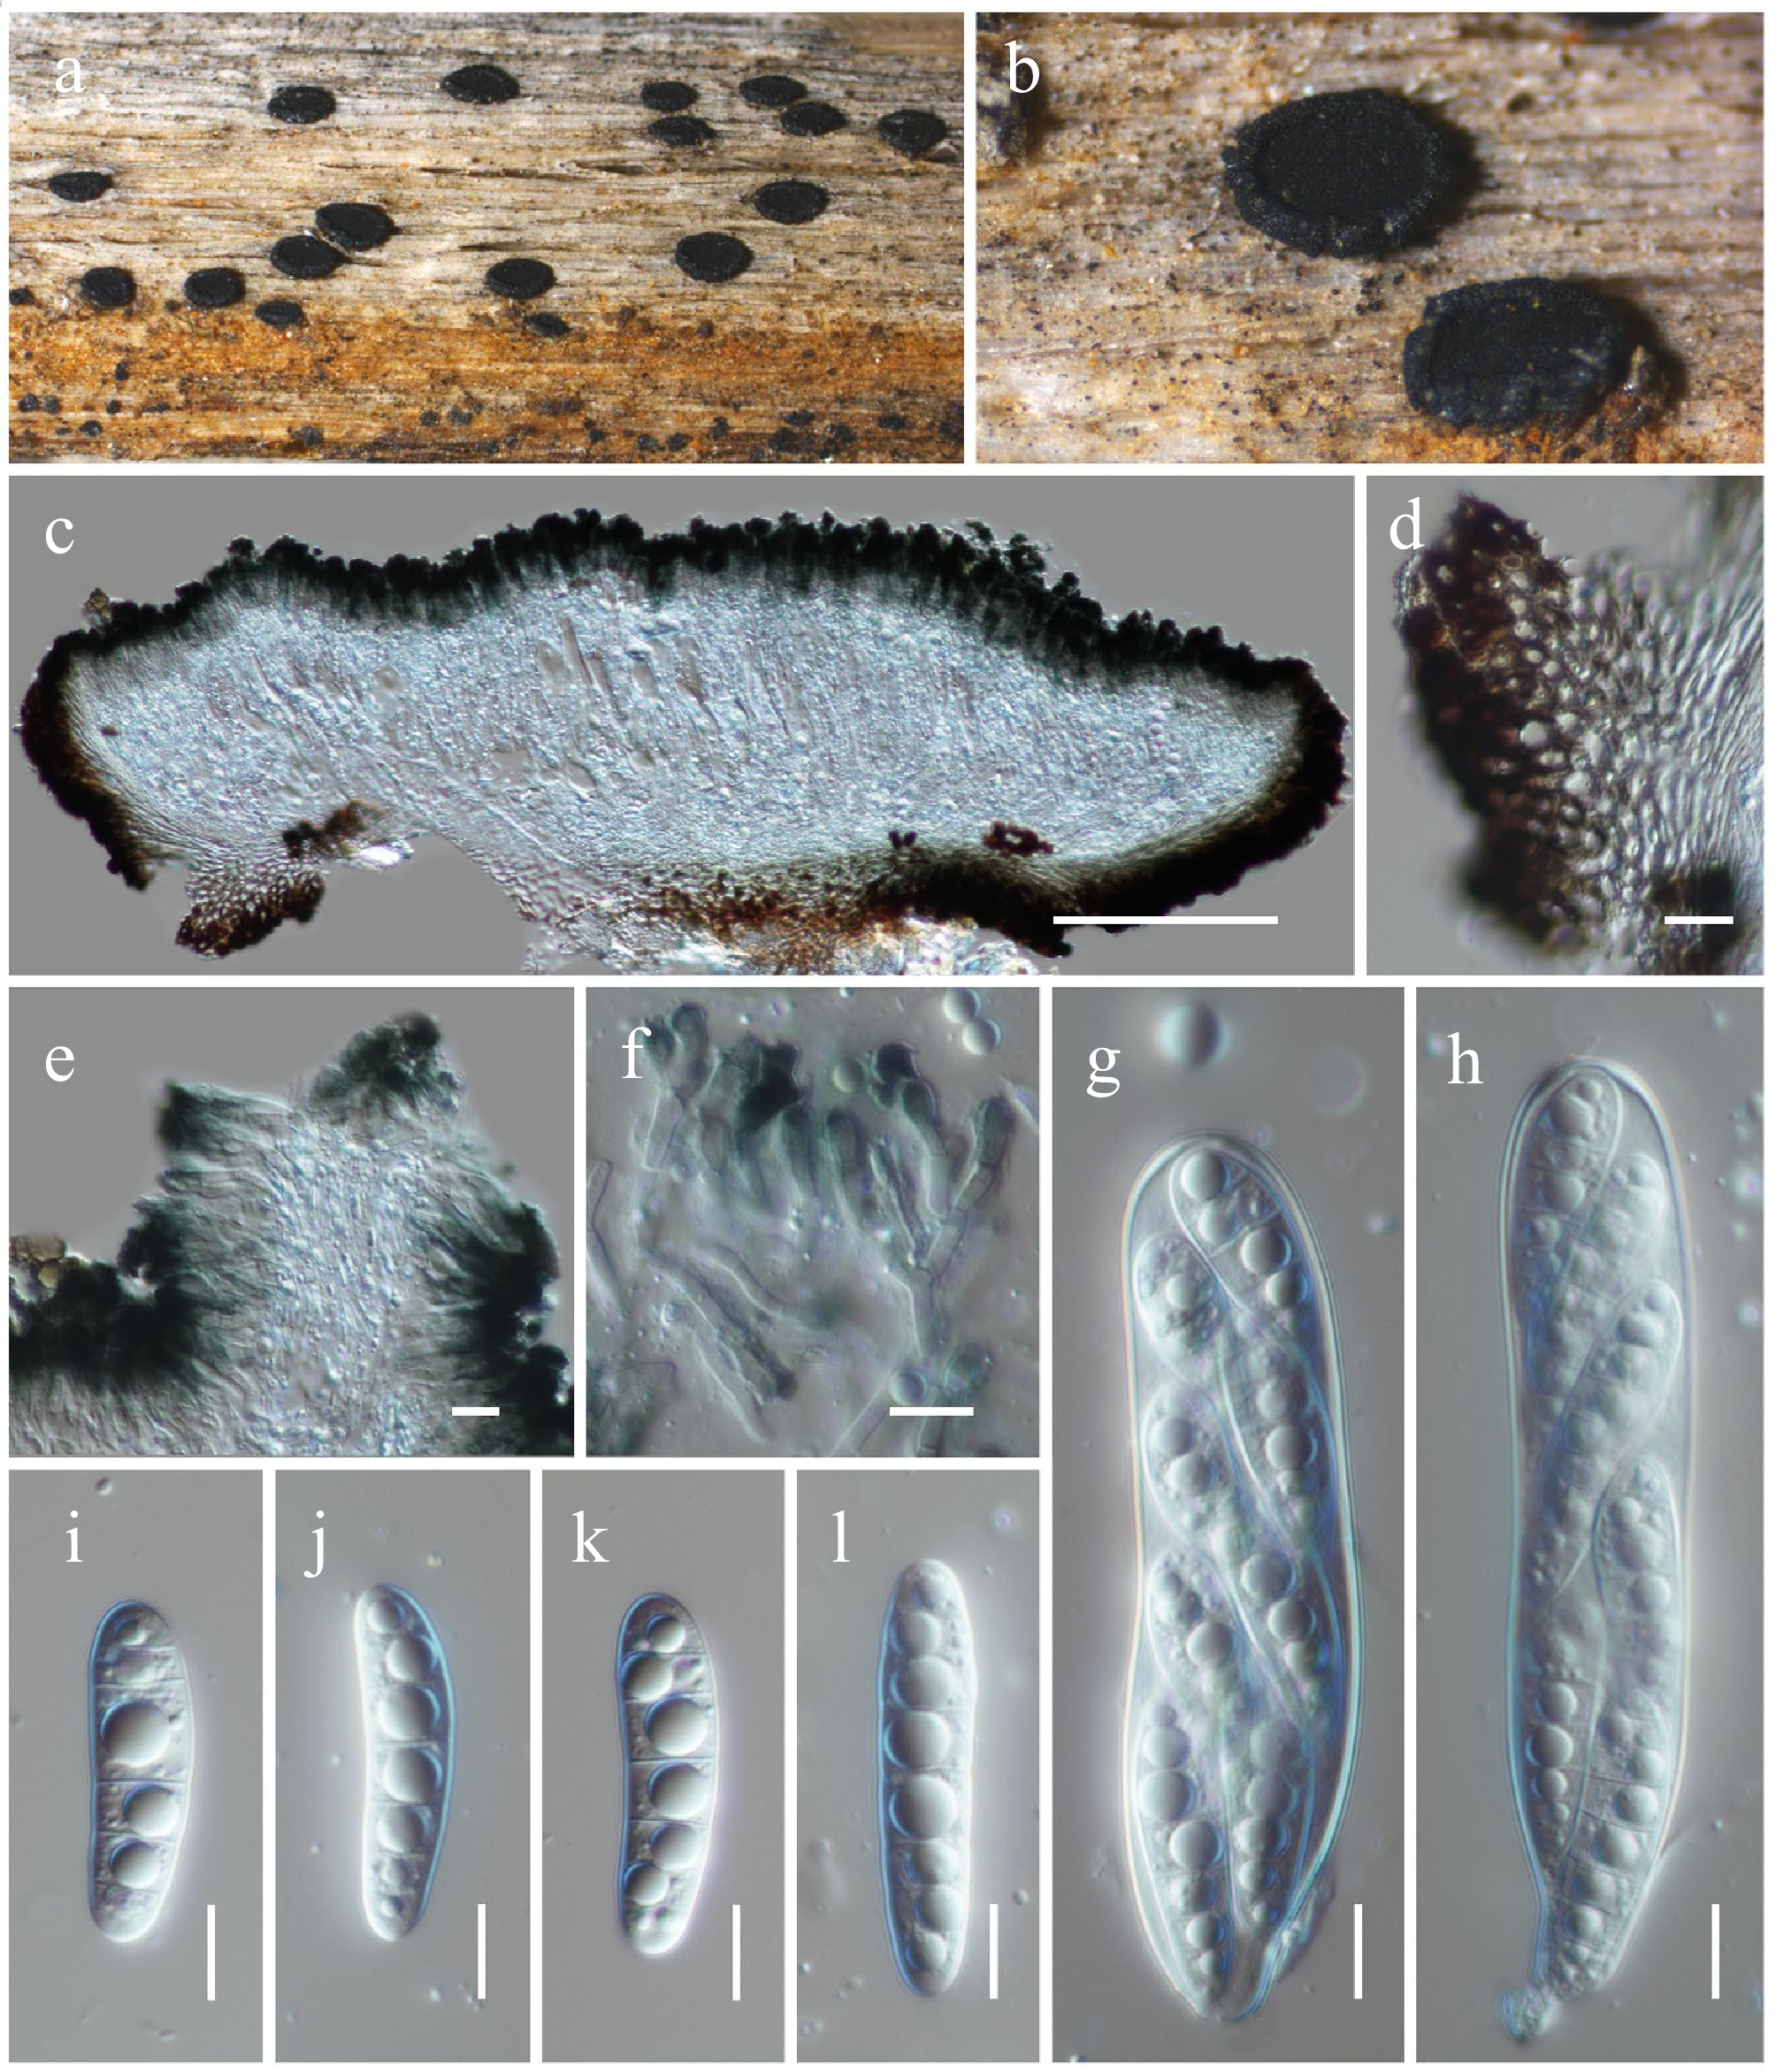
Figure 12.
Patellaria microspora (HKAS146017). (a), (b) Apothecia on host substrate. (c) Cross-section of an apothecial ascoma. (d) Exciple. (e) Paraphyses. (f) Branched paraphyses, with swollen and rounded at the apex. (g), (h) Asci. (i)–(l) Ascospores. Scale bars: (c) = 100 µm, (d)–(h) = 10 µm.
-
Figure 13.
Maximum Likelihood tree inferred from the concatenated dataset of partial SSU, LSU, ITS, tef1-α, and rpb2 sequences. The phylogeny is rooted with Mytilinidion resinicola (CBS 304.34) and M. scolecosporum (CBS 305.34). The final likelihood value is –24165.625703. The final alignment included 1,579 unique site patterns, with approximately 41.67% of the positions comprising gaps or ambiguous characters. The estimated nucleotide frequencies were as follows: A = 0.244857, C = 0.256513, G = 0.274249, T = 0.224381. The substitution model yielded the following relative rates: AC = 1.294483, AG = 3.792940, AT = 1.360675, CG = 1.200289, CT = 9.762669, GT = 1.000000. The proportion of invariable sites (I) was estimated at 0.455208, and the gamma distribution shape parameter (α) was 0.434309. Bayesian inference reached convergence after 2,141,000 generations, when the average standard deviation of split frequencies dropped below 0.01 (observed value: 0.009965). A total of 21,411 trees were sampled, and 16,059 of these were retained for the final analysis after discarding the initial 25% as burn-in. The alignment also revealed 1,580 distinct informative sites. In the resulting phylograms, sequences generated in this study are highlighted in blue, while ex-type or type strains are indicated in boldface.
-
Figure 14.
Anteaglonium hongheense (HKAS146019, holotype). (a), (b) Hysterothecia on substrate. (c) Cross-section through hysterothecia. (d) Peridium. (e) Asci with pseudoparaphyses. (f), (g) Ascospores. Scale bars: (d), (e) = 10 µm, (f), (g) = 5 µm.
-
Figure 15.
Maximum Likelihood tree inferred from the concatenated dataset of partial LSU, ITS, rpb2 and tub2 sequences. The phylogeny is rooted with Leptosphaeria conoidea (CBS 616.75) and L. doliolum (CBS 505.75). The final likelihood value is –30,111.669487. The final alignment included 1,051 unique site patterns, with approximately 16.06% of the positions comprising gaps or ambiguous characters. The estimated nucleotide frequencies were as follows: A = 0.240399, C = 0.243000, G = 0.274422, T = 0.242180. The substitution model yielded the following relative rates: AC = 2.034753, AG = 7.468658, AT = 2.243260, CG = 1.095539, CT = 14.634190, GT = 1.000000. The proportion of invariable sites (I) was estimated at 0.633611, and the gamma distribution shape parameter (α) was 0.621330. Bayesian inference reached convergence after 1,476,000 generations, when the average standard deviation of split frequencies dropped below 0.01 (observed value: 0.009988). A total of 14,761 trees were sampled, and 11,071 of these were retained for the final analysis after discarding the initial 25% as burn-in. The alignment also revealed 1,053 distinct informative sites. In the resulting phylograms, sequences generated in this study are highlighted in blue, while ex-type or type strains are indicated with a 'T' at the end of the strain number.
-
Figure 16.
Gruyteromyces hongheensis (HKAS146022, holotype). (a)–(c) Conidiomata on host. (d) Pycnidial wall. (e) Conidiogenous cell. (f) Conidia. (g), (h) Colony on PDA (h from the bottom). Scale bars: (d)–(f) = 10 µm.
-
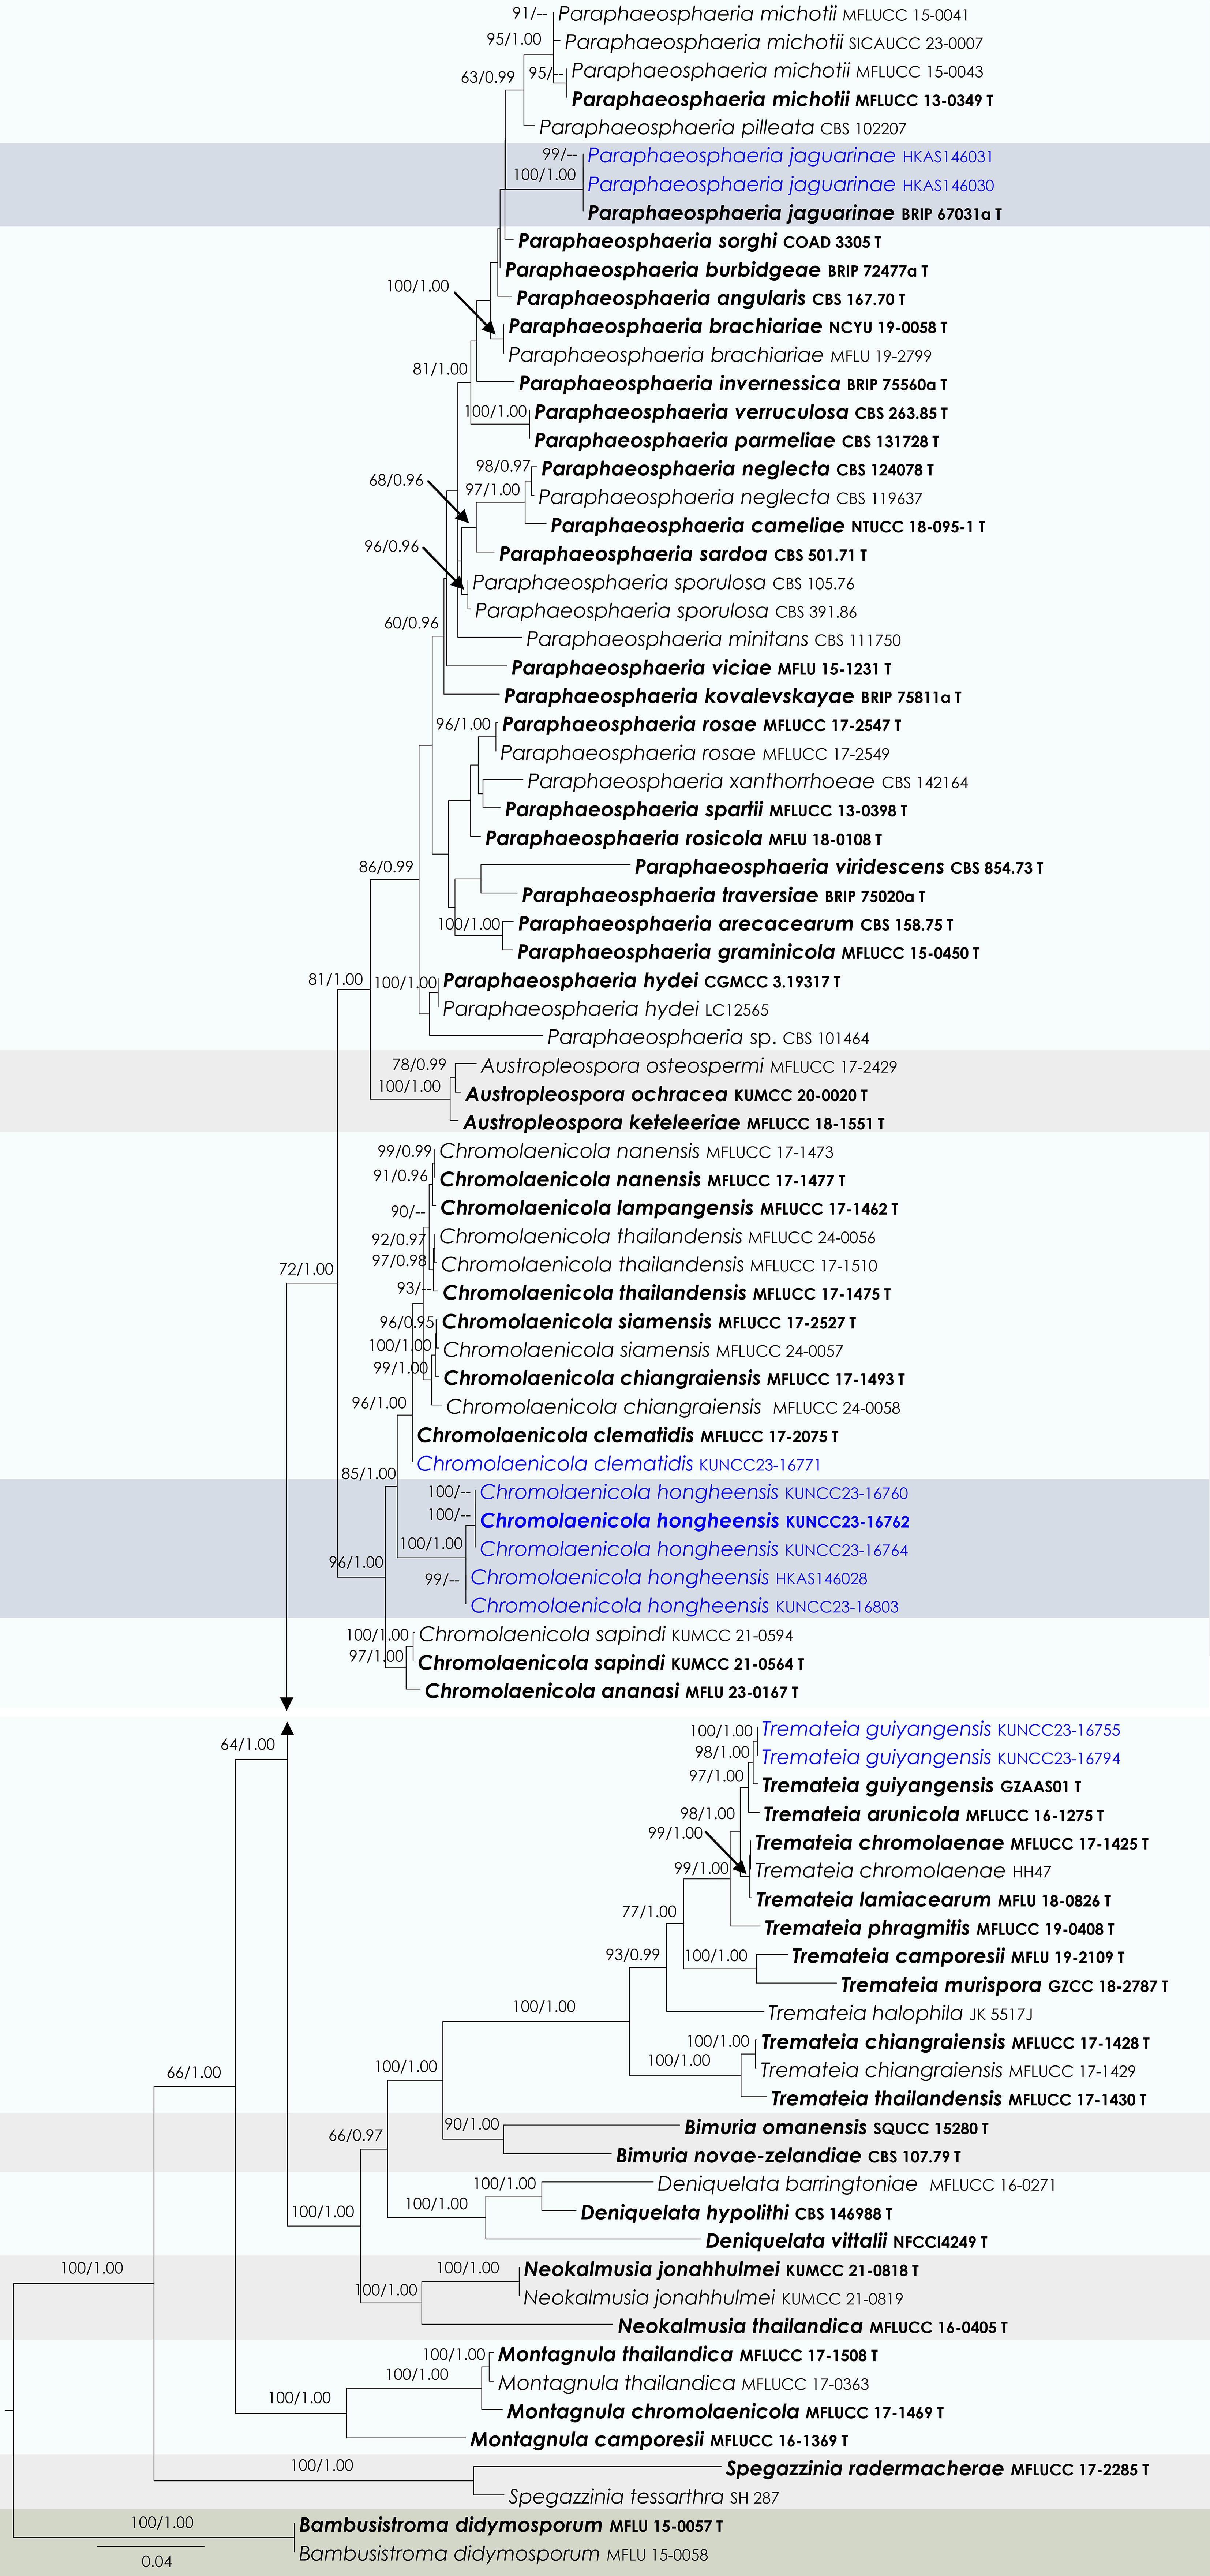
Figure 17.
Maximum Likelihood tree inferred from the concatenated dataset of partial SSU, LSU, ITS, tef1-α and rpb2 sequences. The phylogeny is rooted with Bambusistroma didymosporum (MFLU 15-0057, MFLU 15-0058). The final likelihood value is –29,800.793962. The final alignment included 1,978 unique site patterns, with approximately 36.43% of the positions comprising gaps or ambiguous characters. The estimated nucleotide frequencies were as follows: A = 0.238939, C = 0.255983, G = 0.270197, T = 0.234881. The substitution model yielded the following relative rates: AC = 1.677295, AG = 3.846144, AT = 1.480569, CG = 1.417310, CT = 8.251750, GT = 1.000000. The proportion of invariable sites (I) was estimated at 0.419546, and the gamma distribution shape parameter (α) was 0.473863. Bayesian inference reached convergence after 2,194,000 generations, when the average standard deviation of split frequencies dropped below 0.01 (observed value: 0.009957). A total of 21,941 trees were sampled, and 16,456 of these were retained for the final analysis after discarding the initial 25% as burn-in. The alignment also revealed 1,981 distinct informative sites. In the resulting phylograms, sequences generated in this study are highlighted in blue, while ex-type or type strains are indicated in boldface.
-
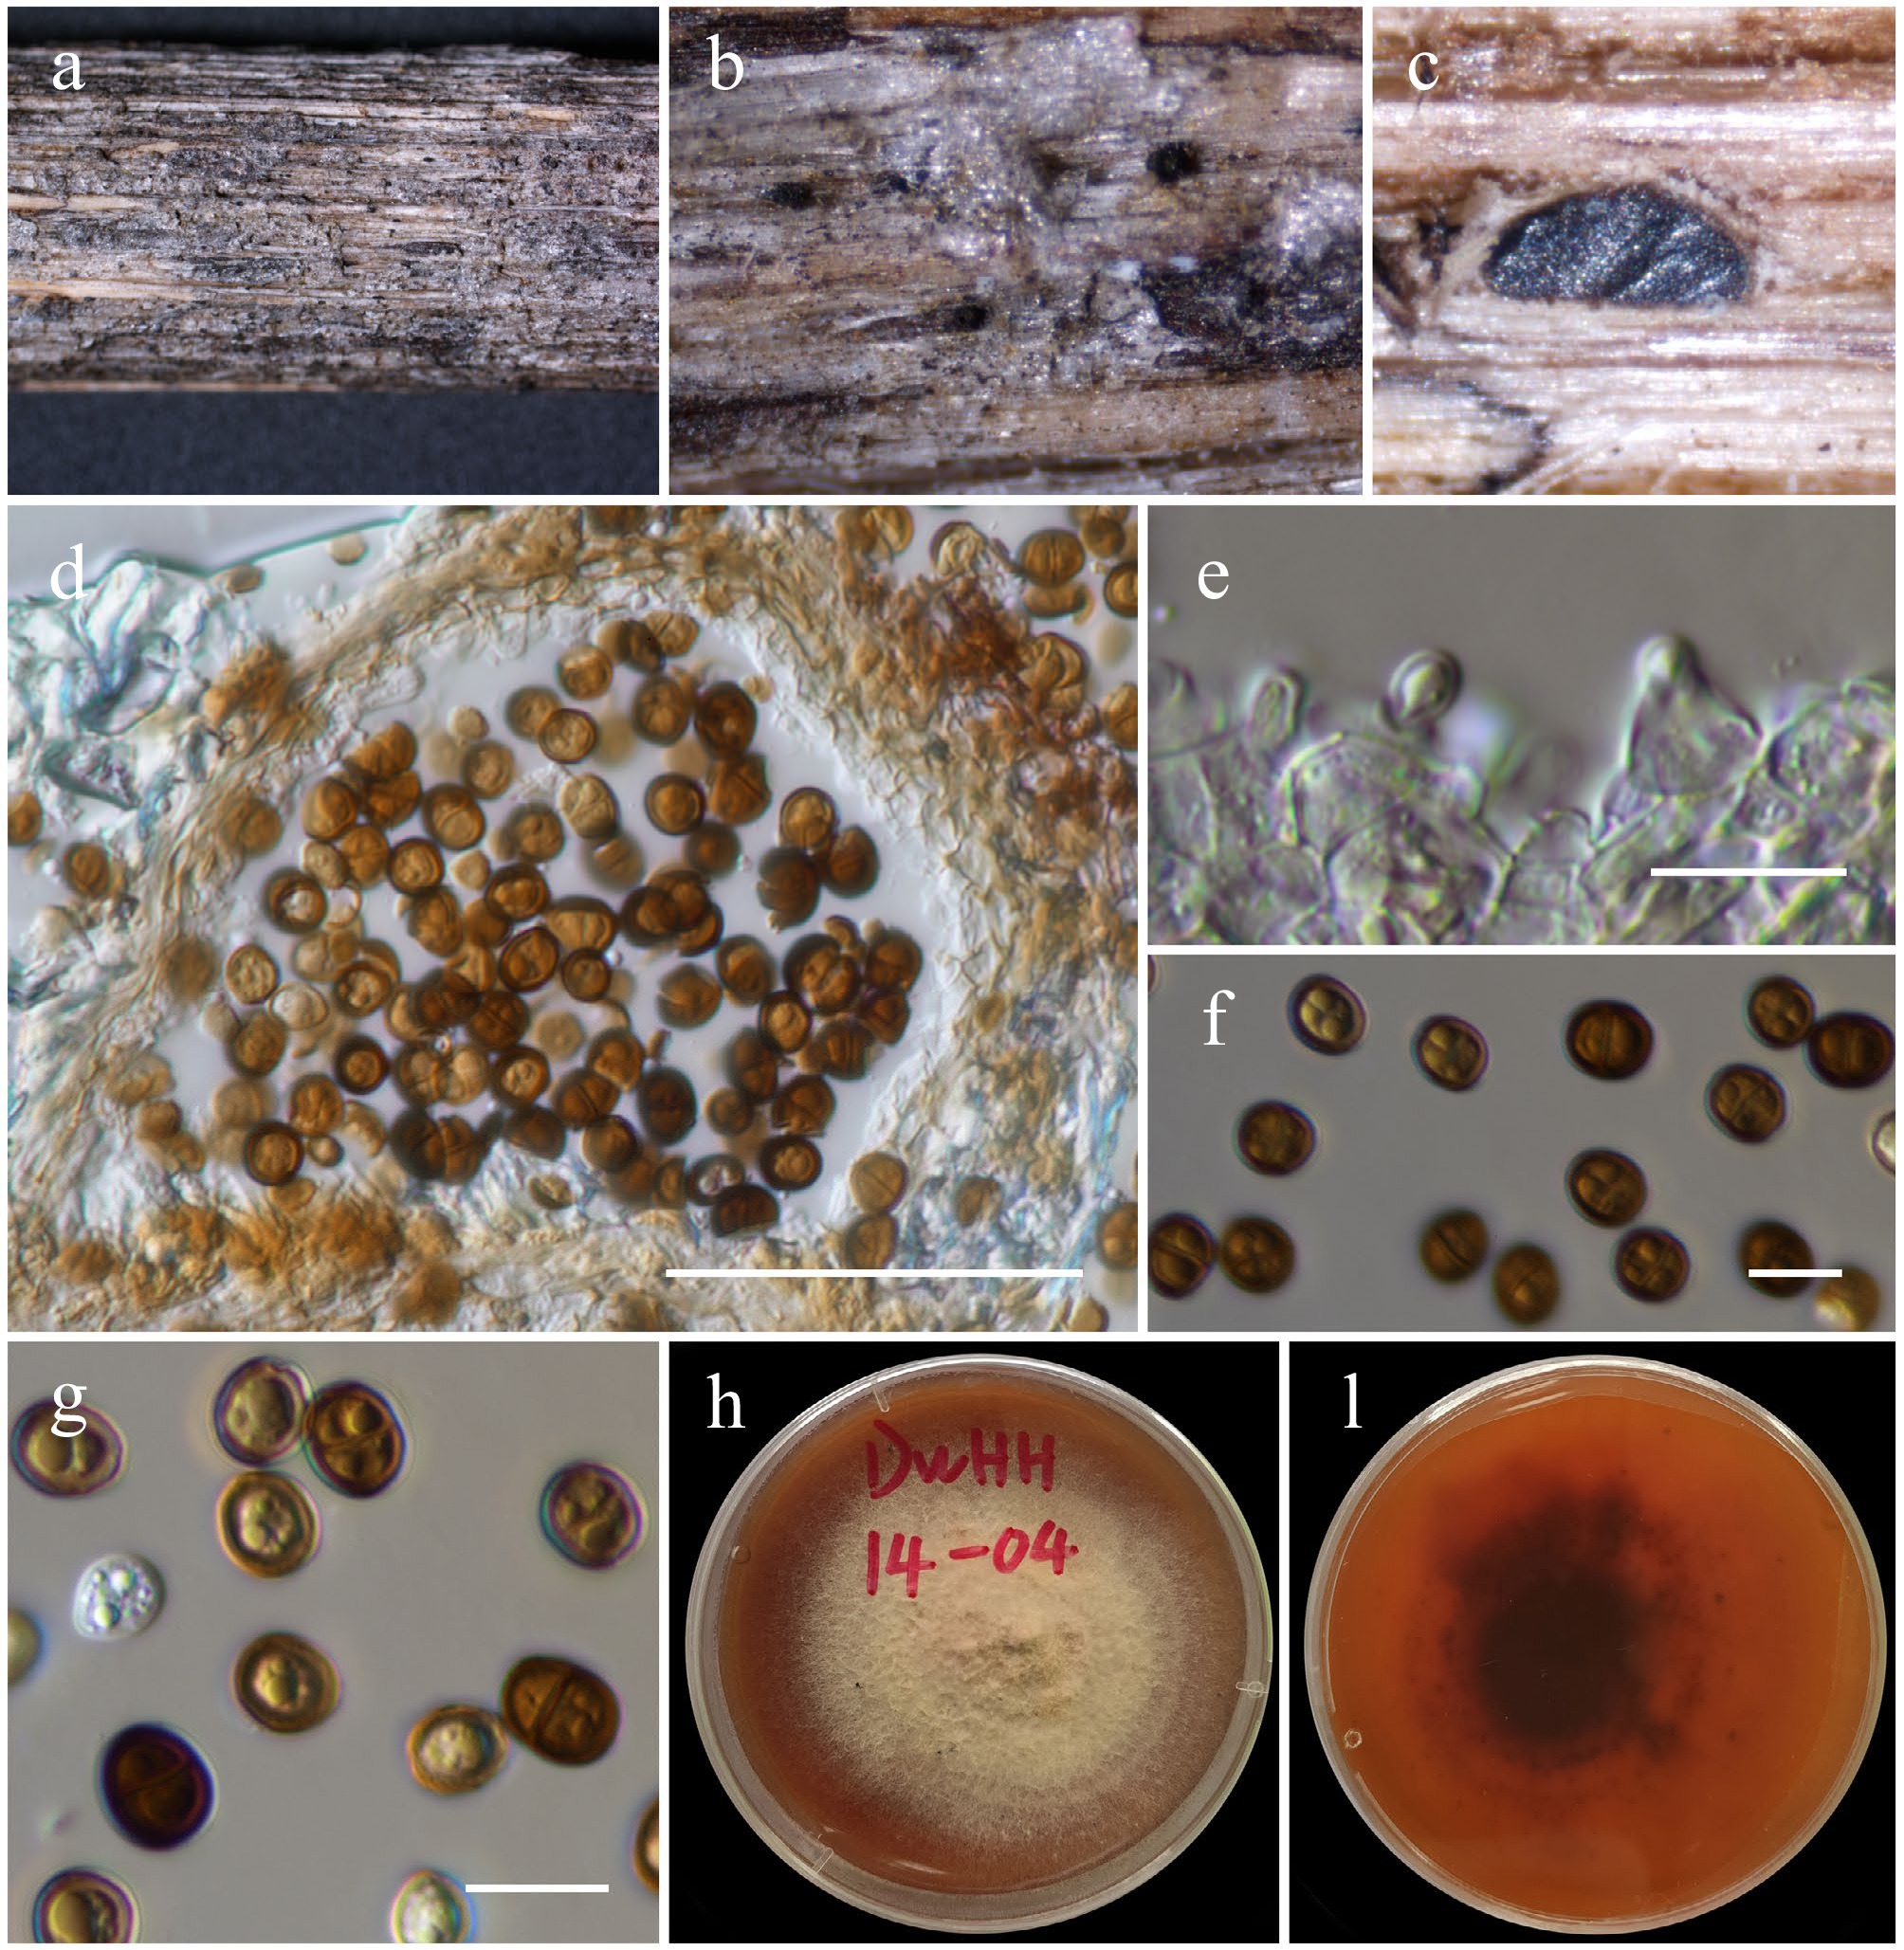
Figure 18.
Chromolaenicola clematidis (HKAS146029). (a), (b) Conidiomata on host. (c), (d) Sections of conidiomata. (e) Conidiogenous cells. (f), (g) Conidia. (h), (i) Colony on MEA (i from the bottom). Scale bars: (d) = 50 µm, (e)–(g) = 10 µm.
-
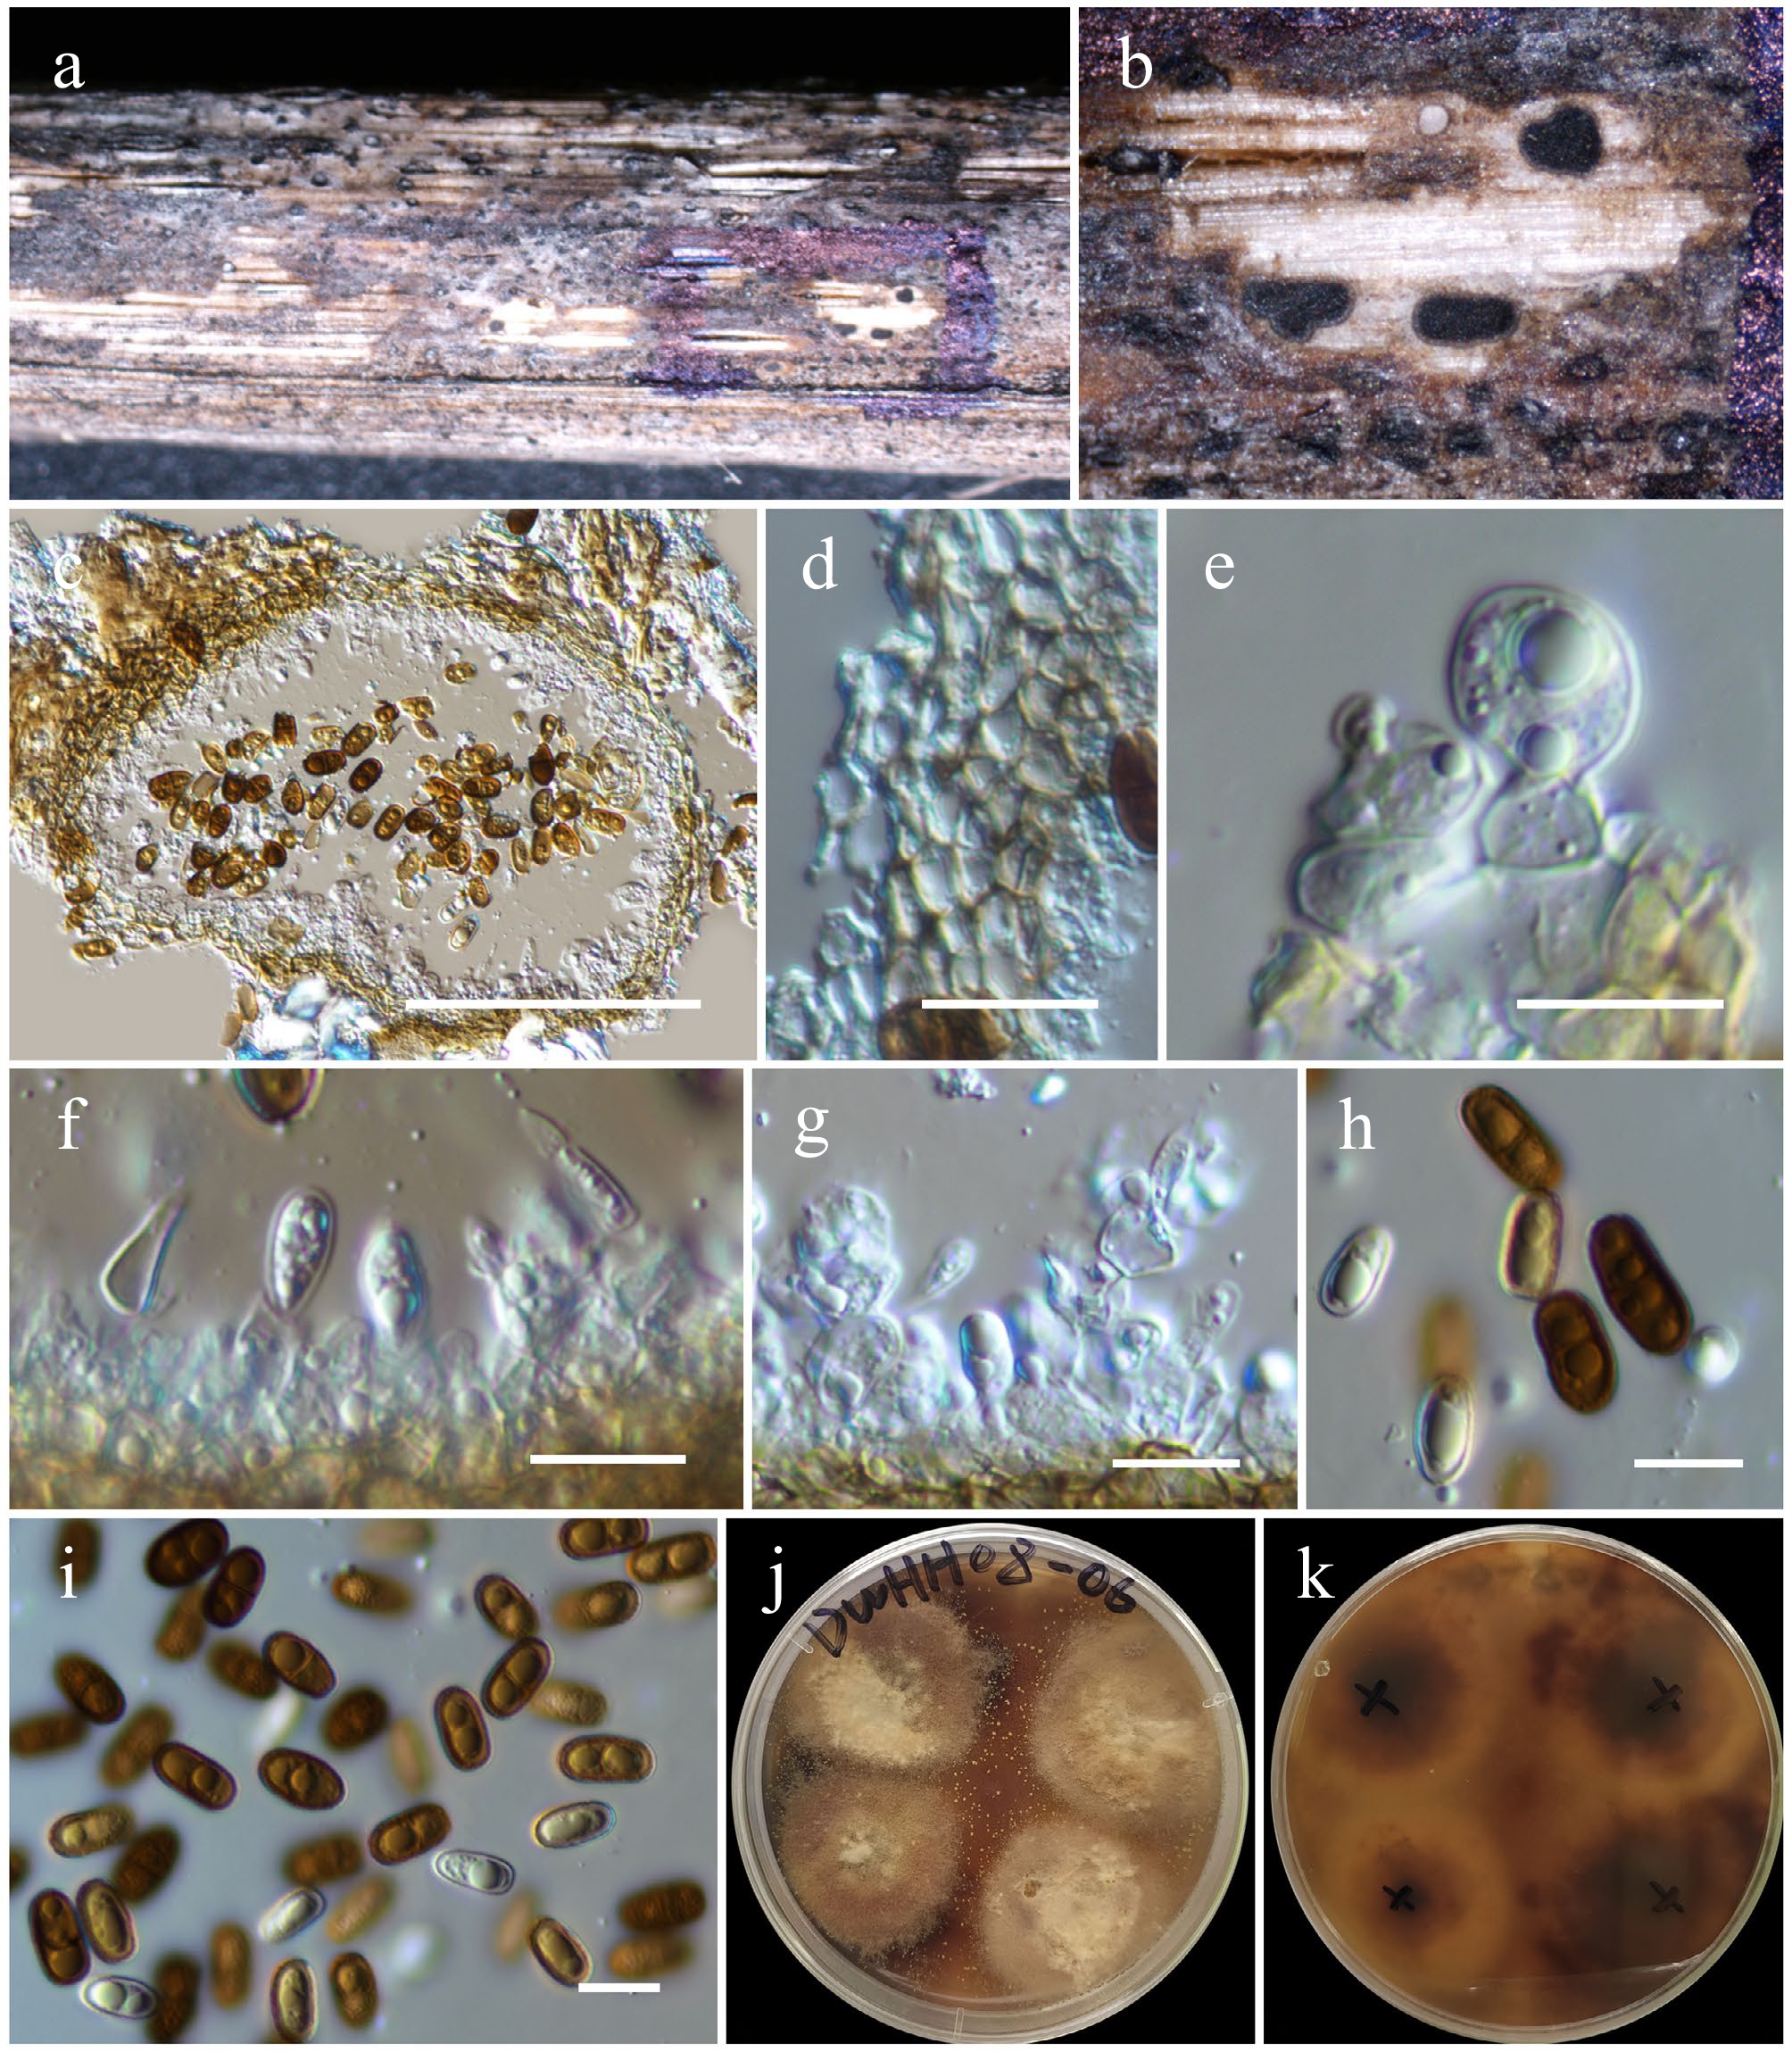
Figure 19.
Chromolaenicola hongheensis (HKAS146024, holotype). (a) Conidiomata on host. (b), (c) Sections of conidiomata. (d) Pycnidial wall. (e)–(g) Conidiogenous cells. (h), (i) Conidia. (j), (k) Colony on PDA (k from the bottom). Scale bars: (c) = 100 µm, (d)–(i) = 10 µm.
-
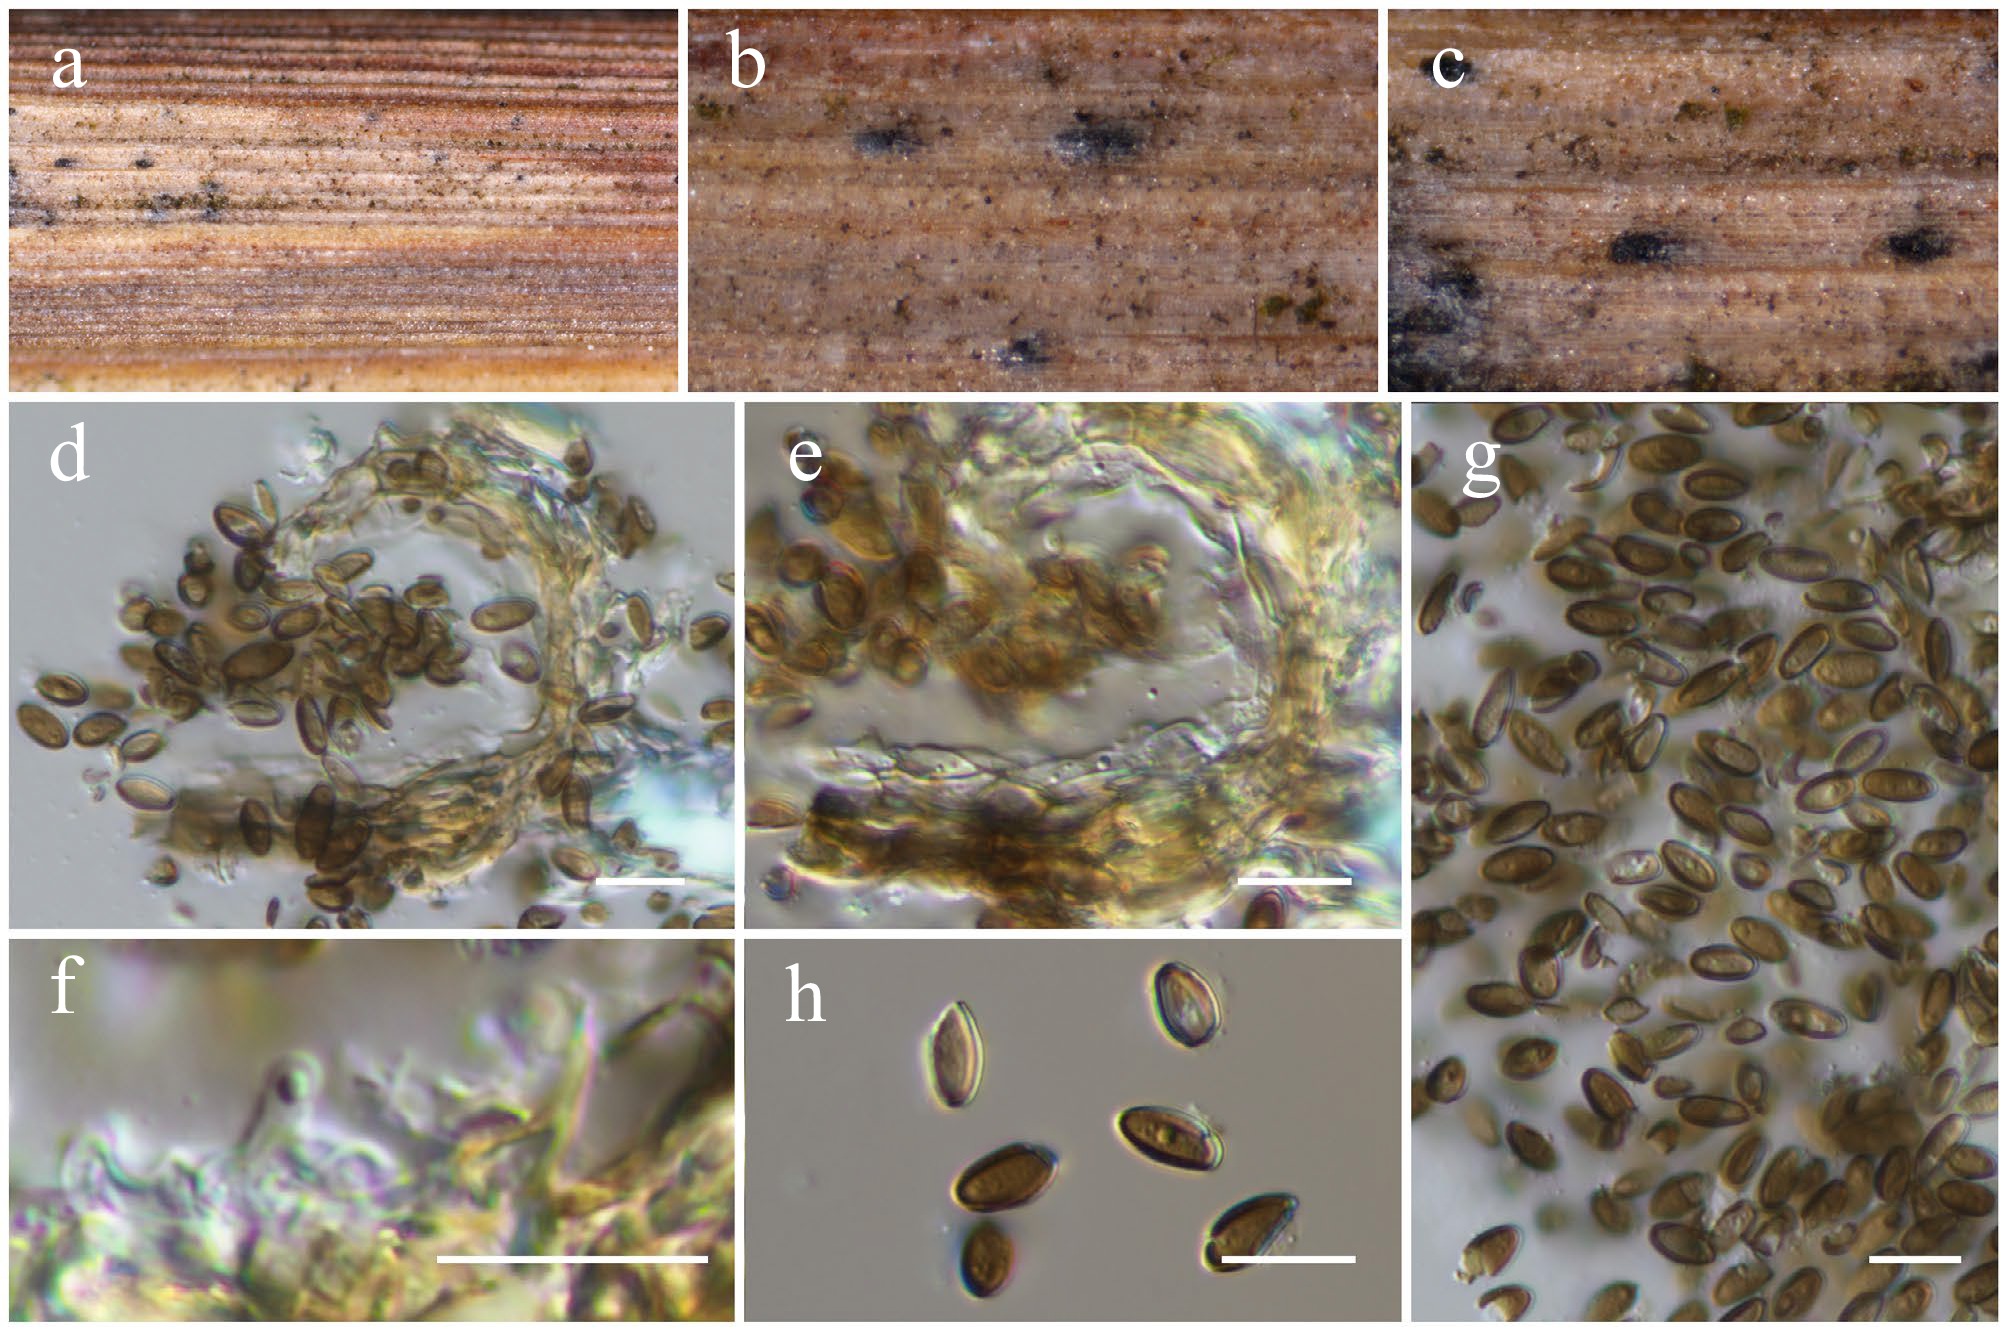
Figure 20.
Paraphaeosphaeria jaguarinae (HKAS146030). (a)–(c) Conidiomata on host. (d) Section of a conidioma. (e) Pycnidial wall. (f) Conidiogenous cells. (g), (h) Conidia. Scale bars: (d)–(h) = 10 µm.
-
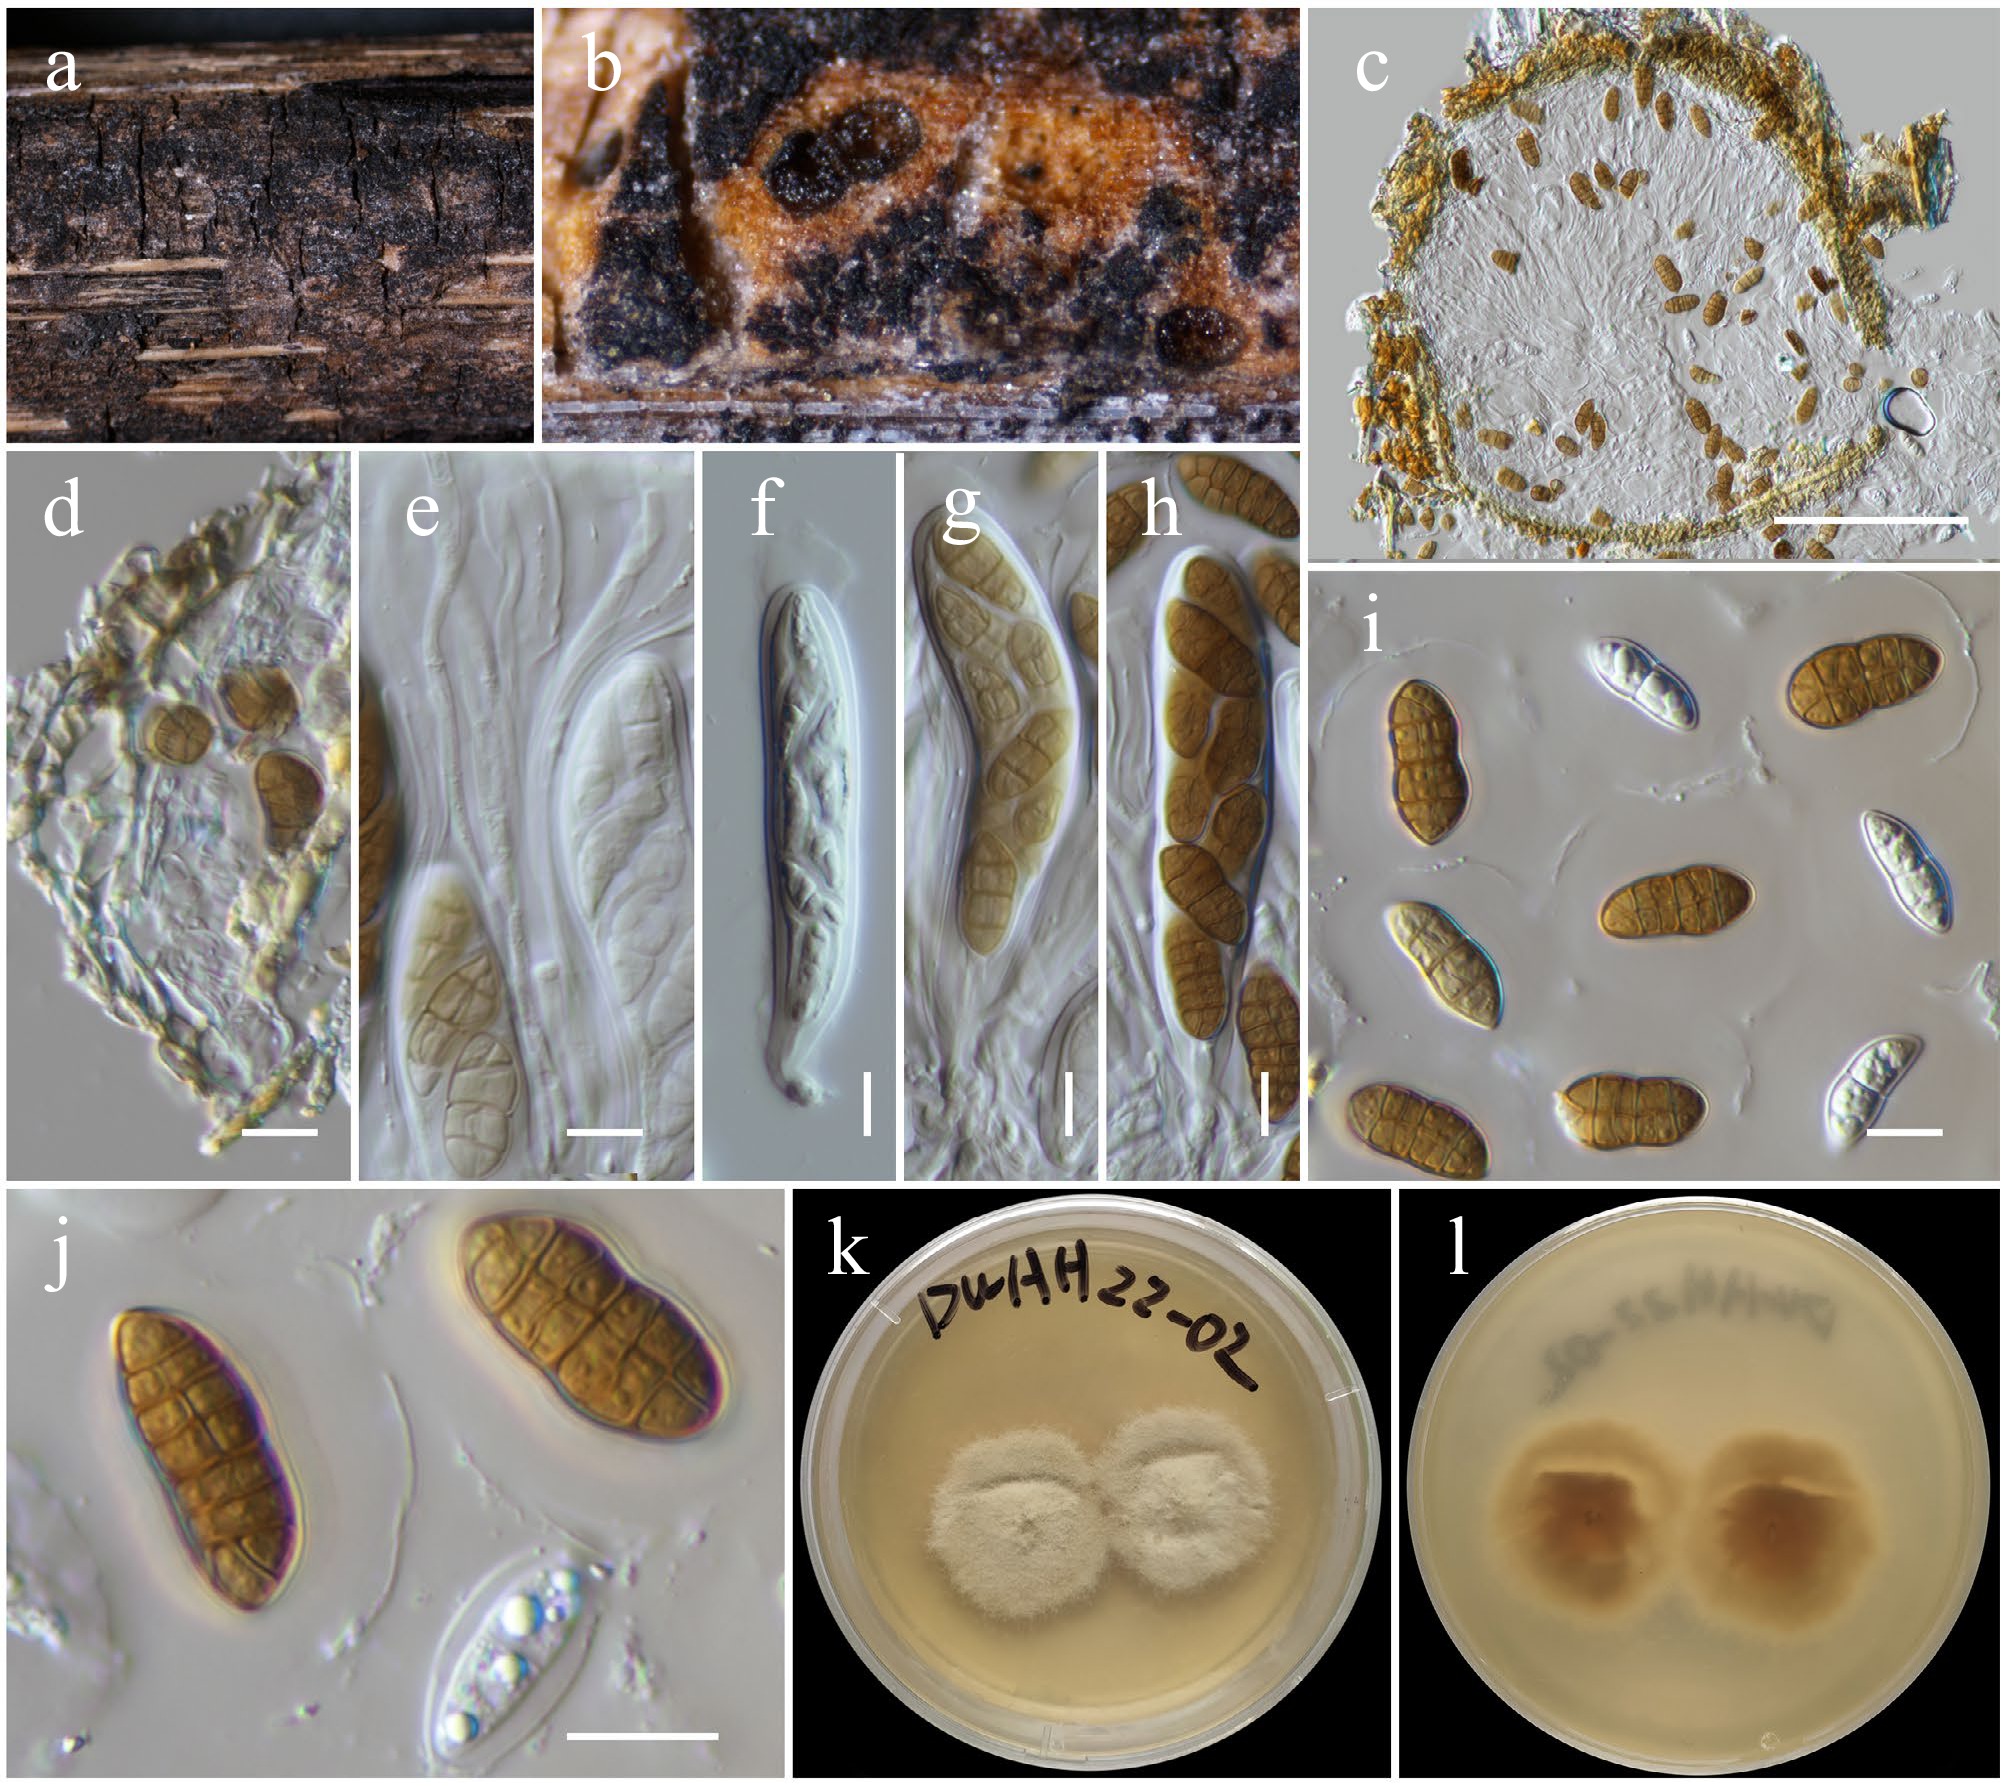
Figure 21.
Tremateia guiyangensis (HKAS146033). (a) Ascomata on the dead woody twigs. (b), (c) Cross-section of ascomata. (d) Peridium. (e) Pseudoparaphyses. (f)–(h) Asci. (i), (j) Ascospores. (k), (l) Colony on PDA (l from the bottom). Scale bars: (c) = 100 µm, (d)–(j) = 10 µm.
-
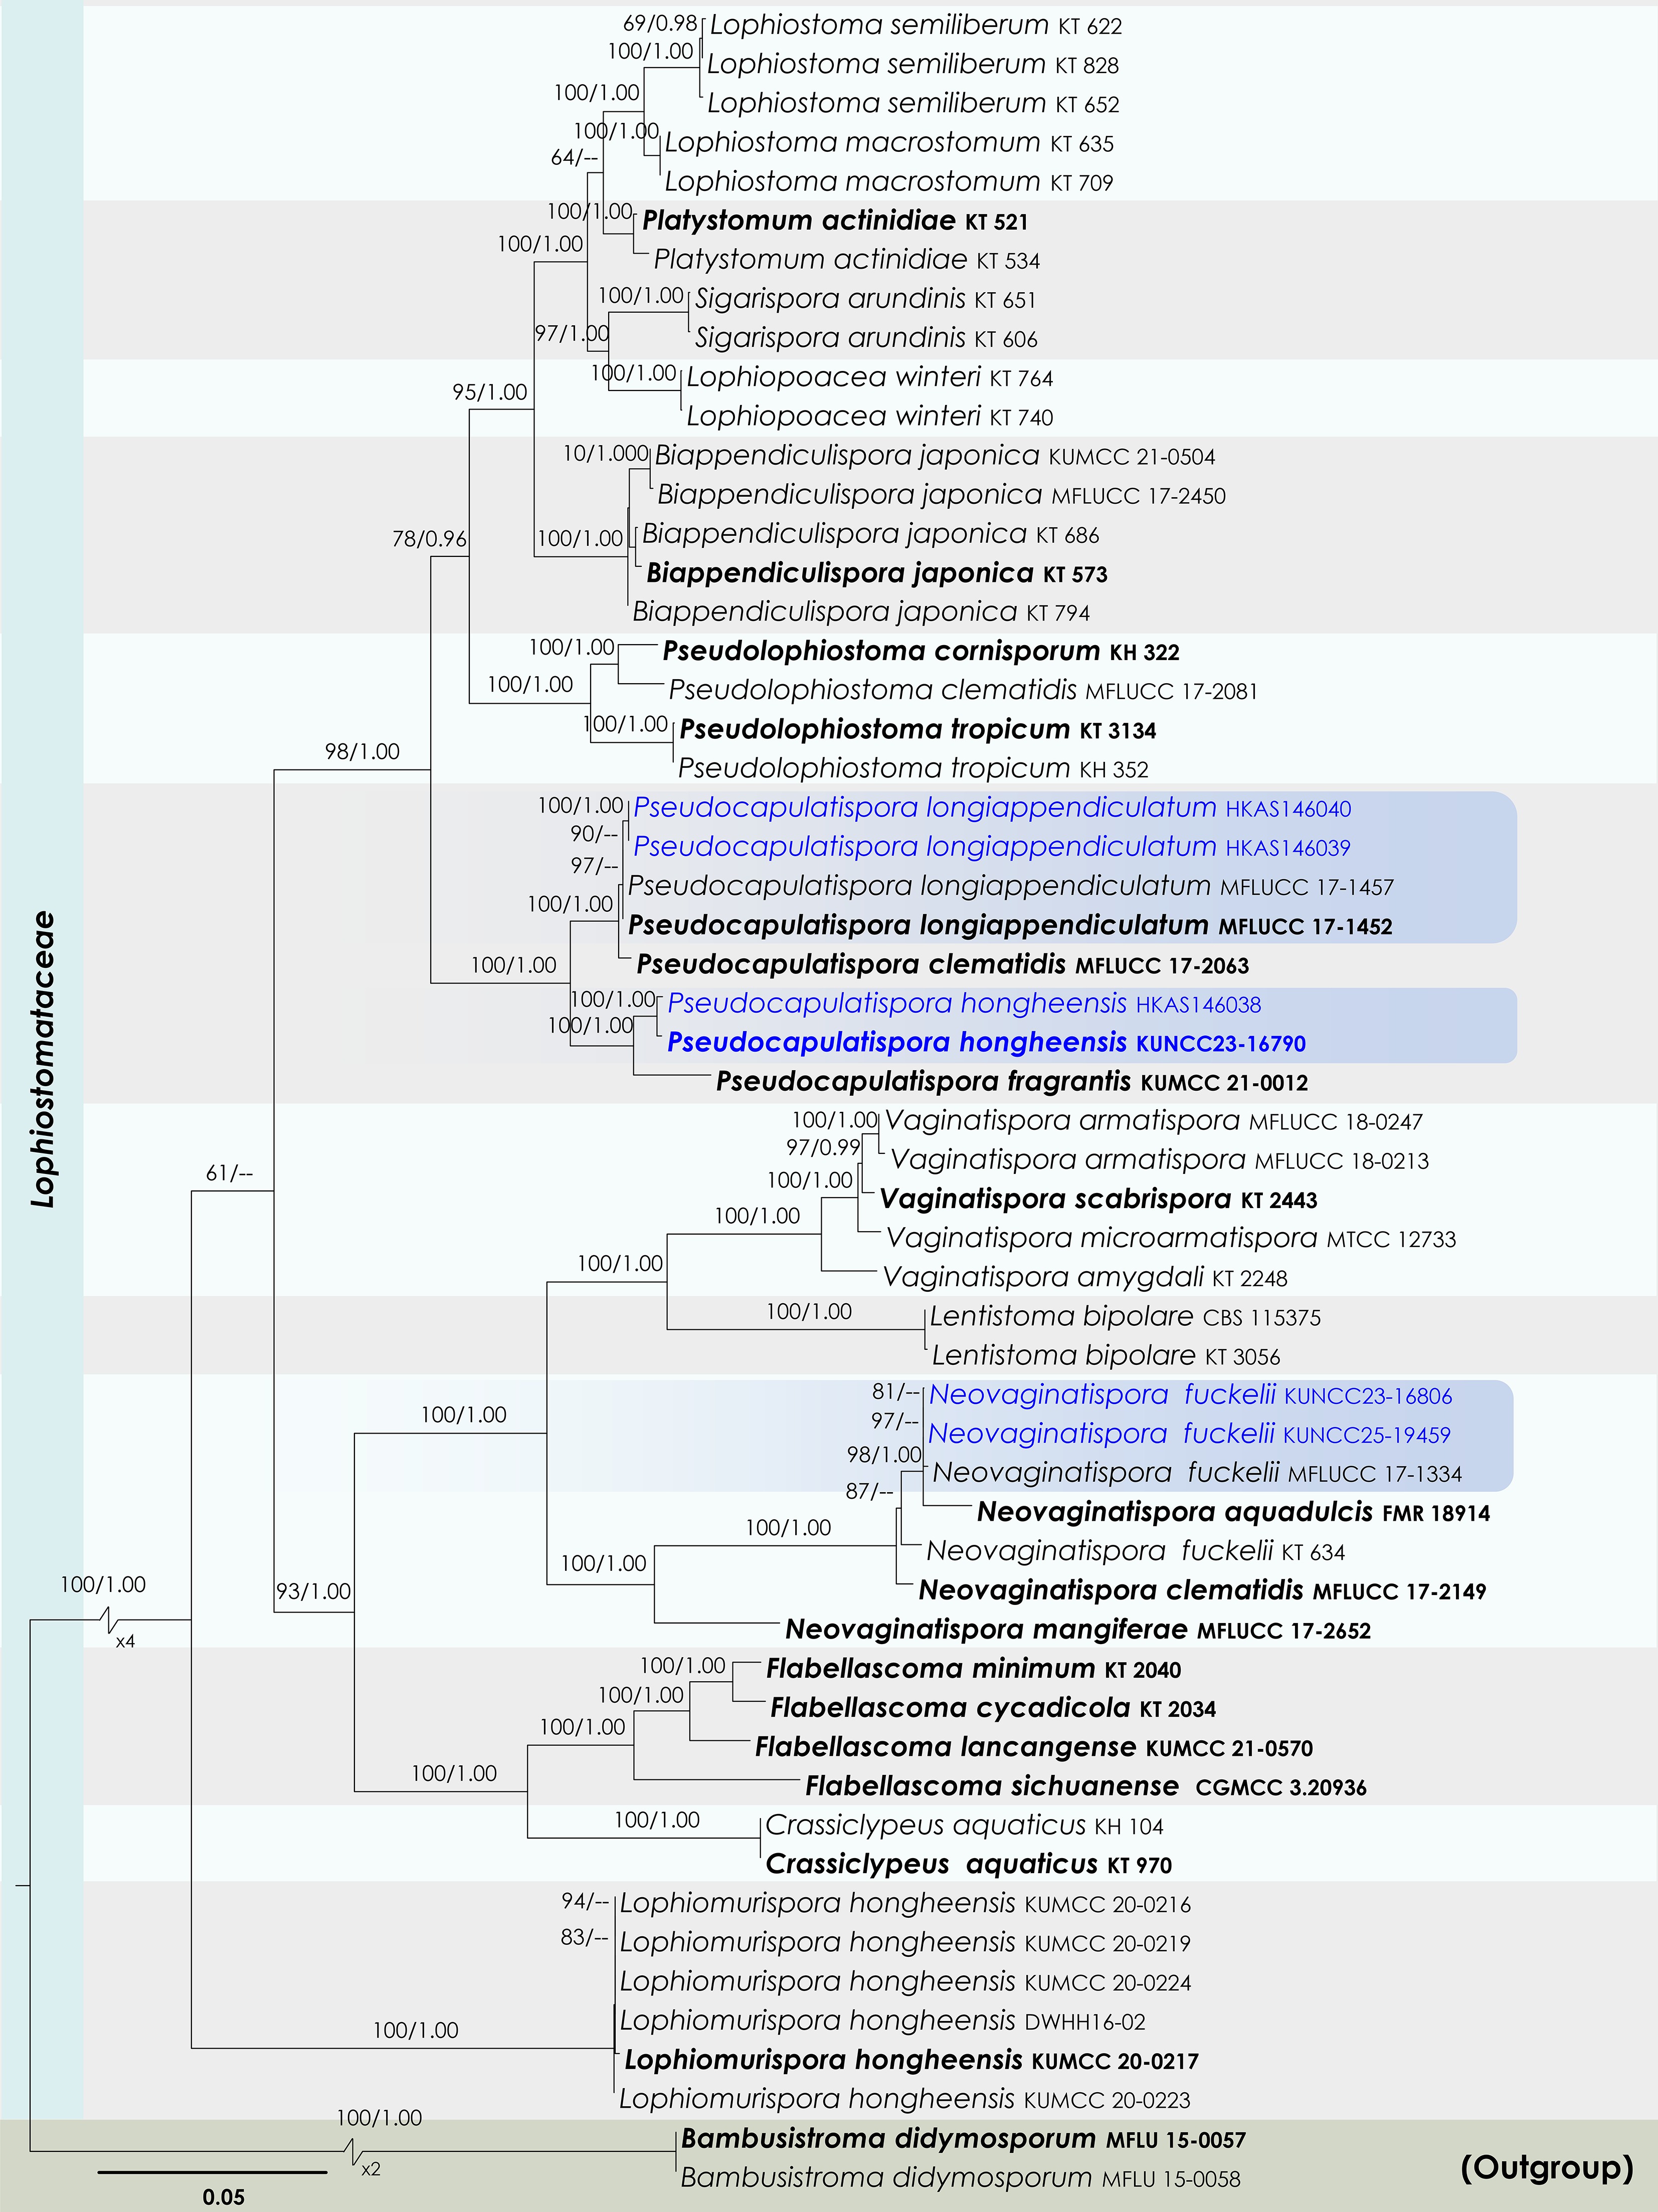
Figure 22.
Maximum Likelihood tree inferred from the concatenated dataset of partial SSU, LSU, ITS, tef1-α, and rpb2 sequences. The phylogeny is rooted with Bambusistroma didymosporum (MFLU 15-0057, MFLU 15-0058). The final likelihood value is –23,551.161444. The final alignment included 1,560 unique site patterns, with approximately 13.11% of the positions comprising gaps or ambiguous characters. The estimated nucleotide frequencies were as follows: A = 0.250154, C = 0.249645, G = 0.265412, T = 0.234790. The substitution model yielded the following relative rates: AC = 1.772887, AG = 4.441914, AT = 1.366252, CG = 1.518065, CT = 9.220171 and GT = 1.000000. The proportion of invariable sites (I) was estimated at 0.527527, and the gamma distribution shape parameter (α) was 0.567921. Bayesian inference reached convergence after 44,000 generations, when the average standard deviation of split frequencies dropped below 0.01 (observed value: 0.009691). A total of 441 trees were sampled, and 331 of these were retained for the final analysis after discarding the initial 25% as burn-in. The alignment also revealed 1,561 distinct informative sites. In the resulting phylograms, sequences generated in this study are highlighted in blue, while ex-type or type strains are indicated in boldface.
-
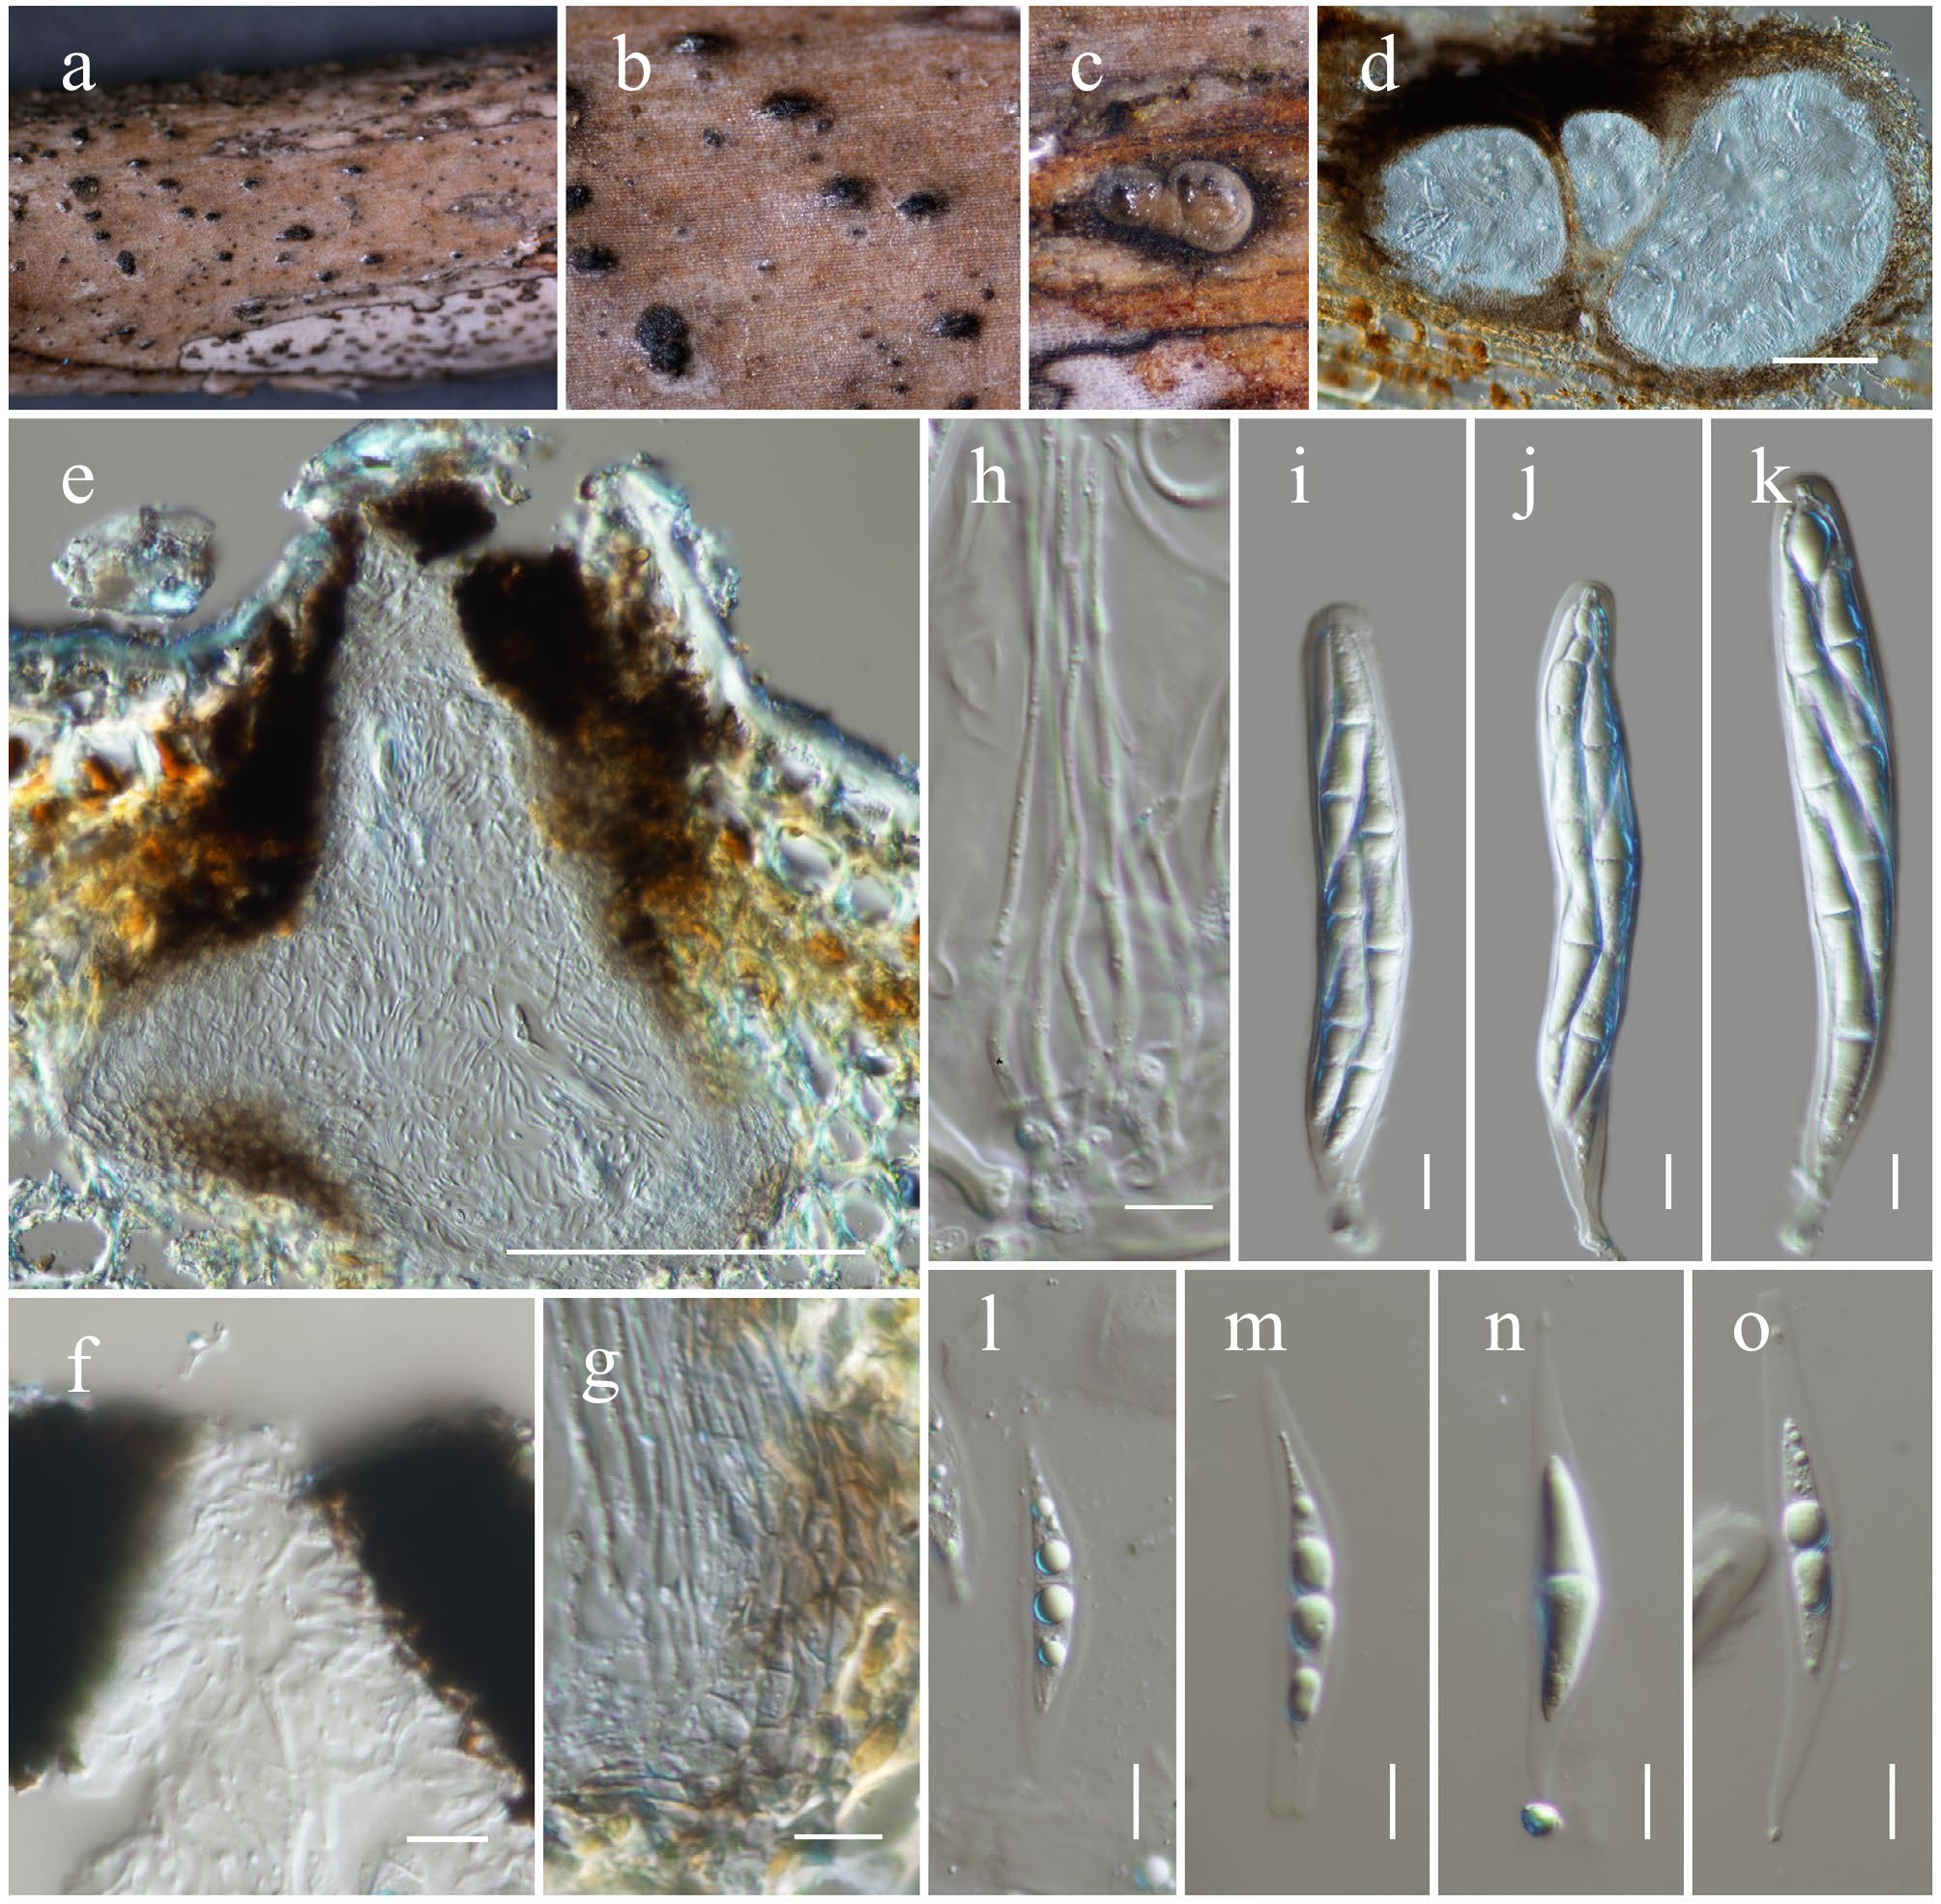
Figure 23.
Neovaginatispora fuckelii (HKAS146035). (a), (b) Ascomata on the dead woody twigs. (c) Transverse section of ascomata. (d), (e) Cross-section of ascomata. (f) Close up of ostiole. (g) Peridium. (h) Pseudoparaphyses. (i)–(k) Asci. (l)–(o) Ascospores. Scale bars: (d), (e) = 100 µm, (h)–(o) = 10 µm.
-
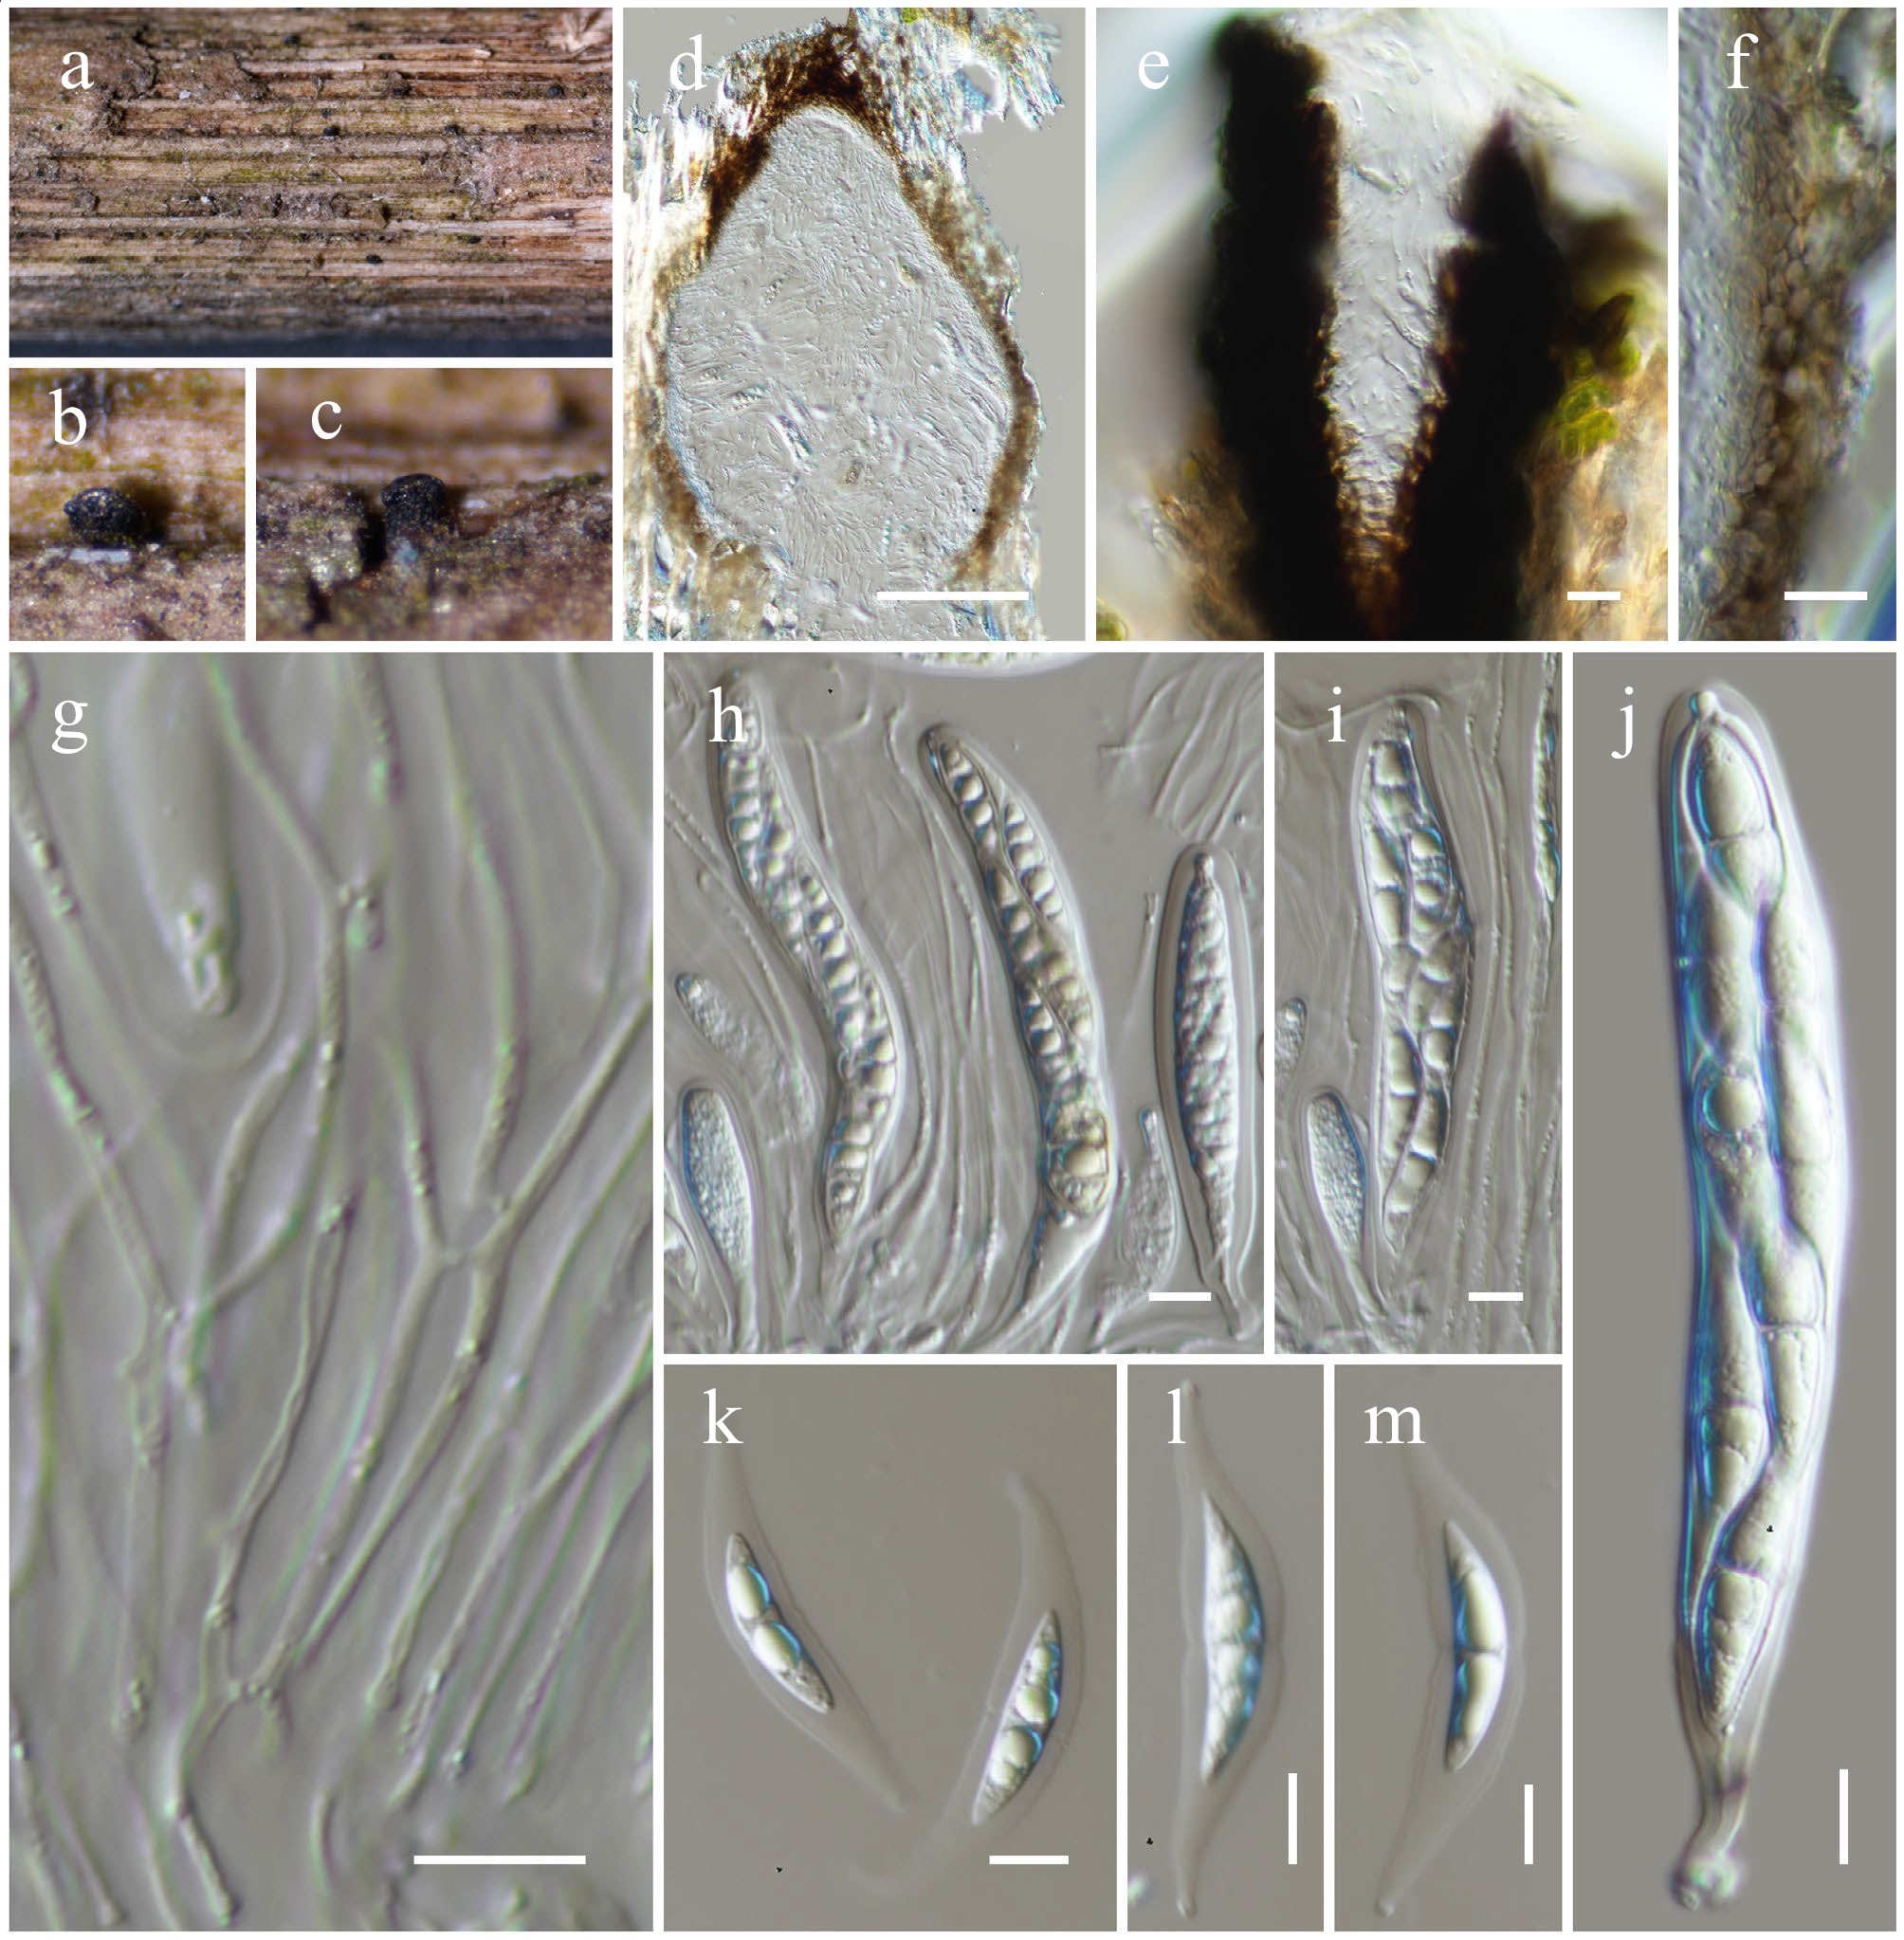
Figure 24.
Pseudocapulatispora hongheensis (HKAS146037, holotype). (a)–(c) Ascomata on the dead woody twigs. (d) Cross-section of ascoma. (e) Close up of ostiole. (f) Peridium. (g) Pseudoparaphyses. (h)–(j) Asci. (k)–(m) Ascospores. Scale bars: (d) = 100 µm, (e)–(m) = 10 µm.
-
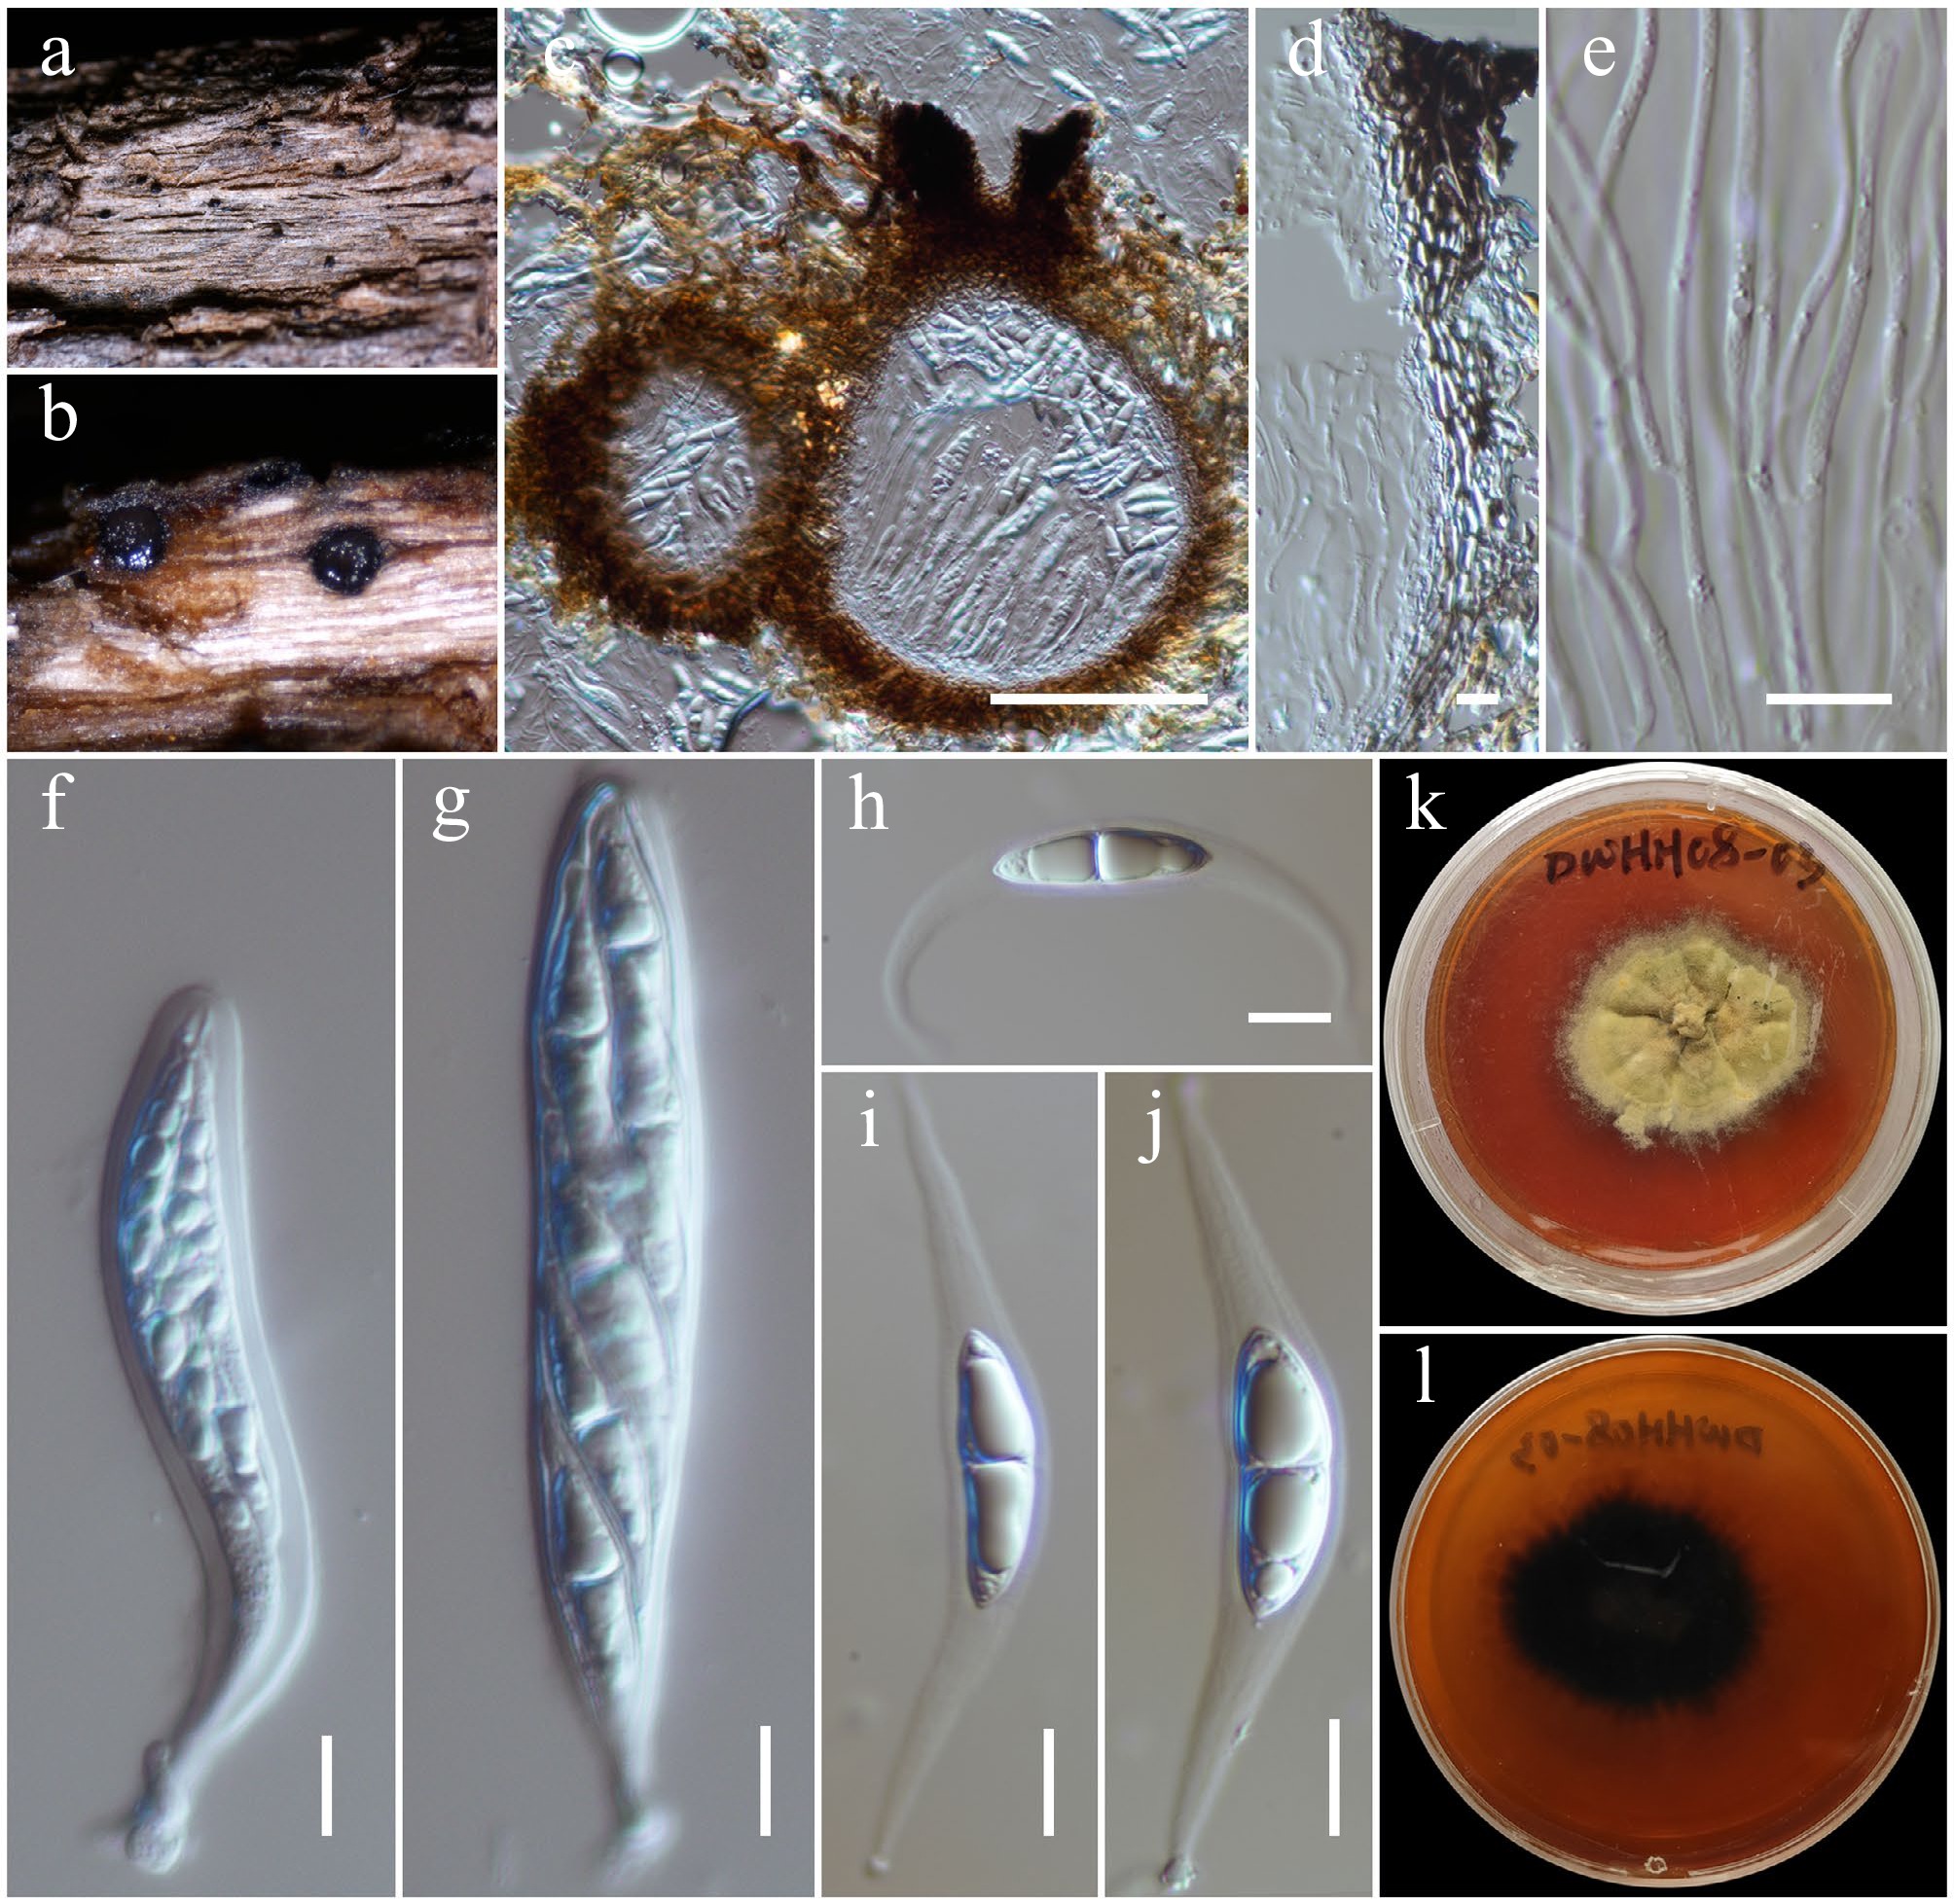
Figure 25.
Pseudocapulatispora longiappendiculata (HKAS146039). (a) Ascomata on the dead woody twigs. (b), (c) Cross-section of ascomata. (d) Peridium. (e) Pseudoparaphyses. (f), (g) Asci. (h)–(j) Ascospores. (k), (l) Colony on MEA (l from the bottom). Scale bars: (c) = 100 µm, (d)–(j) = 10 µm.
-
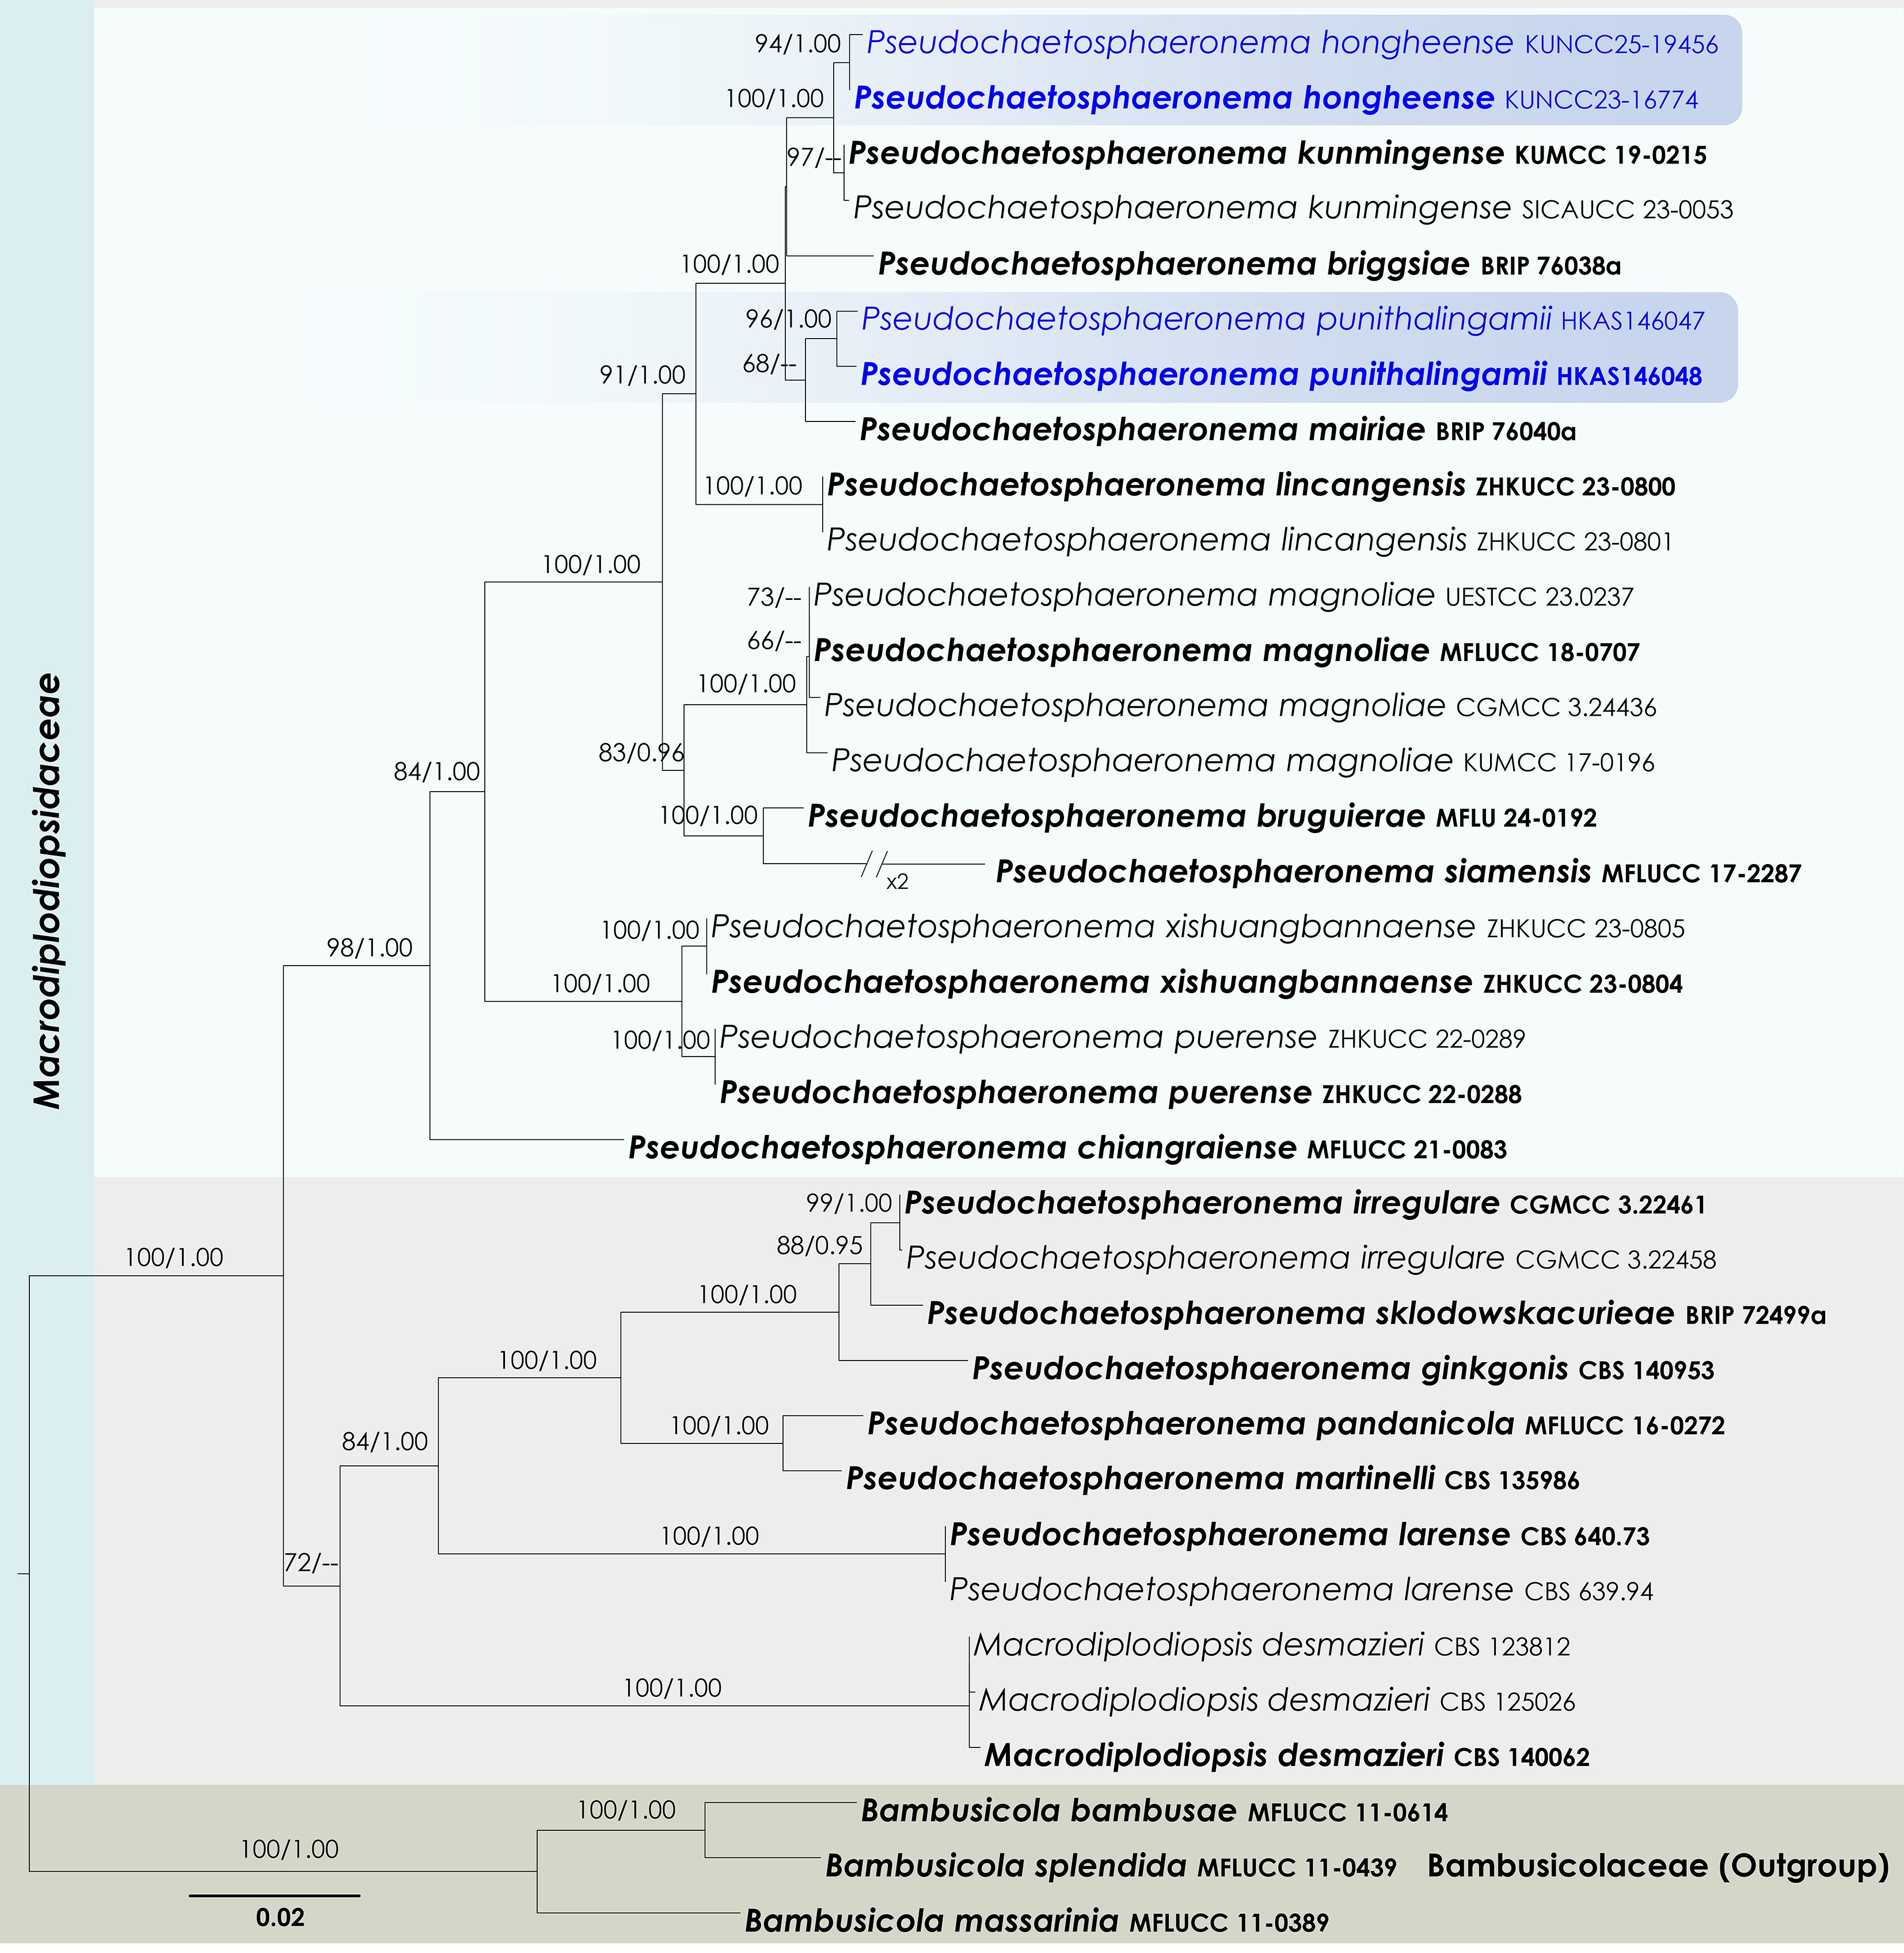
Figure 26.
Maximum Likelihood tree inferred from the concatenated dataset of partial SSU, LSU, ITS, tef1-α, and rpb2 sequences. The phylogeny is rooted with Bambusicola bambusae (MFLUCC 11-0614), B. massarinia (MFLUCC 11-0389), and B. splendida (MFLUCC 11-0439). The final likelihood value is –14,837.504911. The final alignment included 1,020 unique site patterns, with approximately 30.06% of the positions comprising gaps or ambiguous characters. The estimated nucleotide frequencies were as follows: A = 0.238962, C = 0.252036, G = 0.270241, T = 0.238761. The substitution model yielded the following relative rates: AC = 1.527778, AG = 4.223035, AT = 1.623867, CG = 1.375339, CT = 9.995702, GT = 1.000000. The proportion of invariable sites (I) was estimated at 0.569470, and the gamma distribution shape parameter (α) was 0.582697. Bayesian inference reached convergence after 34,000 generations, when the average standard deviation of split frequencies dropped below 0.01 (observed value: 0.009637). A total of 341 trees were sampled, and 256 of these were retained for the final analysis after discarding the initial 25% as burn-in. The alignment also revealed 1,022 distinct informative sites. In the resulting phylograms, sequences generated in this study are highlighted in blue, while ex-type or type strains are indicated in boldface.
-
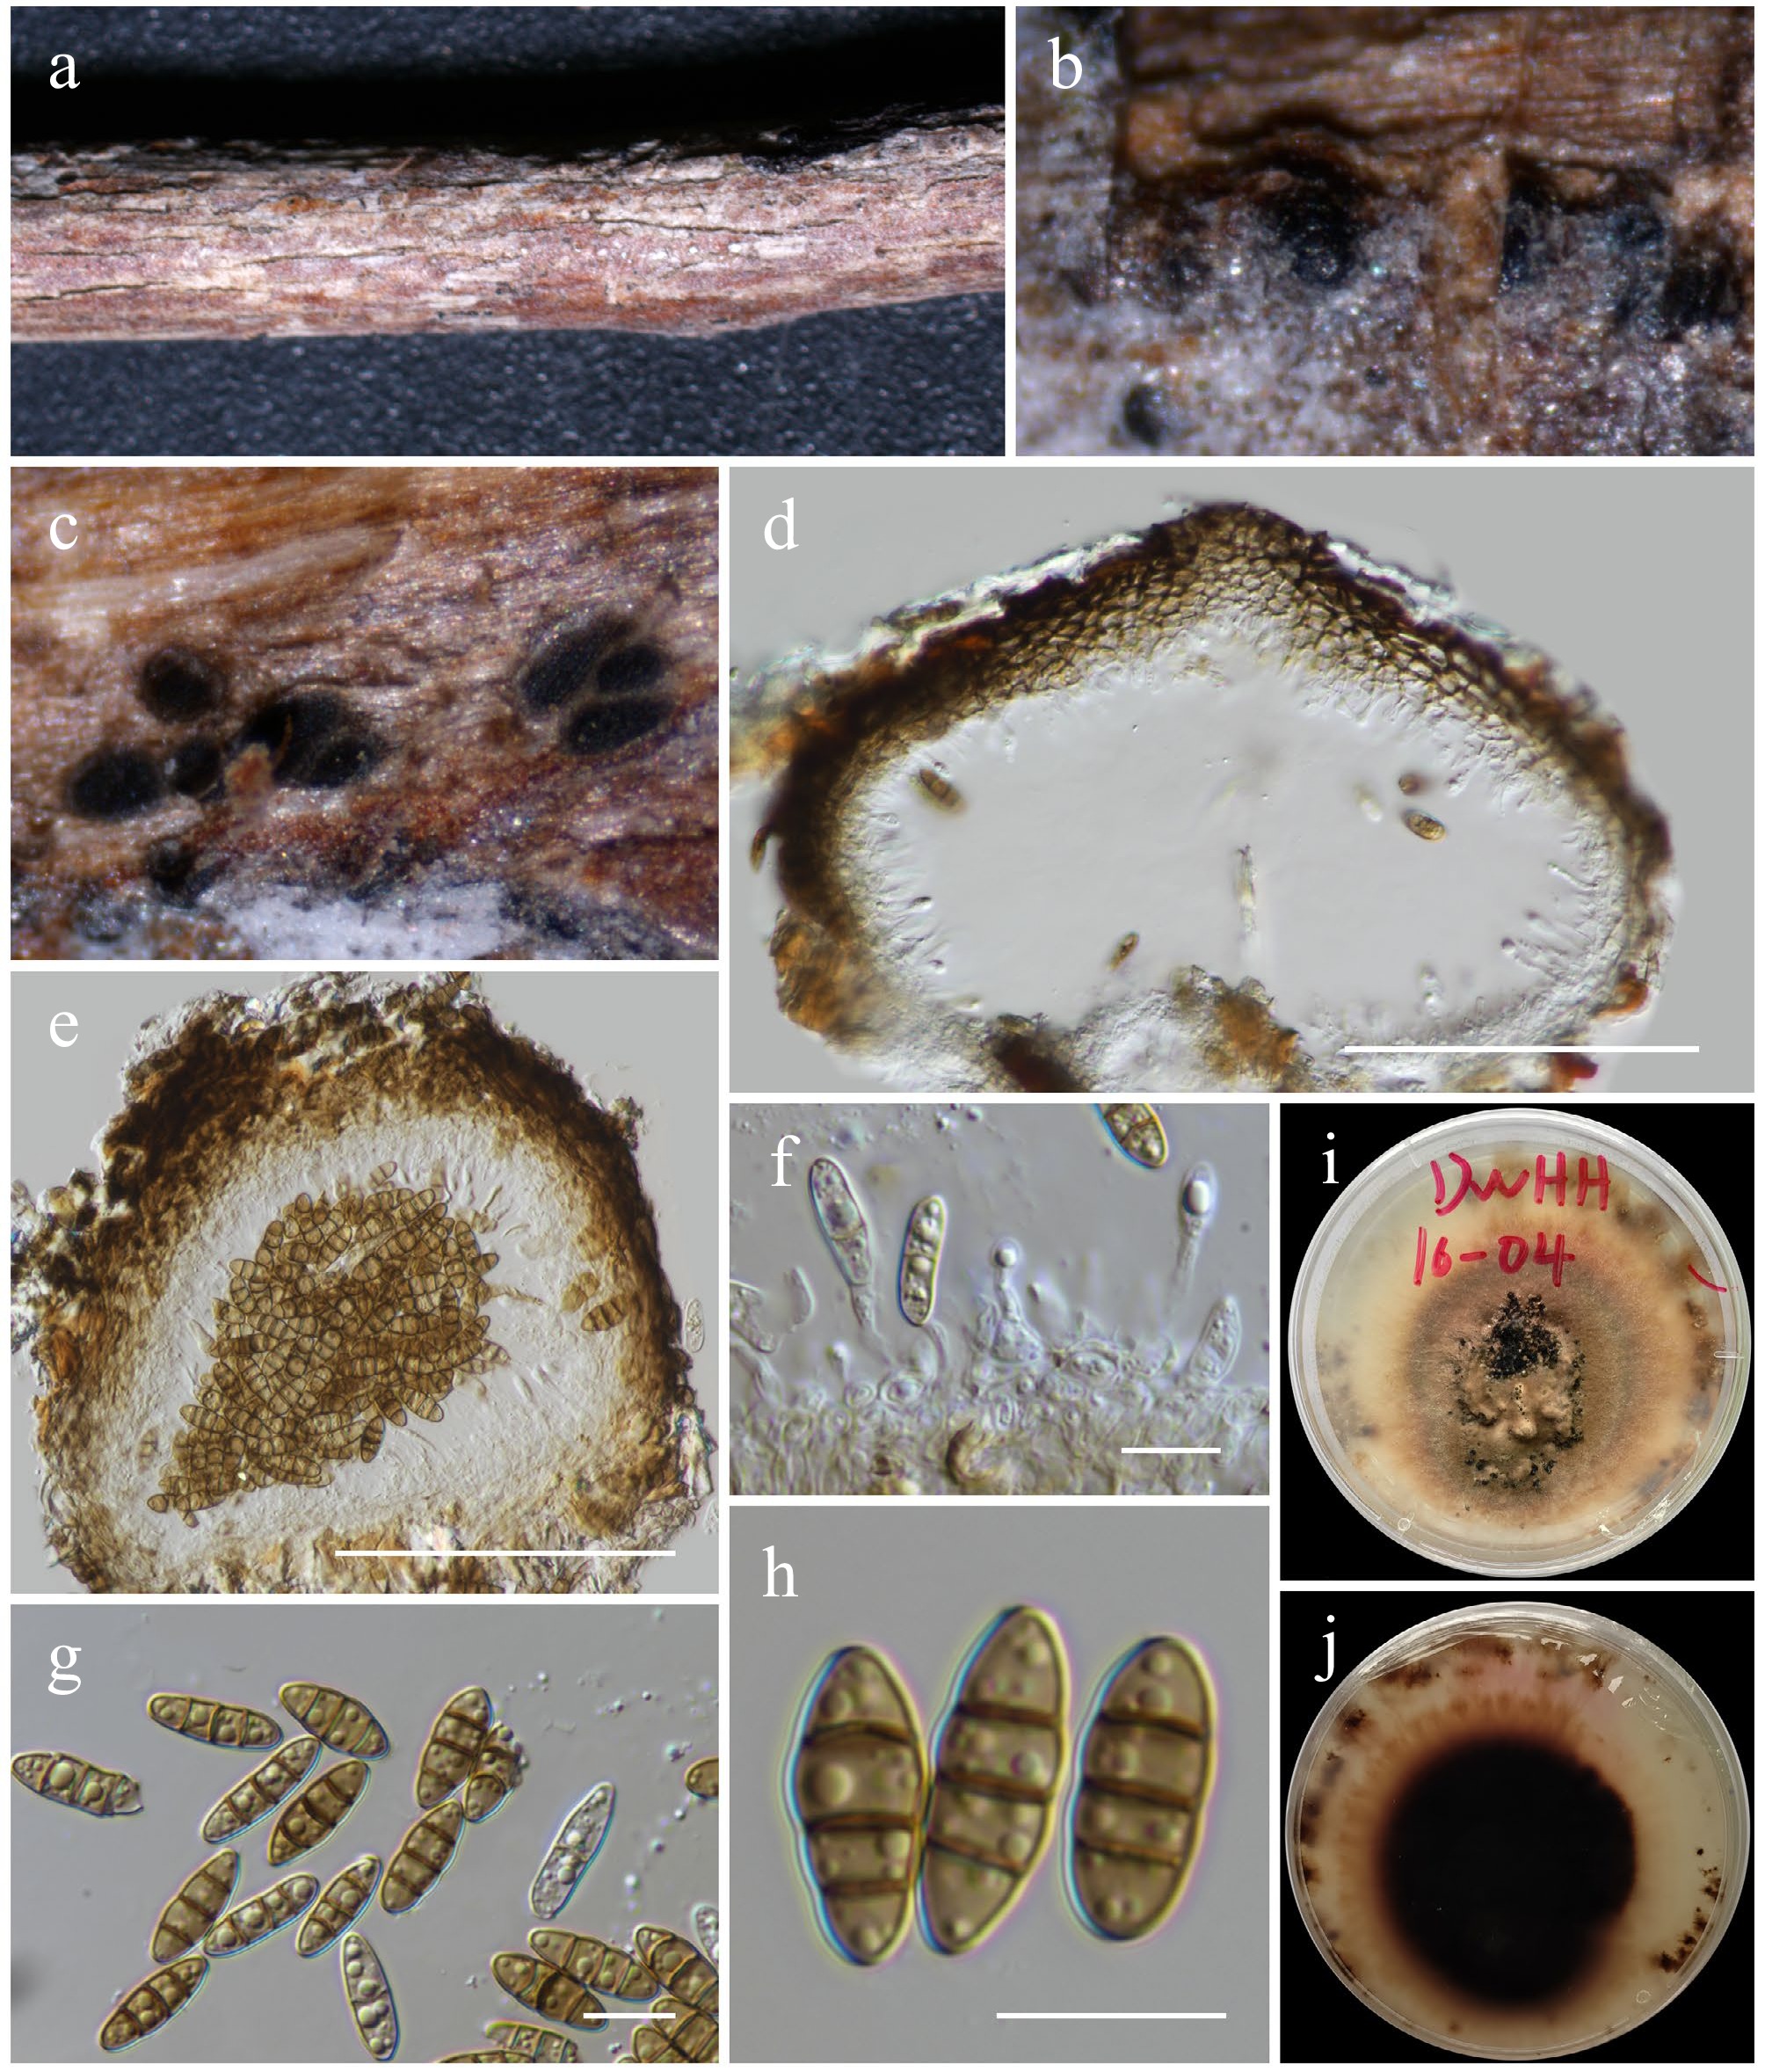
Figure 27.
Pseudochaetosphaeronema hongheense (HKAS146045, holotype). (a), (b) Conidiomata on host. (c)–(e) Sections of conidiomata. (f) Conidiogenous cells. (g), (h) Conidia. (i), (j) Colony on PDA (j from below). Scale bars: (d), (e) = 100 µm, (f)–(h) = 10 µm.
-
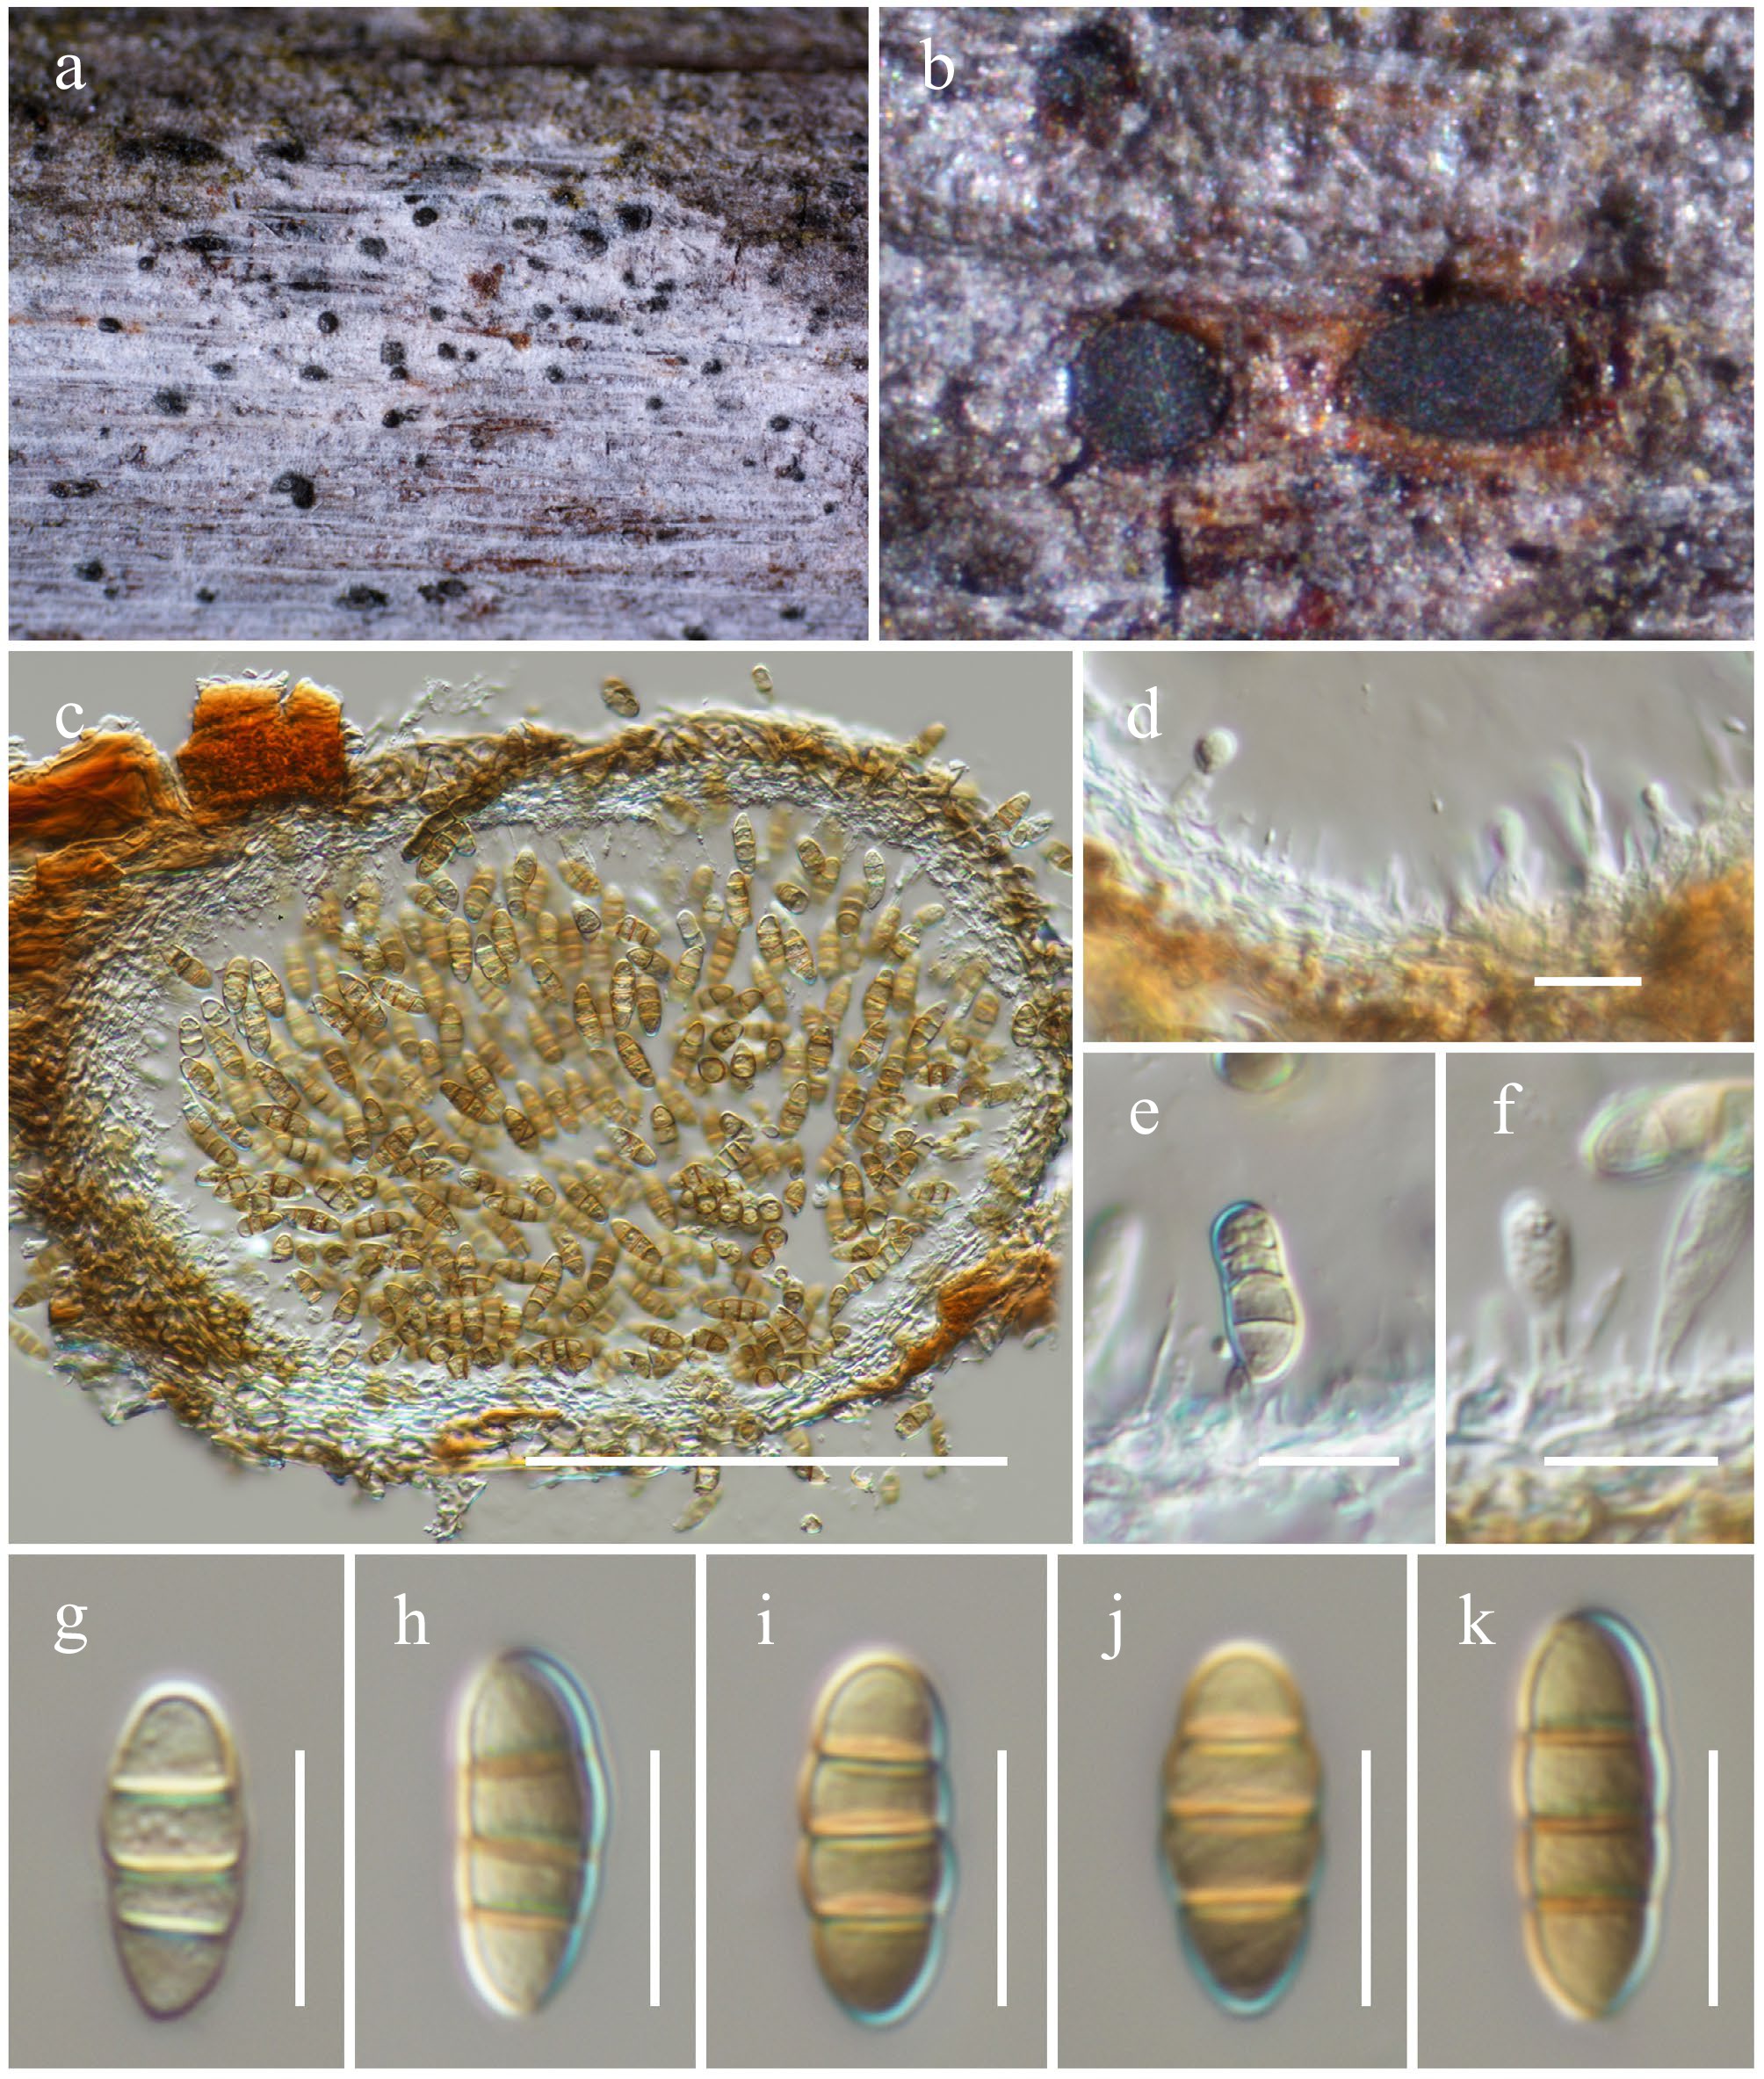
Figure 28.
Pseudochaetosphaeronema punithalingamii (HKAS146048, holotype). (a) Conidiomata on host. (b), (c) Sections of conidiomata. (d)–(f) Conidiogenous cells. (g)–(k) Conidia. Scale bars: (c) = 100 µm, (d)–(k) = 10 µm.
-
Figure 29.
Maximum Likelihood tree inferred from the concatenated dataset of partial SSU, LSU, 5.8s, tef1-α and rpb2 sequences. The phylogeny is rooted with Diatrype disciformis (AFTOL-ID 927), Graphostroma platystoma (CBS 270.87) and Sordaria fimicola (AFTOL-ID 216). The final likelihood value is −150,266.016088. The final alignment included 2,812 unique site patterns, with approximately 19.07% of the positions comprising gaps or ambiguous characters. The estimated nucleotide frequencies were as follows: A = 0.250162, C = 0.244801, G = 0.270528, T = 0.234509. The substitution model yielded the following relative rates: AC = 1.409236, AG = 4.442359, AT = 1.464844, CG = 1.164667, CT = 9.104968, GT = 1.000000. The proportion of invariable sites (I) was estimated at 0.409621 and the gamma distribution shape parameter (α) was 0.569317. Bayesian inference reached convergence after 5M generations, when the average standard deviation of split frequencies dropped below 0.01. A total of 50,001 trees were sampled, and 37,501 of these were retained for the final analysis after discarding the initial 25% as burn-in. The alignment also revealed 2,814 distinct informative sites. In the resulting phylograms, newly generated sequences are shown in blue and Pleosporales genera incertae sedis are in purple. The new family shown in red.
-
Figure 30.
Mangifericomes yunnanensis (HKAS146058, holotype). (a) Ascomata on the dead woody twigs. (b), (c) Cross-section of ascomata. (d) Peridium. (e) Pseudoparaphyses. (f)–(h) Asci. (i) Ascospores. (j), (k) Colony on MEA (k from the bottom). Scale bars: (c) = 100 µm, (d)–(i) = 10 µm.
-
Figure 31.
Maximum Likelihood tree inferred from the concatenated dataset of partial SSU, LSU, ITS, tef1-α and rpb2 sequence analyses. The tree is rooted to Cyclothyriella rubronotata (CBS 121892, CBS 141486). The final likelihood value is –35,556.858868. The final alignment included 2,182 unique site patterns, with approximately 38.1% of the positions comprising gaps or ambiguous characters. The estimated nucleotide frequencies were as follows: A = 0.237453, C = 0.256825, G = 0.269094, T = 0.236628. The substitution model yielded the following relative rates: AC = 1.452161, AG = 3.722496, AT = 1.468538, CG = 0.961651, CT = 7.489299 and GT = 1.000000. The proportion of invariable sites (I) was estimated at 0.518695 and the gamma distribution shape parameter (α) was 0.562000. Bayesian inference reached convergence after 1,923,000 generations, when the average standard deviation of split frequencies dropped below 0.01 (observed value: 0.009981). A total of 19,231 trees were sampled, and 14,424 of these were retained for the final analysis after discarding the initial 25% as burn-in. The alignment also revealed 2,183 distinct informative sites. In the resulting phylograms, sequences generated in this study are highlighted in blue, while ex-type or type strains are indicated in boldface.
-
Figure 32.
Helminthosporium hongheense (HKAS146049, holotype). (a)–(d) Dark brown or black colonies on natural substrate. (e)–(g) Conidiophores. (h)–(k) Conidia. Scale bars: (f) = 100 µm, (e), (g)–(k) = 10 µm.
-
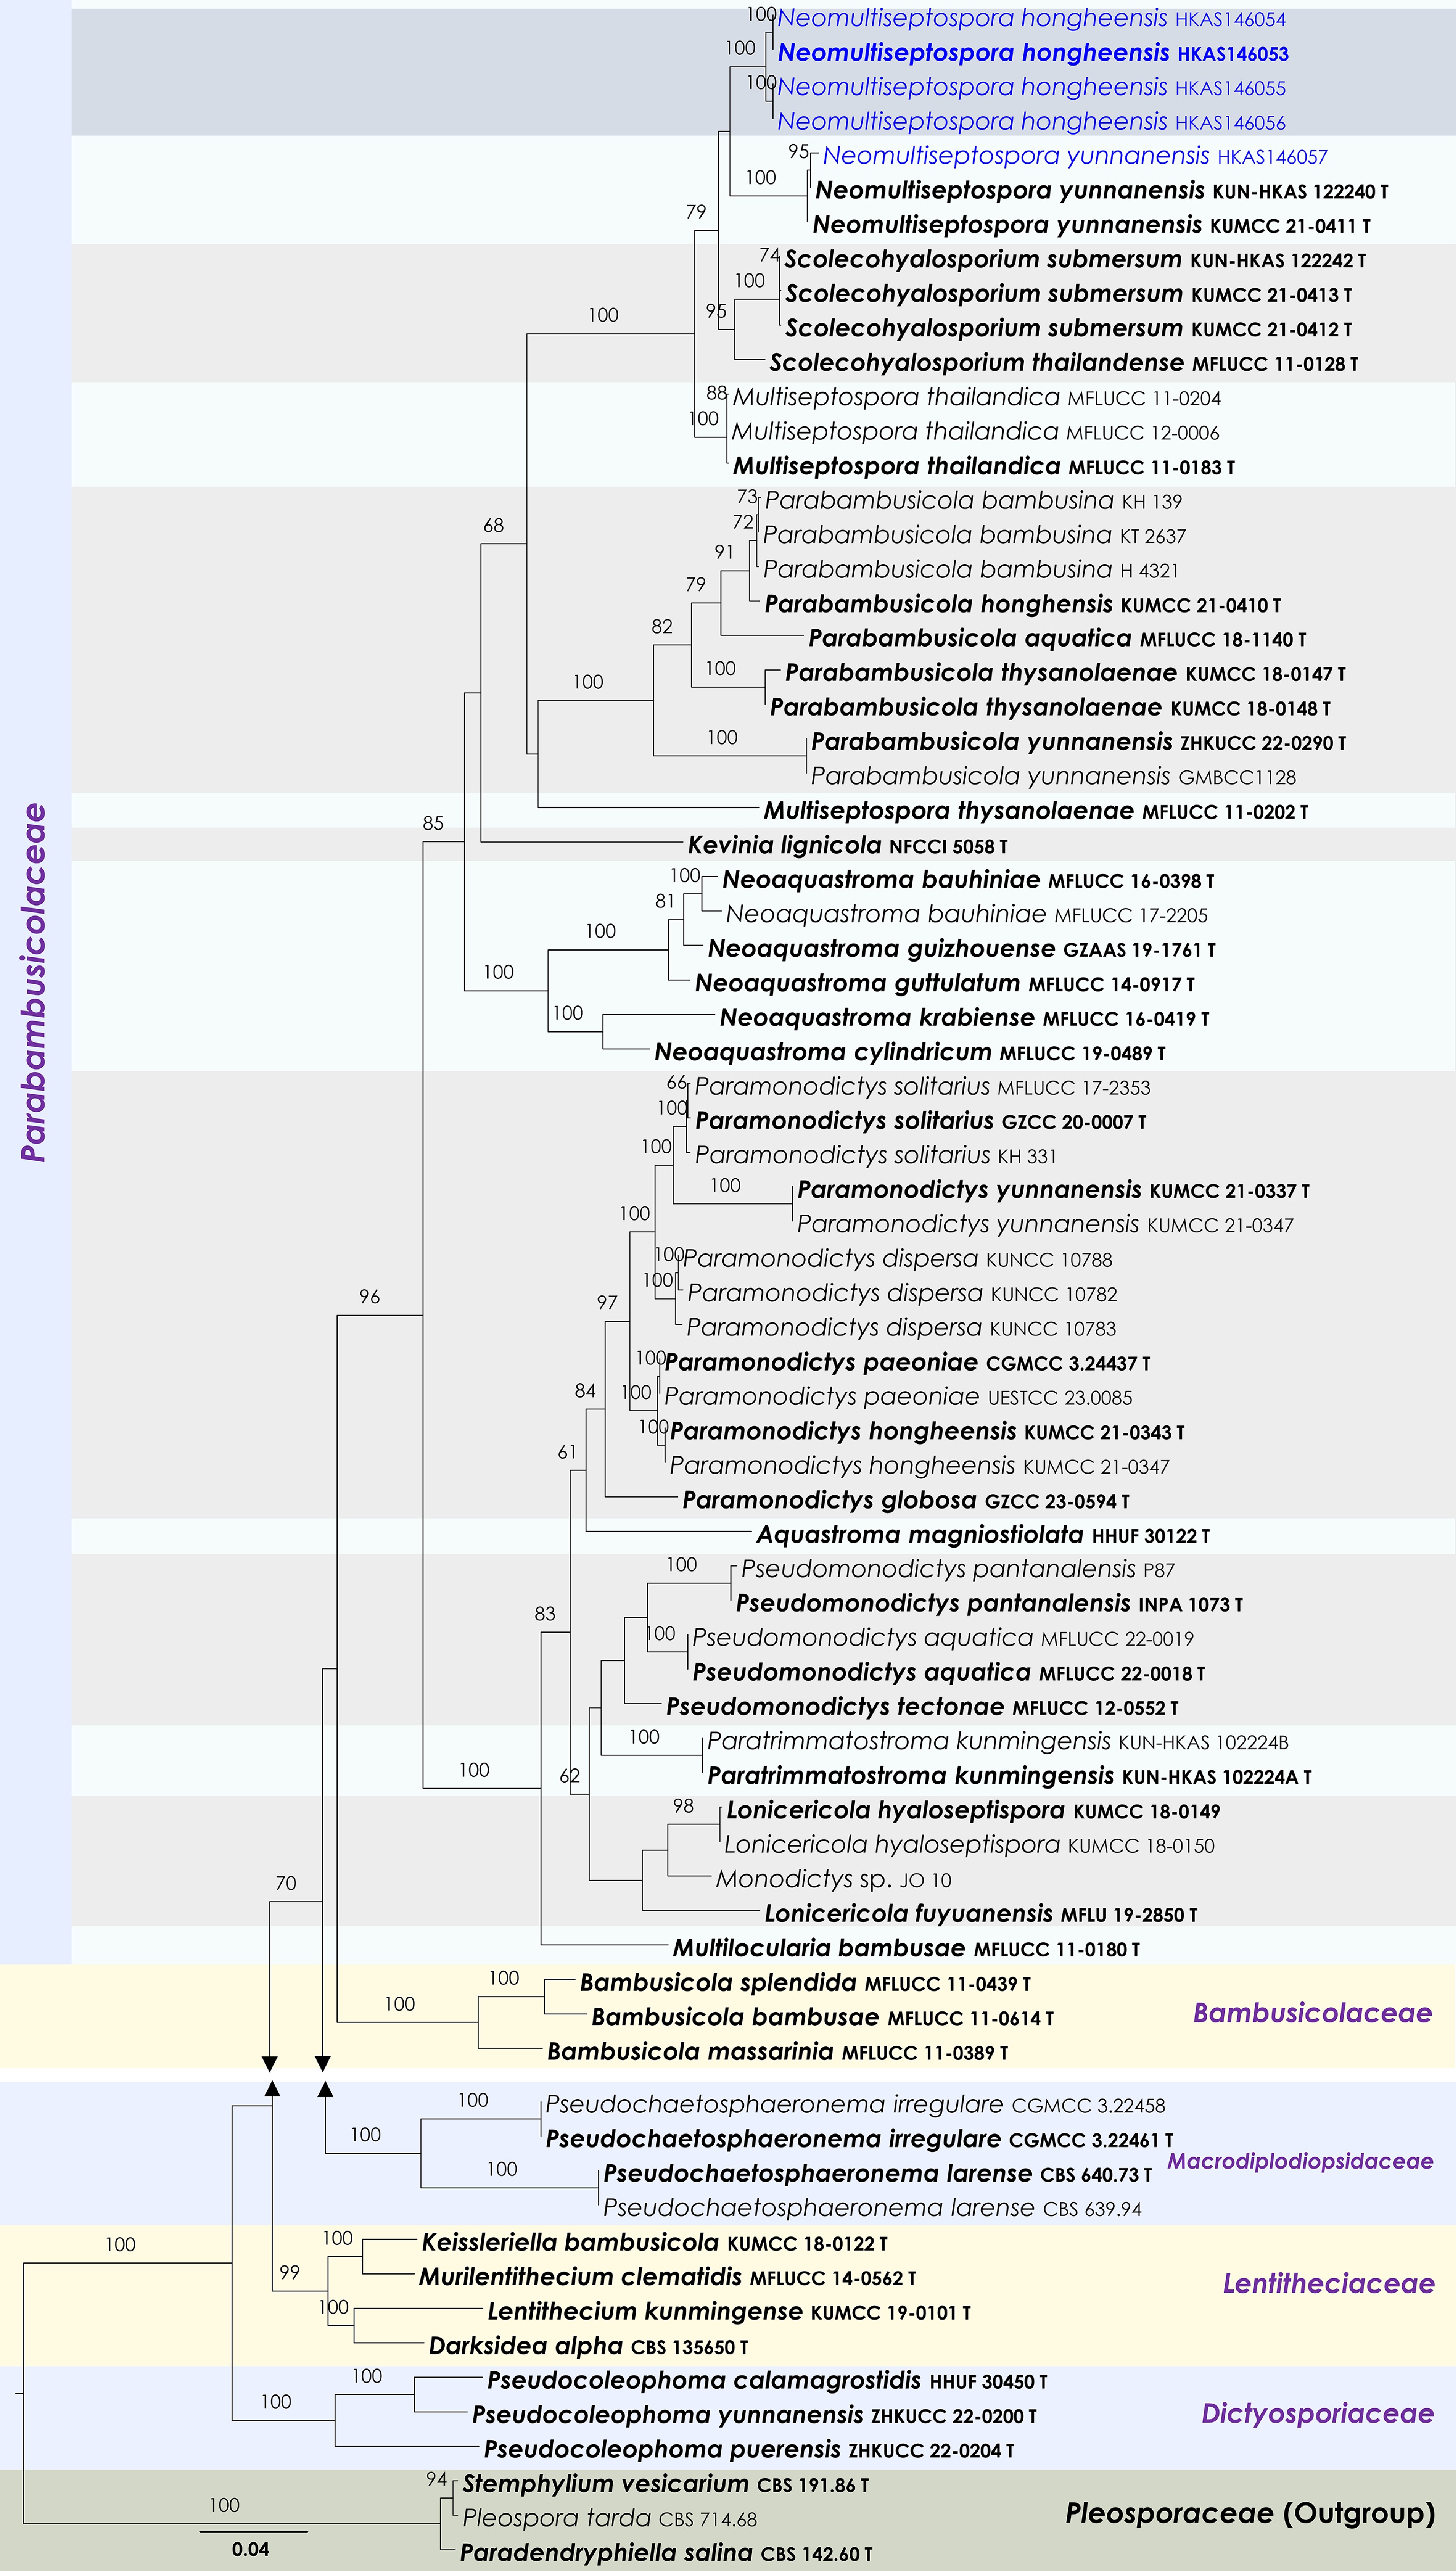
Figure 33.
Maximum Likelihood tree inferred from the concatenated dataset of partial SSU, LSU, ITS, tef1-α and rpb2 sequences. The phylogeny is rooted with Paradendryphiella salina (CBS 142.60), Pleospora tarda (CBS 714.68) and Stemphylium vesicarium (CBS 191.86). The final likelihood value is –25,430.003747. The final alignment included 1,492 unique site patterns, with approximately 18.07% of the positions comprising gaps or ambiguous characters. The estimated nucleotide frequencies were as follows: A = 0.234317, C = 0.258507, G = 0.272066, T = 0.235111. The substitution model yielded the following relative rates: AC = 1.103972, AG = 2.858045, AT = 1.446677, CG = 1.147080, CT = 5.894779, GT = 1.000000. The proportion of invariable sites (I) was estimated at 0.7274, and the gamma distribution shape parameter (α) was 0.569941. Bayesian inference reached convergence after 761,000 generations, when the average standard deviation of split frequencies dropped below 0.01 (observed value: 0.009992). A total of 7,611 trees were sampled, and 5,709 of these were retained for the final analysis after discarding the initial 25% as burn-in. The alignment also revealed 1,493 distinct informative sites. In the resulting phylograms, sequences generated in this study are highlighted in blue, while ex-type or type strains are indicated in boldface.
-
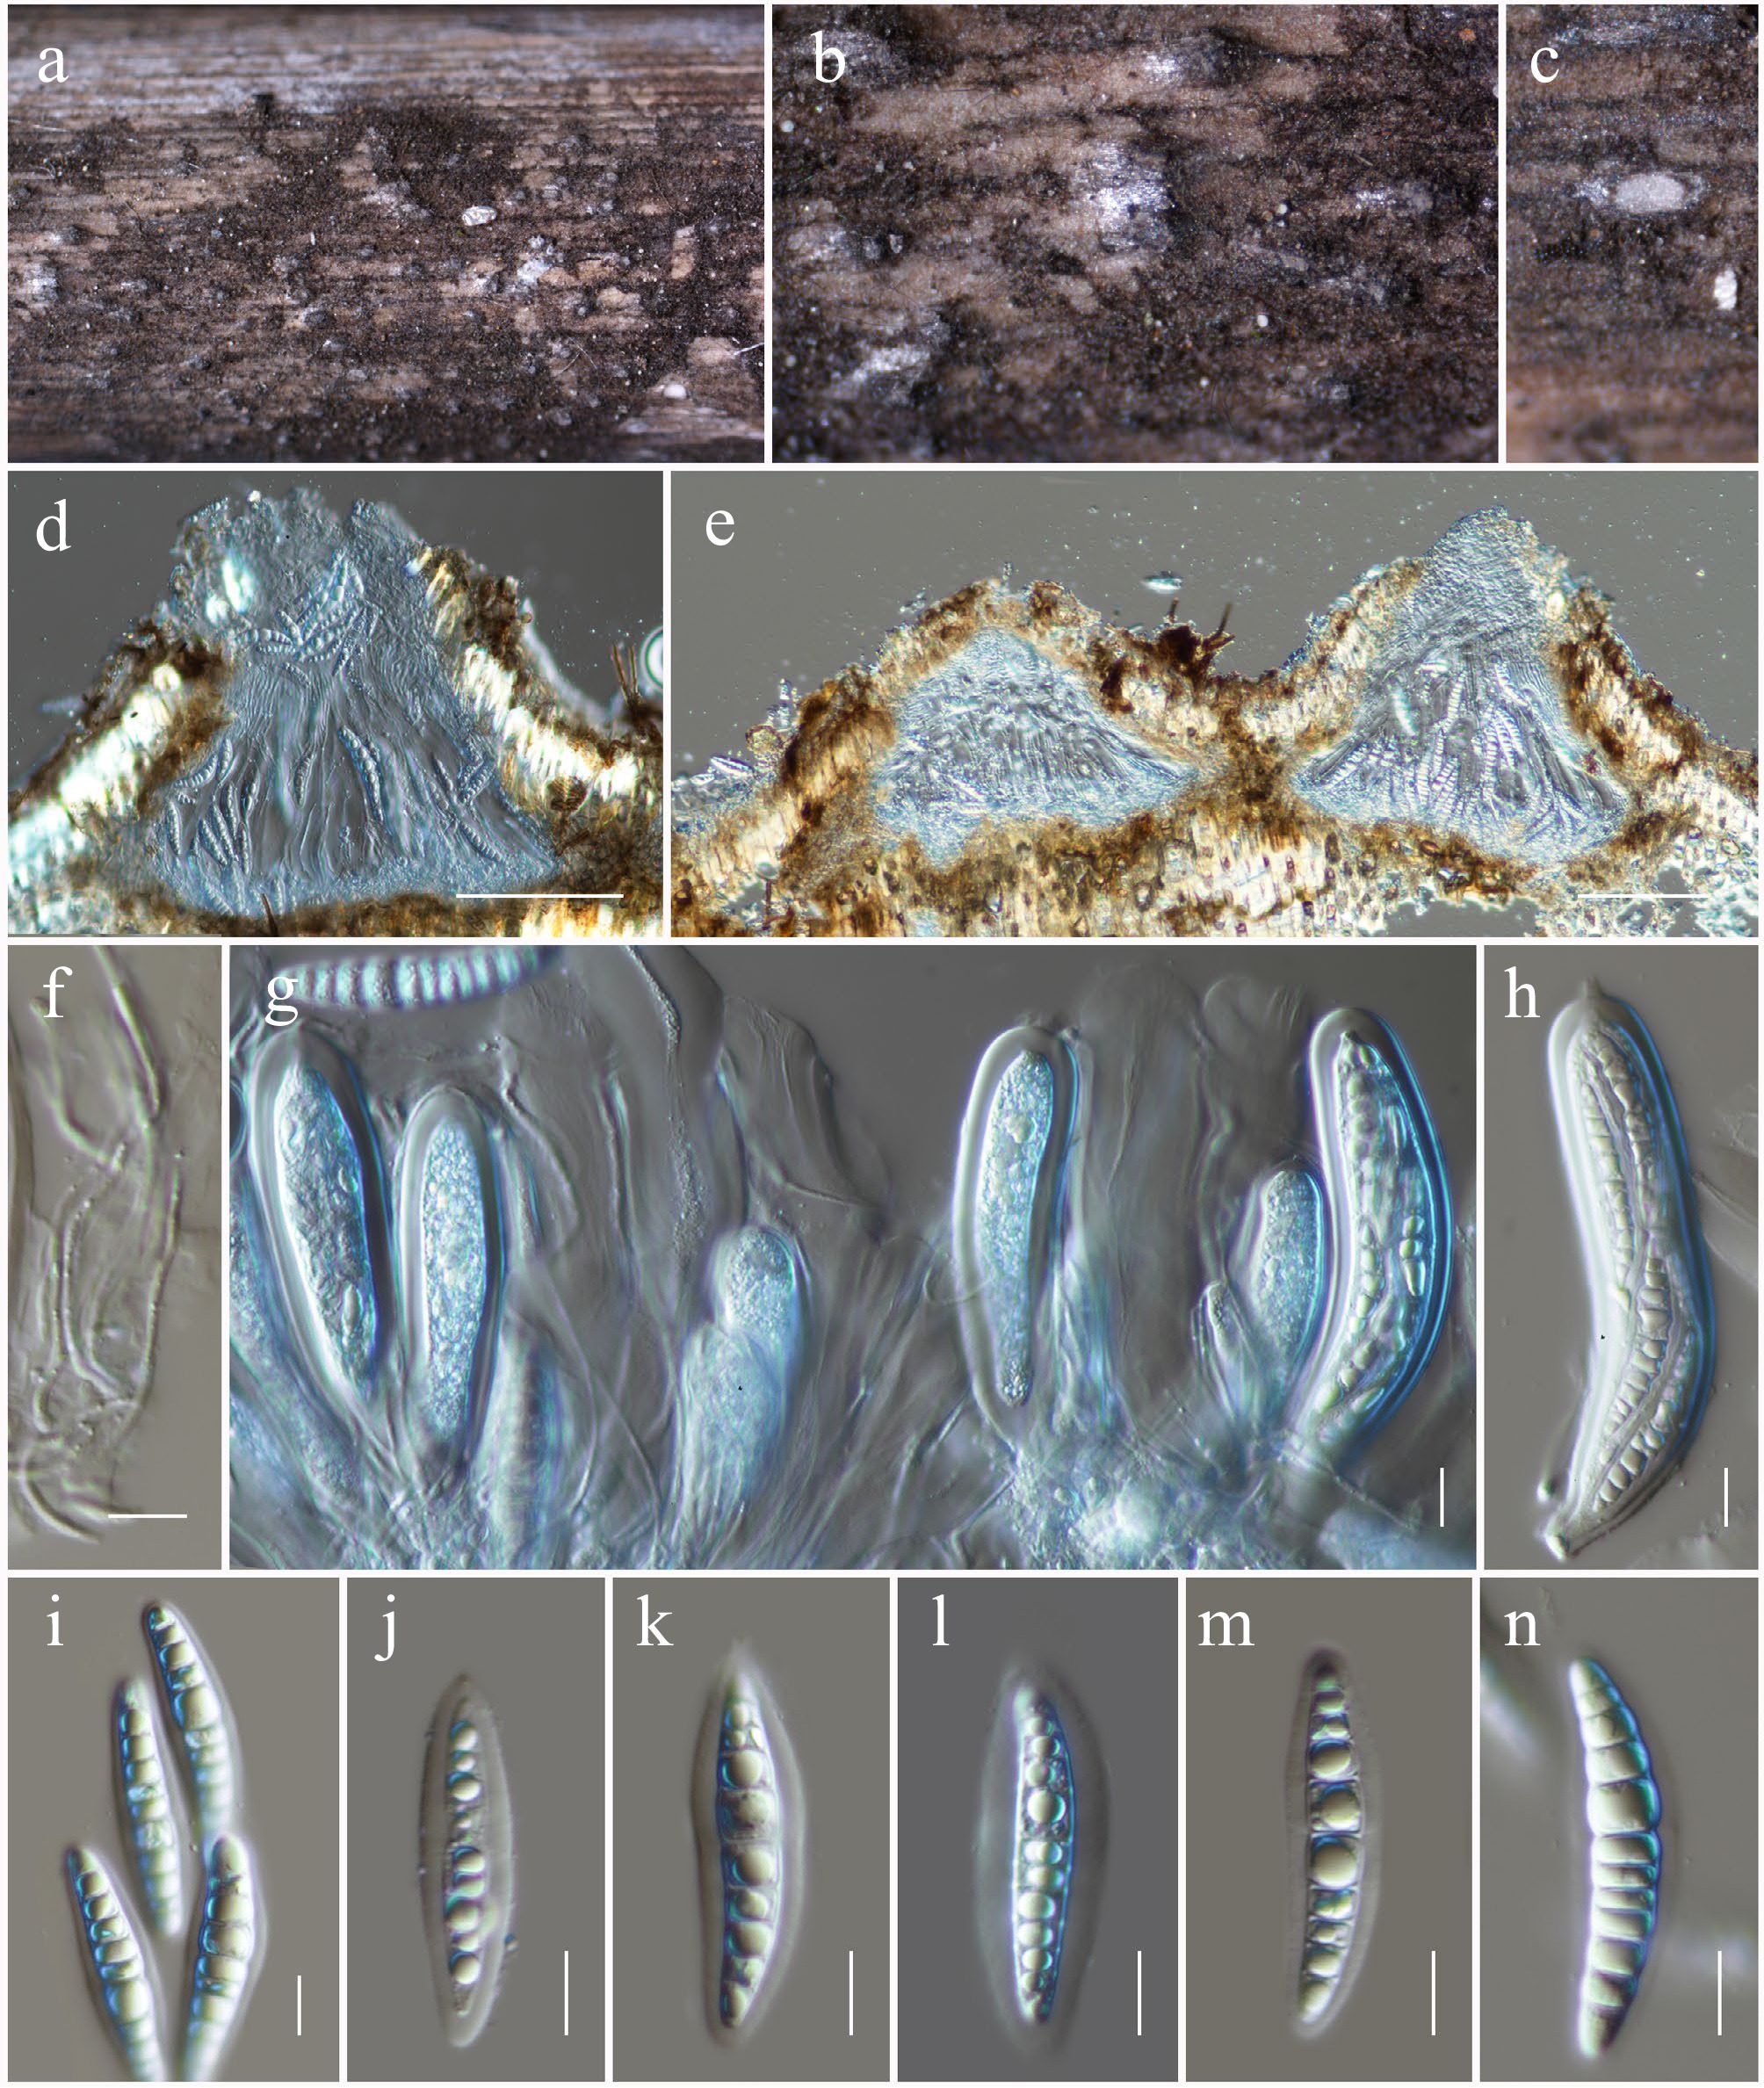
Figure 34.
Neomultiseptospora hongheensis (HKAS146053, holotype). (a), (b) Ascomata on the dead woody twigs. (c)–(e) Cross-section of ascomata. (f) Pseudoparaphyses. (g), (h) Asci. (i)–(n) Ascospores. Scale bars: (d), (e) = 100 µm, (f)–(n) = 10 µm.
-
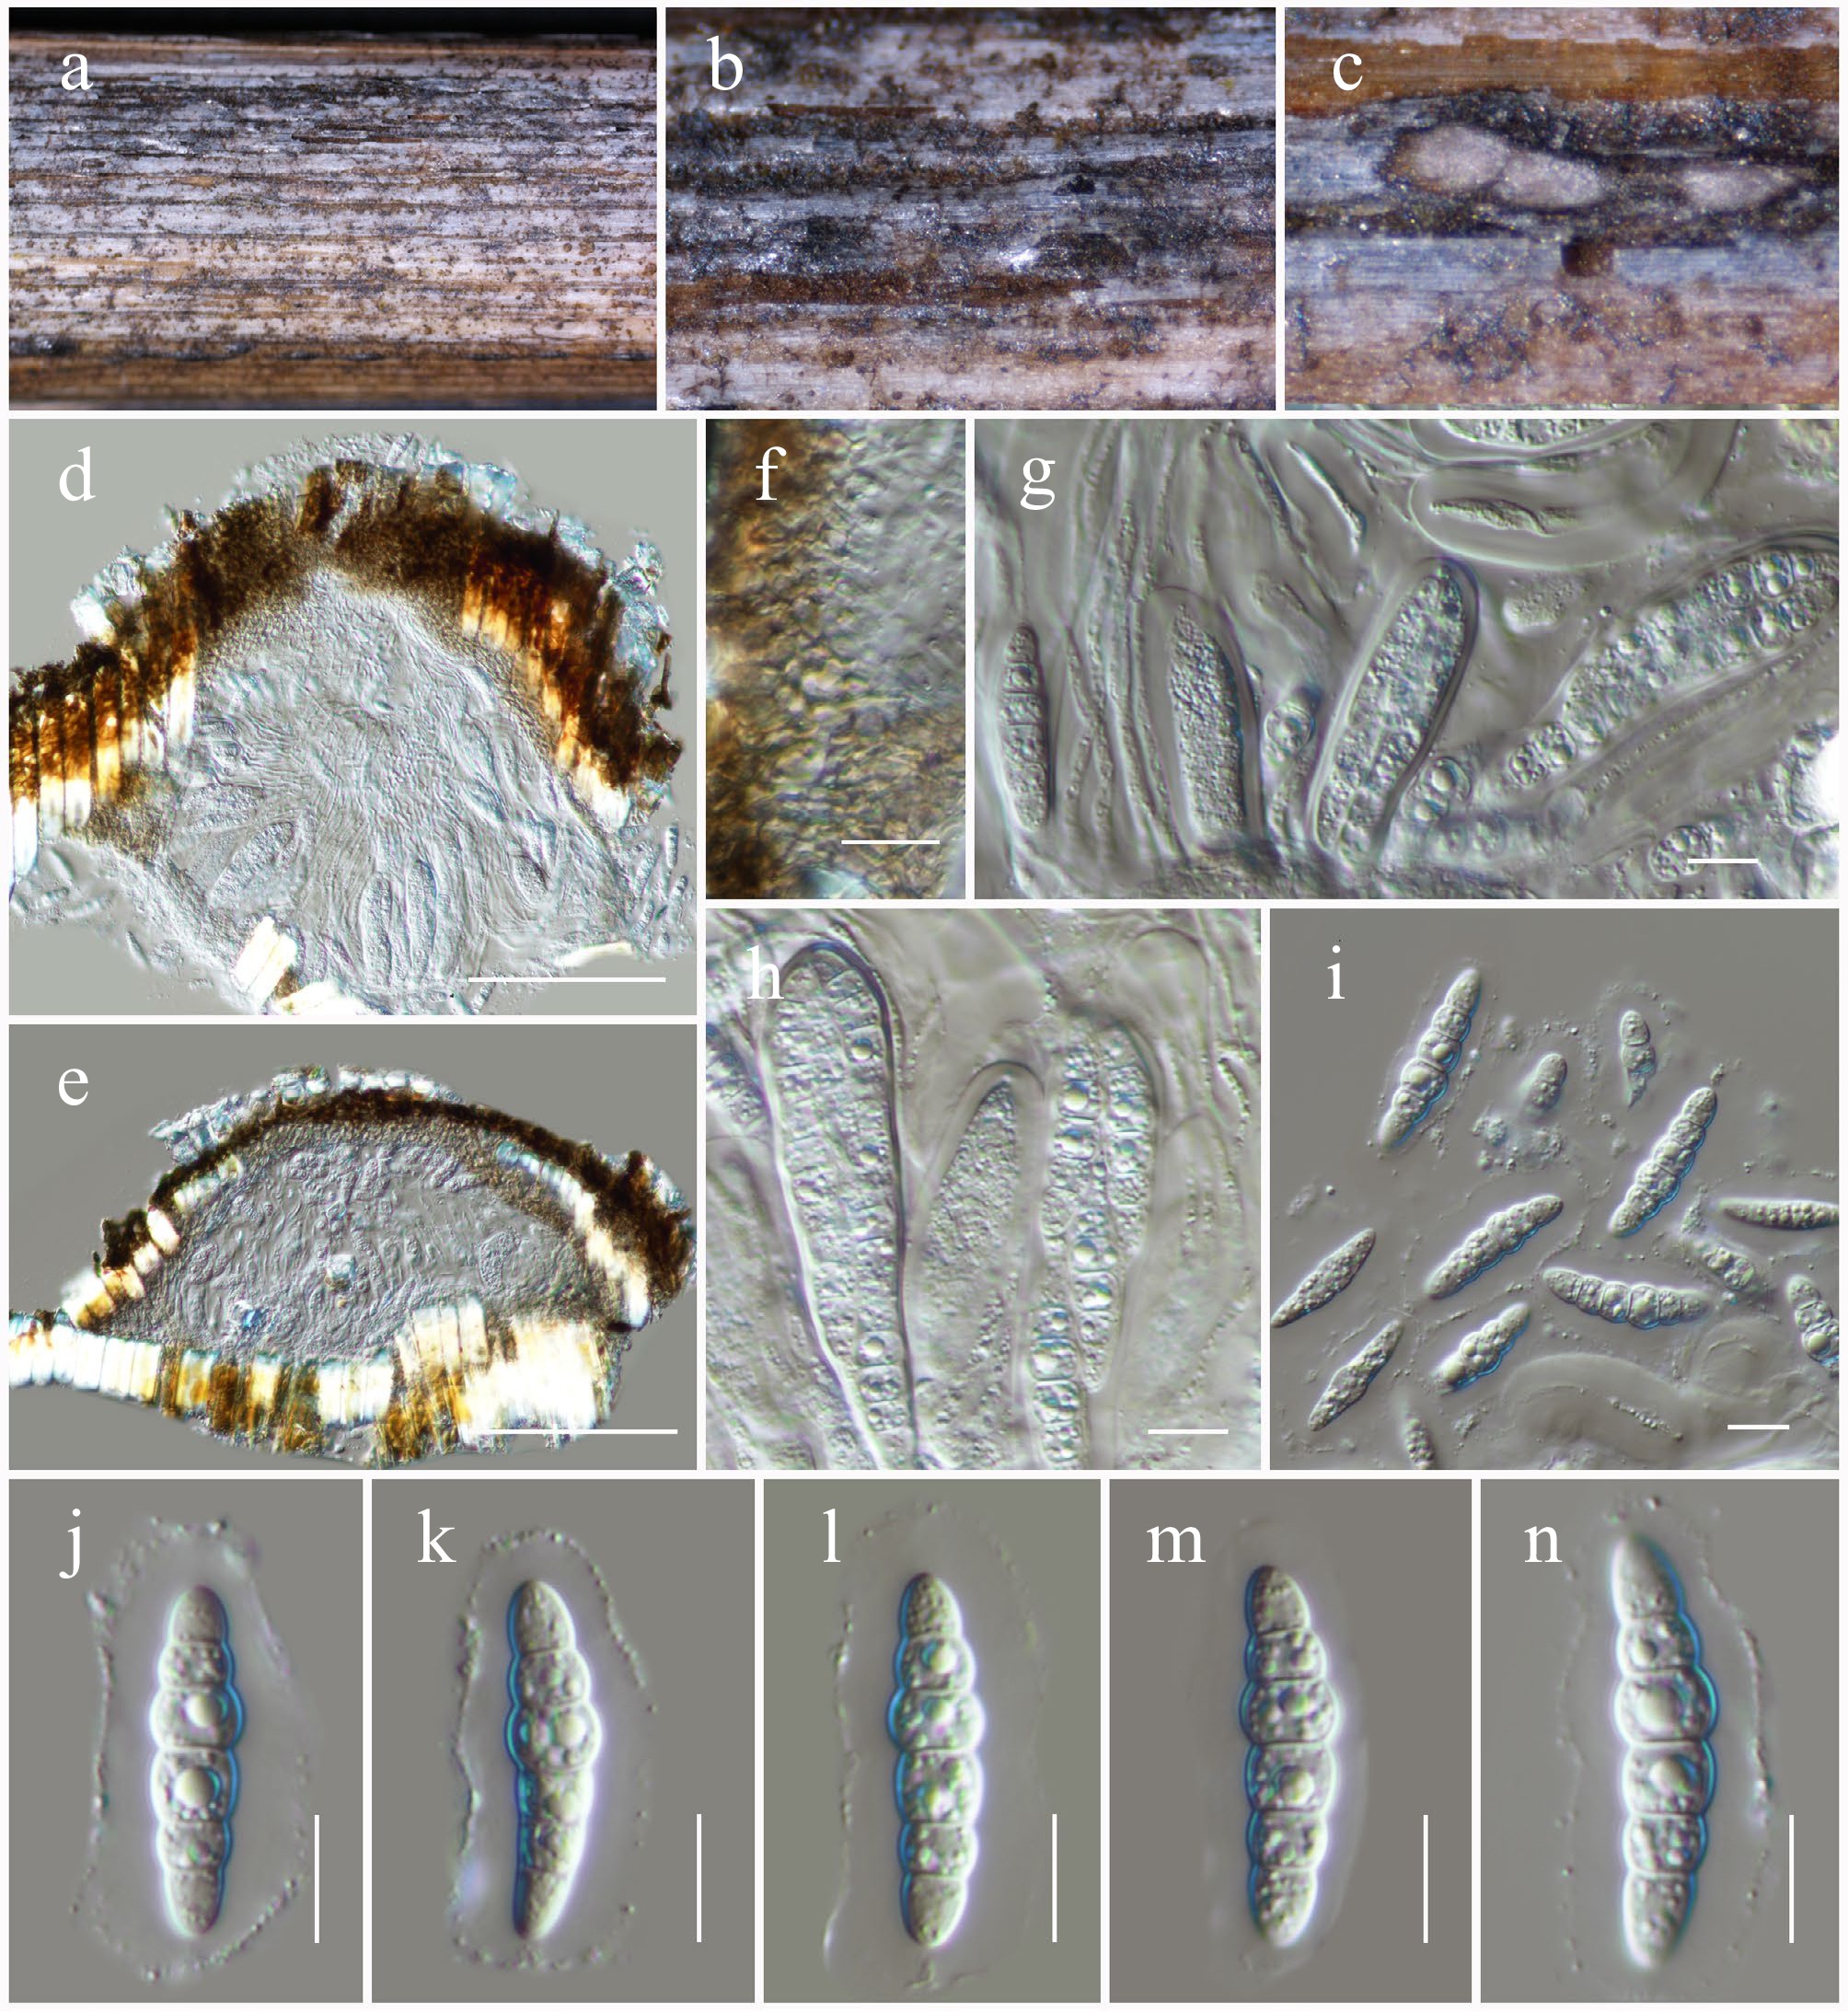
Figure 35.
Neomultiseptospora yunnanensis (HKAS146057). (a), (b) Ascomata on the dead woody twigs. (c)–(e) Cross-section of ascomata. (f) Peridium. (g), (h) Asci and pseudoparaphyses. (i)–(n) Ascospores. Scale bars: (d), (e) = 100 µm, (f)–(n) = 10 µm.
-
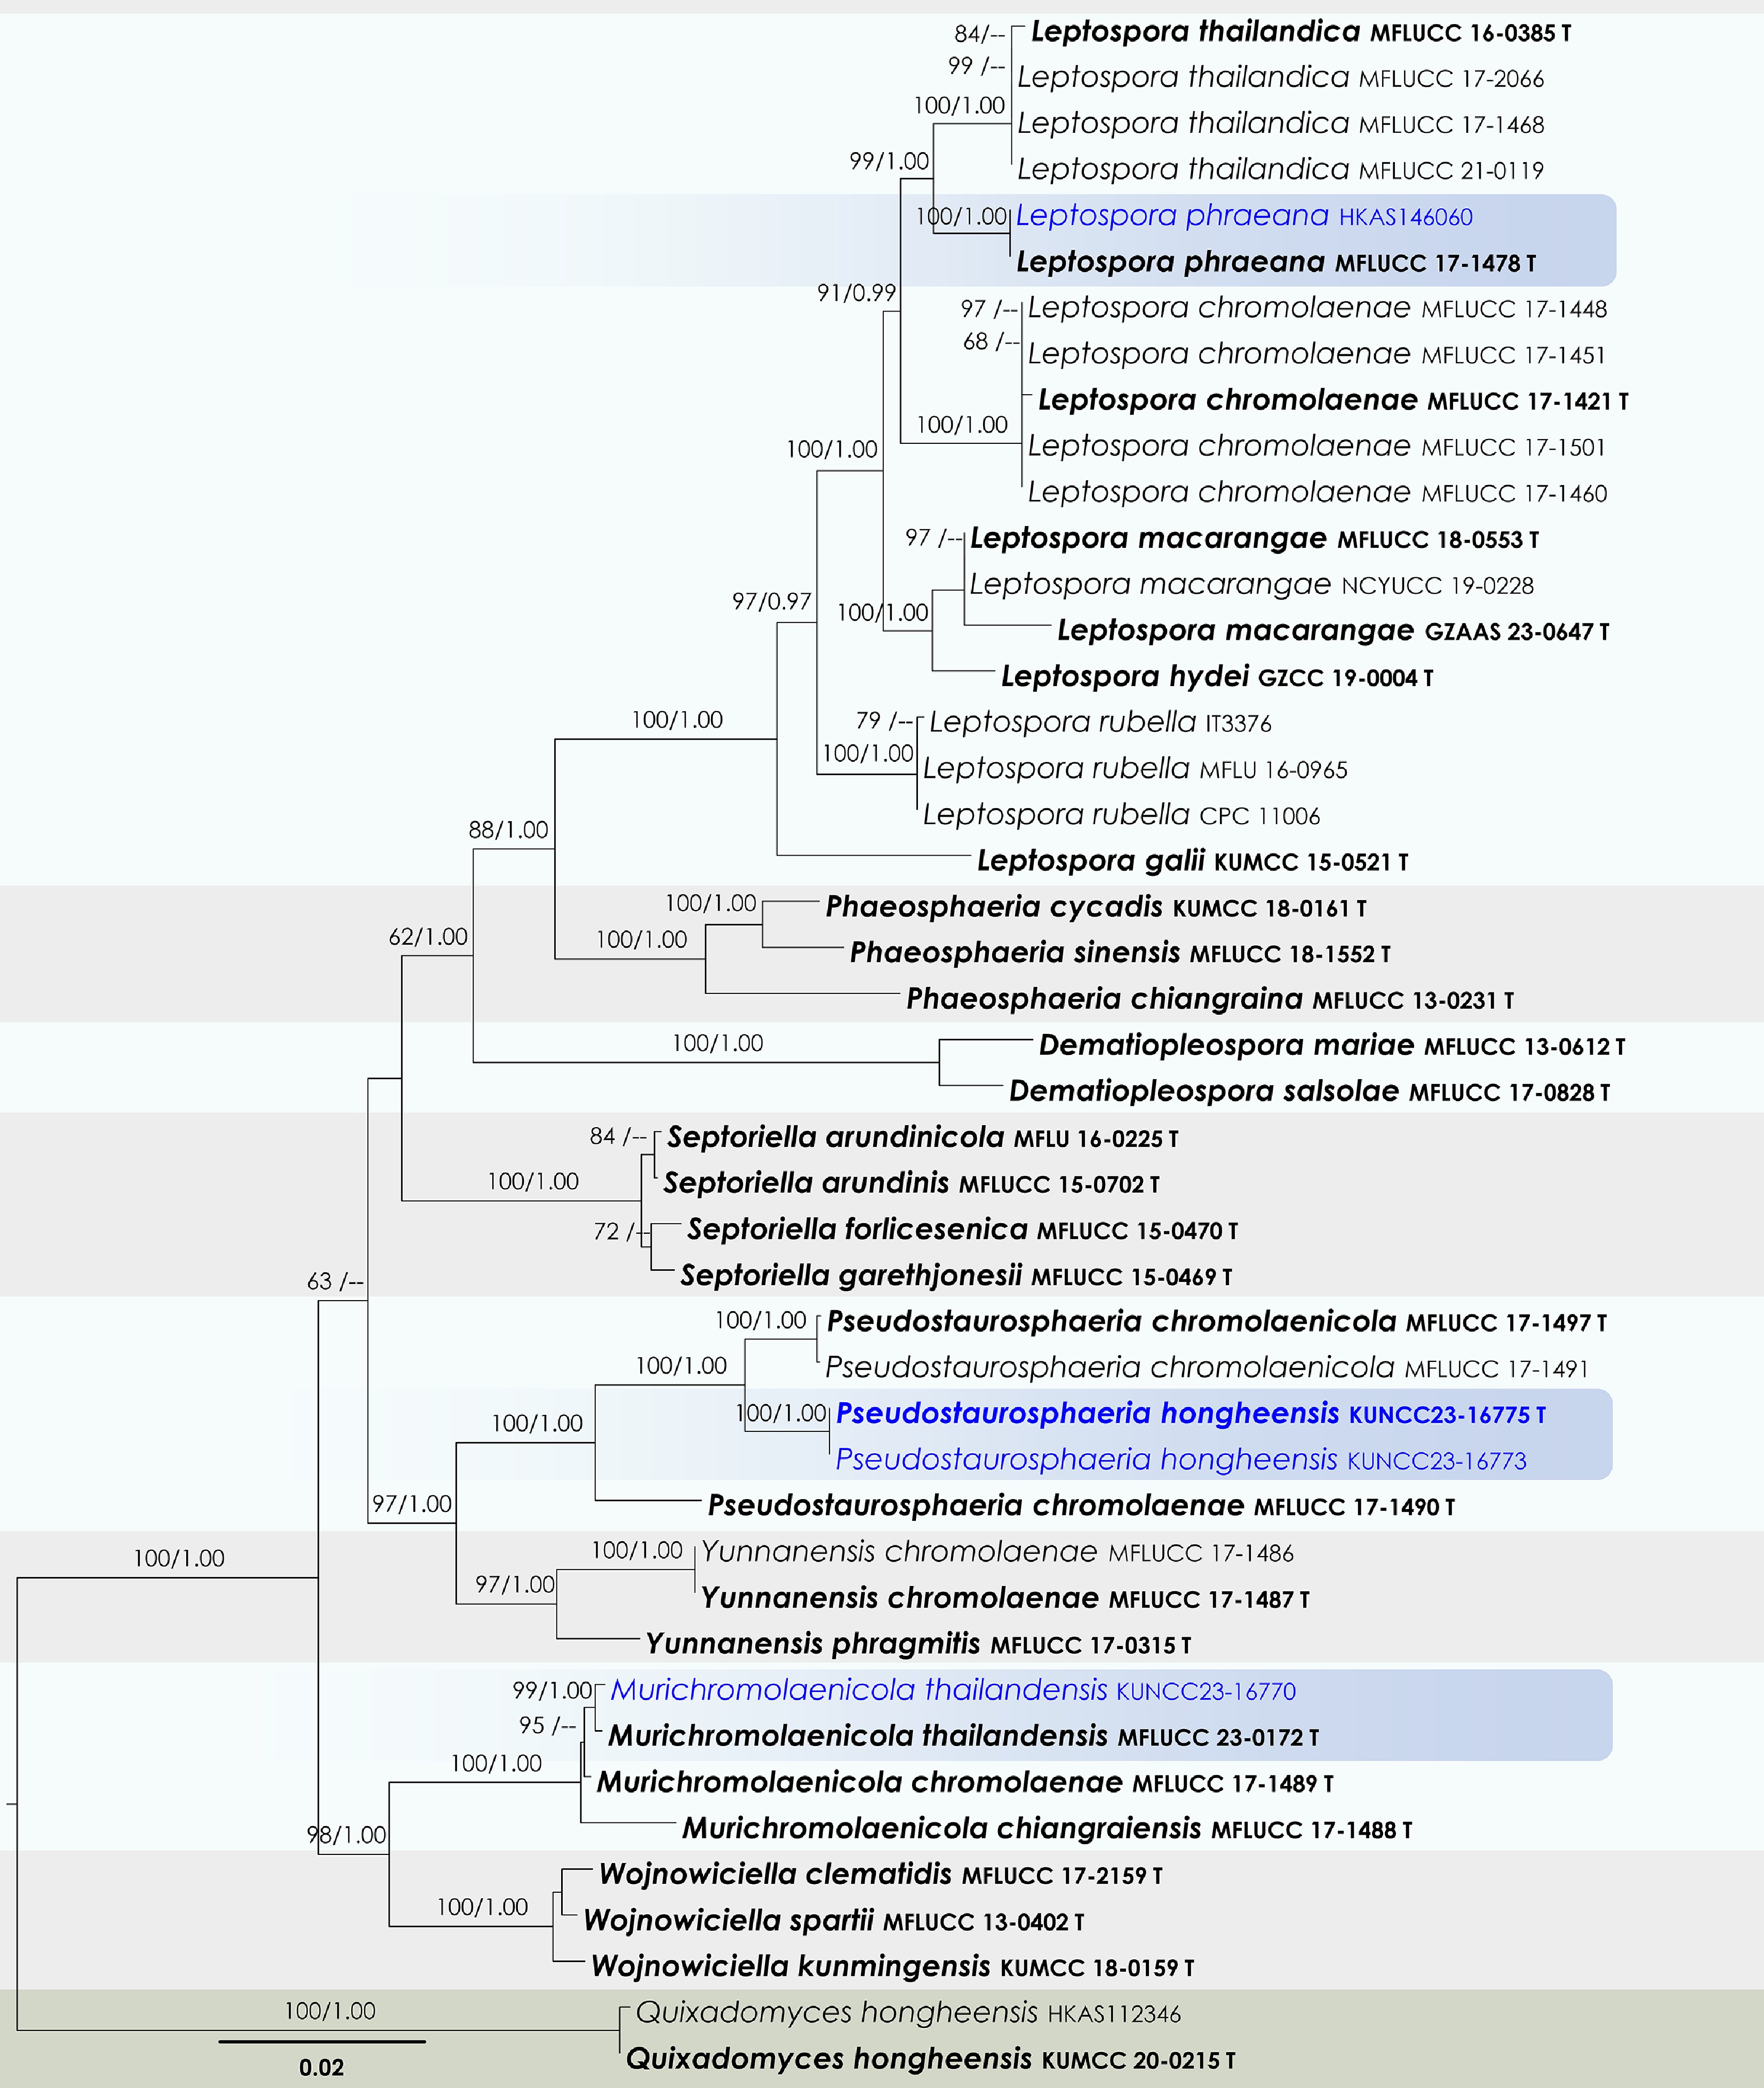
Figure 36.
Maximum Likelihood tree inferred from the concatenated dataset of partial SSU, LSU, ITS, tef1-α, and rpb2 sequences. The phylogeny is rooted with Quixadomyces hongheensis (HKAS112346, KUMCC 20-0215). The final likelihood value is –11,594.436322. The final alignment included 658 unique site patterns, with approximately 9.44% of the positions comprising gaps or ambiguous characters. The estimated nucleotide frequencies were as follows: A = 0.243939, C = 0.239658, G = 0.264036, T = 0.252368. The substitution model yielded the following relative rates: AC = 0.848781, AG = 2.550385, AT = 2.306846, CG = 0.490775, CT = 5.900303 and GT = 1.000000. The proportion of invariable sites (I) was estimated at 0.719615, and the gamma distribution shape parameter (α) was 0.686992. Bayesian inference reached convergence after 221,000 generations, when the average standard deviation of split frequencies dropped below 0.01 (observed value: 0.009792). A total of 2,211 trees were sampled, and 1,659 of these were retained for the final analysis after discarding the initial 25% as burn-in. The alignment also revealed 659 distinct informative sites. In the resulting phylograms, sequences generated in this study are highlighted in blue, while ex-type or type strains are indicated in boldface.
-
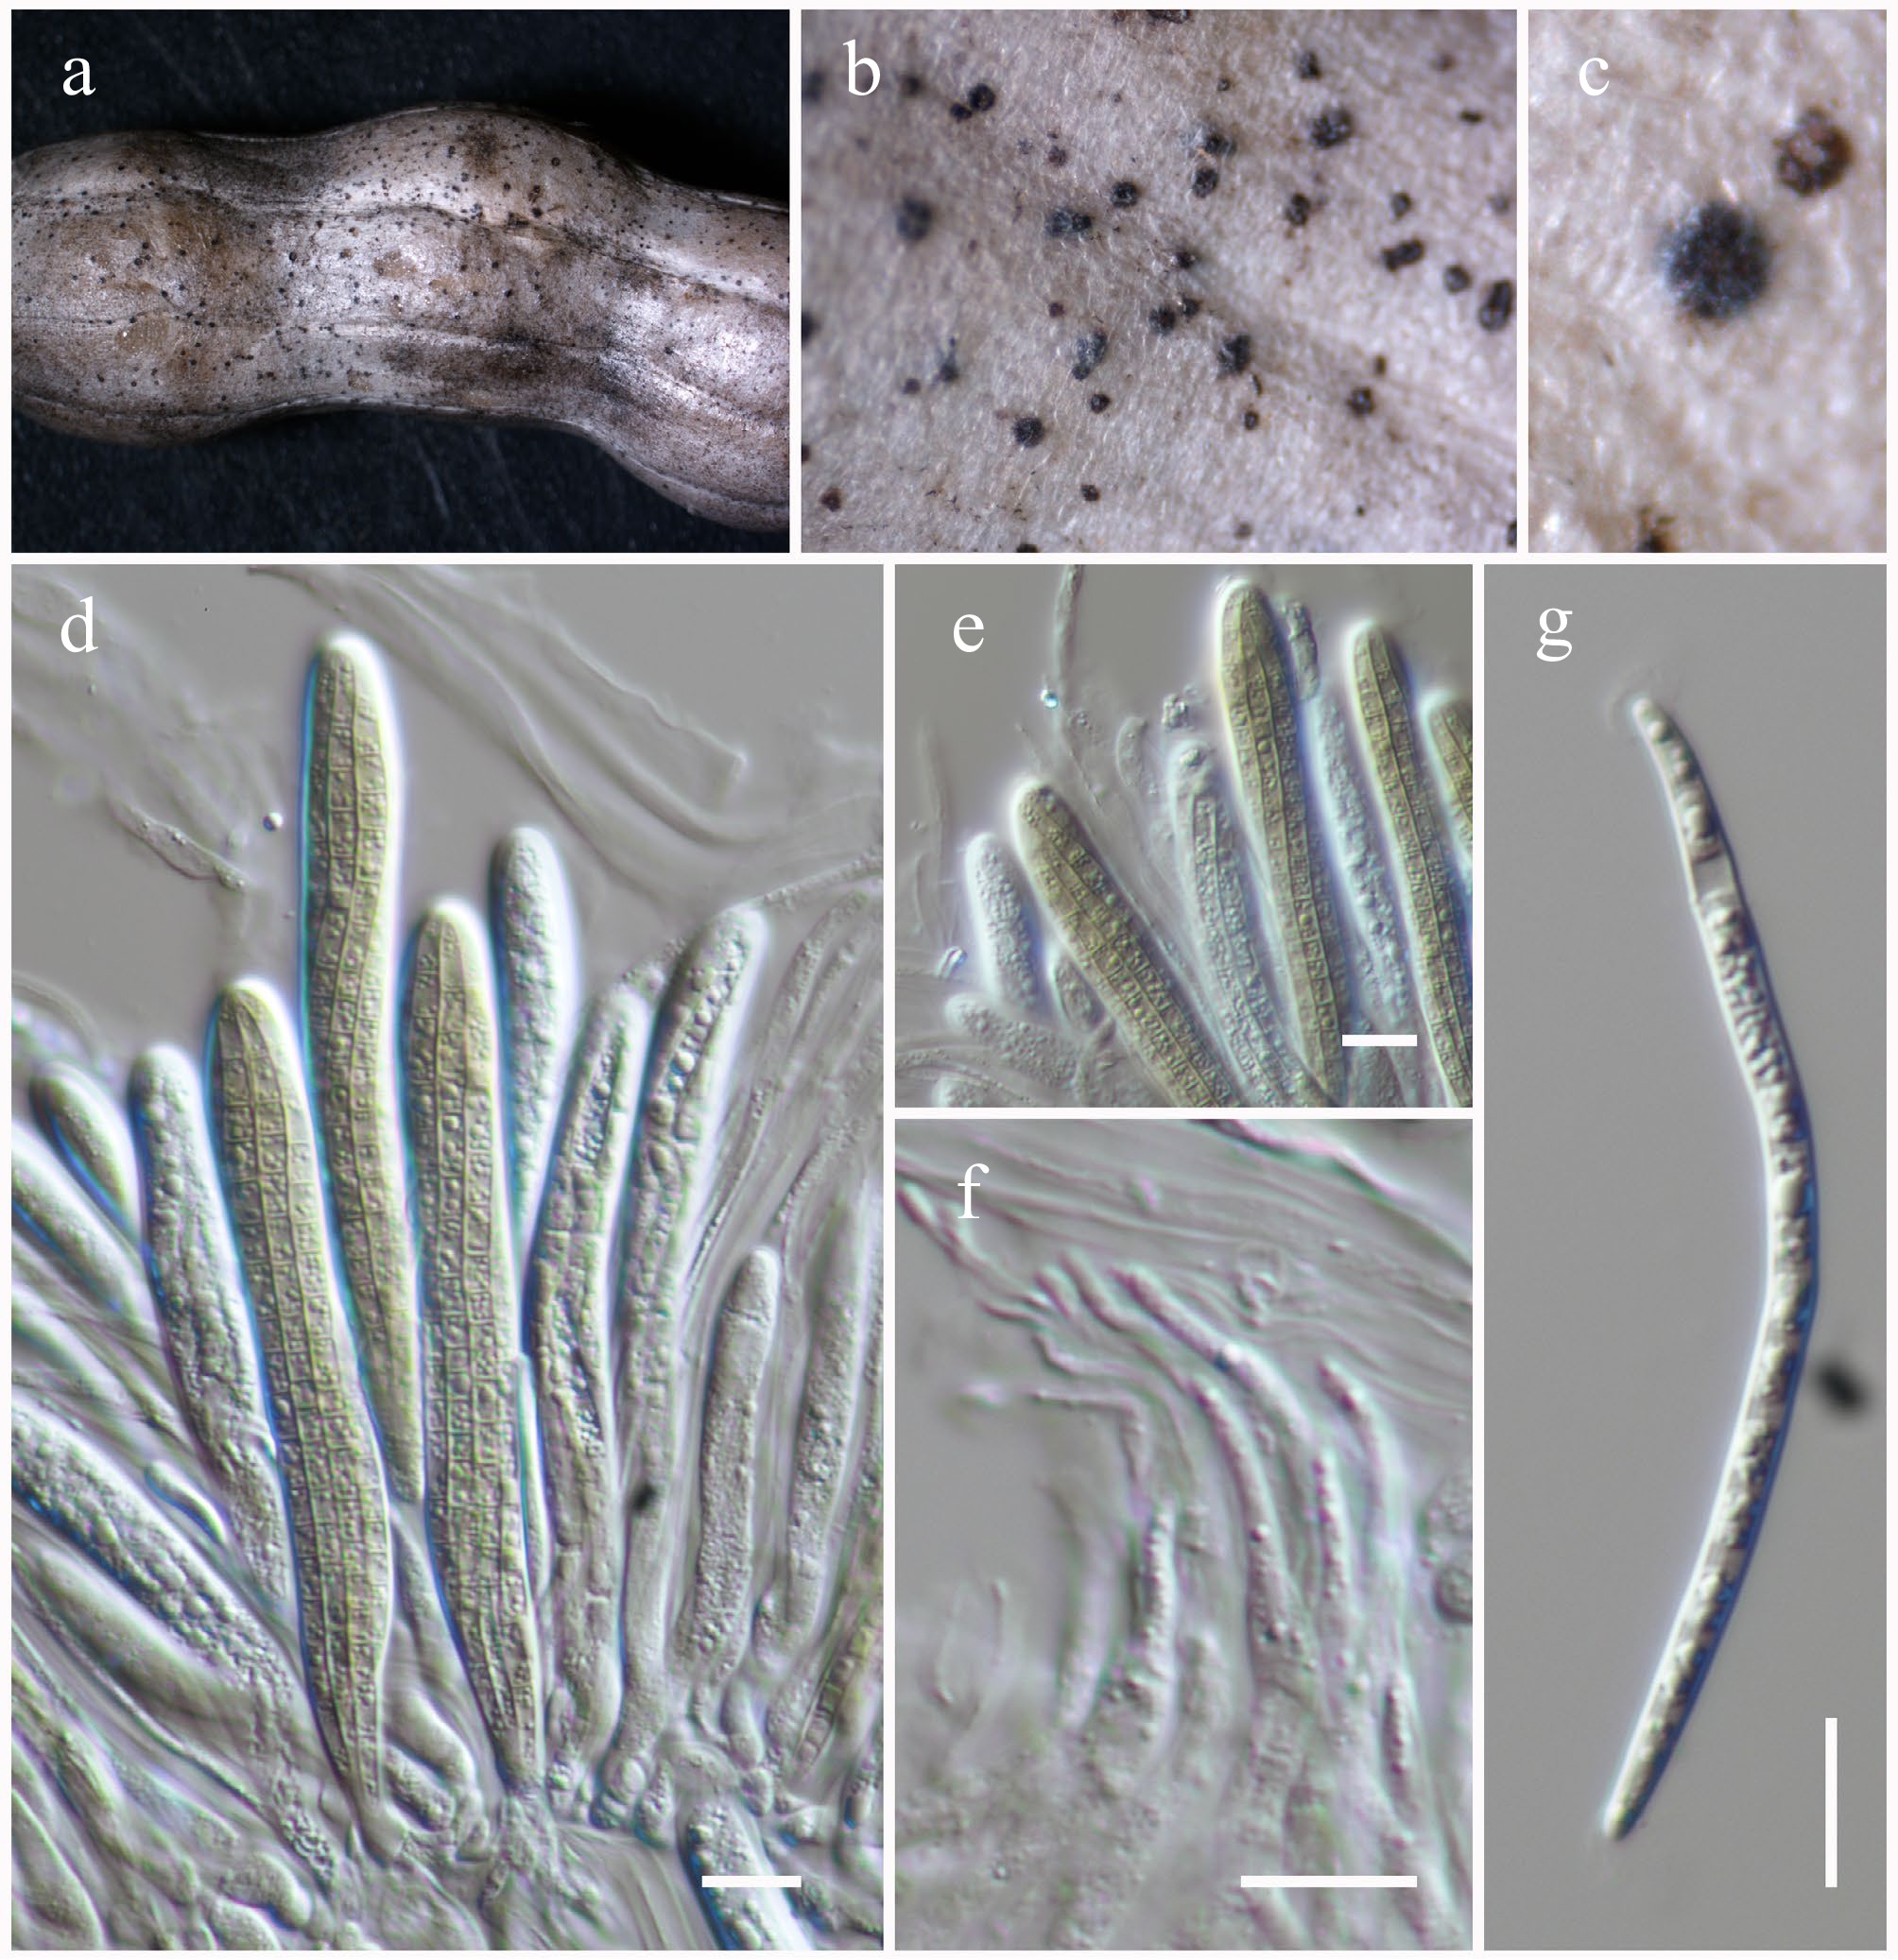
Figure 37.
Leptospora phraeana (HKAS146060). (a)–(c) Ascomata on the dead woody twigs. (d), (e) Asci. (f) Pseudoparaphyses. (i) Ascospore. Scale bars: (d)–(g) = 10 µm.
-
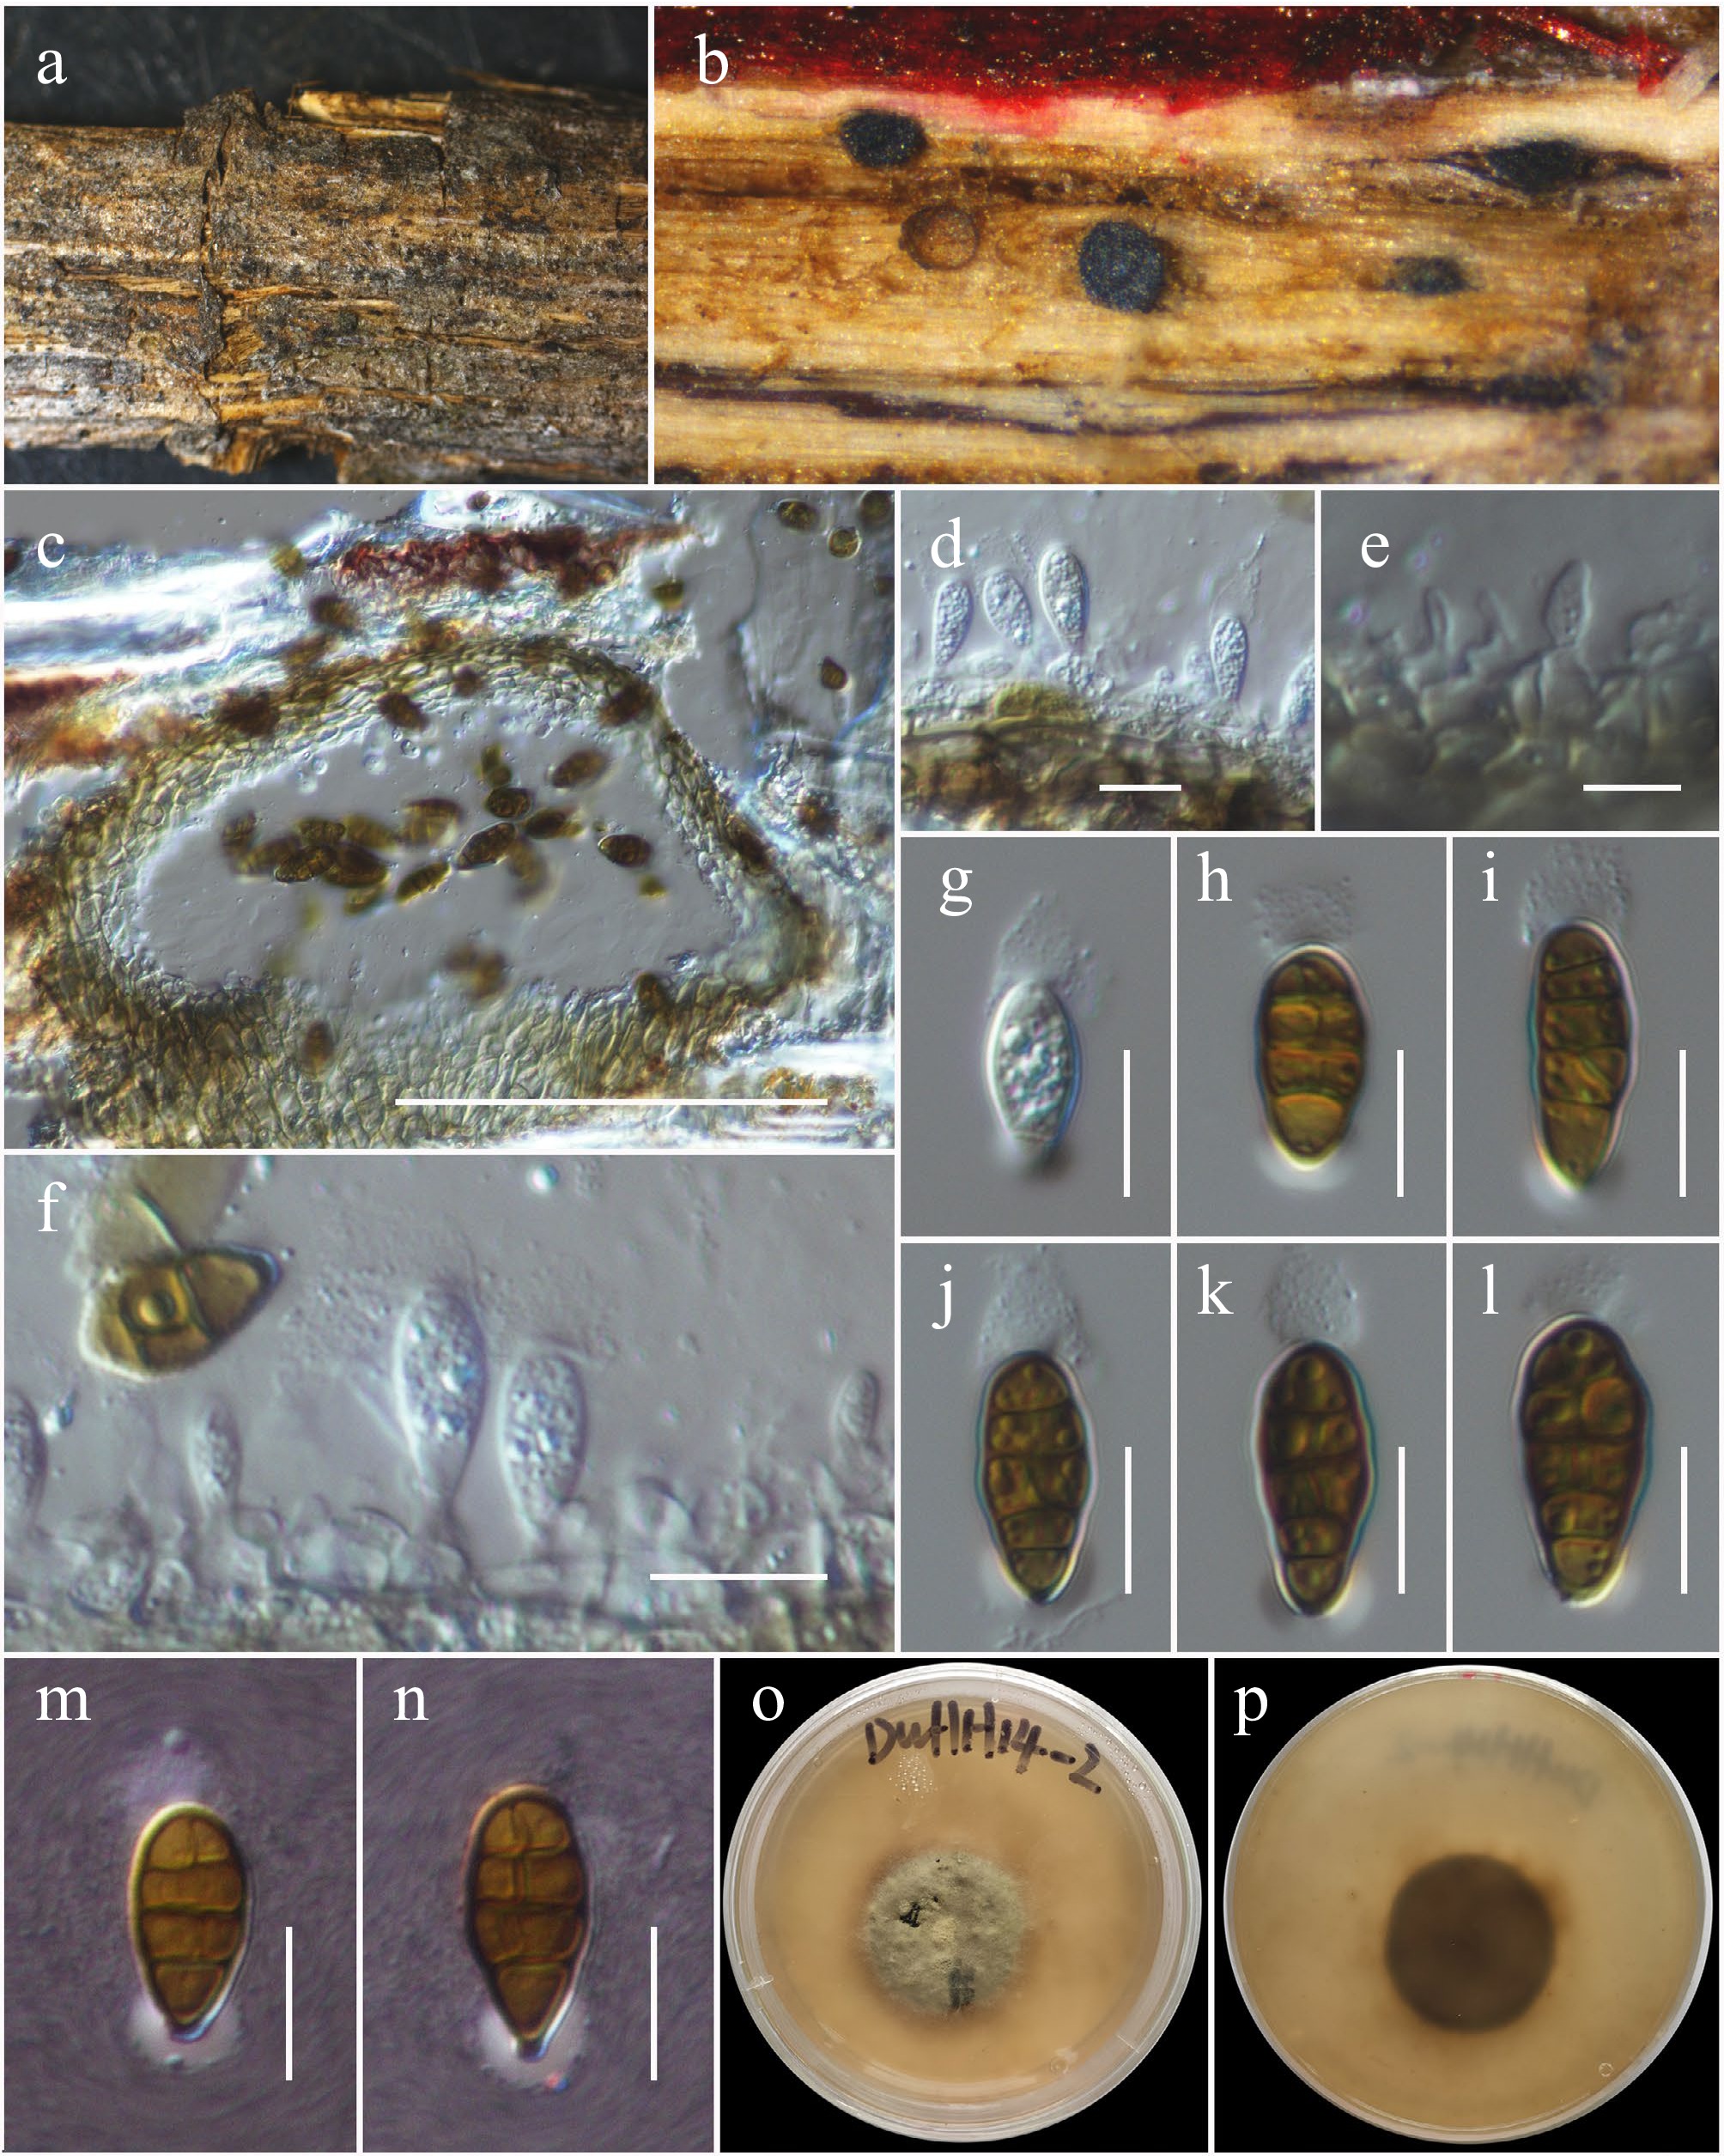
Figure 38.
Murichromolaenicola thailandensis (HKAS146061). (a), (b) Conidiomata on host. (c) Section of a conidioma. (d)–(f) Conidiogenous cells. (g)–(n) Conidia (m and n with the Indian Ink). (o), (p) Colony on MEA (p from the bottom). Scale bars: (c) = 50 µm, (d)–(f) = 10 µm, (g)–(n) = 5 µm.
-
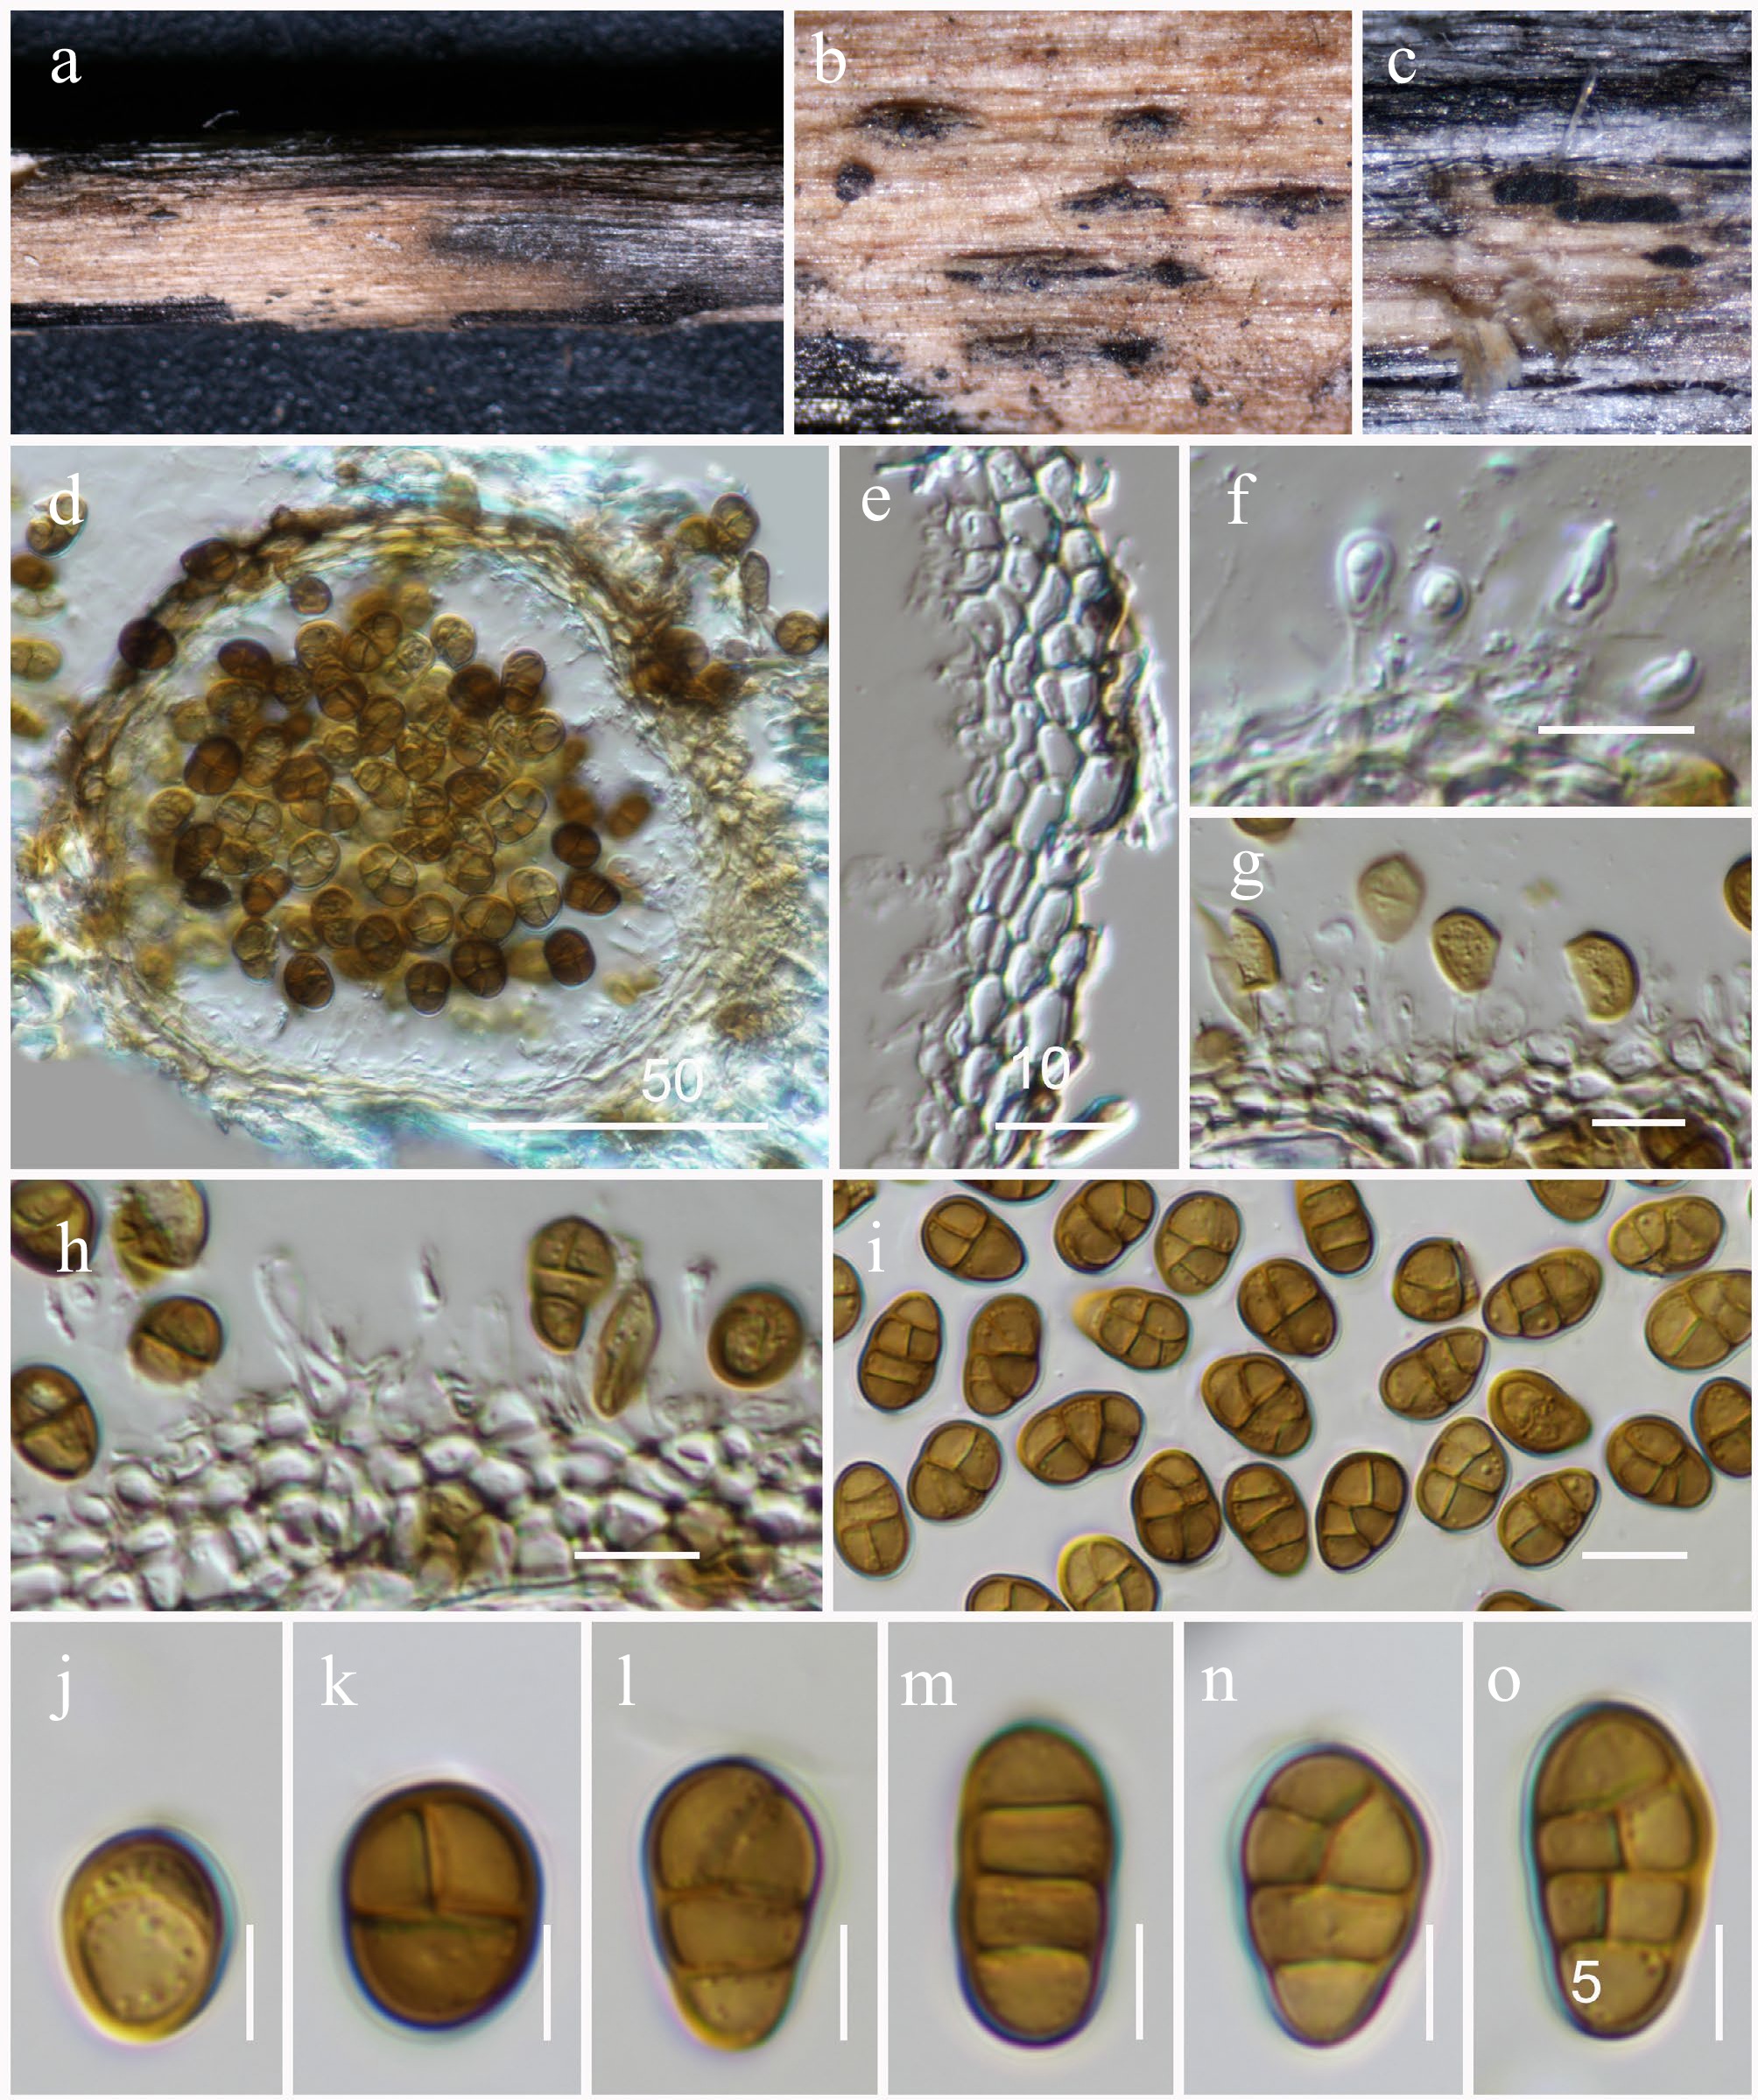
Figure 39.
Pseudostaurosphaeria hongheensis (HKAS146062, holotype ). (a)–(c) Conidiomata on host. (d) Section of a conidioma. (e) Pycnidial wall. (f)–(h) Conidiogenous cells. (i)–(o) Conidia. Scale bars: (d) = 50 µm, (e)–(h) = 10 µm, (i)–(o) = 5 µm.
-
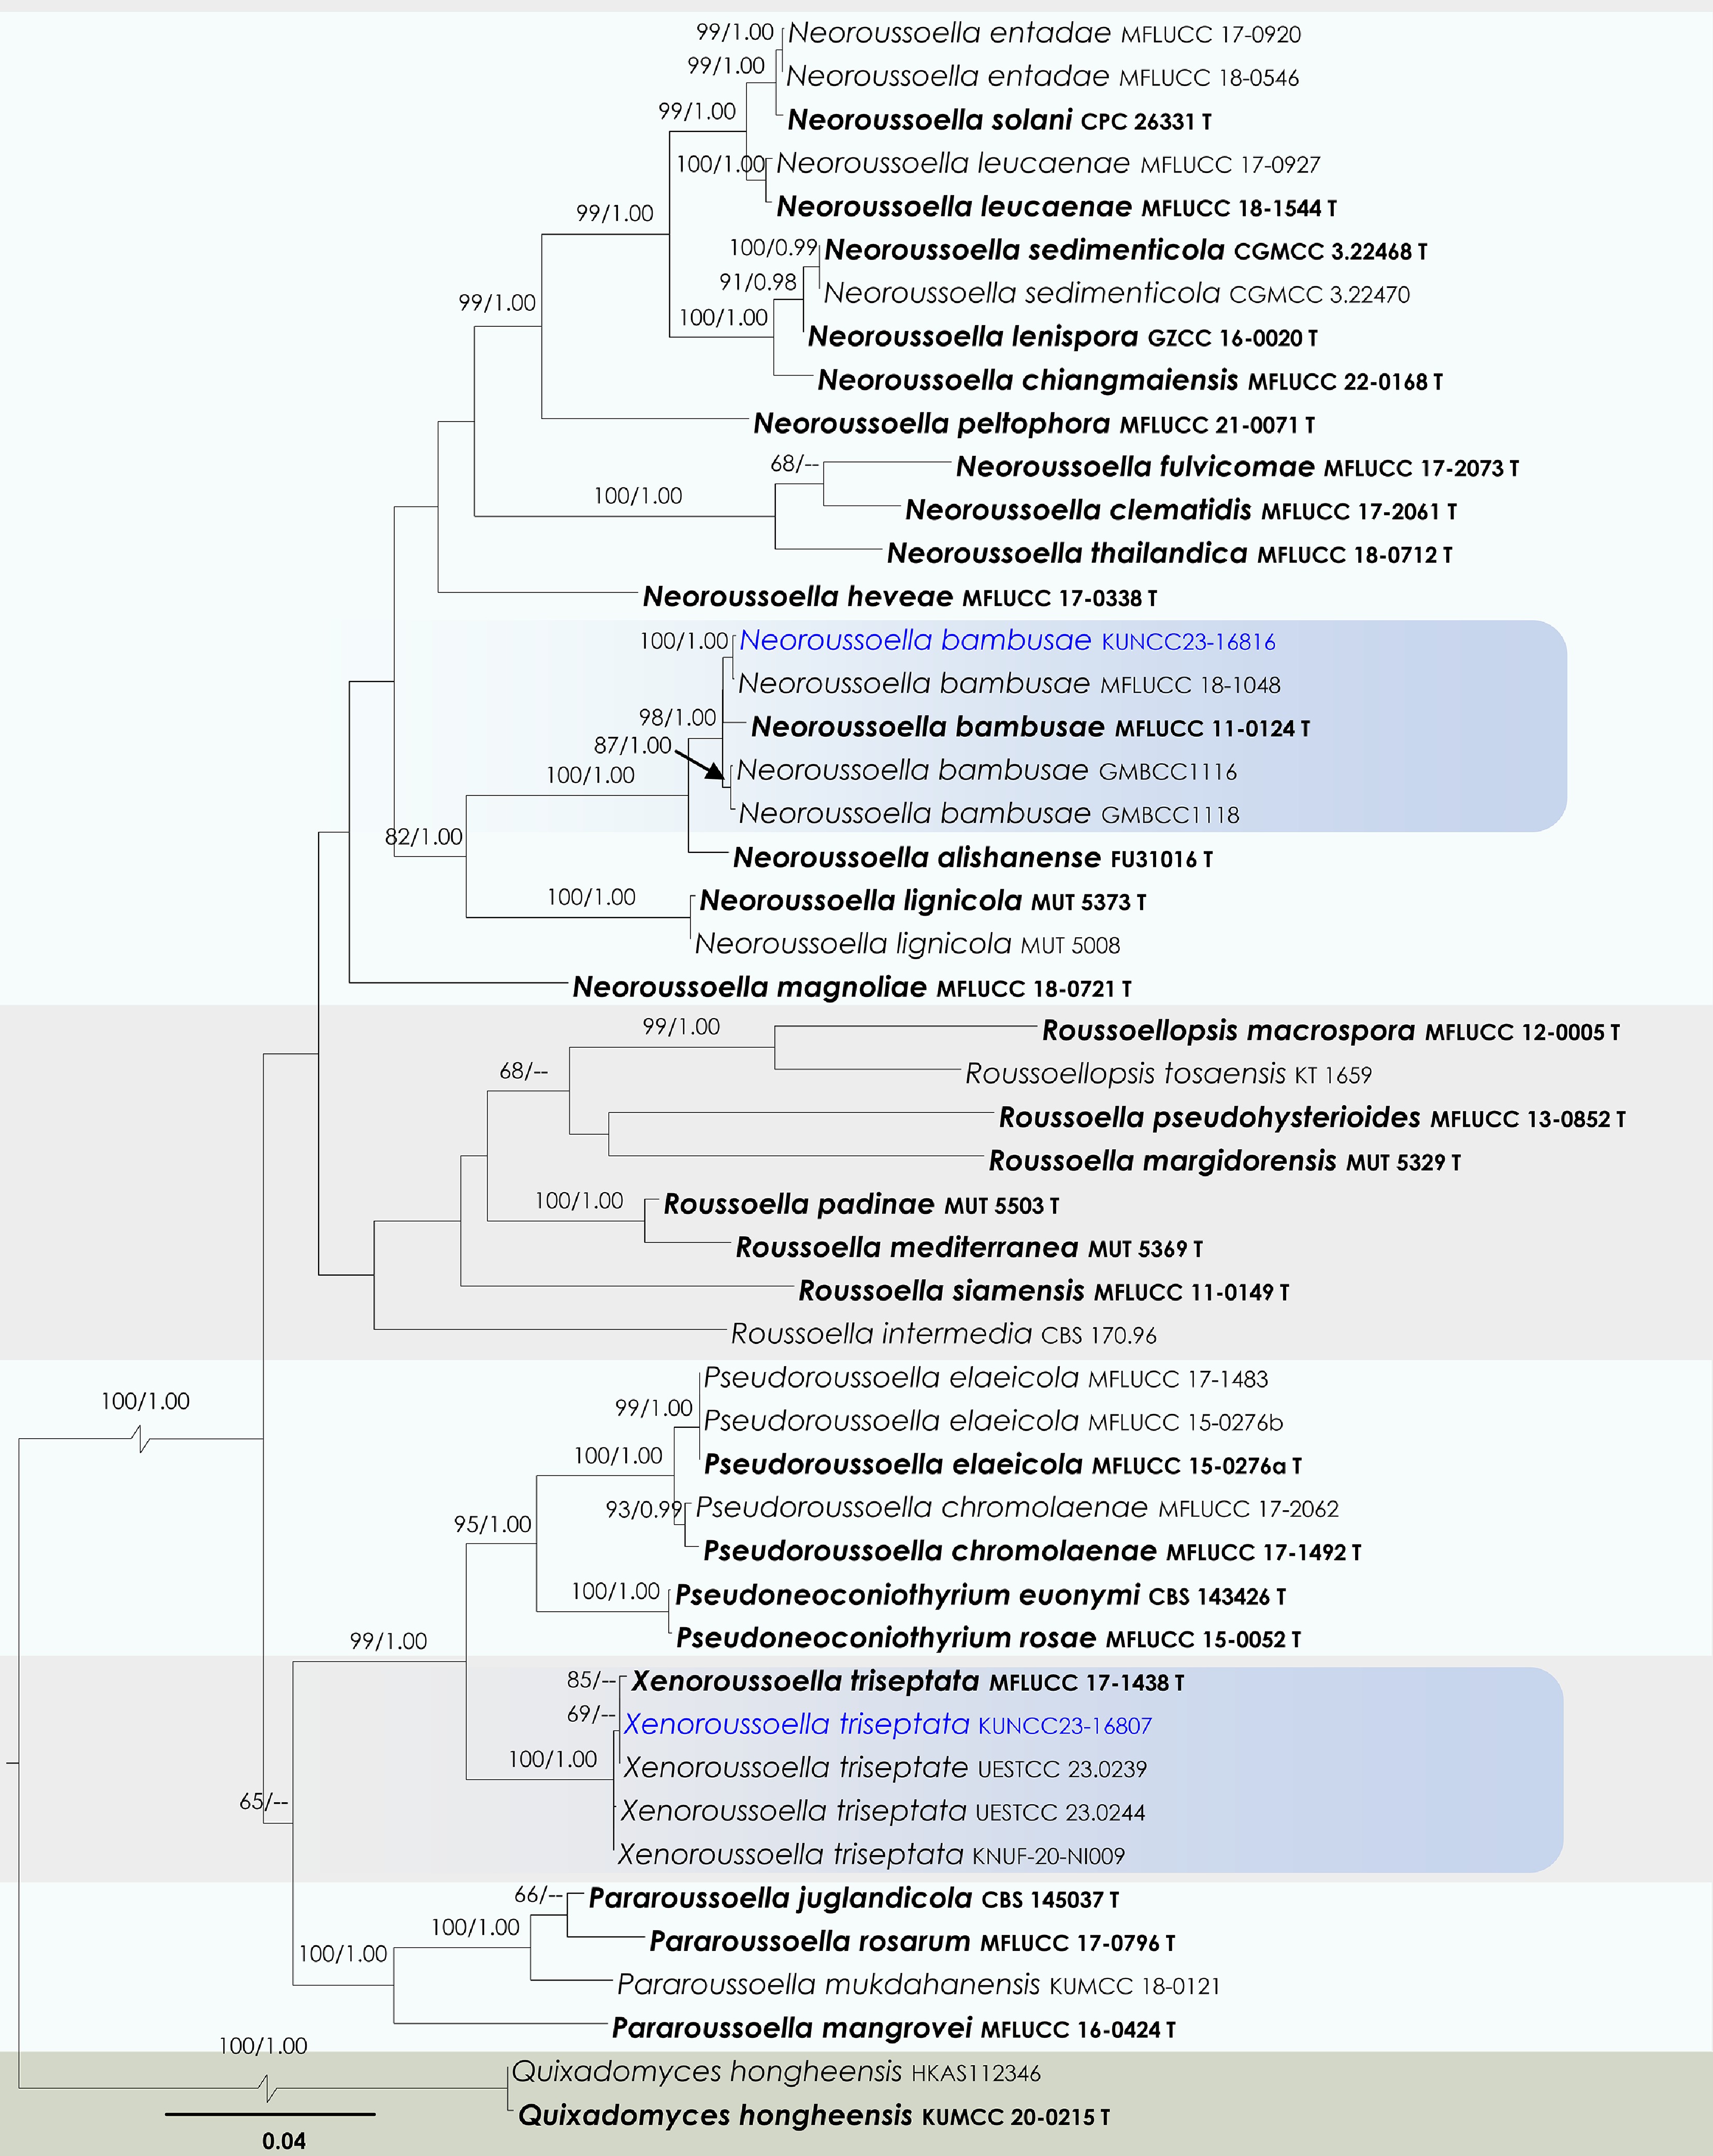
Figure 40.
Maximum Likelihood tree inferred from the concatenated dataset of partial SSU, LSU, ITS, tef1-α, and rpb2 sequences. The phylogeny is rooted with Quixadomyces hongheensis (HKAS112346, KUMCC 20-0215). The final likelihood value is –24,601.887530. The final alignment included 1,510 unique site patterns, with approximately 21.76% of the positions comprising gaps or ambiguous characters. The estimated nucleotide frequencies were as follows: A = 0.246109, C = 0.256427, G = 0.266572, T = 0.230892. The substitution model yielded the following relative rates: AC = 1.941609, AG = 5.780010, AT = 2.469287, CG = 1.378238, CT = 11.805823, GT = 1.000000. The proportion of invariable sites (I) was estimated at 0.570250, and the gamma distribution shape parameter (α) was 0.468549. Bayesian inference reached convergence after 1,104,000 generations, when the average standard deviation of split frequencies dropped below 0.01 (observed value: 0.009906). A total of 11,041 trees were sampled, and 8,281 of these were retained for the final analysis after discarding the initial 25% as burn-in. The alignment also revealed 1,511 distinct informative sites. In the resulting phylograms, sequences generated in this study are highlighted in blue, while ex-type or type strains are indicated in boldface.
-
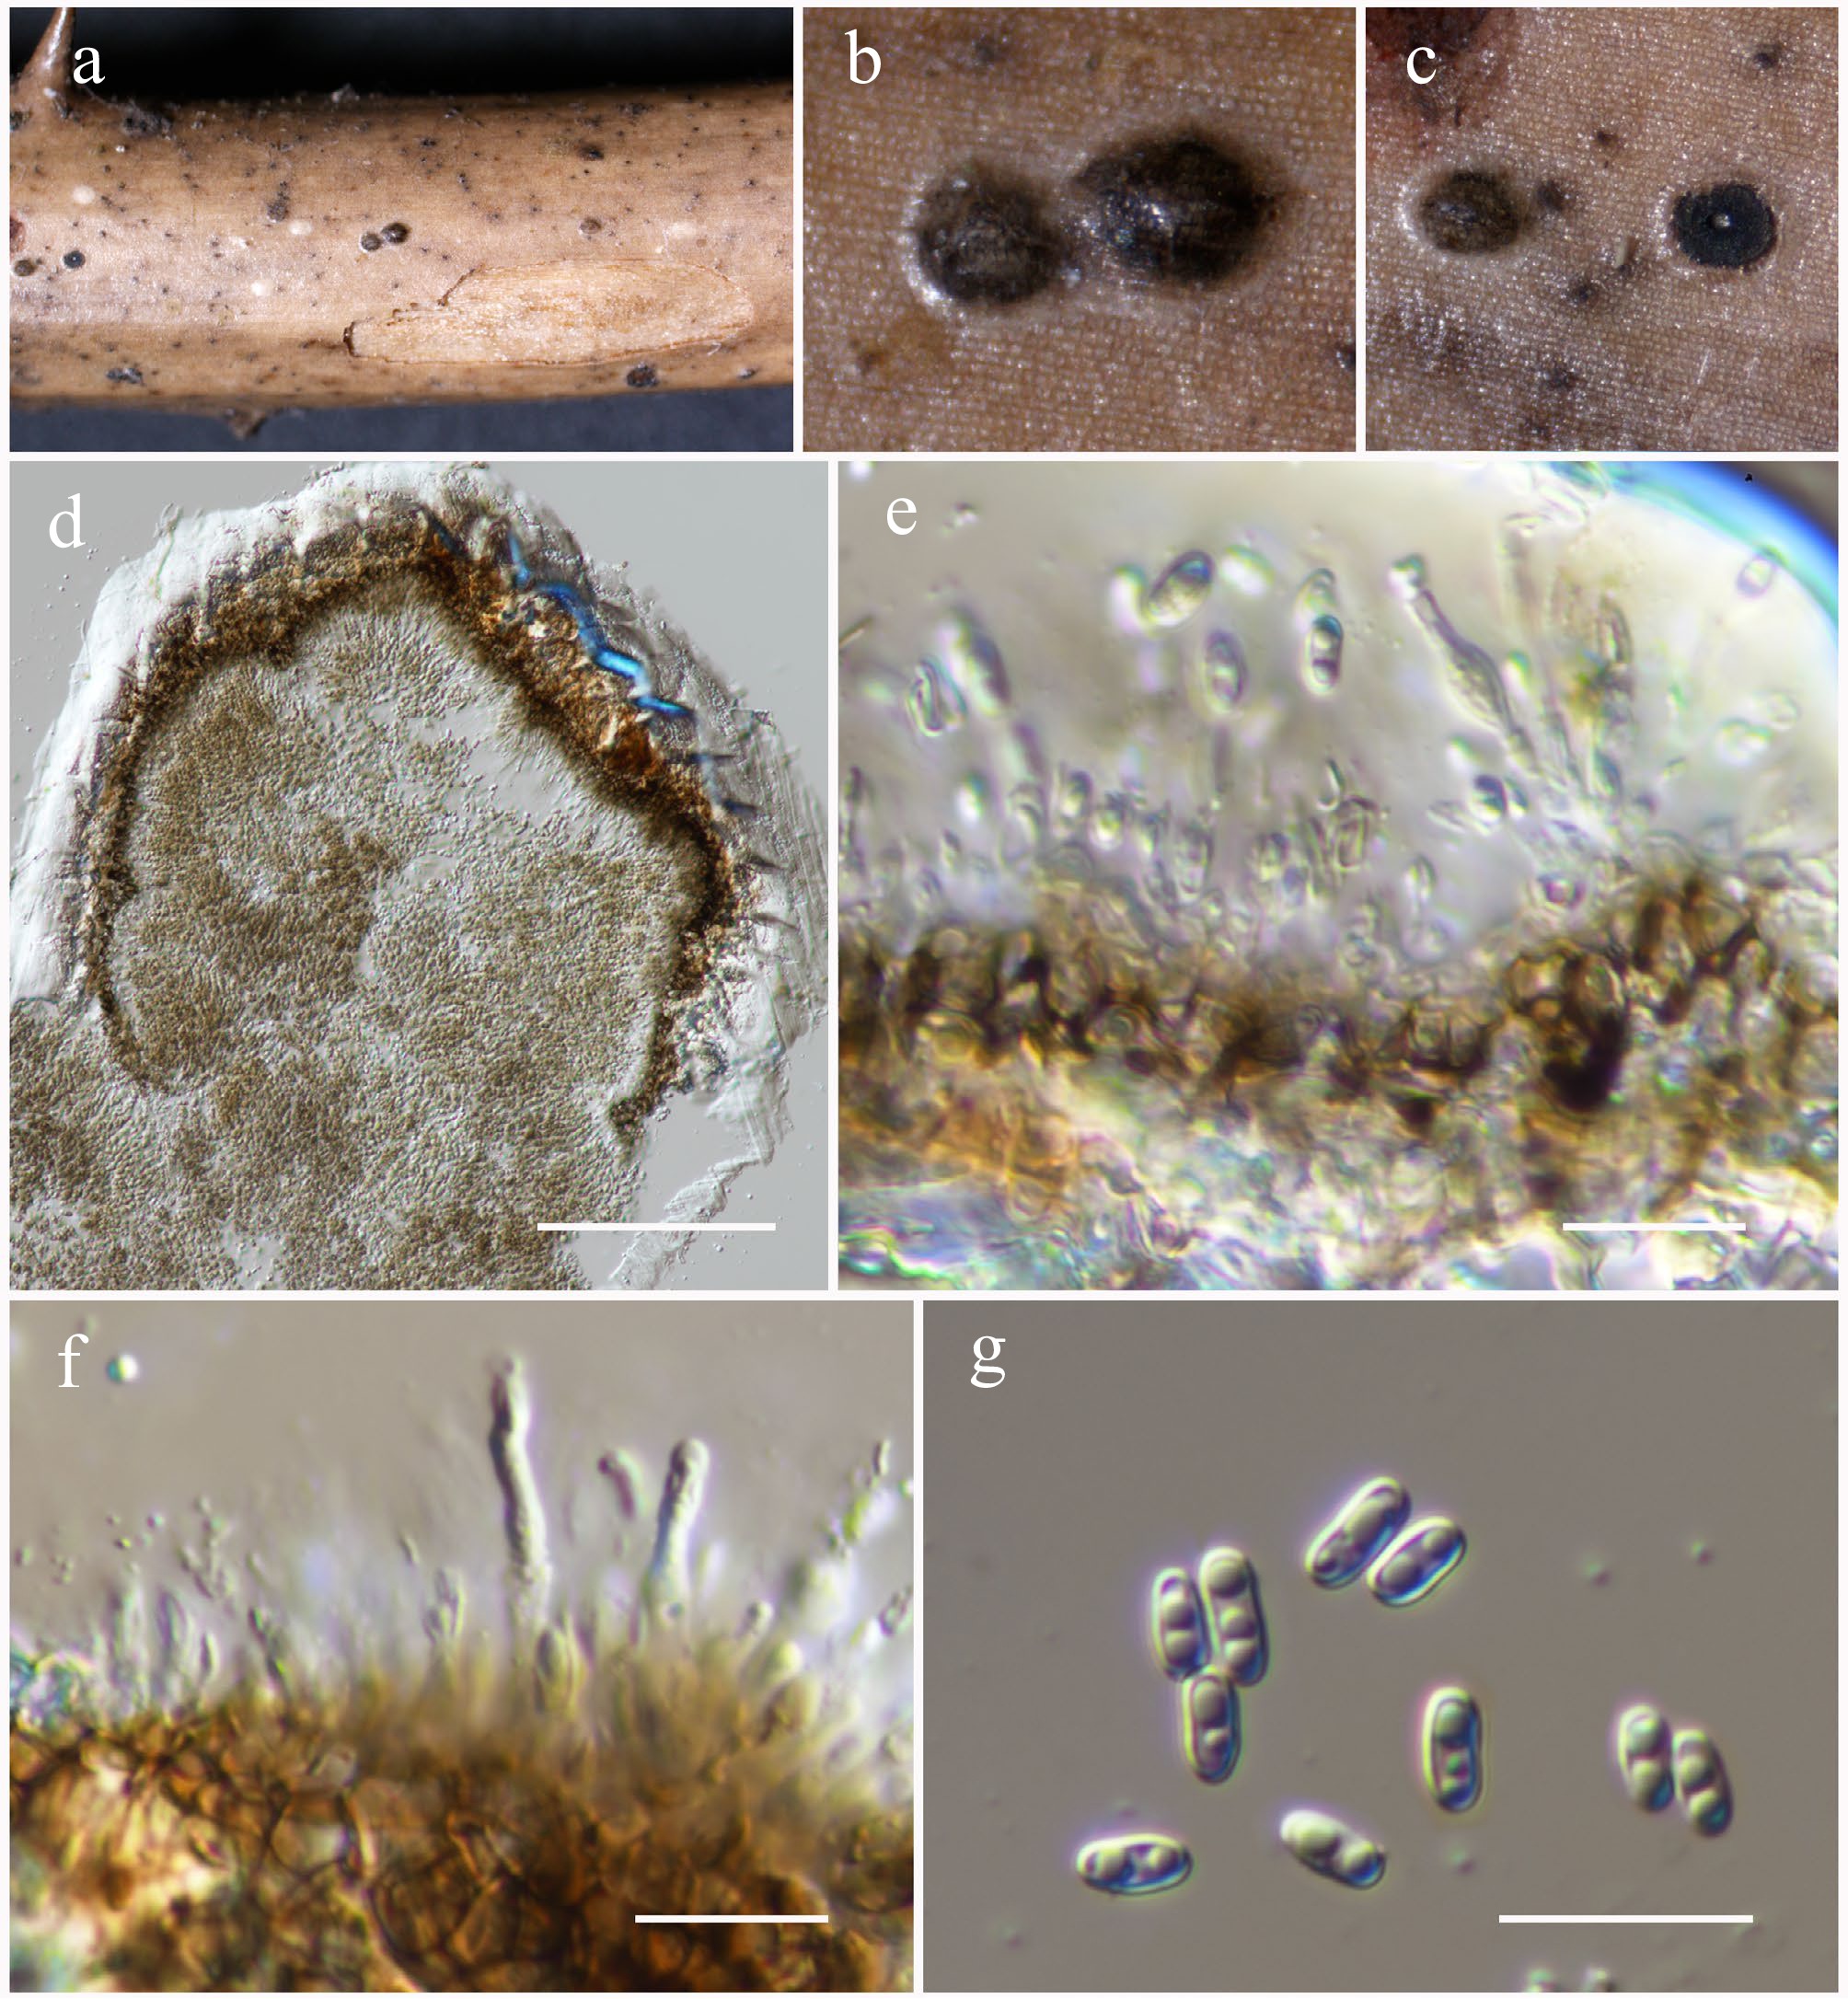
Figure 41.
Neoroussoella bambusae (HKAS146064). (a)–(c) Conidiomata on host. (d) Section of a conidioma. (e), (f) Conidiogenous cells. (g) Conidia. Scale bars: (d) = 100 µm, (e)–(g) = 10 µm.
-
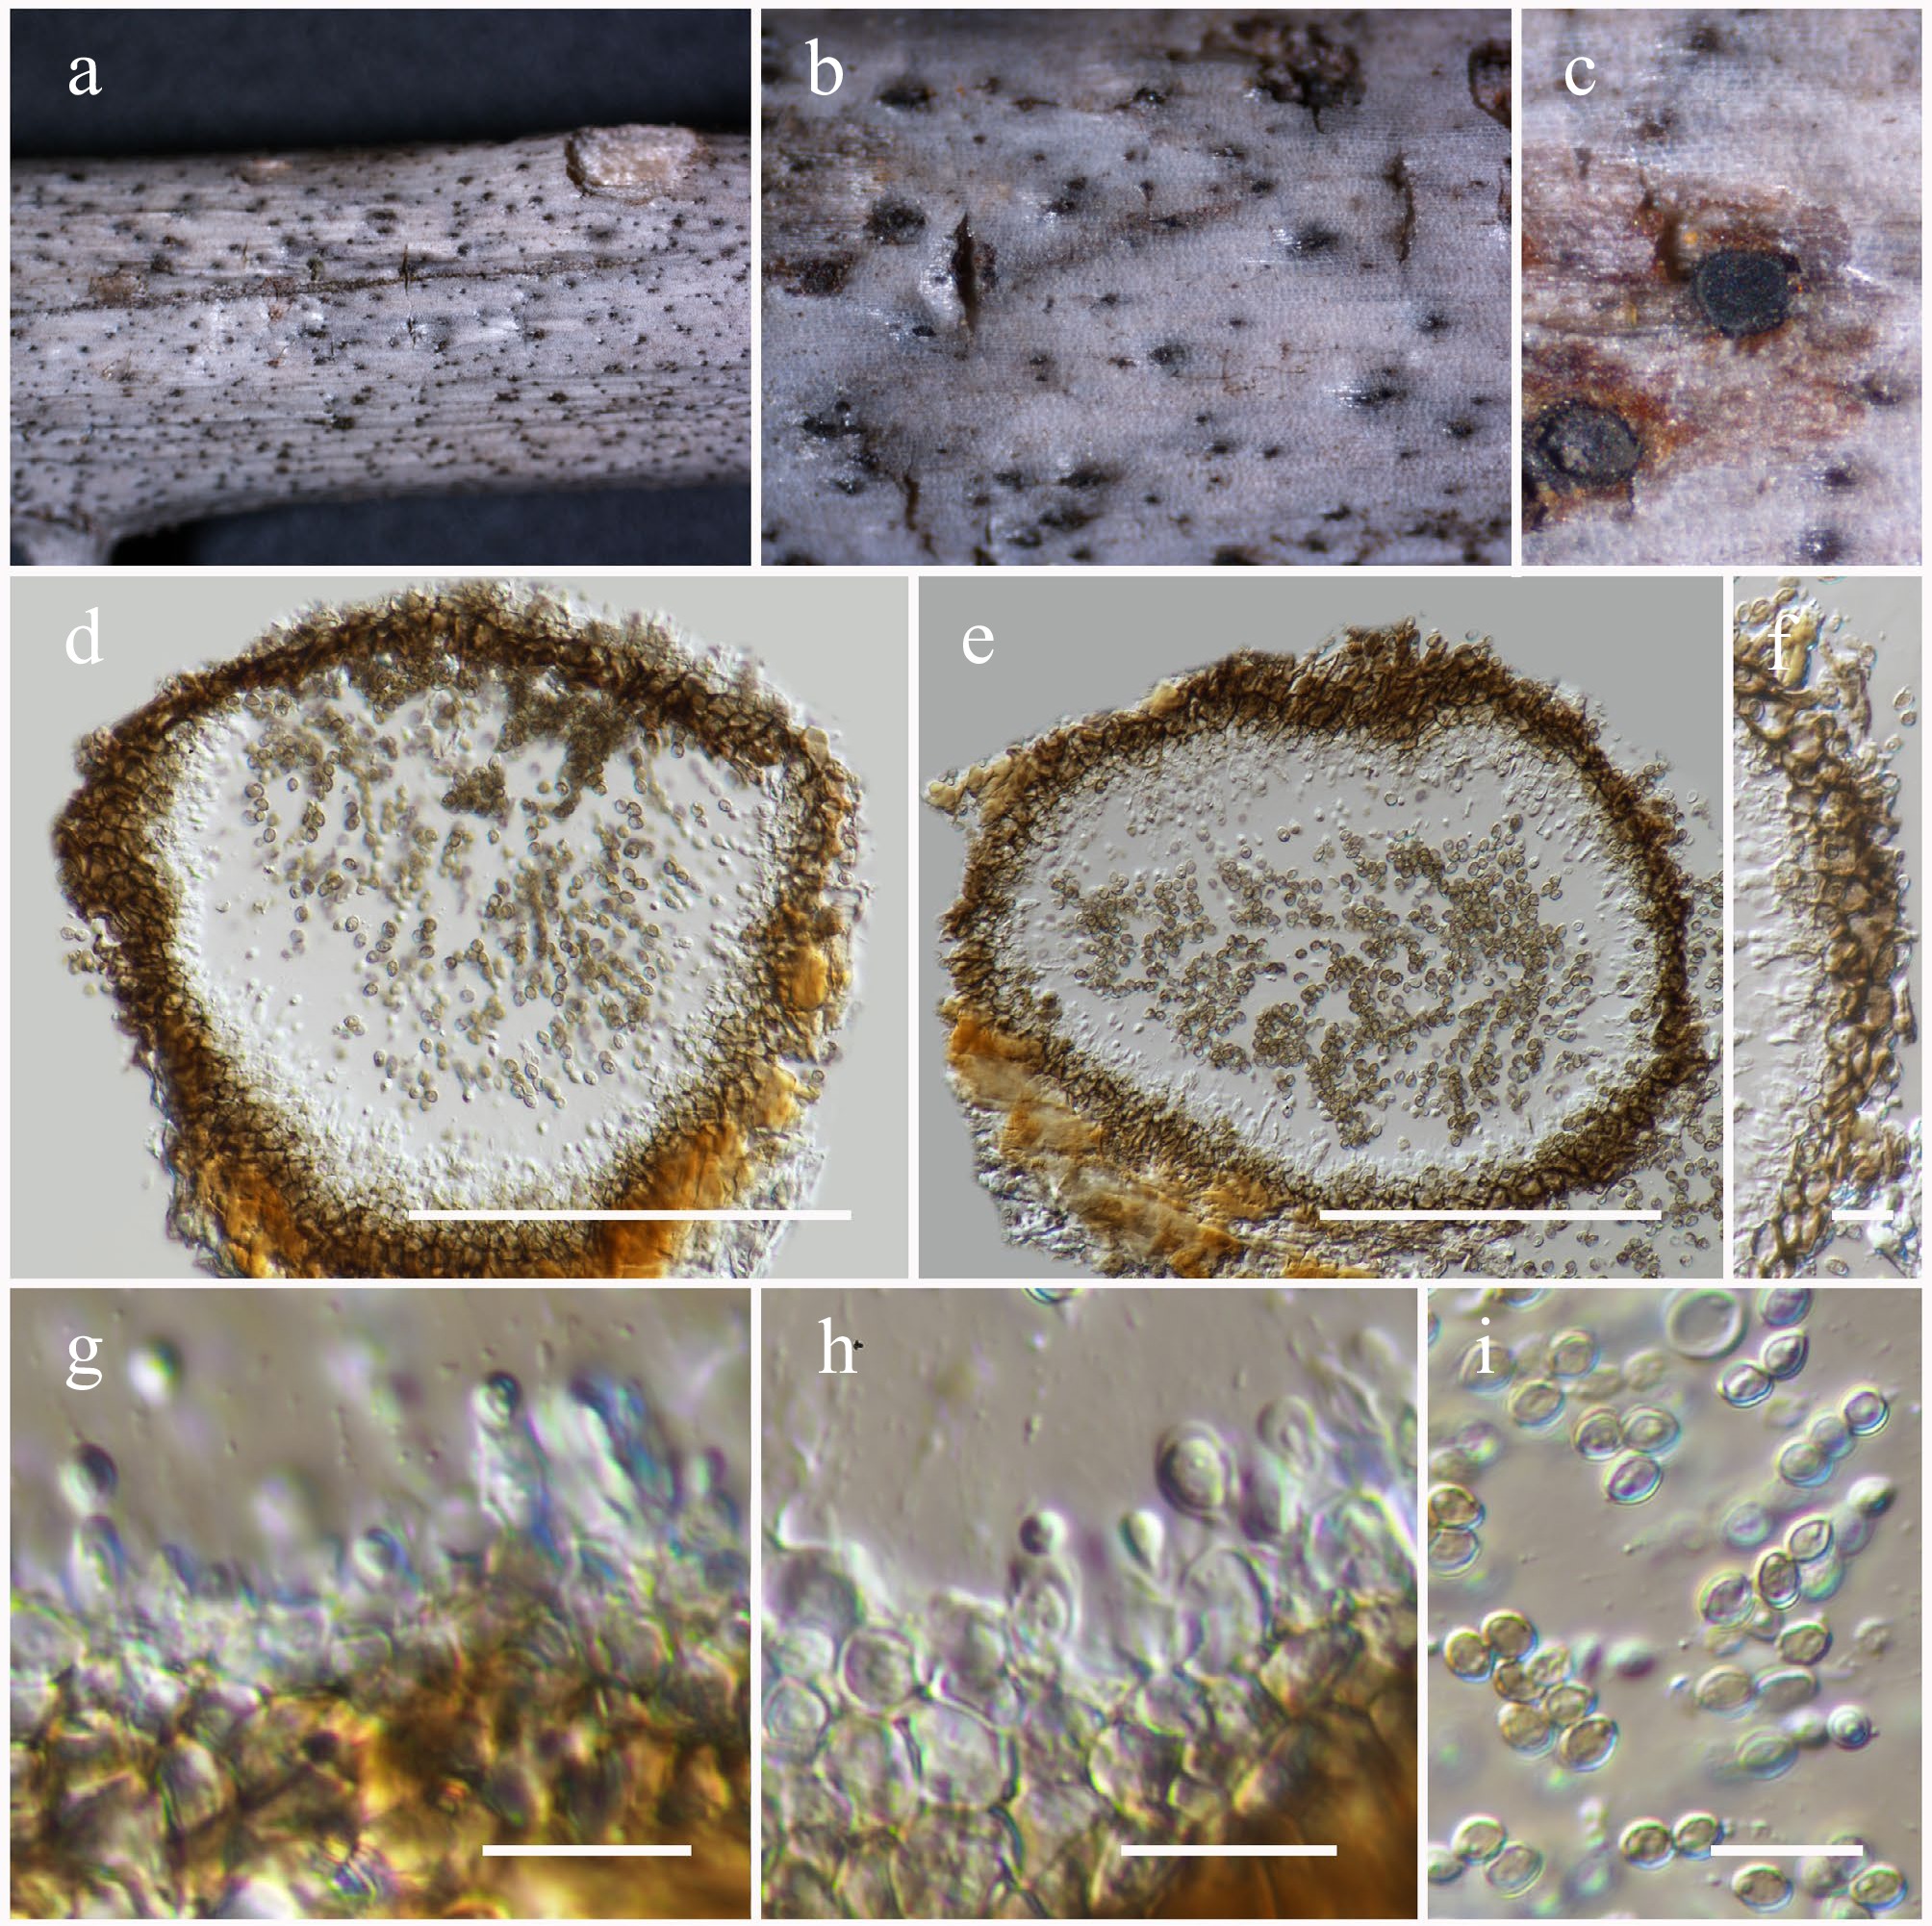
Figure 42.
Xenoroussoella triseptata (HKAS146065). (a)–(c) Conidiomata on host. (d), (e) Section of a conidioma. (f) Pycnidial wall. (g), (h) Conidiogenous cells. (i) Conidia. Scale bars: (d), (e) = 100 µm, (f)–(i) = 10 µm.
-
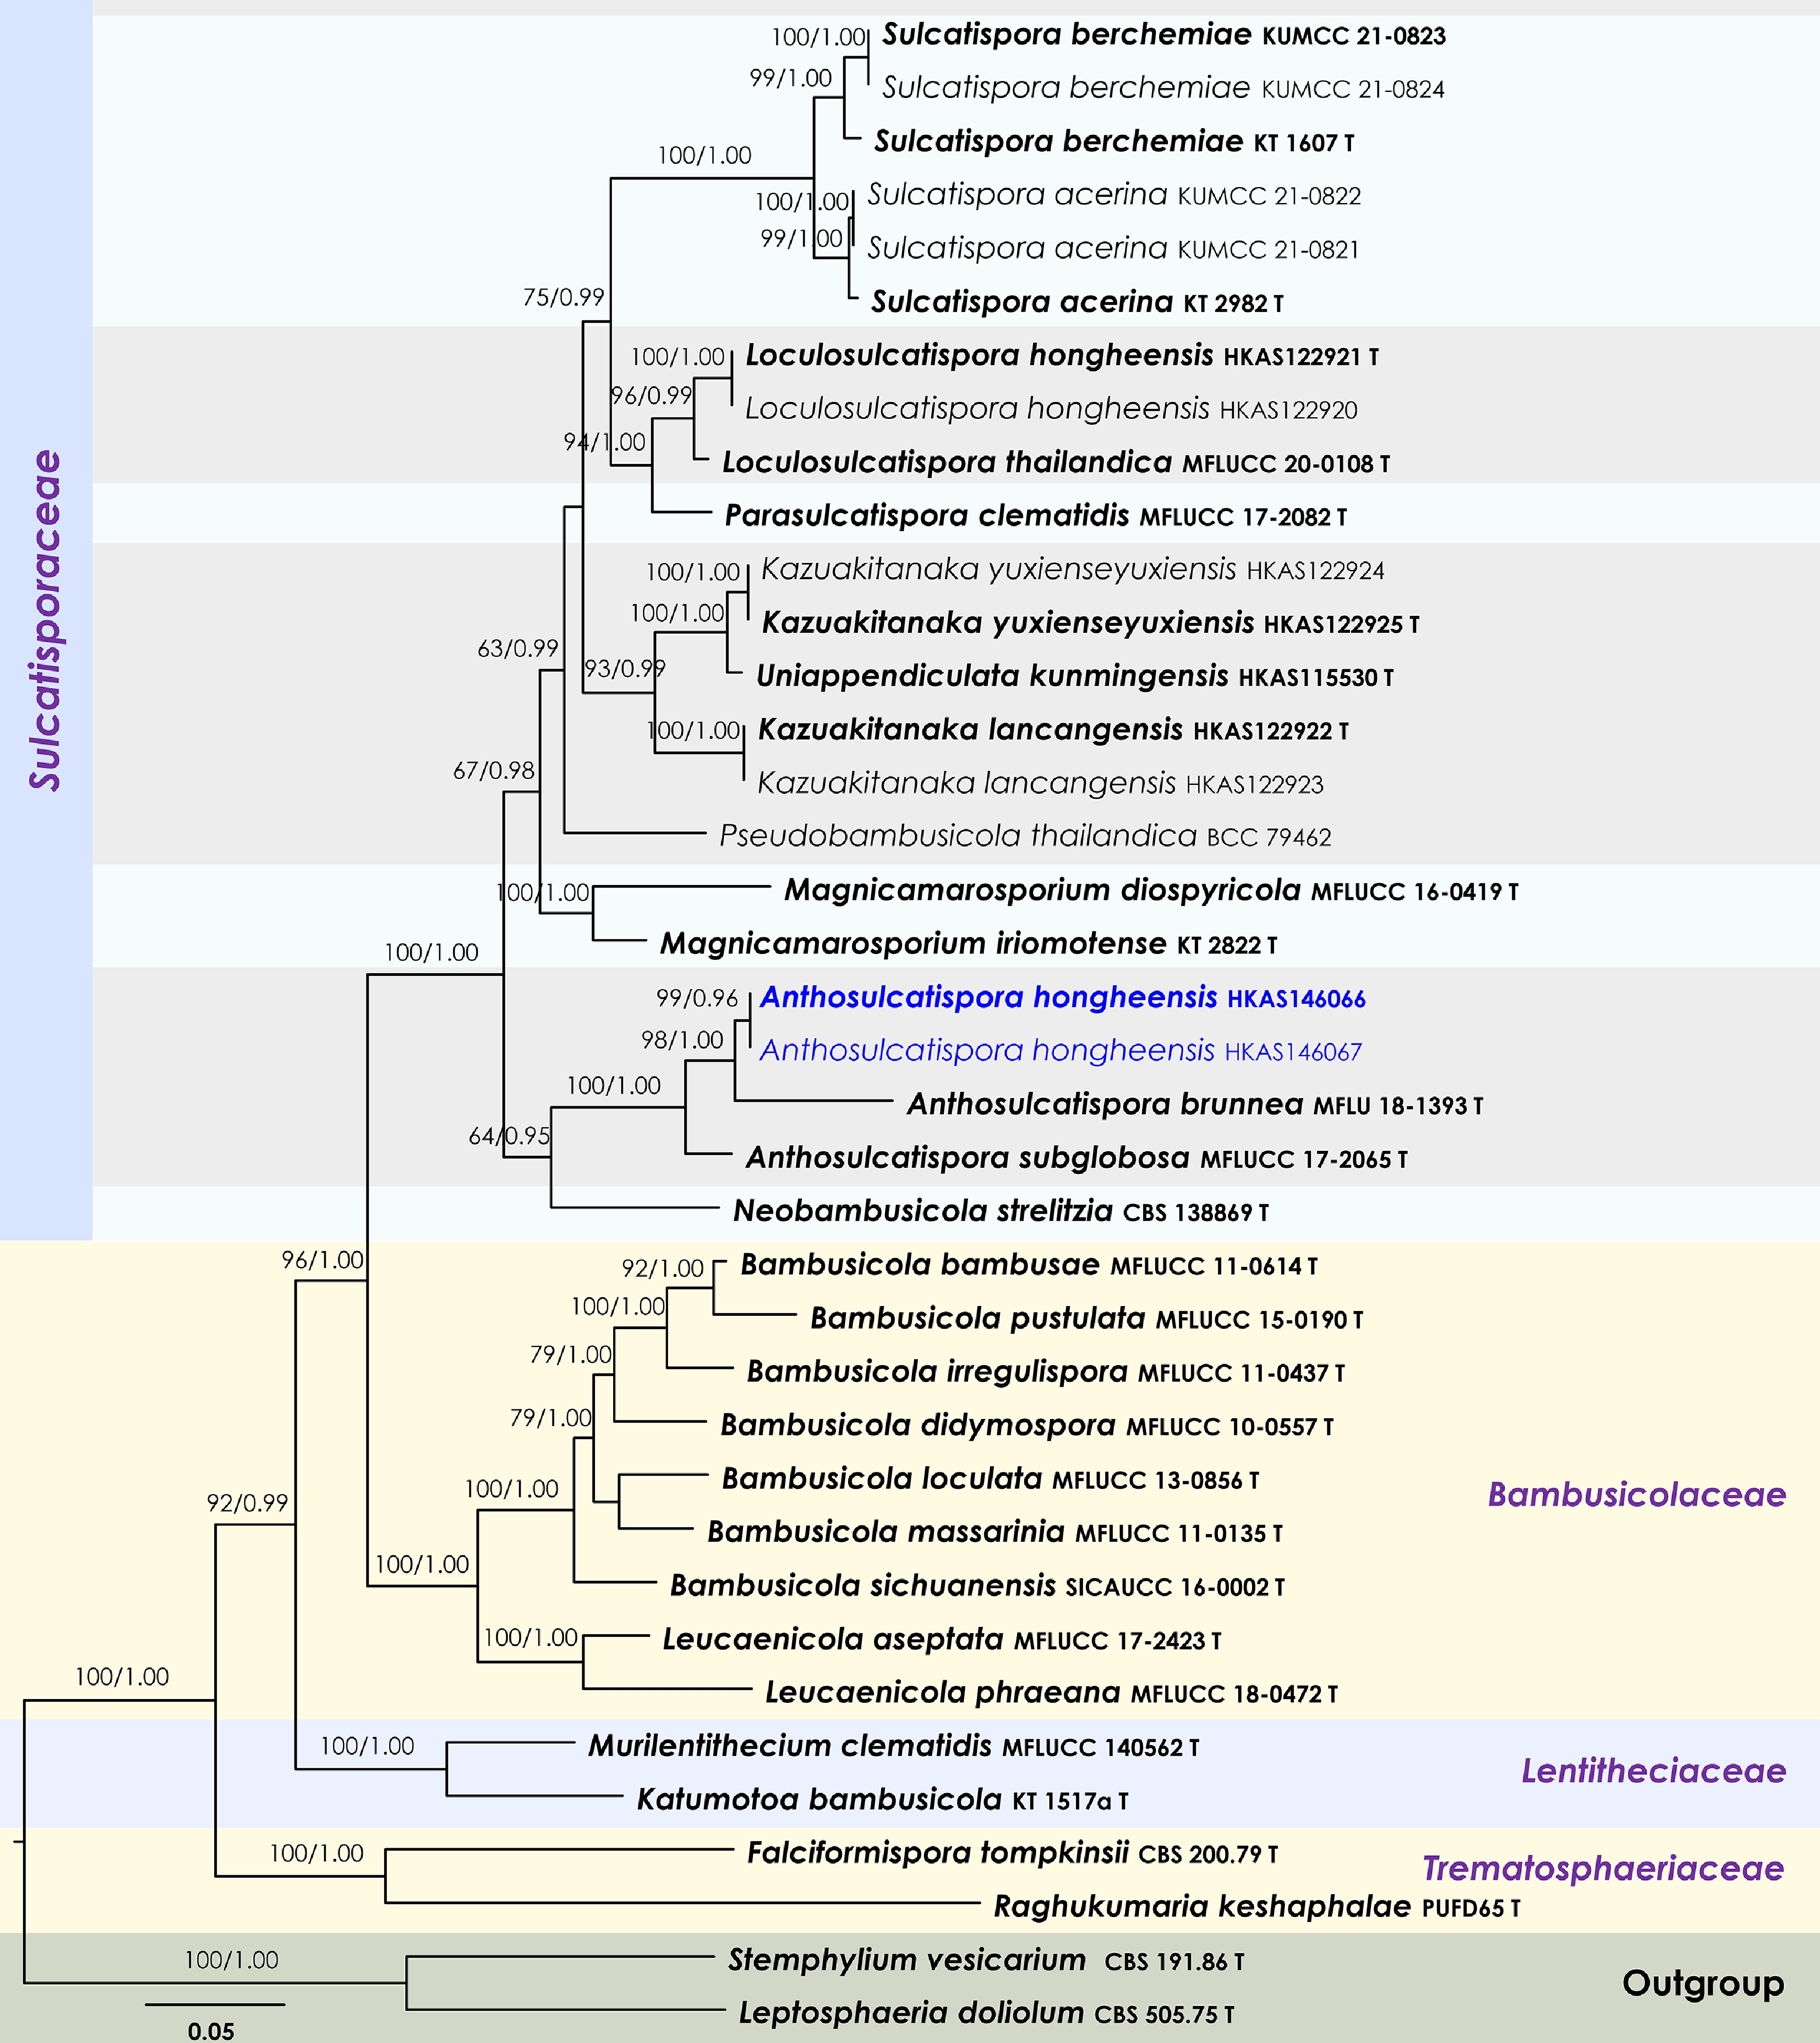
Figure 43.
Maximum Likelihood tree inferred from the concatenated dataset of partial SSU, LSU, ITS, tef1-α, and rpb2 sequences. The phylogeny is rooted with Leptosphaeria doliolum (CBS 505.75) and Stemphylium vesicarium (CBS 191.86). The final likelihood value is –29,929.948064. The final alignment included 1,836 unique site patterns, with approximately 21.67% of the positions comprising gaps or ambiguous characters. The estimated nucleotide frequencies were as follows: A = 0.239264, C = 0.259016, G = 0.269652, T = 0.232068. The substitution model yielded the following relative rates: AC = 1.148753, AG = 2.643315, AT = 1.114998, CG = 0.875753, CT = 6.054602, GT = 1.000000. The proportion of invariable sites (I) was estimated at 0.469606, and the gamma distribution shape parameter (α) was 0.537534. Bayesian inference reached convergence after 11,000 generations, when the average standard deviation of split frequencies dropped below 0.01 (observed value: 0.007950). A total of 111 trees were sampled, and 84 of these were retained for the final analysis after discarding the initial 25% as burn-in. The alignment also revealed 1,838 distinct informative sites. In the resulting phylograms, sequences generated in this study are highlighted in blue, while ex-type or type strains are indicated in boldface.
-
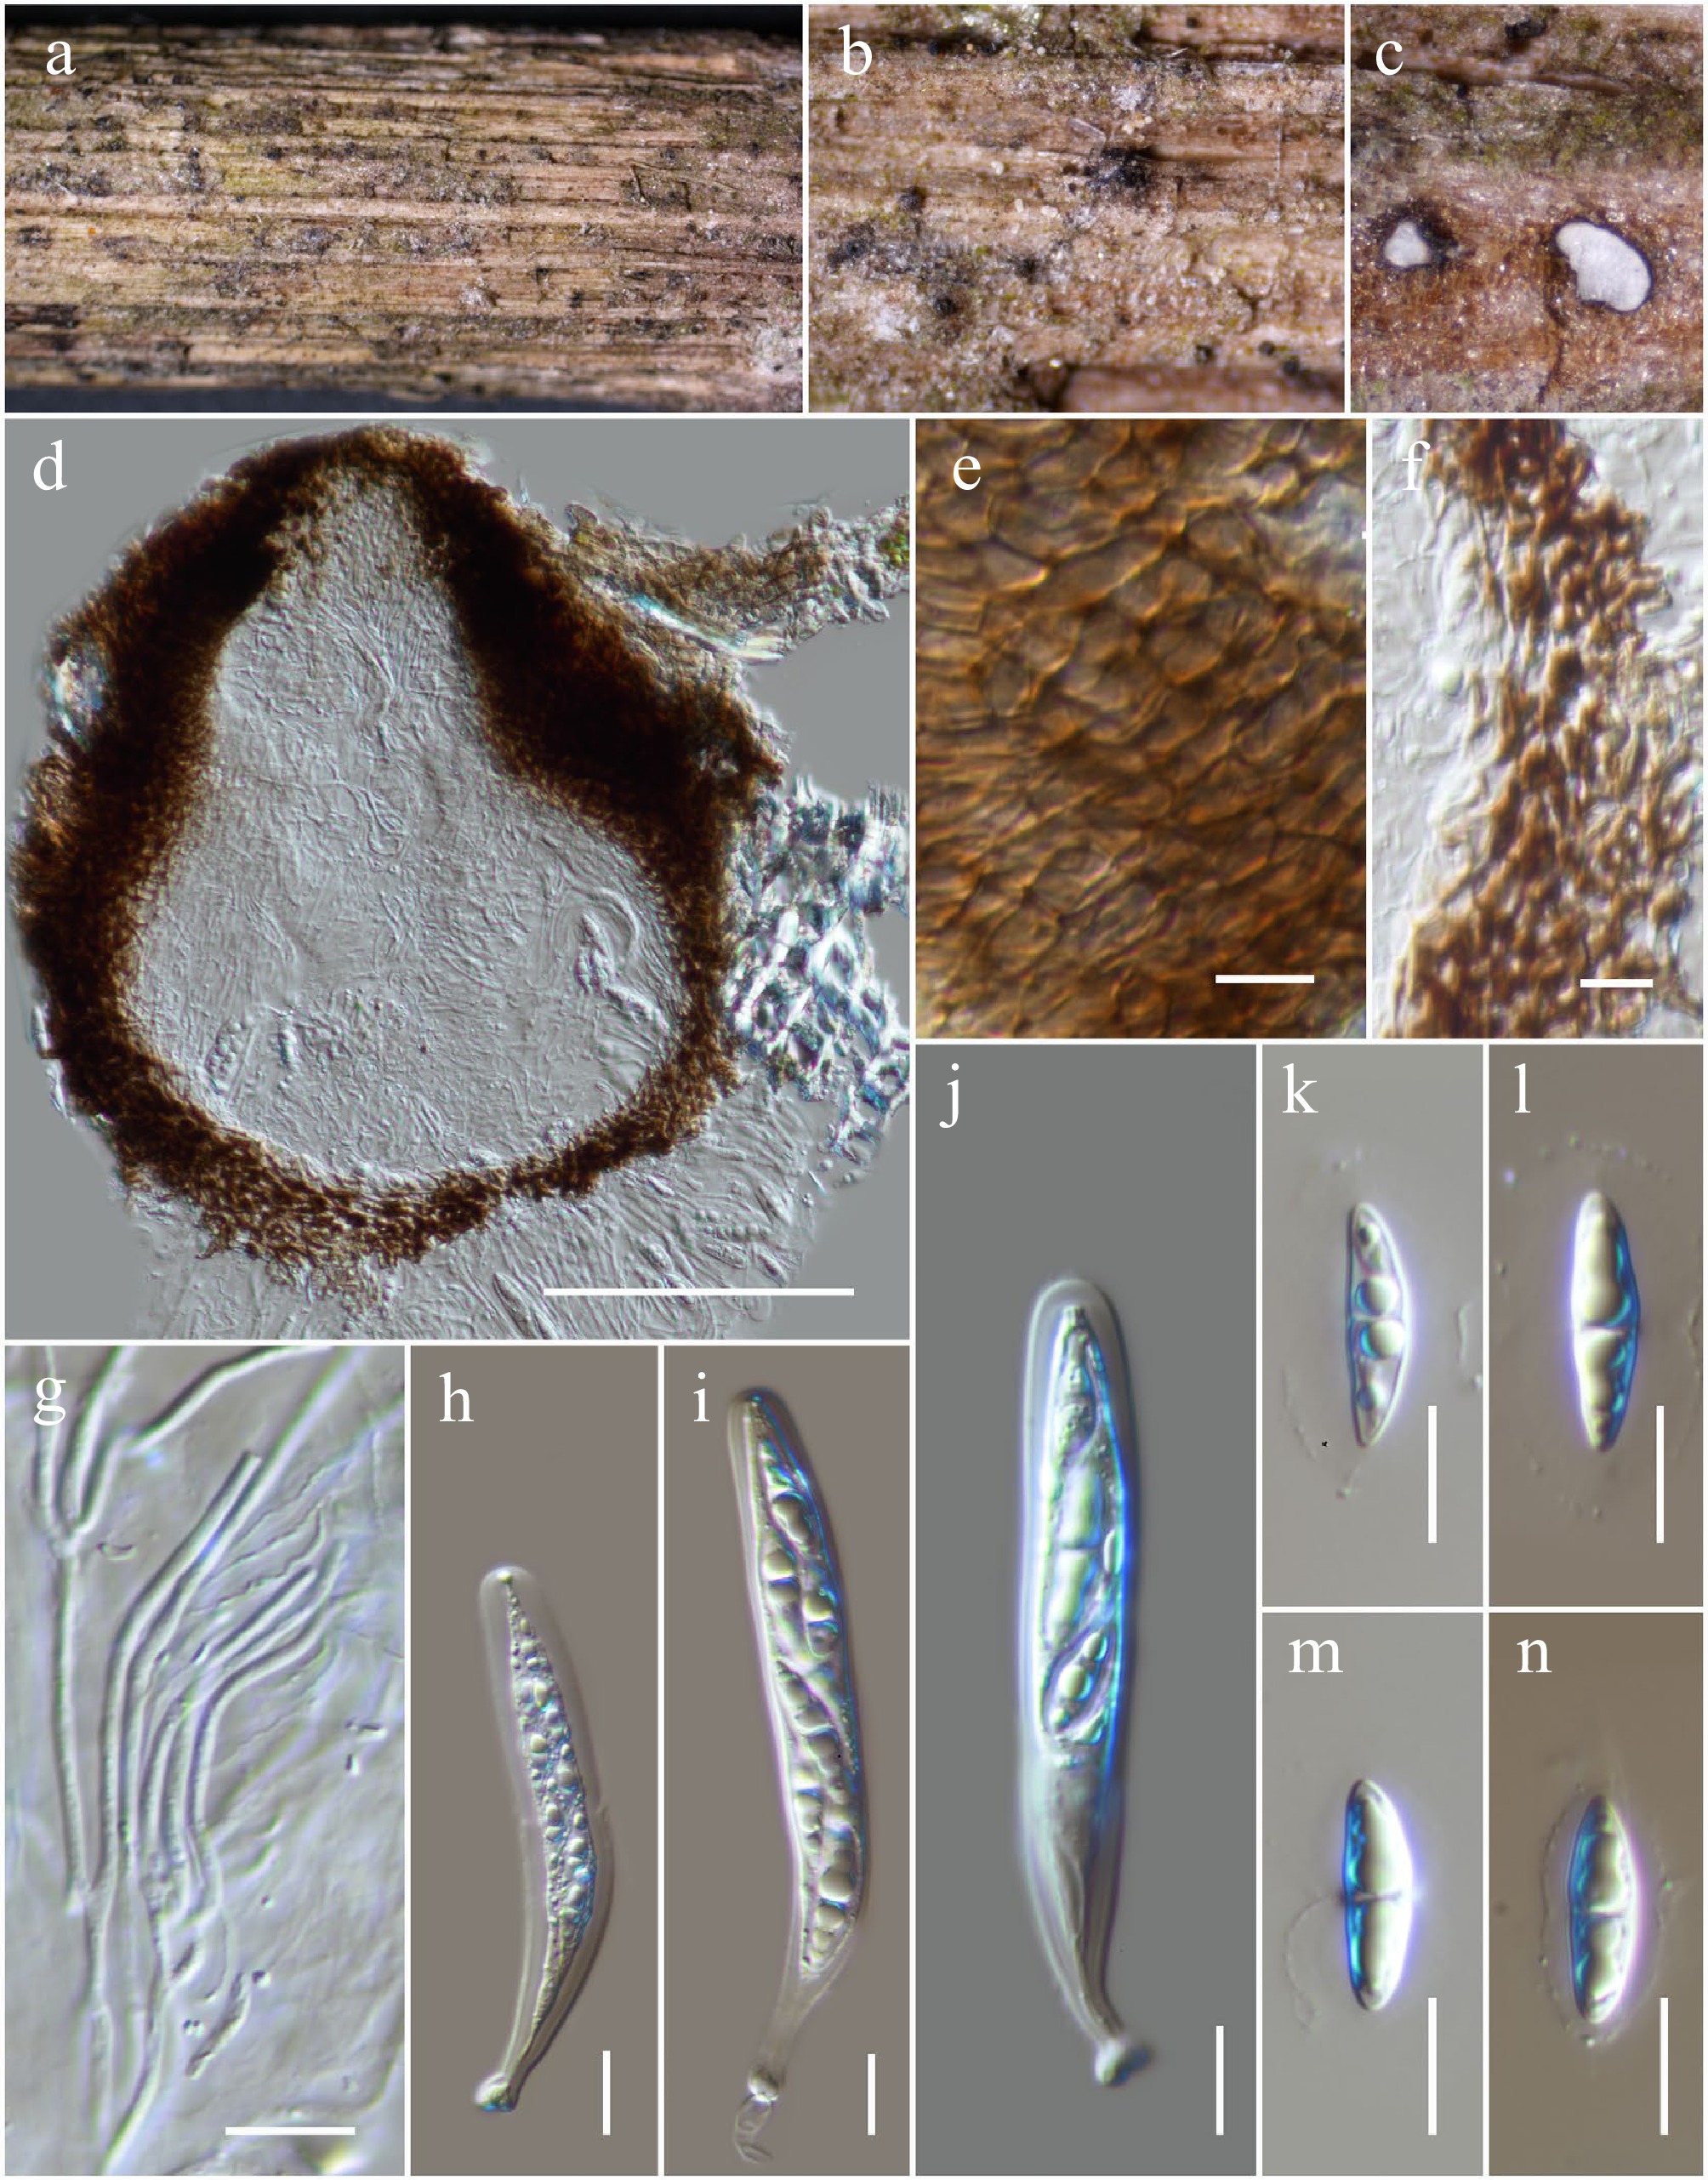
Figure 44.
Anthosulcatispora hongheensis (HKAS146066, holotype). (a)–(c) Ascomata on the dead woody twigs. (d) Cross-section of an ascoma. (e), (f) Peridium. (g) Pseudoparaphyses. (h)–(j) Asci. (k)–(n) Ascospores. Scale bars: (d) = 100 µm, (e)–(n) = 10 µm.
-
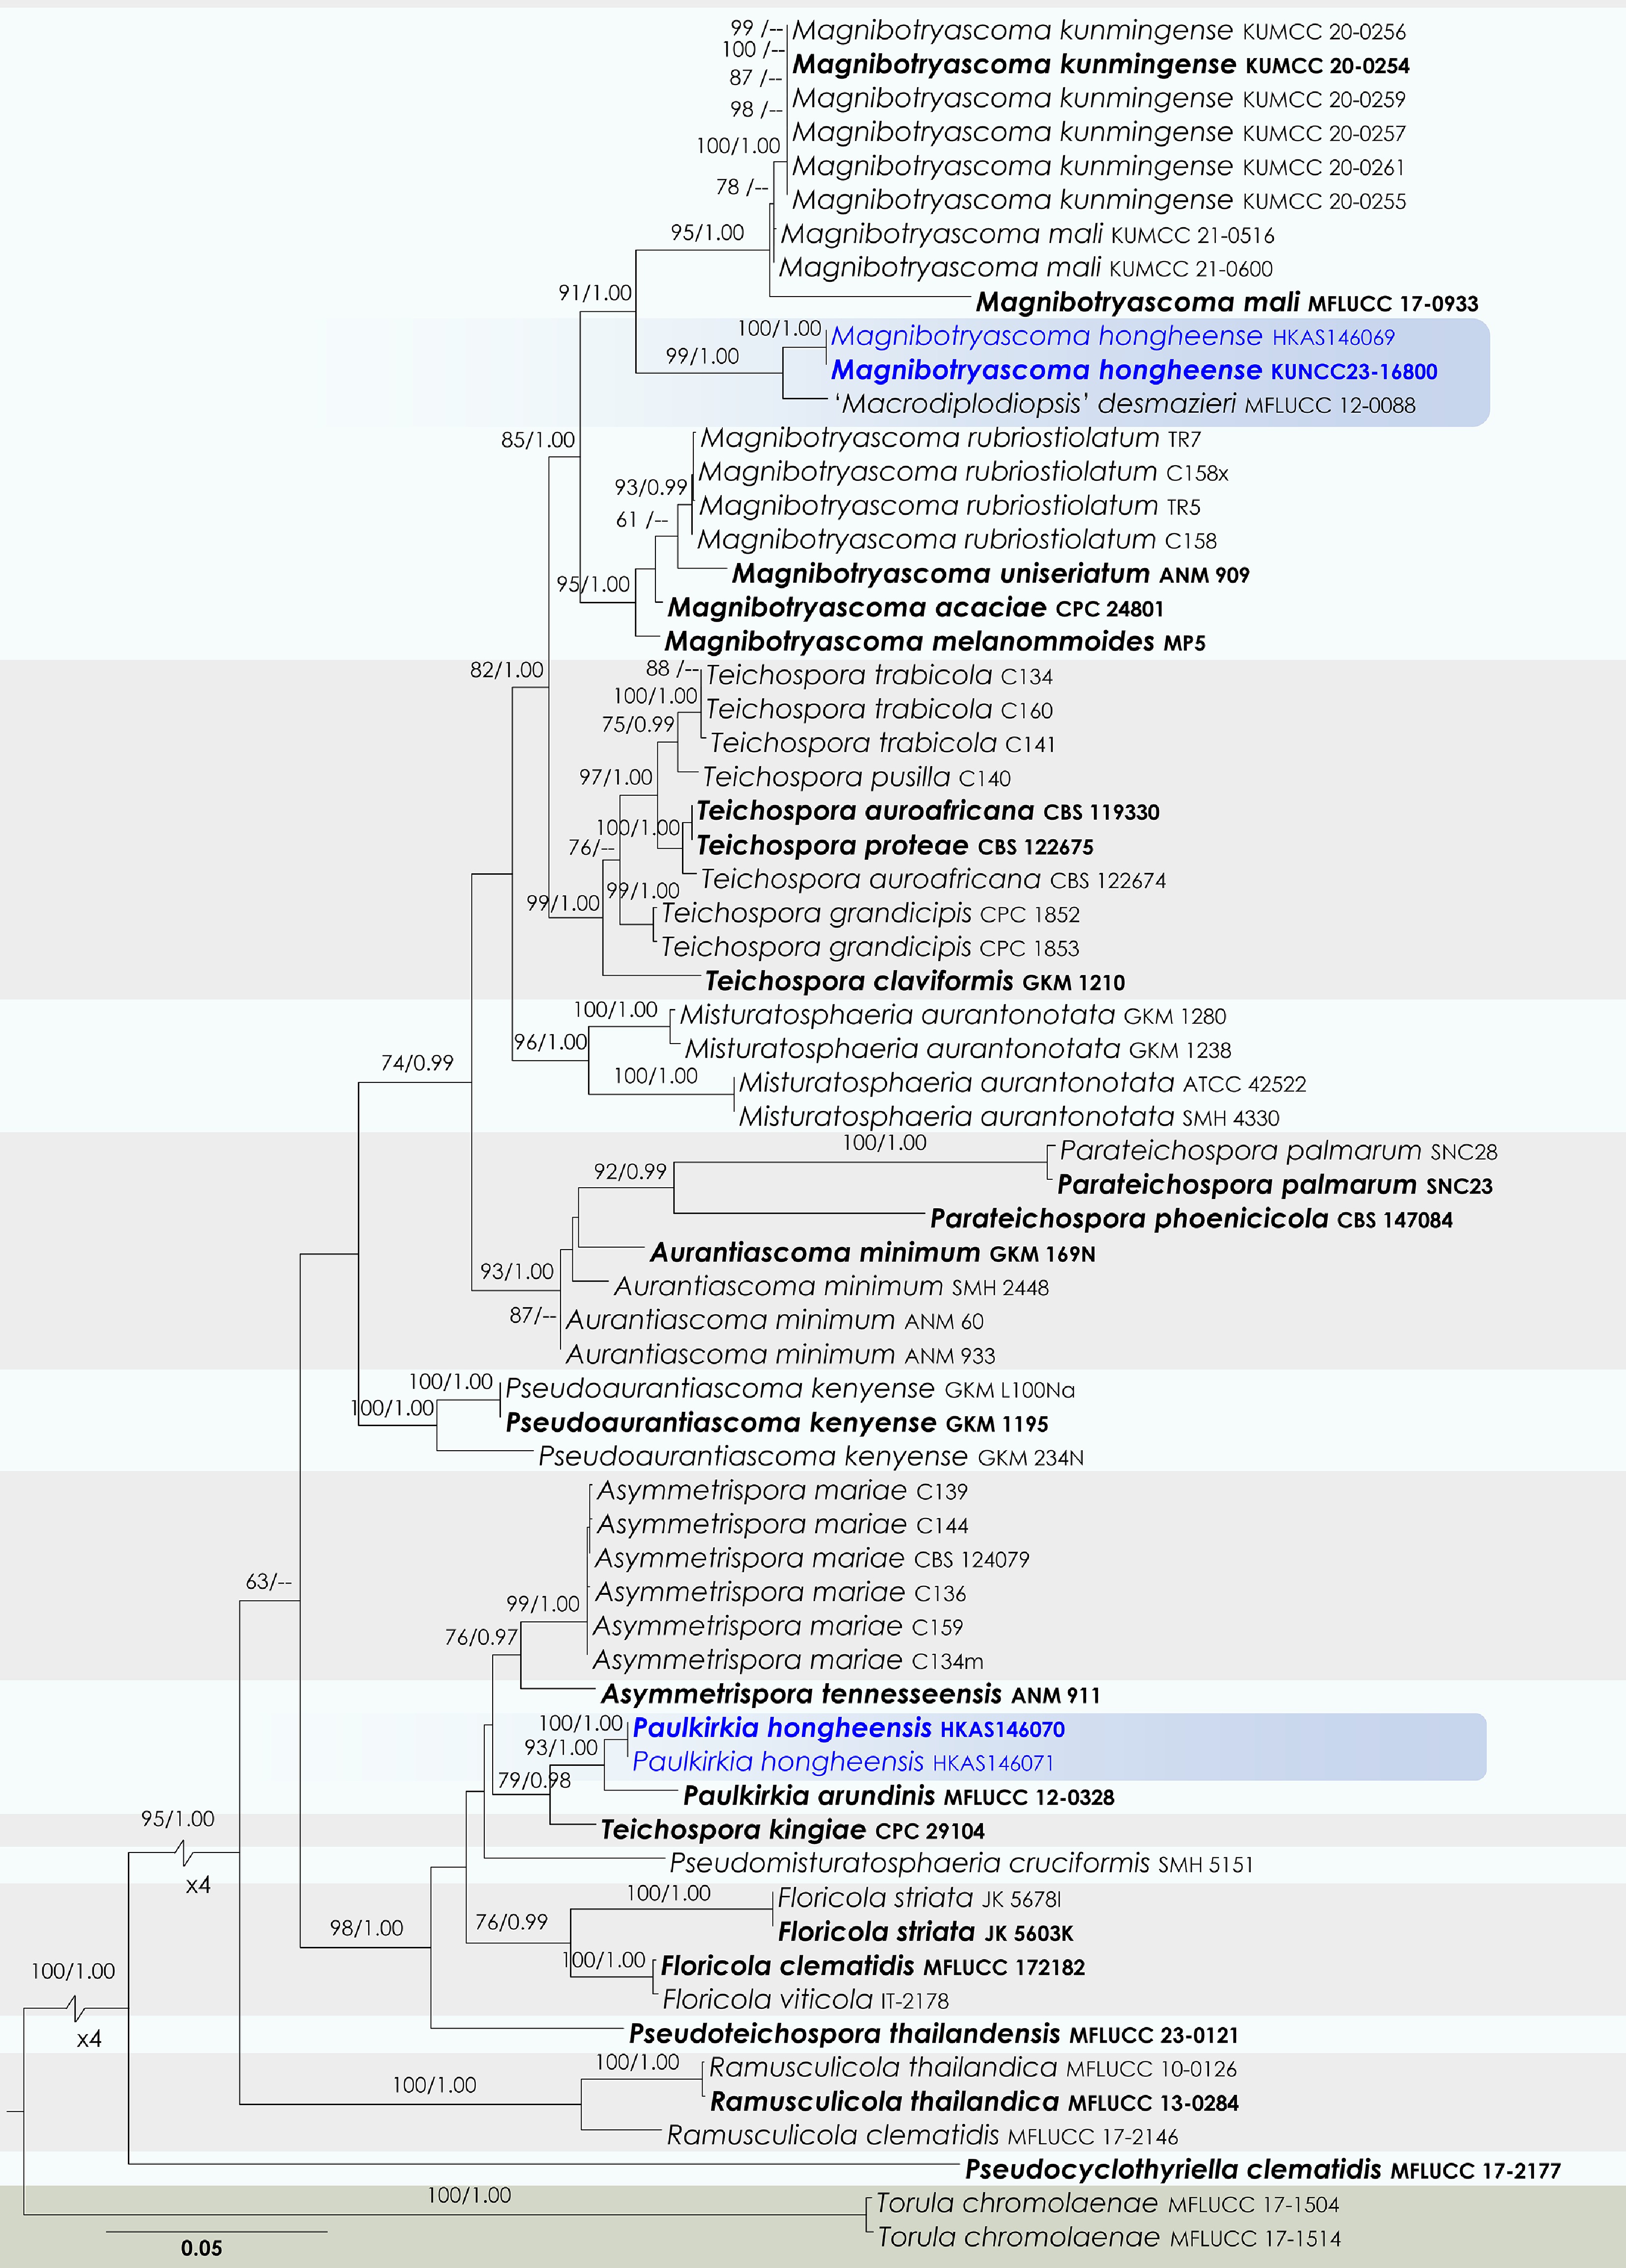
Figure 45.
Maximum Likelihood tree inferred from the concatenated dataset of partial SSU, LSU, ITS, tef1-α, and rpb2 sequences. The phylogeny is rooted with Torula chromolaenae (MFLUCC 17-1504, MFLUCC 17-1514). The final likelihood value is –21,213.763713. The final alignment included 1,467 unique site patterns, with approximately 43.11% of the positions comprising gaps or ambiguous characters. The estimated nucleotide frequencies were as follows: A = 0.243744, C = 0.254910, G = 0.276839, T = 0.224507. The substitution model yielded the following relative rates: AC = 1.338566, AG = 3.975920, AT = 1.726619, CG = 1.303434, CT = 9.924008, GT = 1.000000. The proportion of invariable sites (I) was estimated at 0.496561, and the gamma distribution shape parameter (α) was 0.466889. Bayesian inference reached convergence after 755,000 generations, when the average standard deviation of split frequencies dropped below 0.01 (observed value: 0.009983). A total of 7,551 trees were sampled, and 5,664 of these were retained for the final analysis after discarding the initial 25% as burn-in. The alignment also revealed 1,468 distinct informative sites. In the resulting phylograms, sequences generated in this study are highlighted in blue, while ex-type or type strains are indicated in boldface.
-
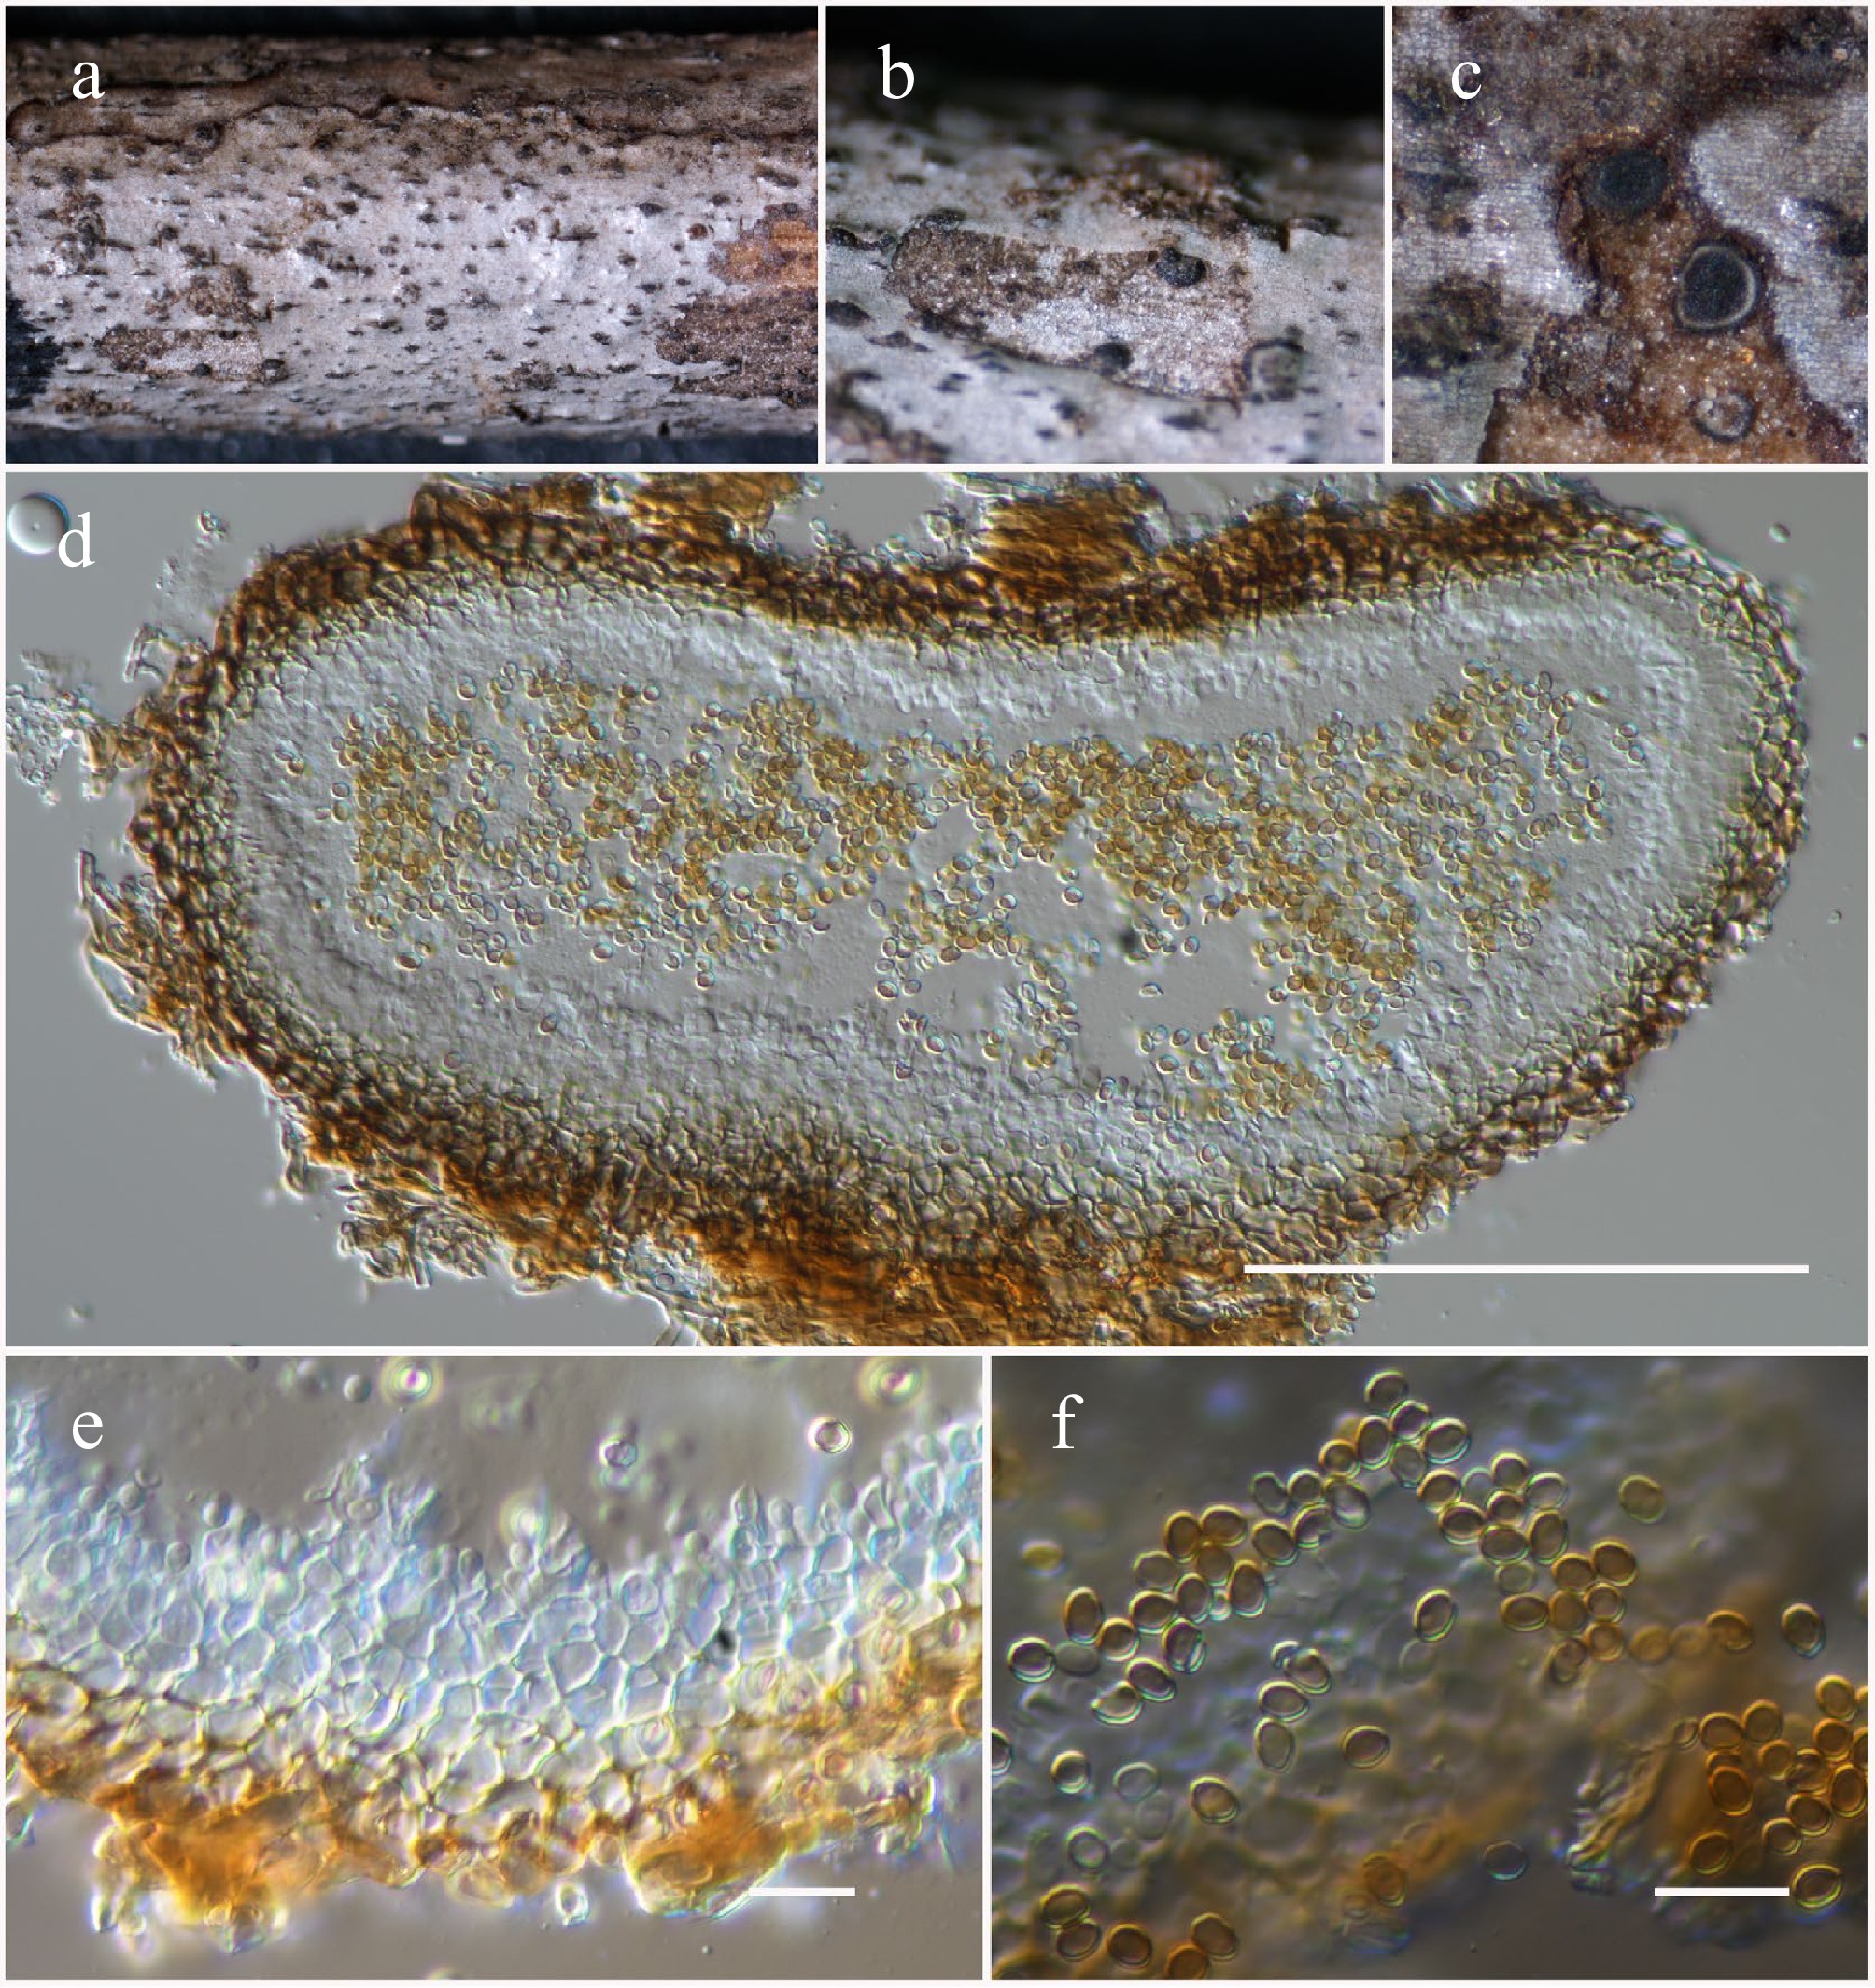
Figure 46.
Magnibotryascoma hongheense (HKAS146068, holotype). (a)–(c) Conidiomata on host. (d) Section of a conidioma. (e) Conidiogenous cells. (f) Conidia. Scale bars: (d) = 100 µm, (e), (f) = 10 µm.
-
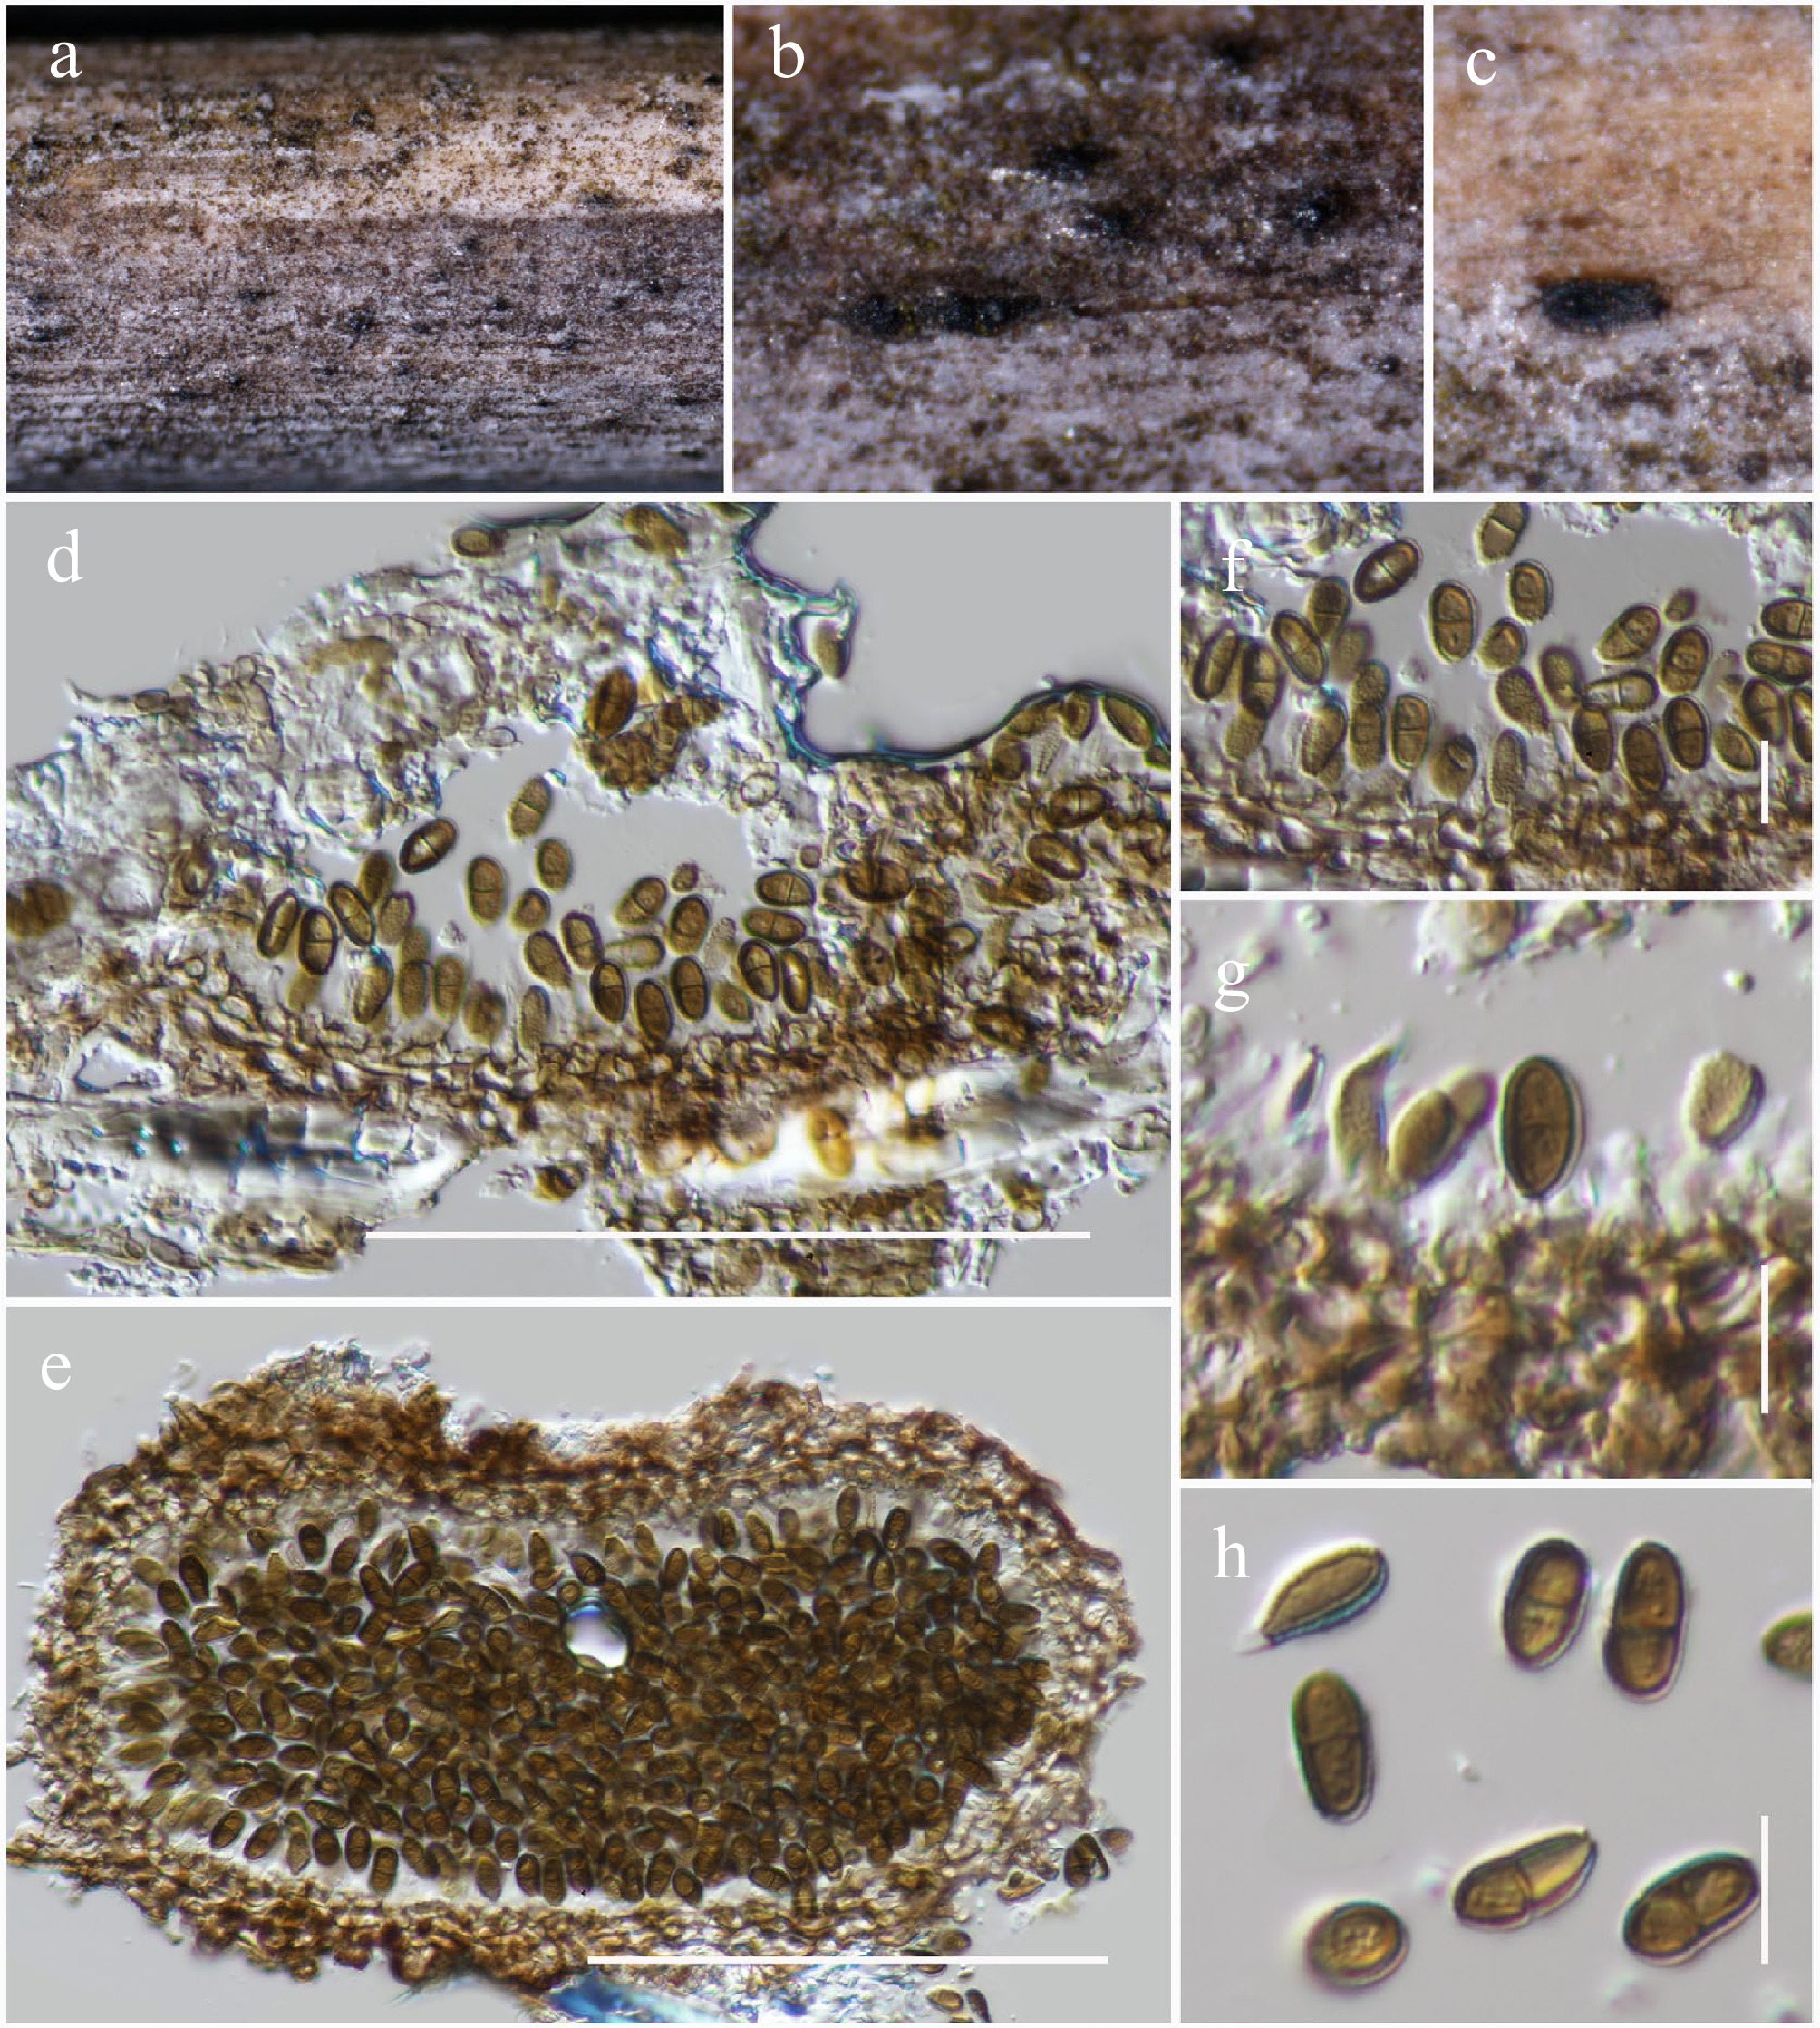
Figure 47.
Paulkirkia hongheensis (HKAS146070, holotype). (a)–(c) Conidiomata on host. (d) Vertical section of a conidioma. (e) Horizontal section of a conidioma. (f), (g) Conidiogenous cells. (h) Conidia. Scale bars: (d), (e) = 100 µm, (f)–(h) = 10 µm.
-
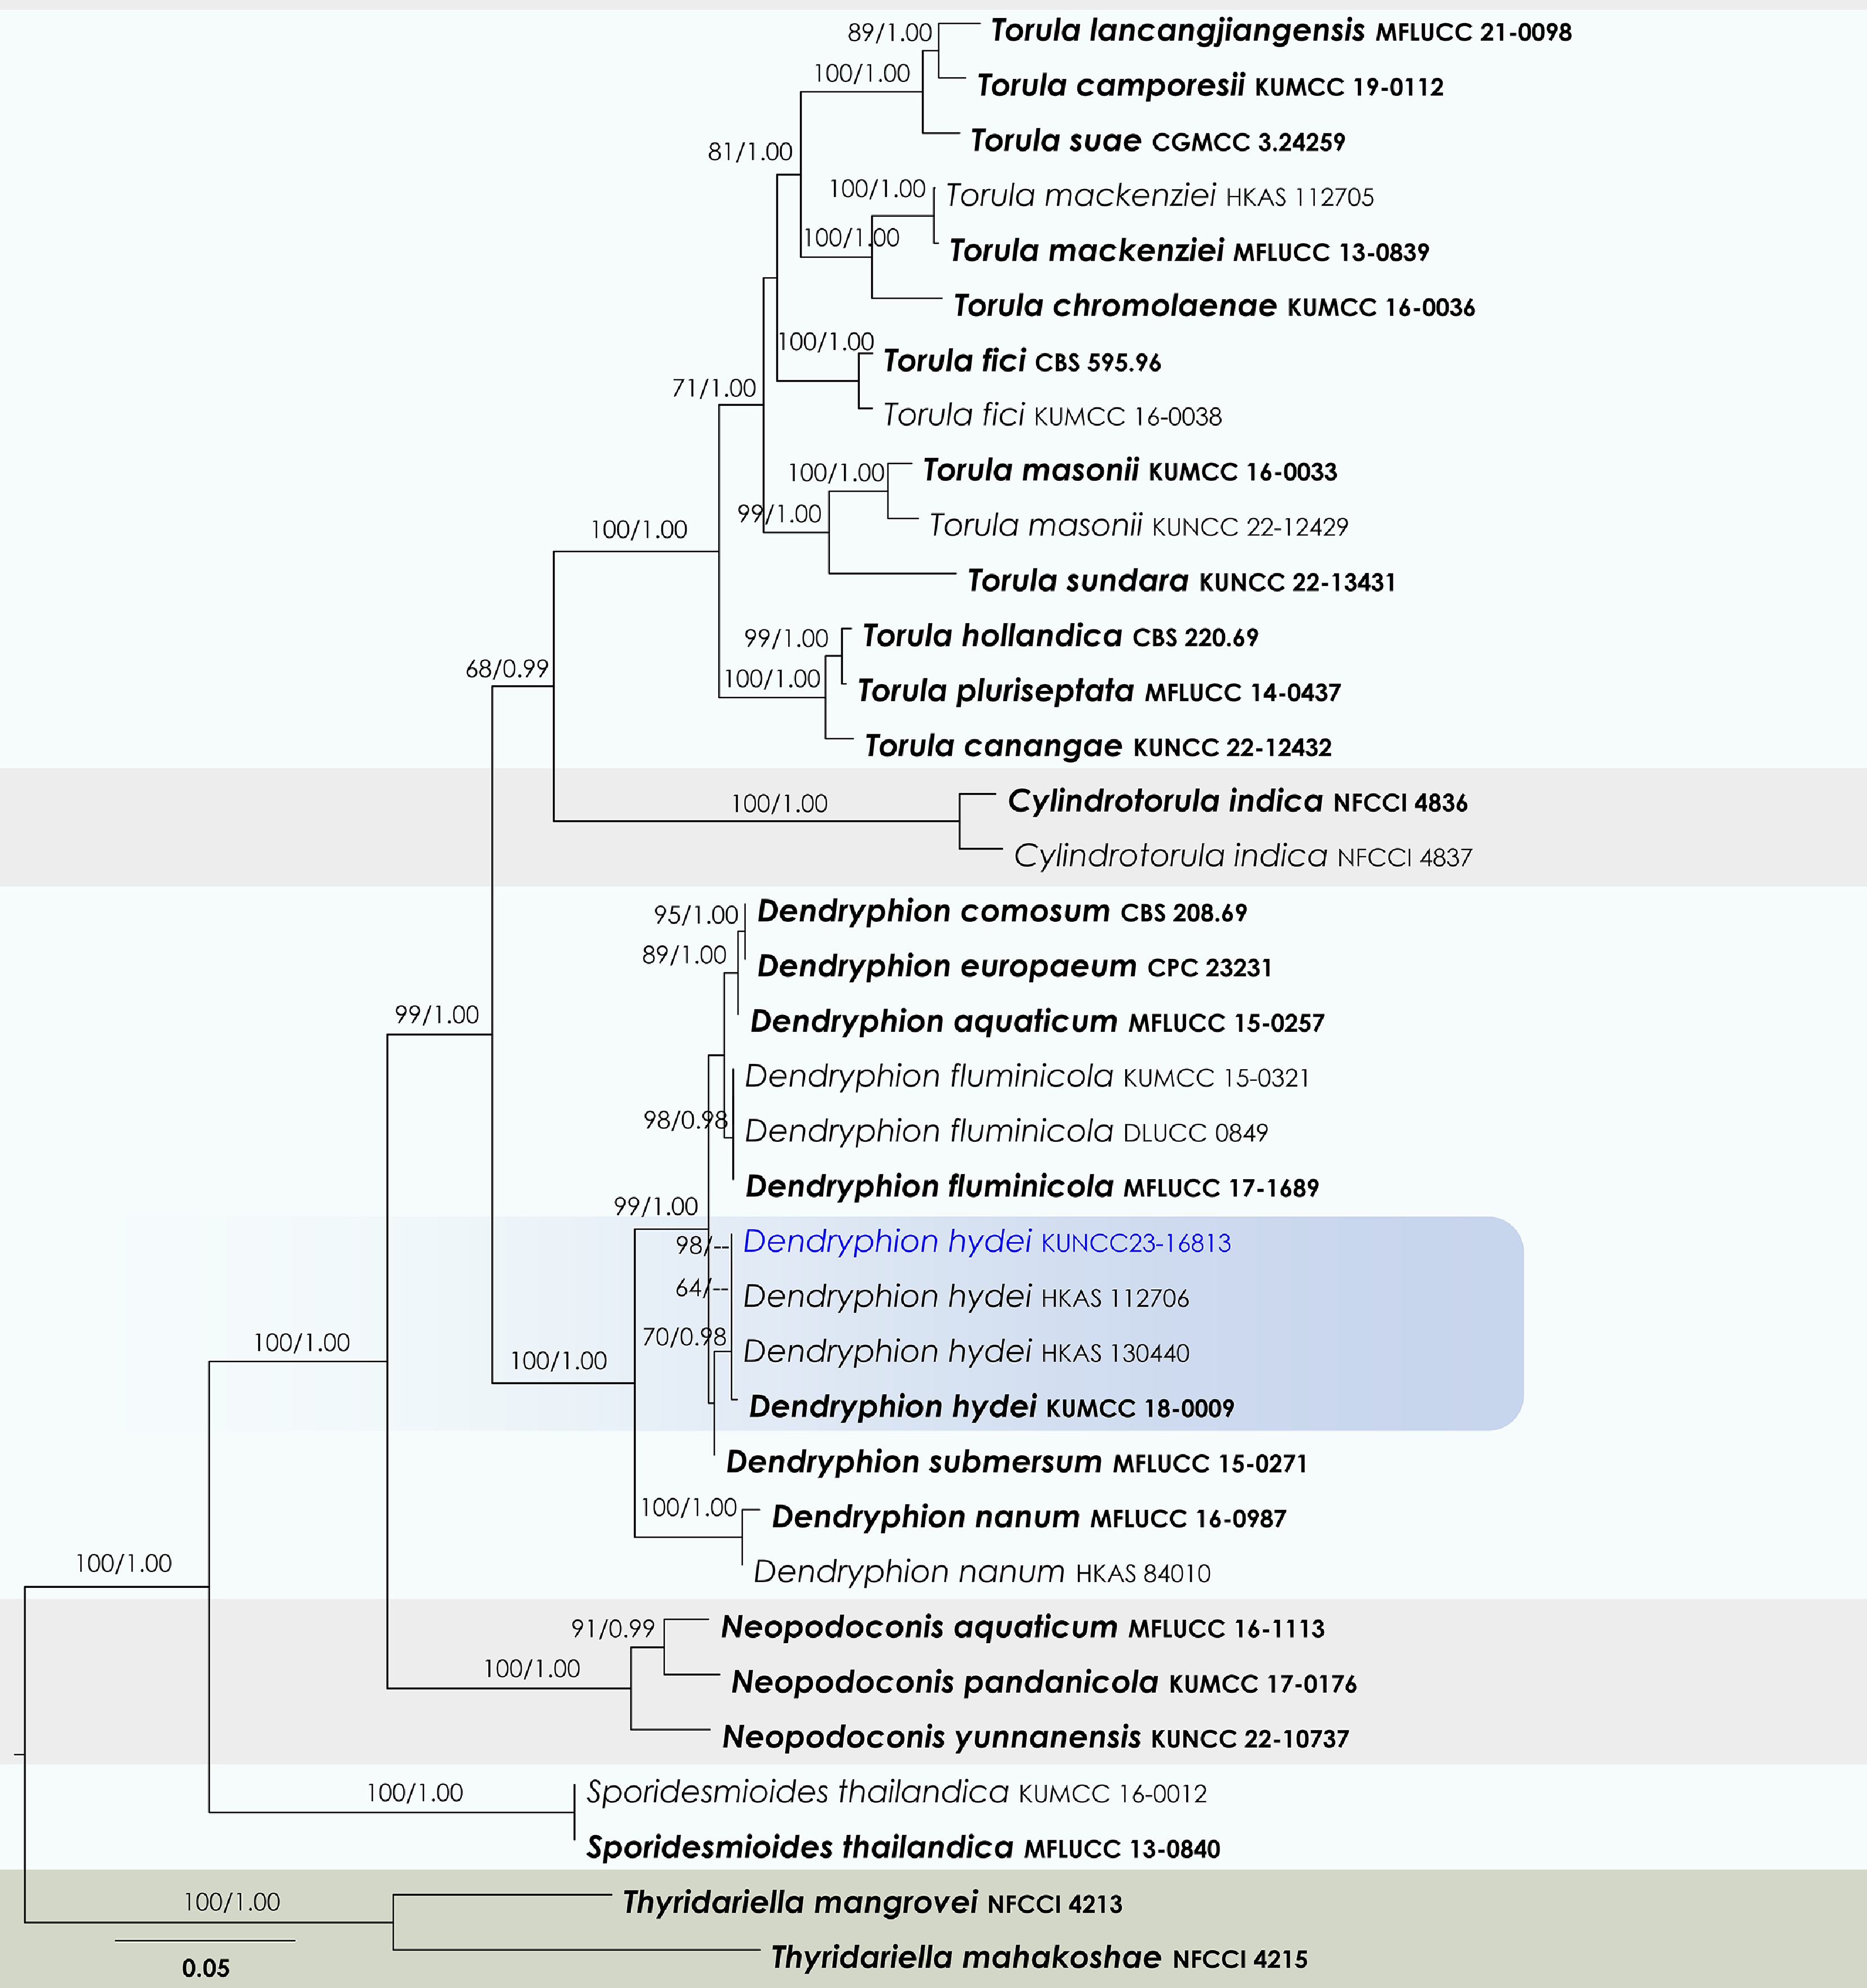
Figure 48.
Maximum Likelihood tree inferred from the concatenated dataset of partial SSU, LSU, ITS, tef1-α, and rpb2 sequences. The phylogeny is rooted with Thyridariella mangrovei (NFCCI 4213), and T. mahakoshae (NFCCI 4215). The final likelihood value is –20,543.293701. The final alignment included 1,363 unique site patterns, with approximately 22.3% of the positions comprising gaps or ambiguous characters. The estimated nucleotide frequencies were as follows: A = 0.245801, C = 0.261172, G = 0.268740, T = 0.224288. The substitution model yielded the following relative rates: AC = 1.969233, AG = 4.496613, AT = 1.690807, CG = 1.174737, CT = 9.891350 and GT = 1.000000. The proportion of invariable sites (I) was estimated at 0.574647, and the gamma distribution shape parameter (α) was 0.522487. Bayesian inference reached convergence after 183,000 generations, when the average standard deviation of split frequencies dropped below 0.01 (observed value: 0.009703). A total of 1,831 trees were sampled, and 1,374 of these were retained for the final analysis after discarding the initial 25% as burn-in. The alignment also revealed 1,364 distinct informative sites. In the resulting phylograms, sequences generated in this study are highlighted in blue, while ex-type or type strains are indicated in boldface.
-
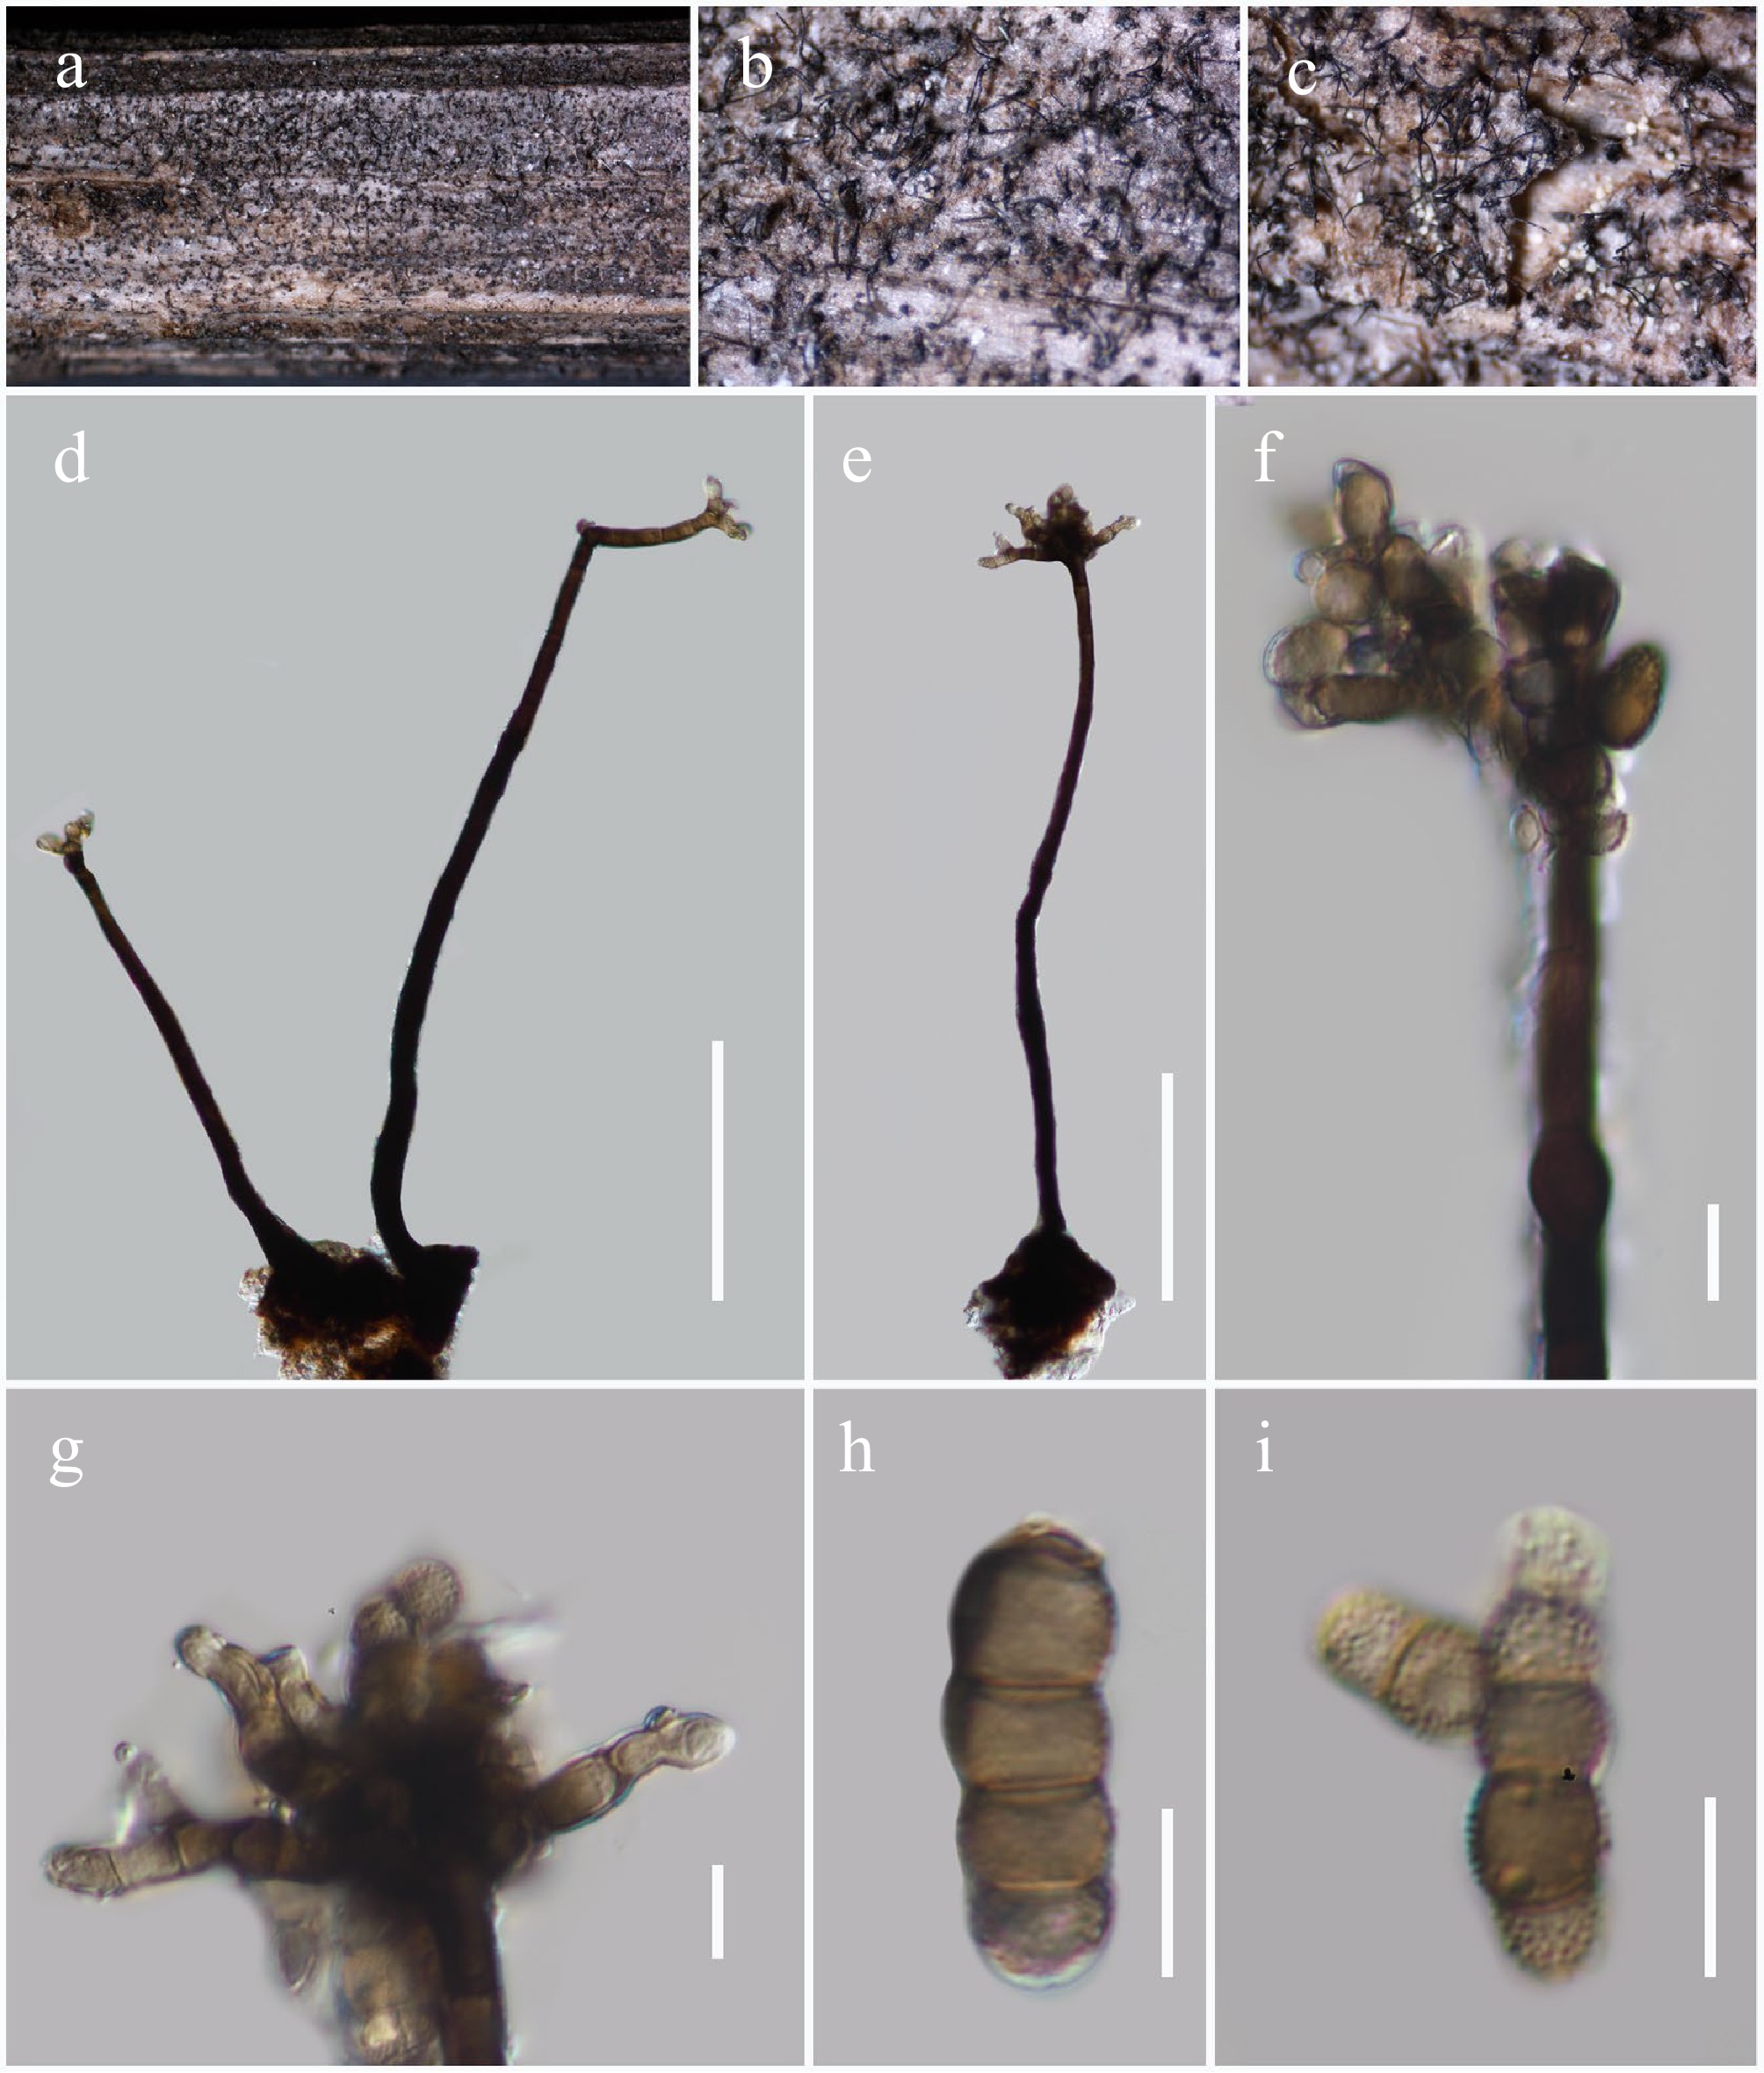
Figure 49.
Dendryphion hydei (HKAS146072). (a)–(c) Colonies on host. (d), (e) Conidiophores. (f), (g) Apex of conidiophores with conidial structures. (h), (i) Conidia. Scale bars: (d), (e) = 100 µm, (f)–(i) = 10 µm.
Figures
(49)
Tables
(0)