-
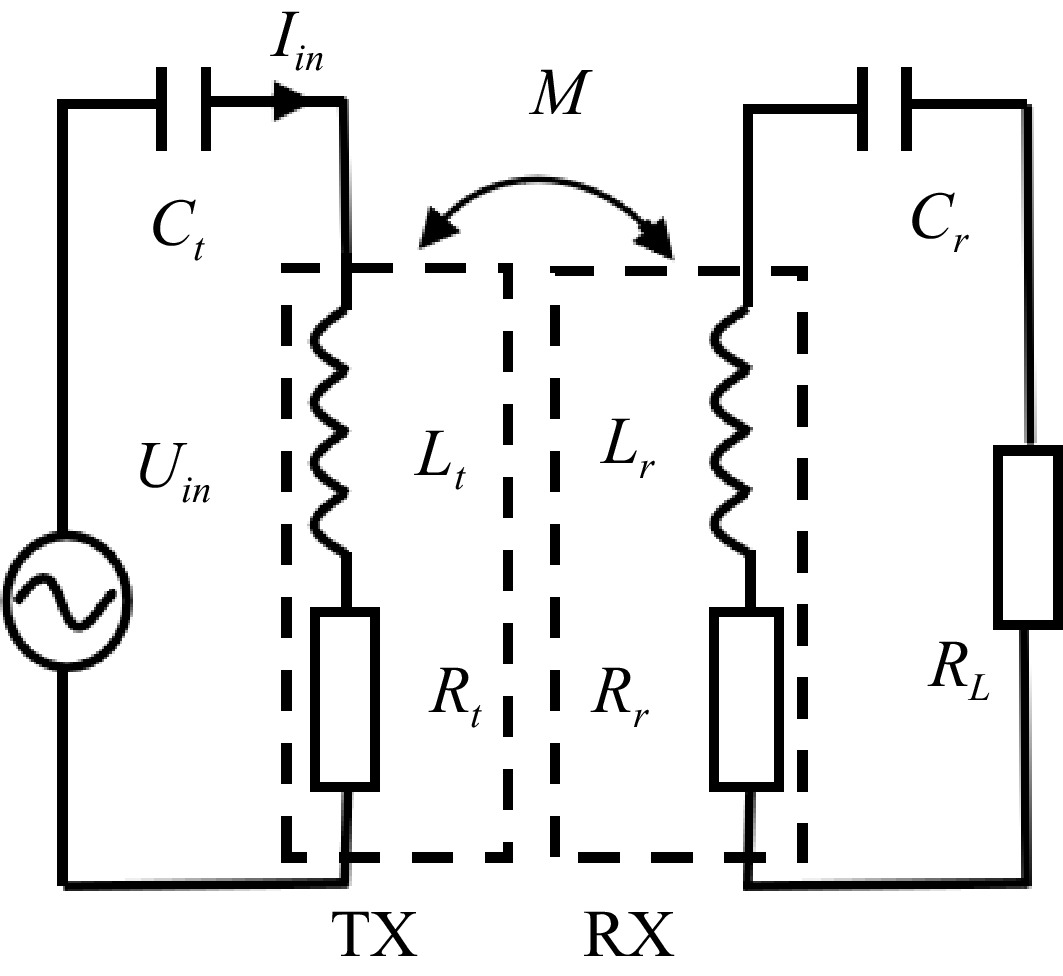
Figure 1.
Equivalent circuit diagram of S-S compensated coil system.
-
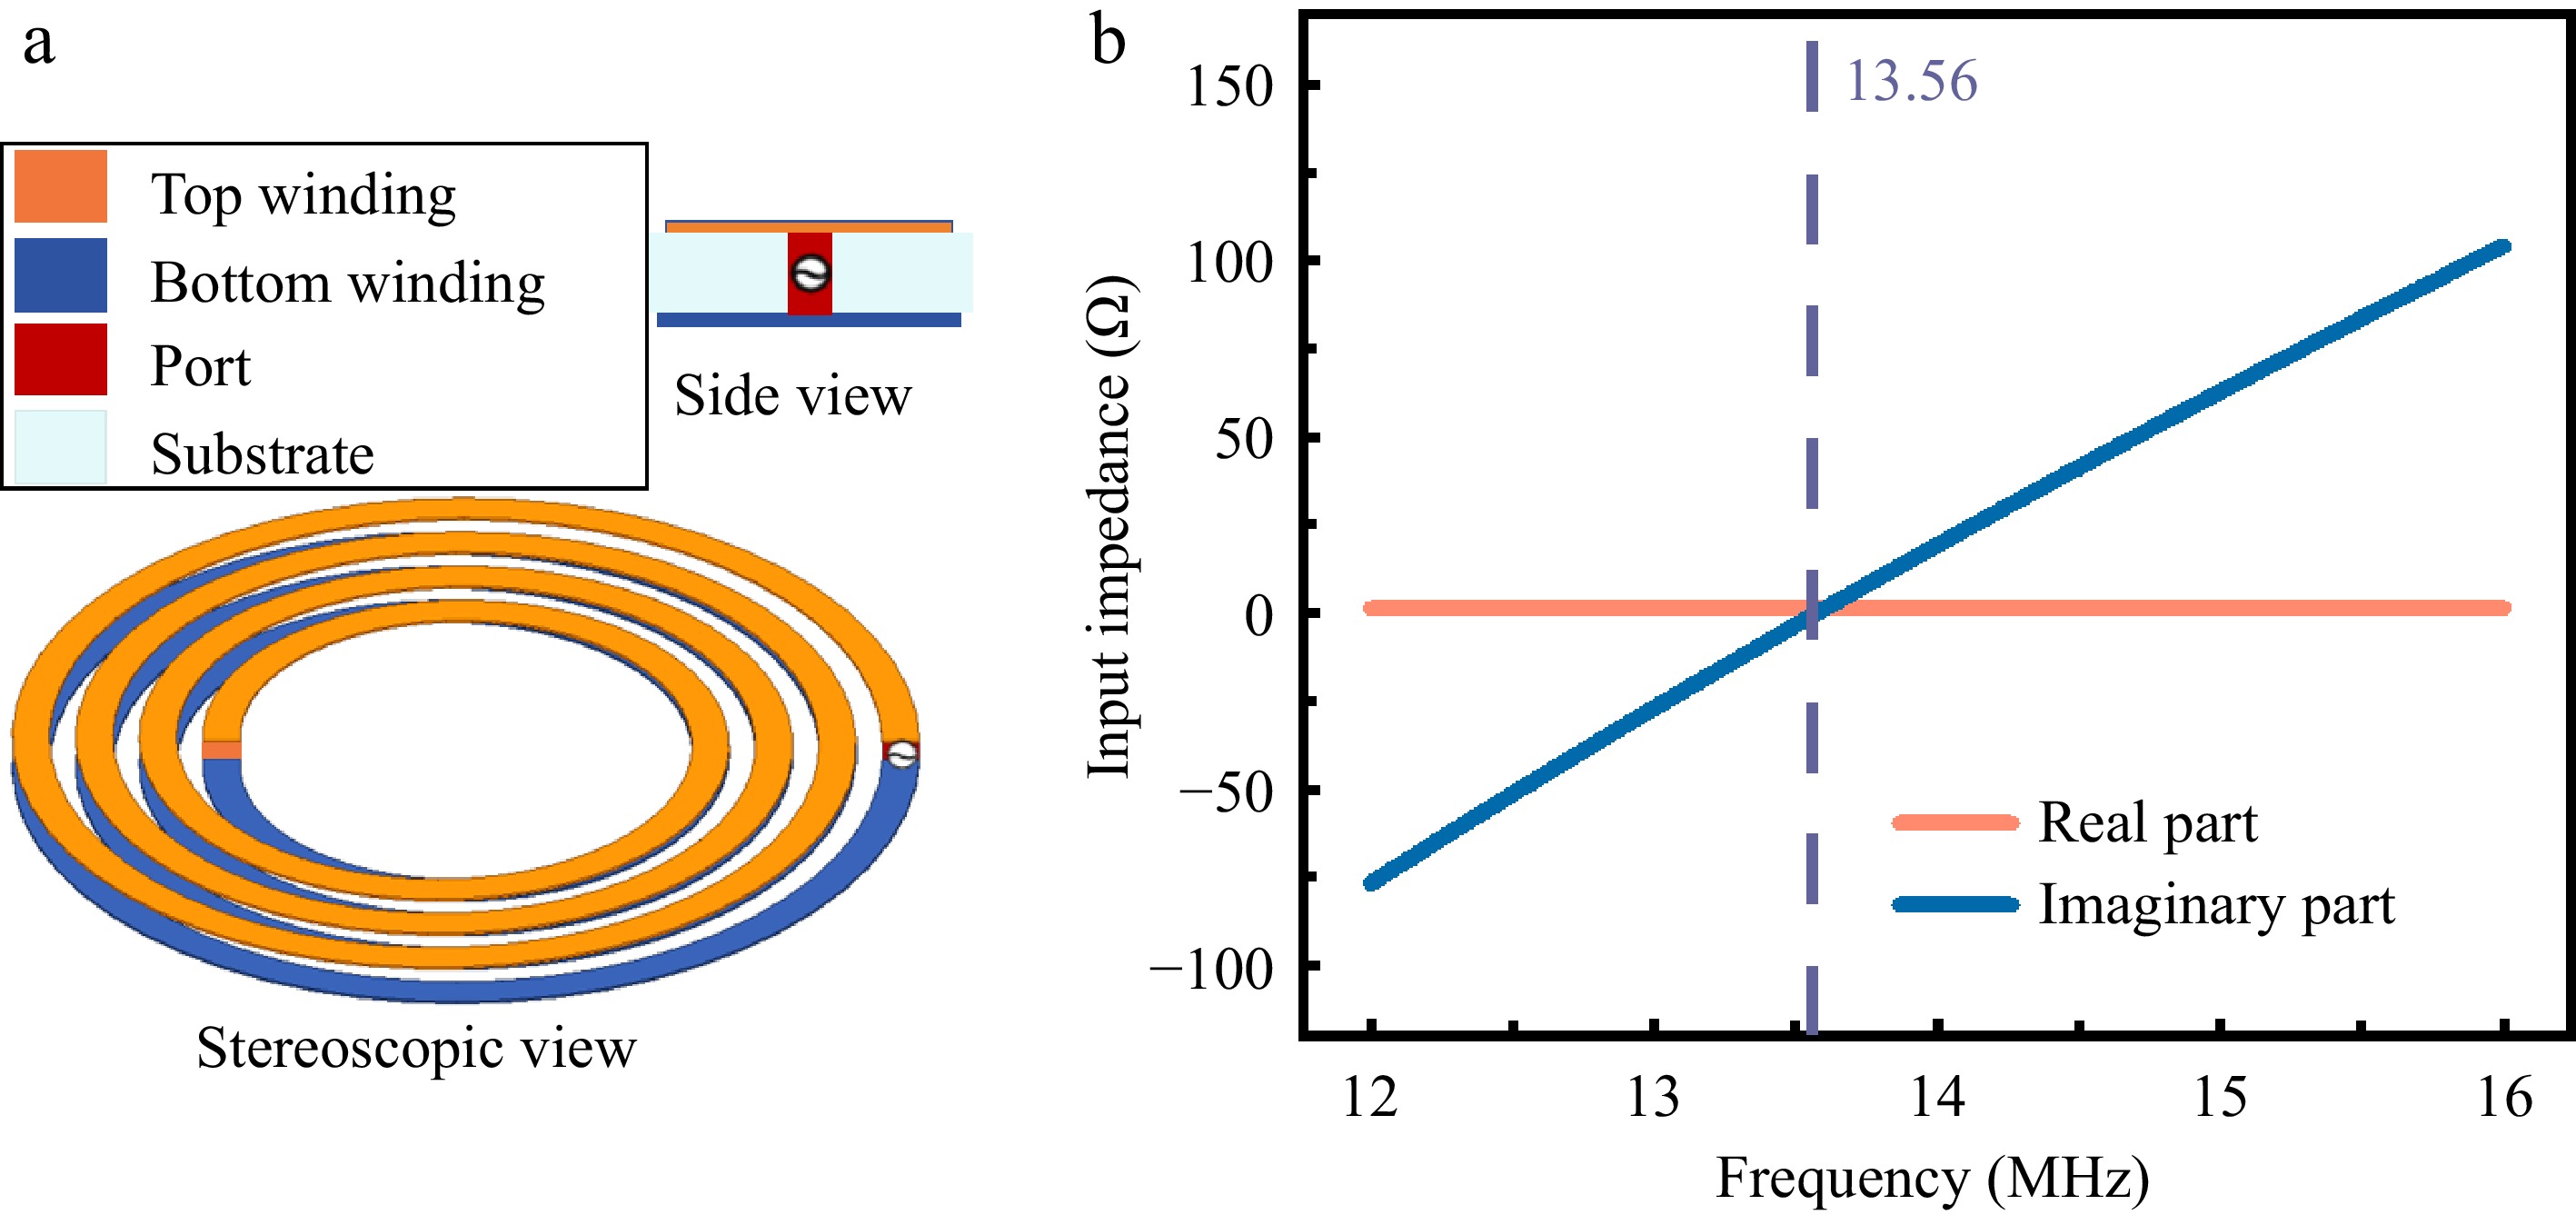
Figure 2.
(a) Structural characteristics of dielectric-substrate-bilateral S-S compensation. (b) Frequency-dependent input impedance characteristics.
-
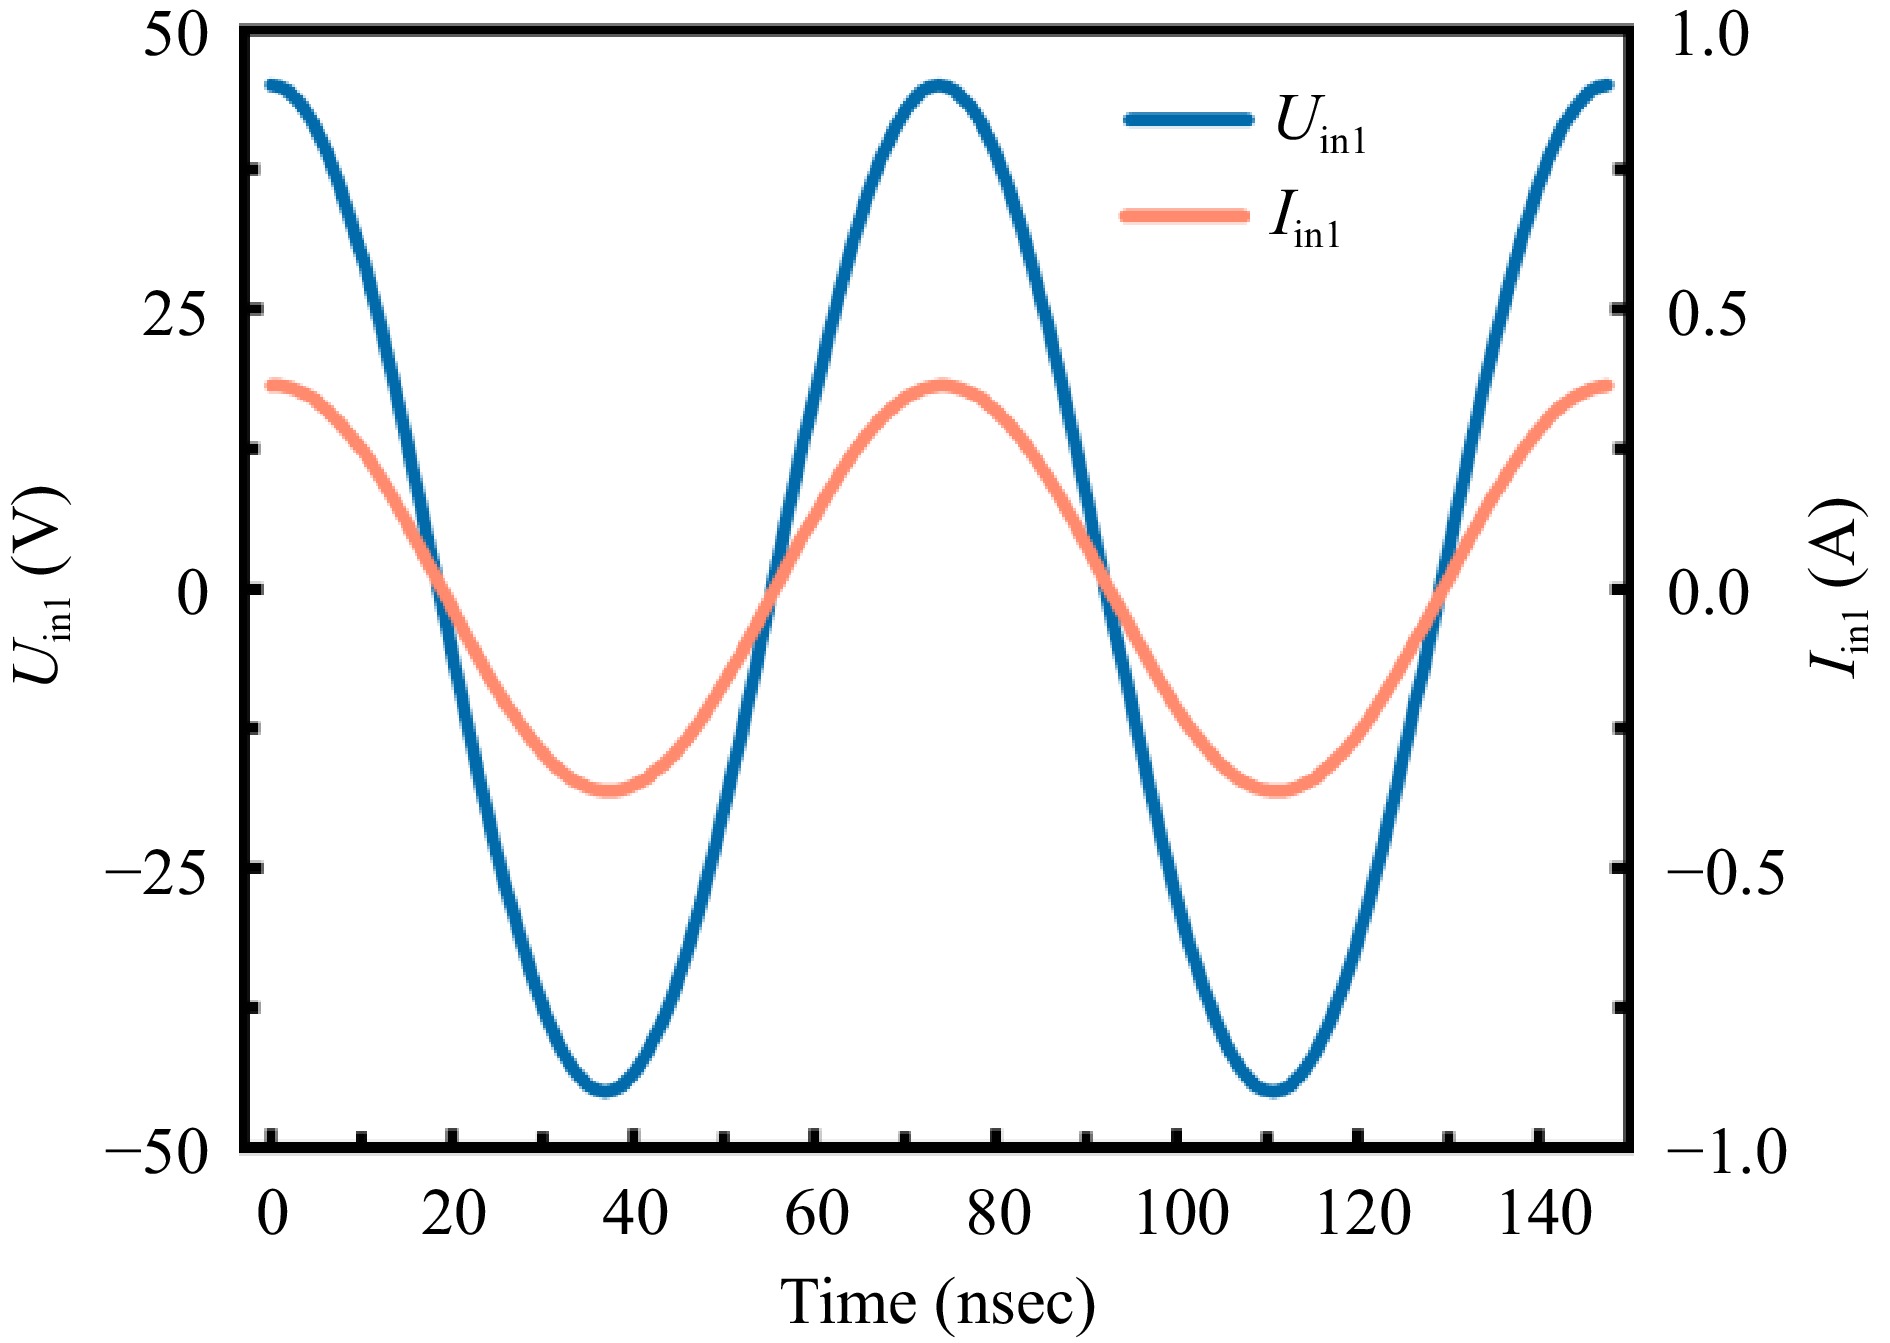
Figure 3.
Voltage and current waveforms at the transmitter side of the S-S compensated coil under operating conditions.
-
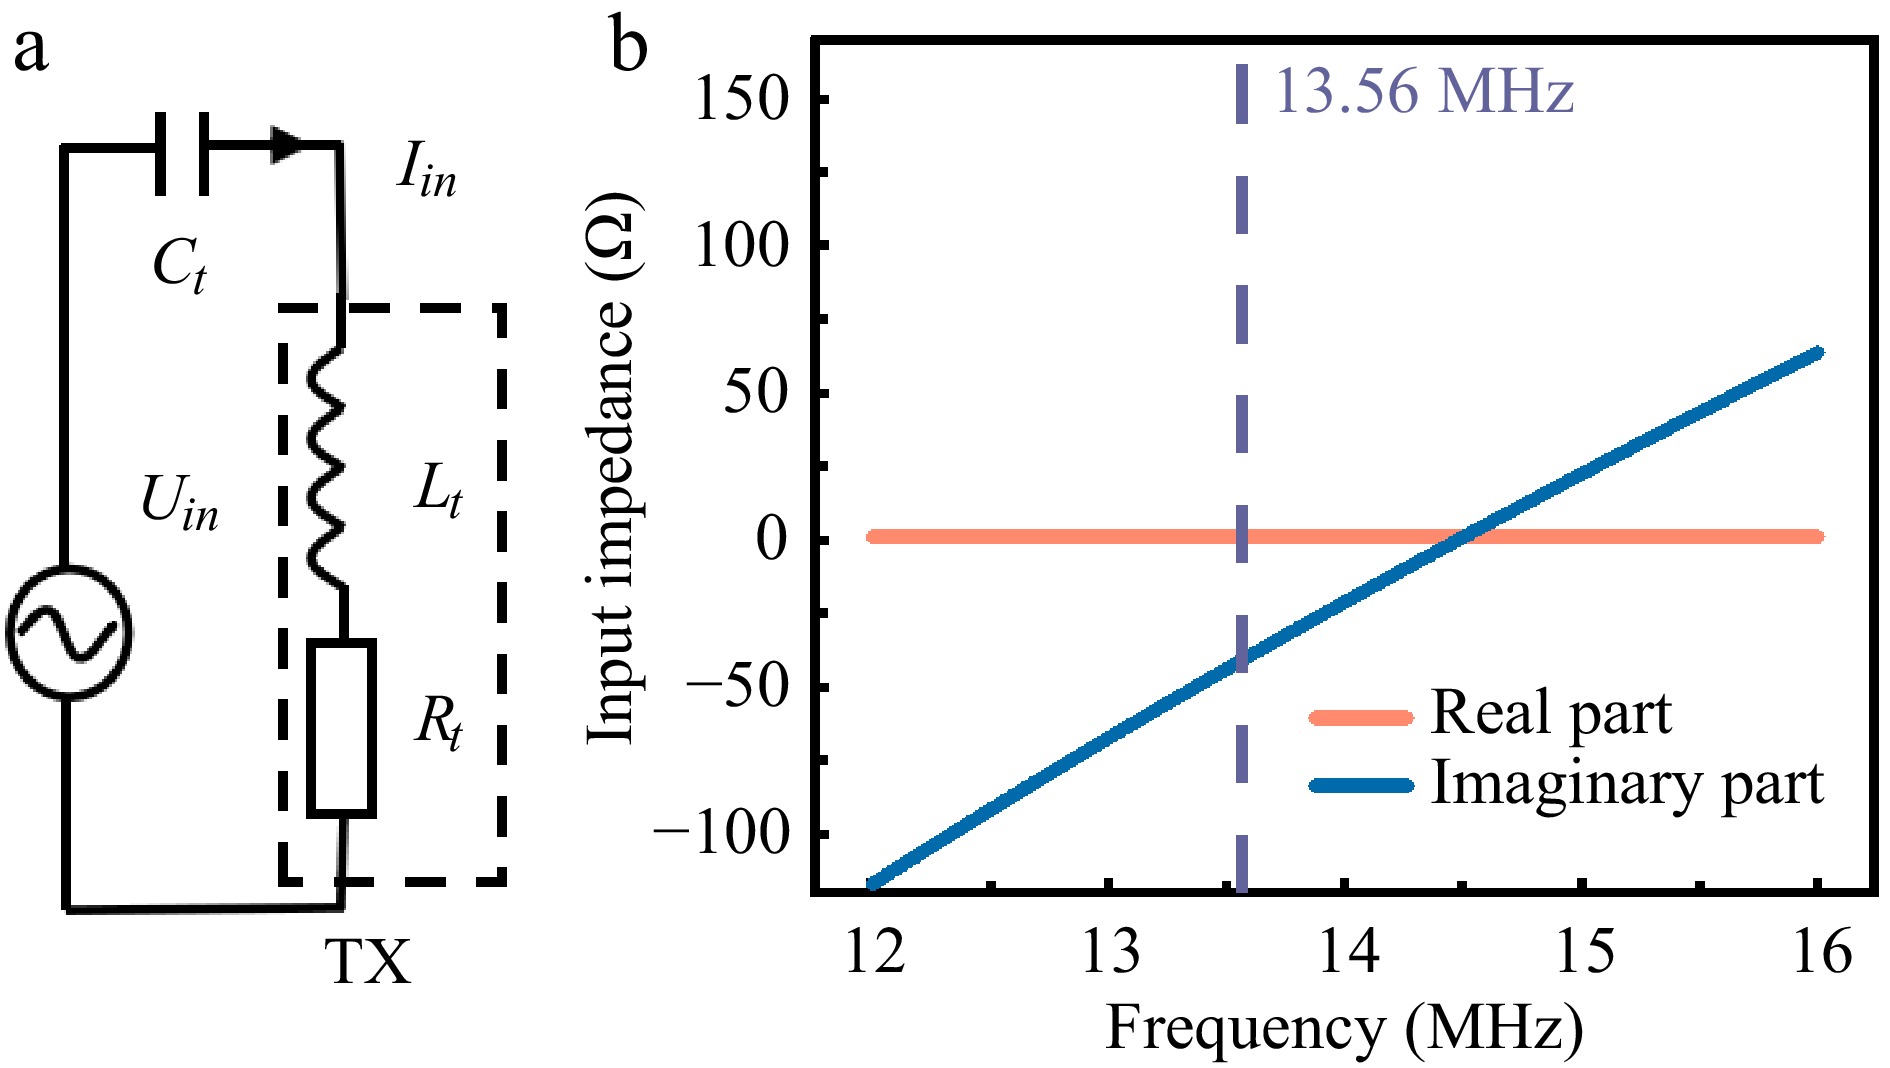
Figure 4.
(a) Equivalent circuit diagram of the S-S compensated coils under no-load condition. (b) Functional relationship between input impedance and frequency.
-
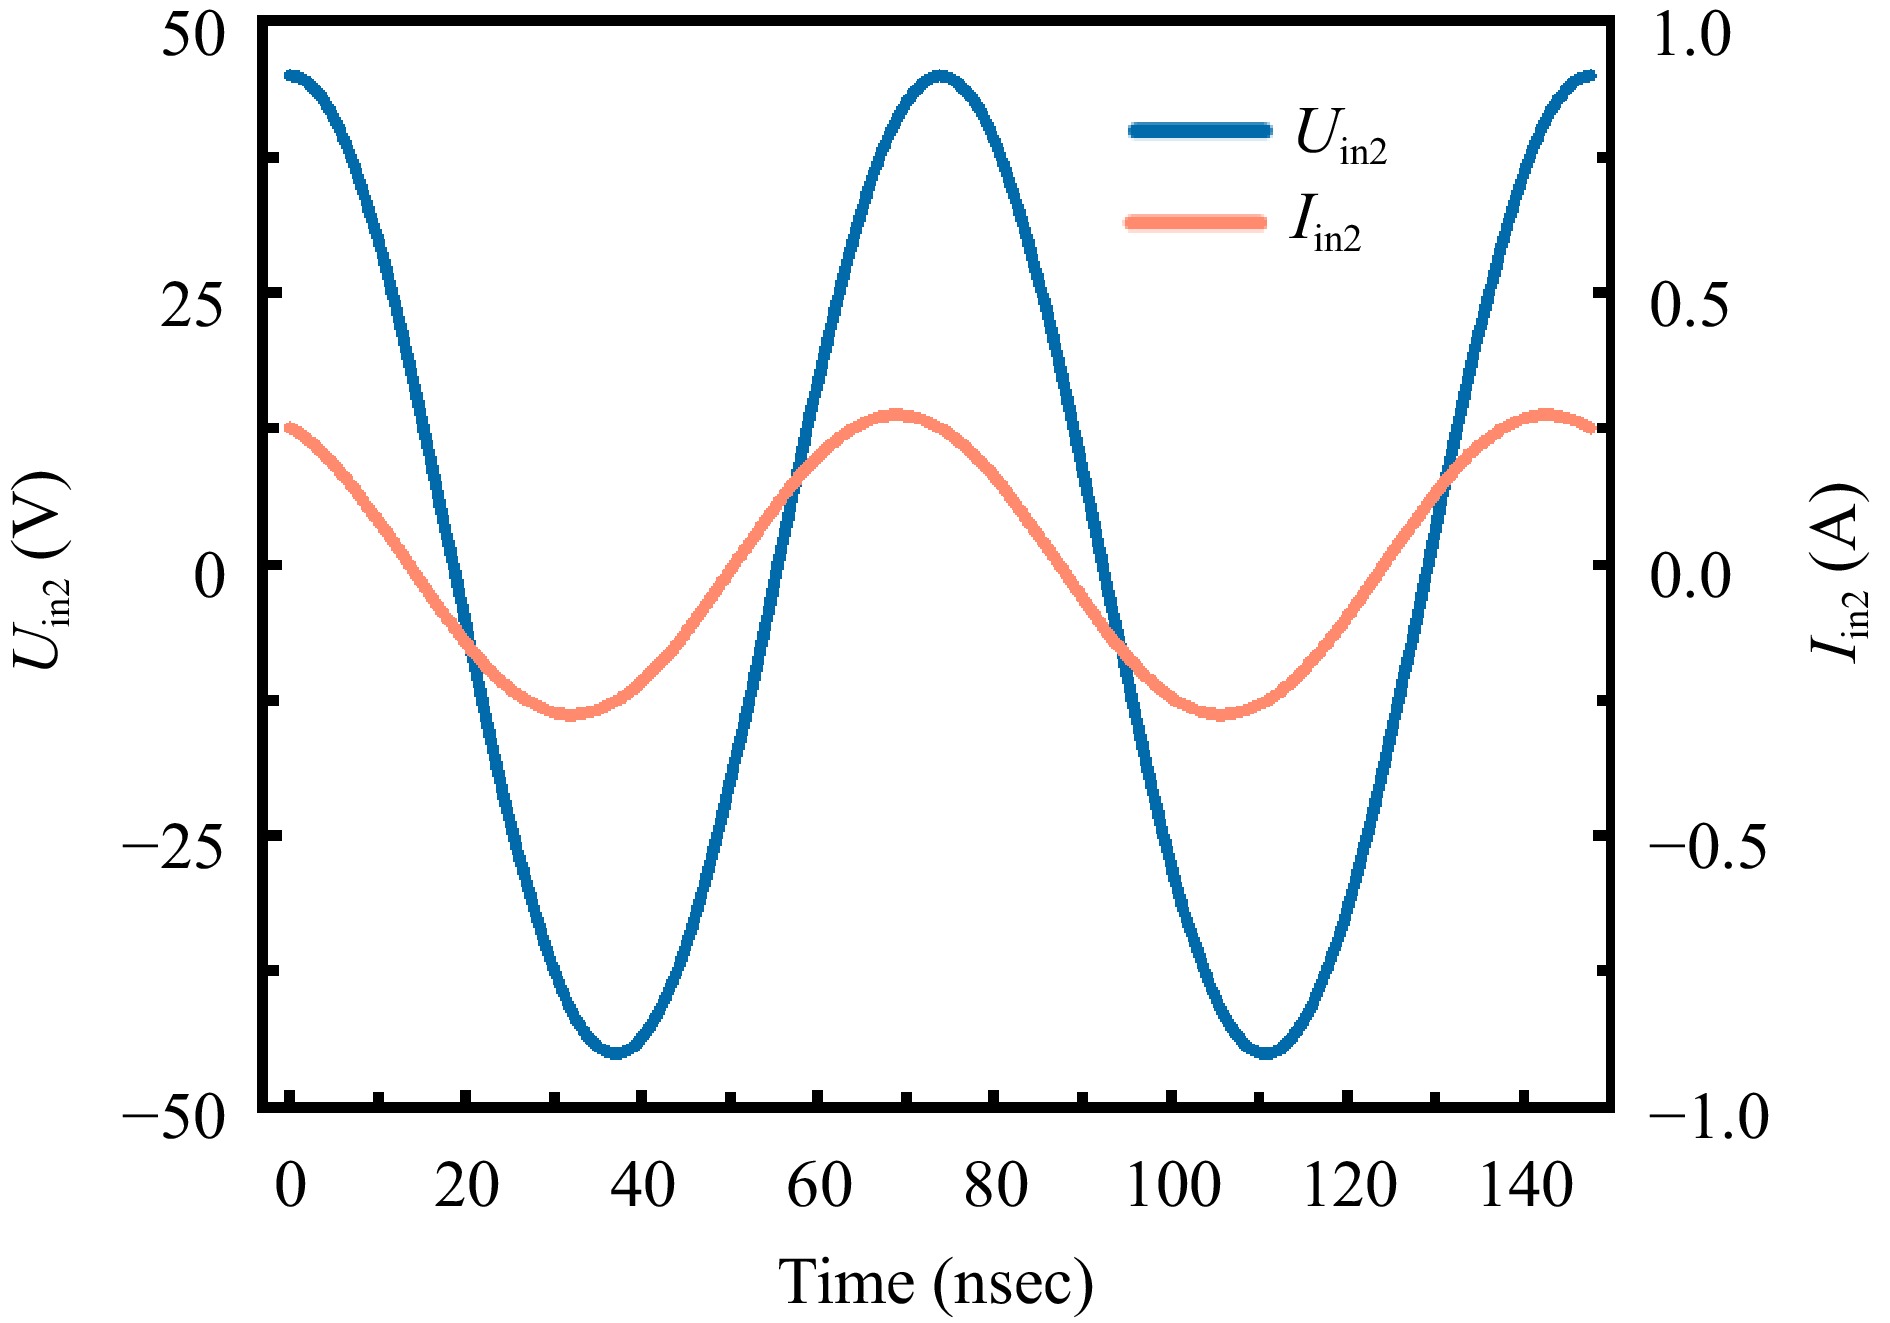
Figure 5.
Voltage and current waveforms at the transmitter side of the S-S compensated coil under no-load conditions.
-
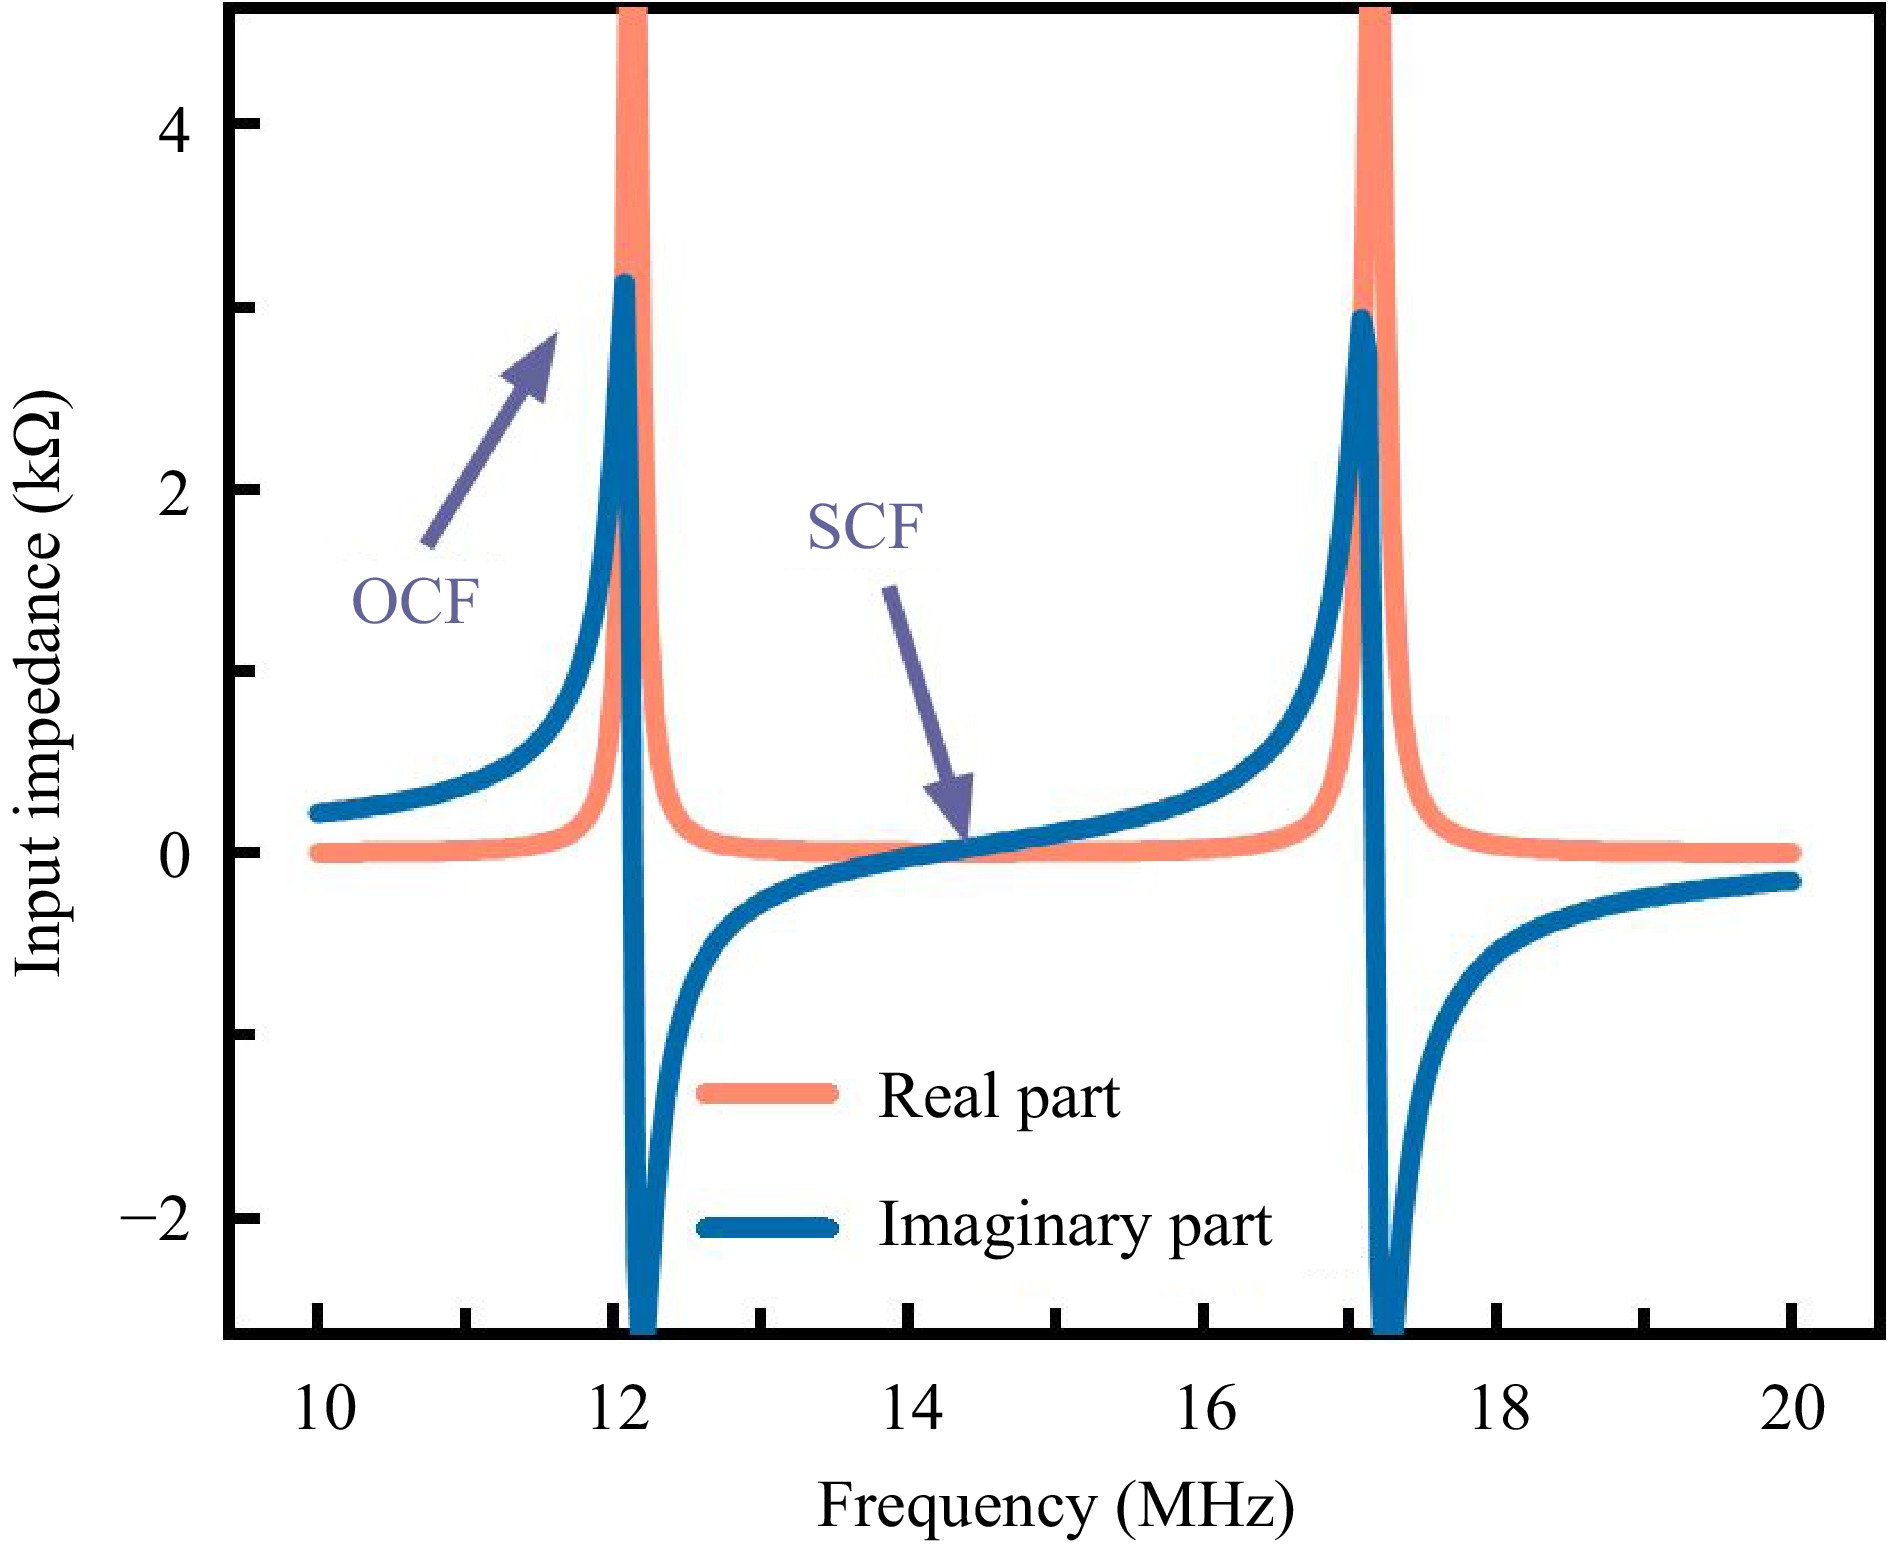
Figure 6.
Frequency-dependent input impedance characteristics of AWC.
-
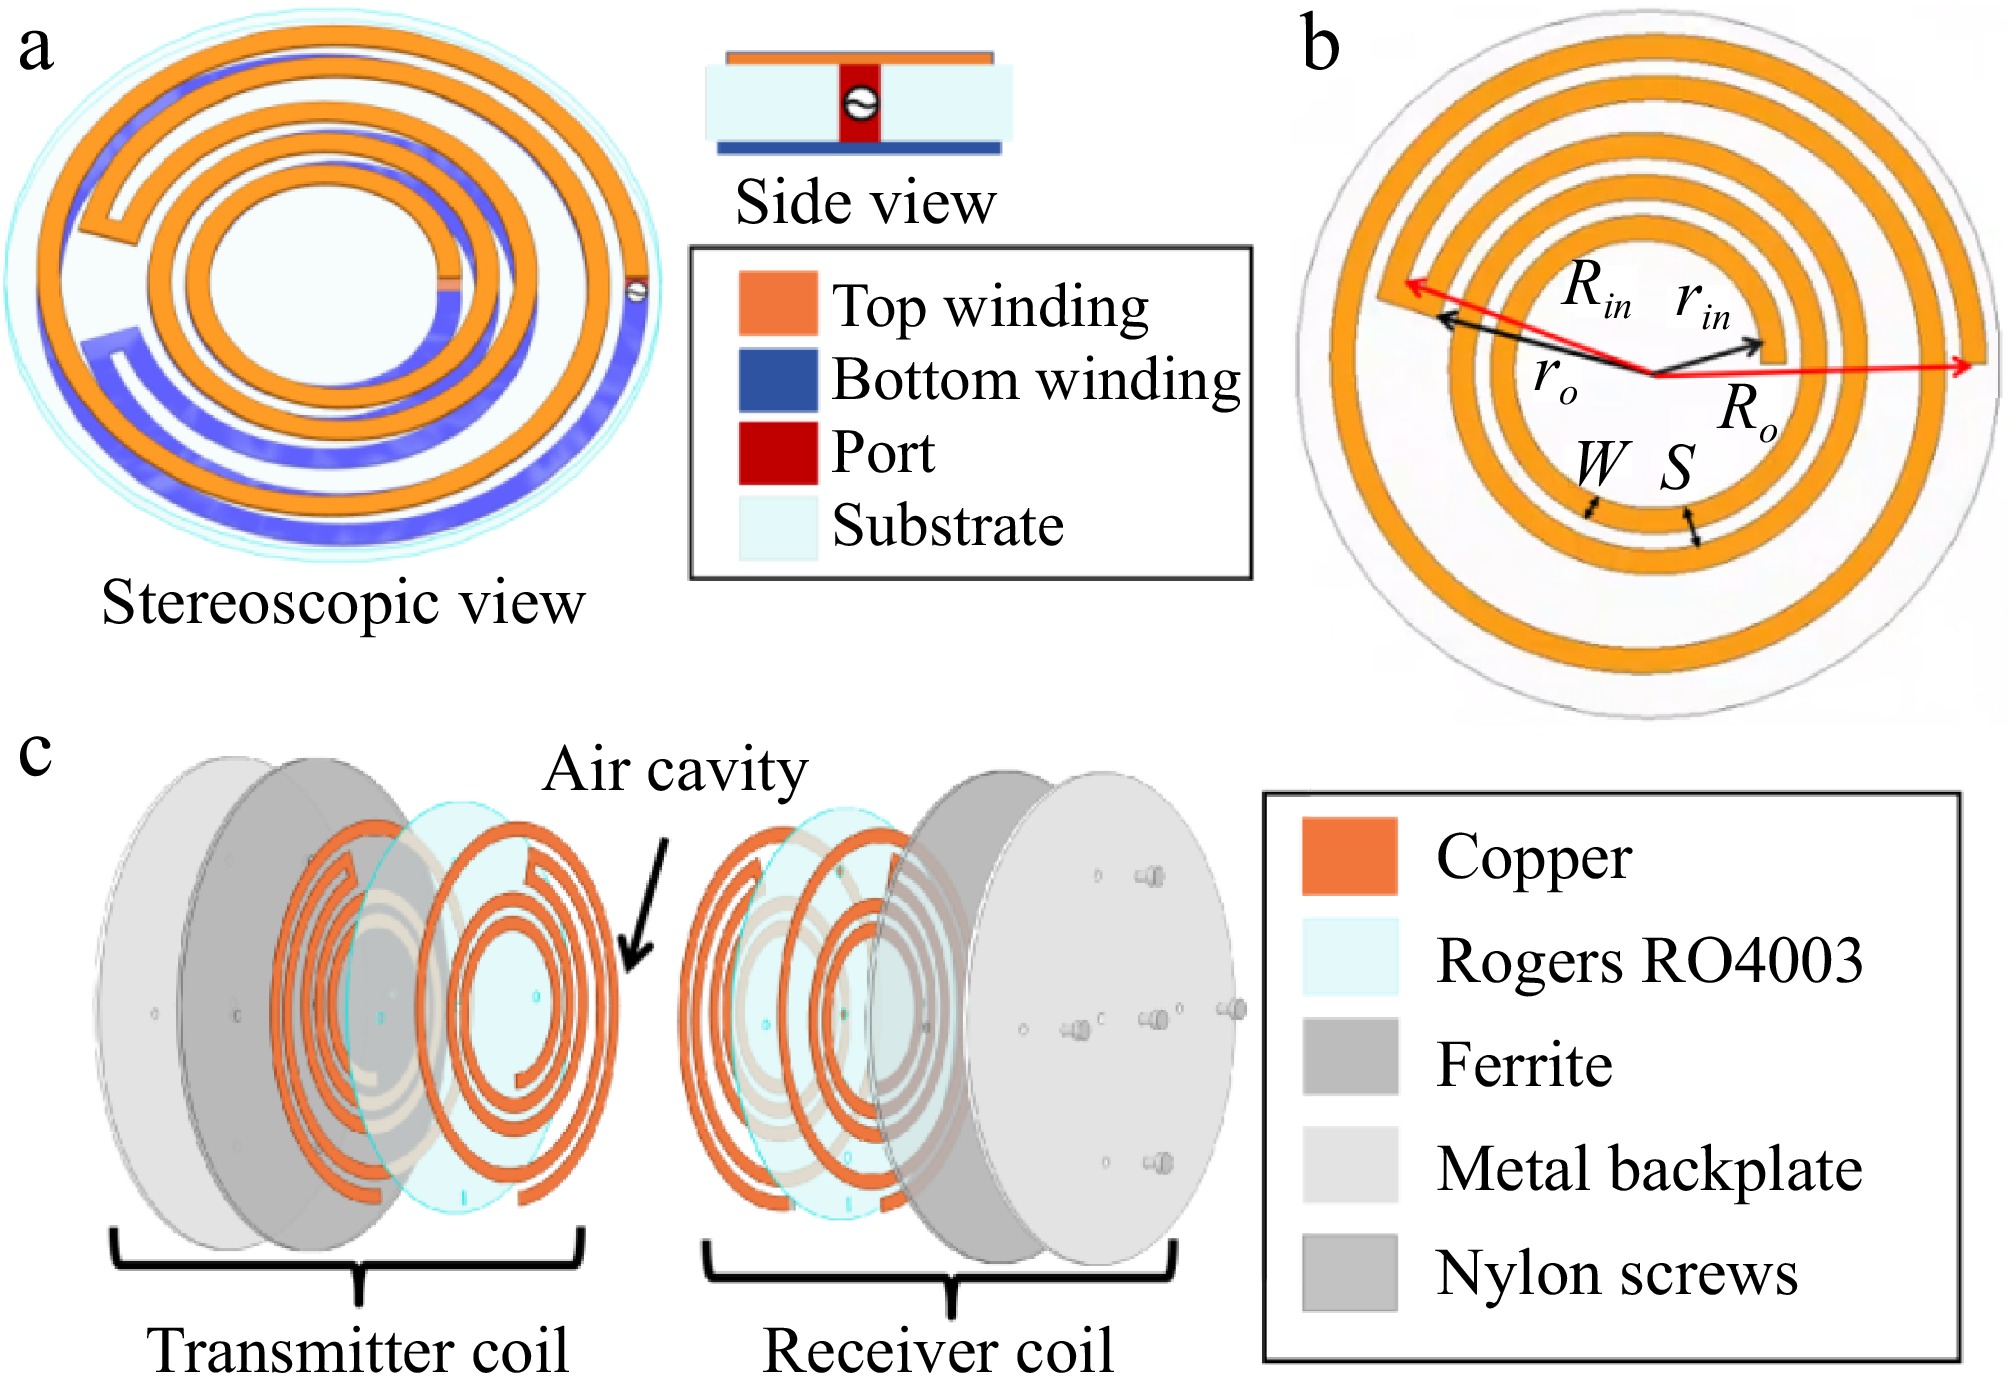
Figure 7.
(a) PAWC structure. (b) The structural diagram of the PAWC on the upper side of the Rogers board. (c) Exploded view of the PAWC coupling structure.
-
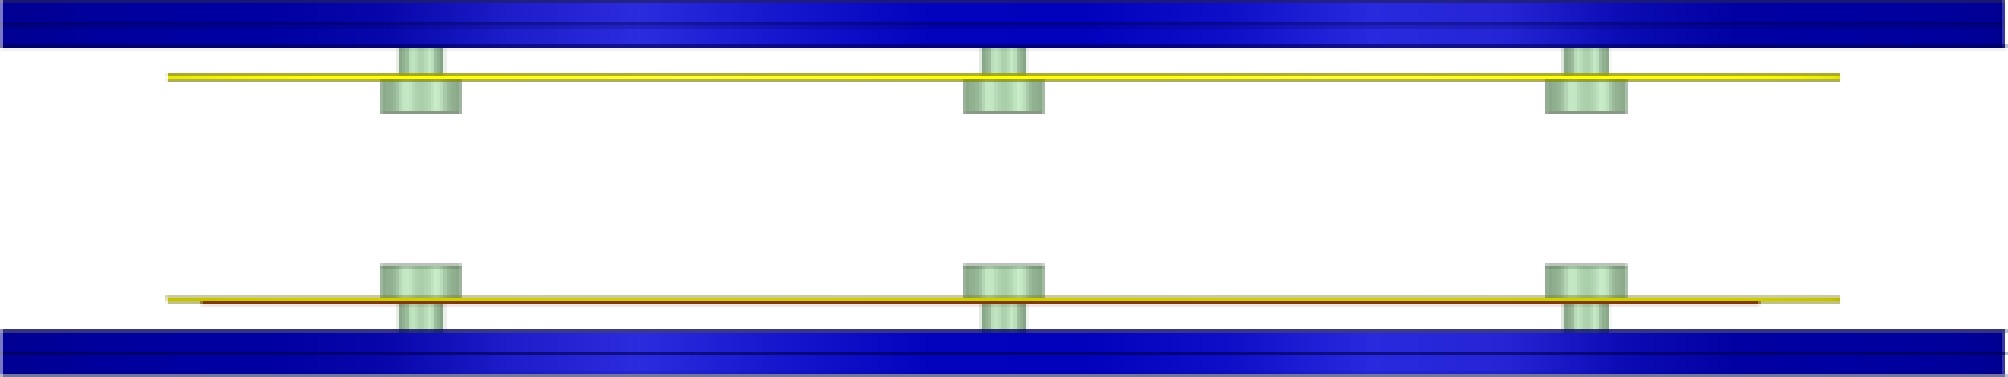
Figure 8.
Overall coupling structure.
-
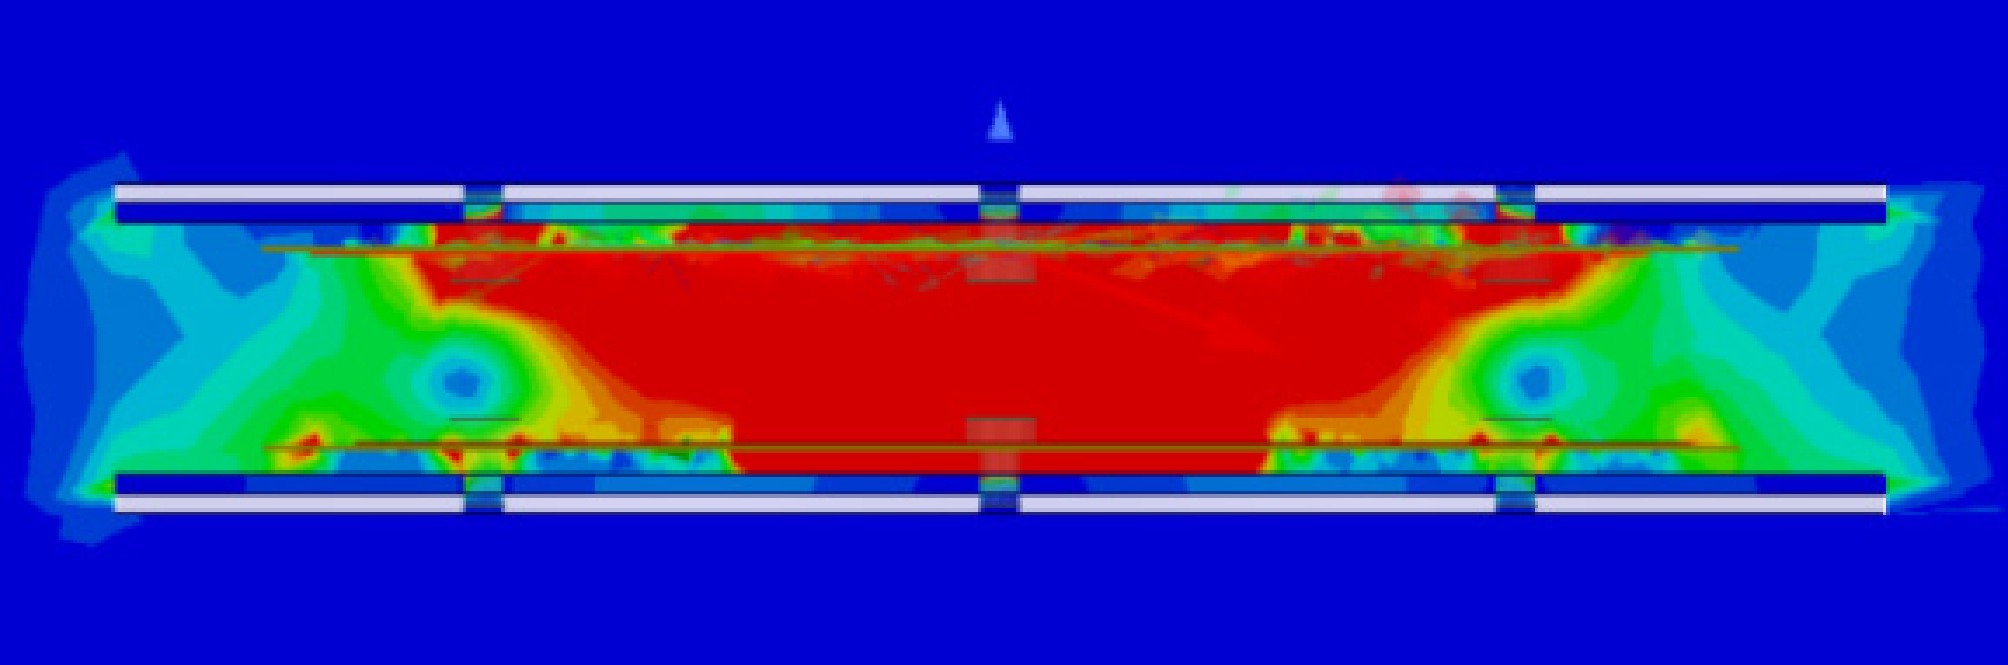
Figure 9.
Magnetic field distribution between coupled structures.
-
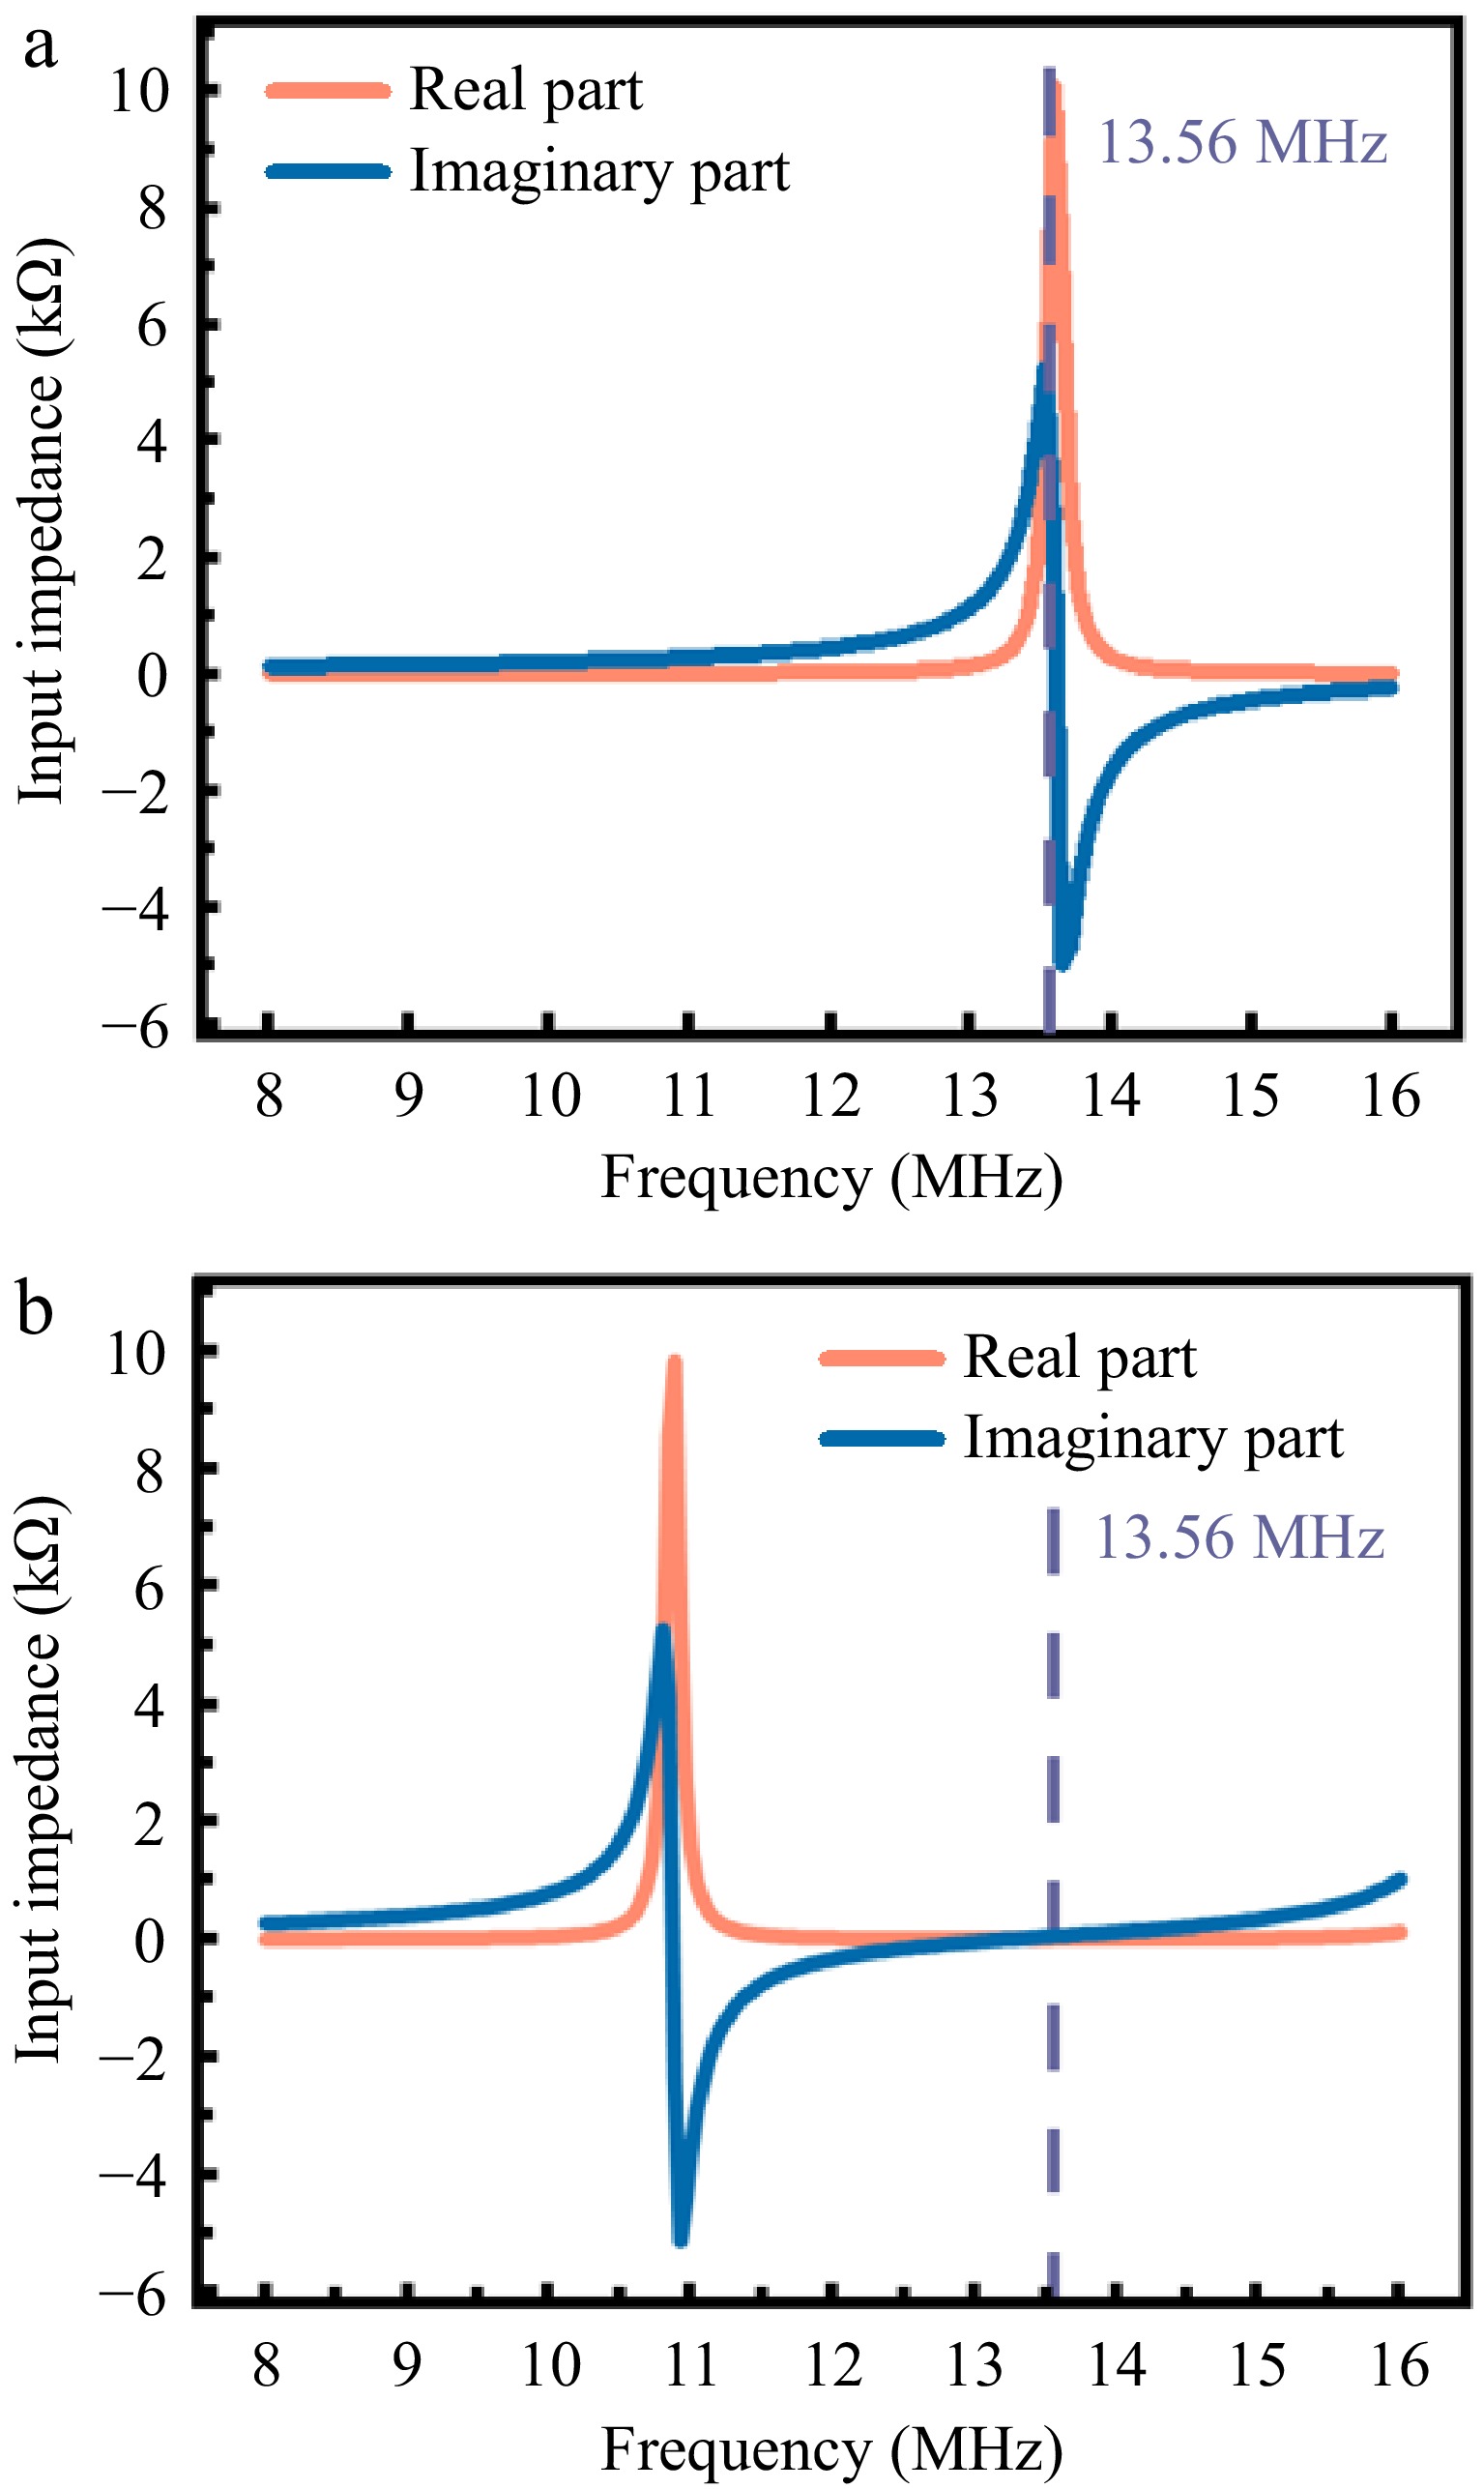
Figure 10.
(a) The relationship between input impedance and frequency of the unilateral PAWC. (b) The relationship between input impedance and frequency for coupled bilateral PAWC.
-

Figure 11.
Fabricated PAWC structure.
-
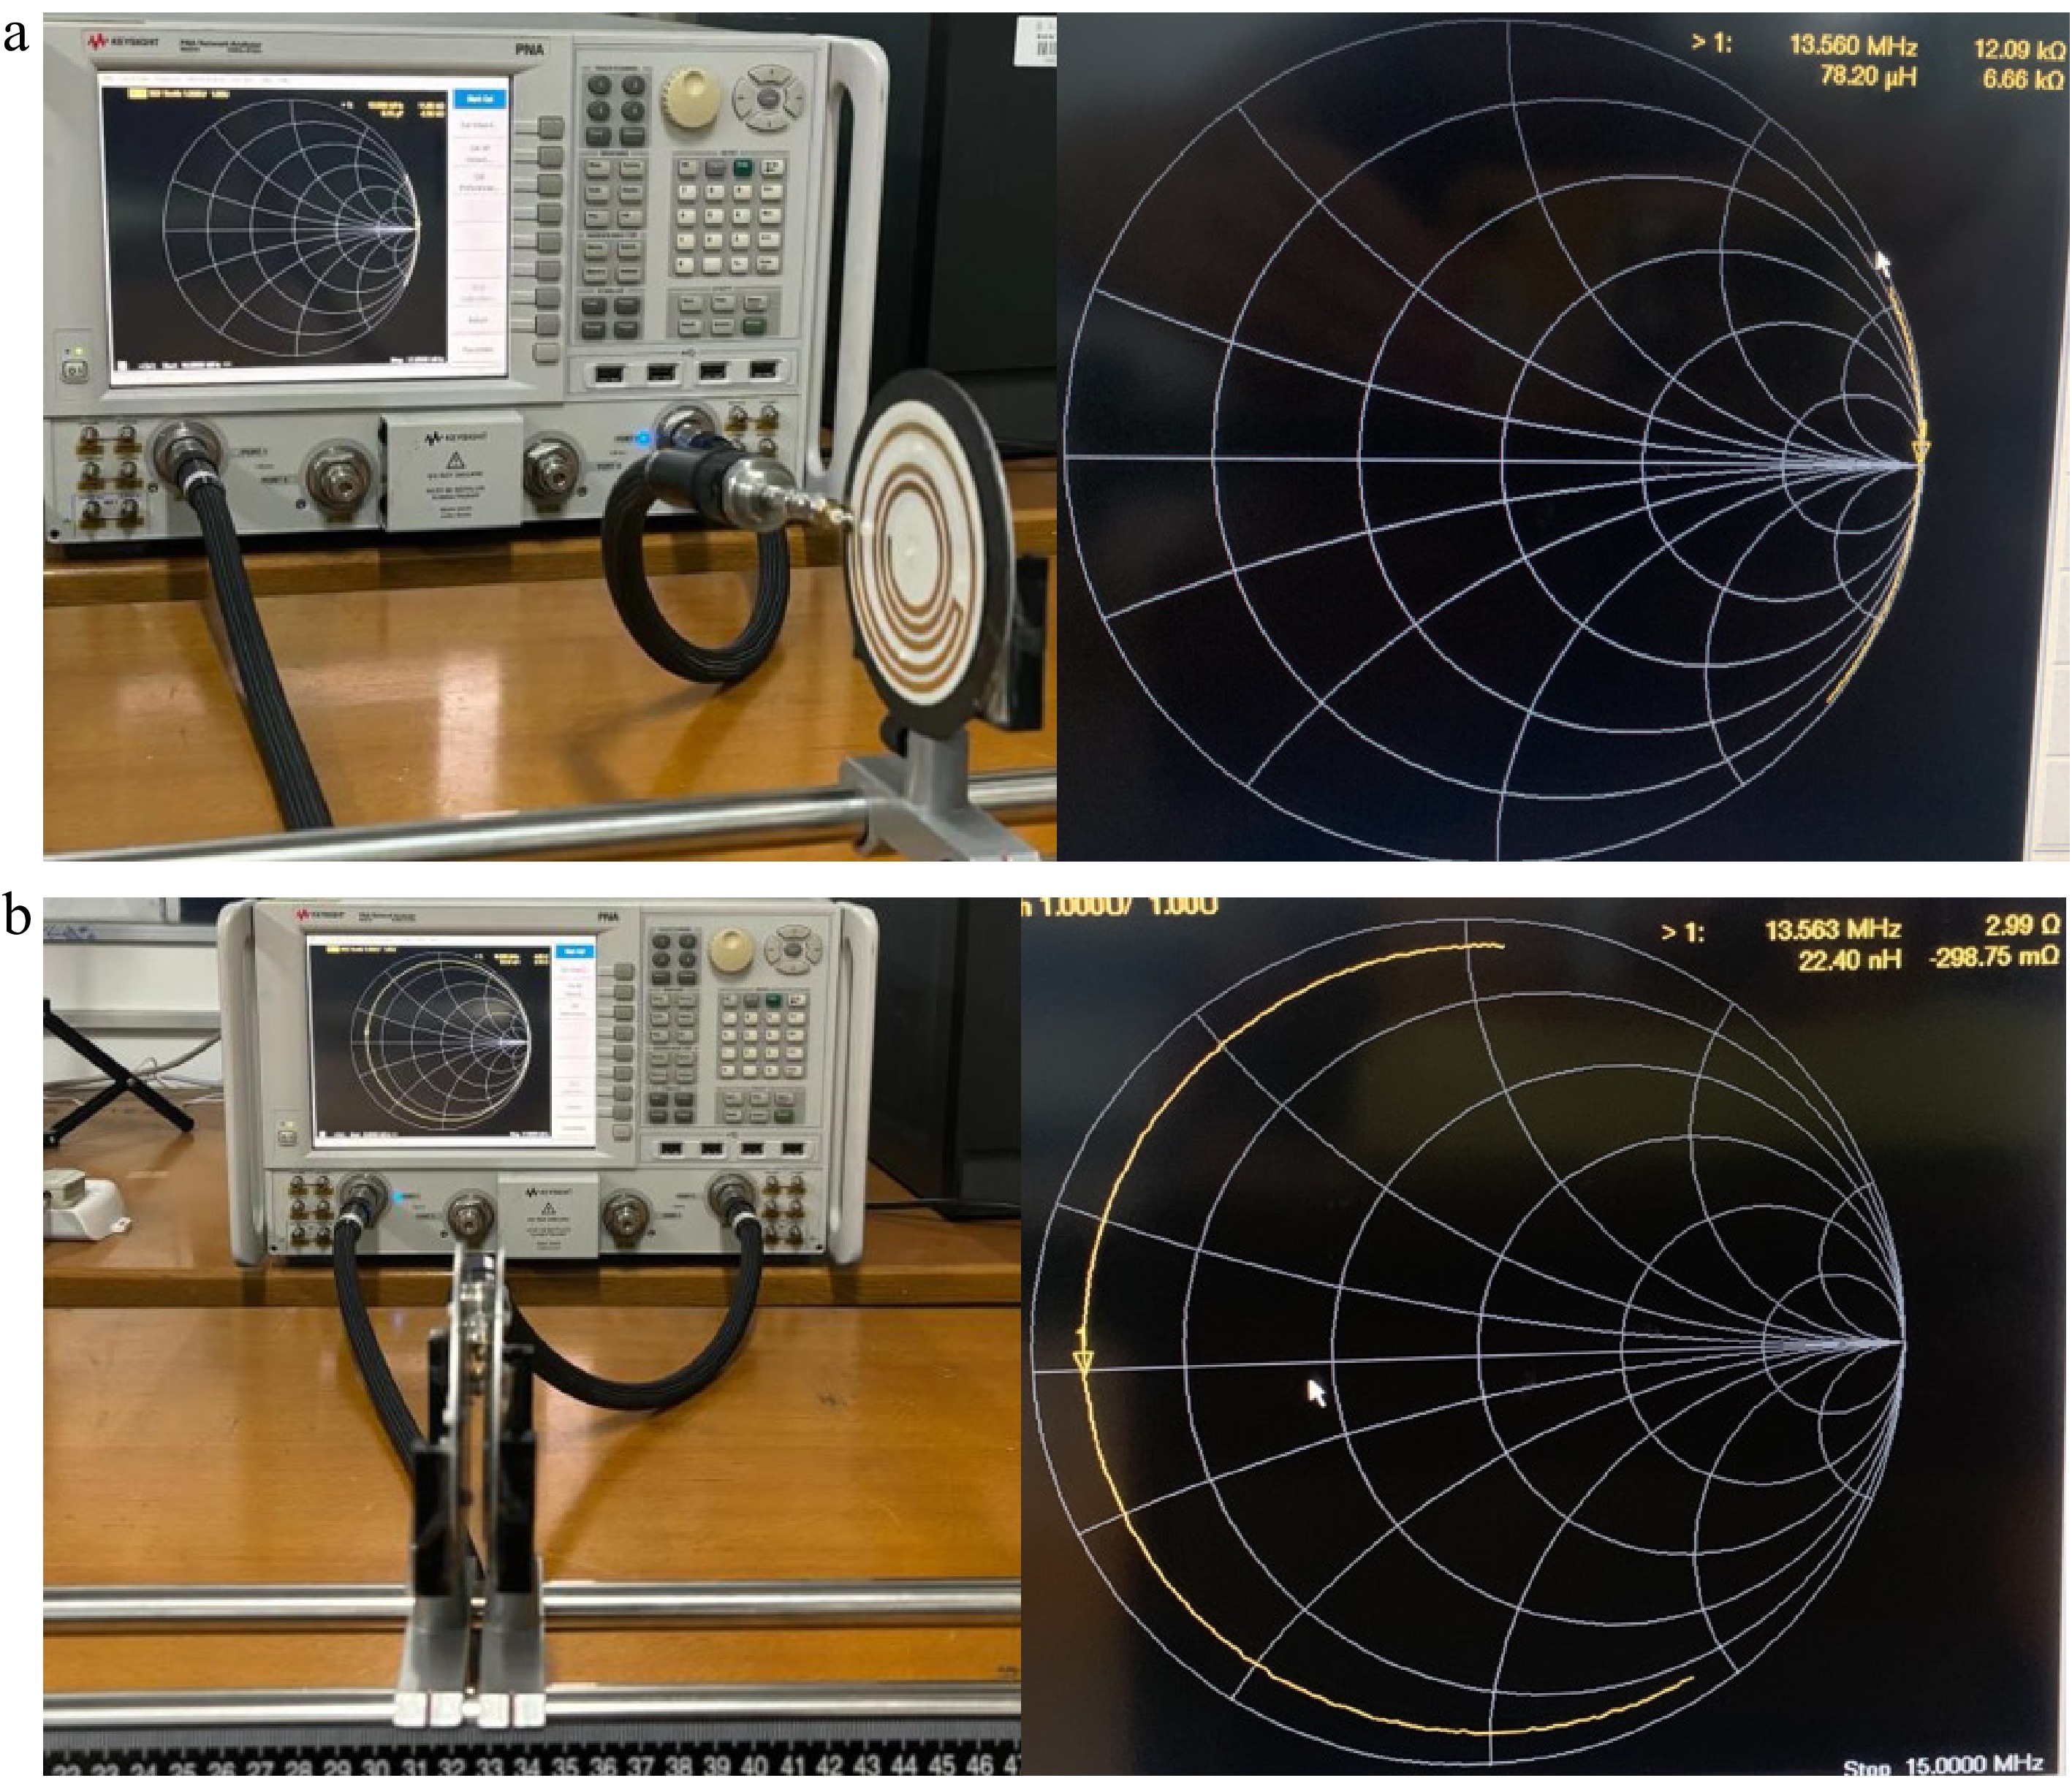
Figure 12.
Experimental setups of the fabricated PAWC. (a) Unilateral transmission structure testing. (b) Bilateral transmission structure testing.
-
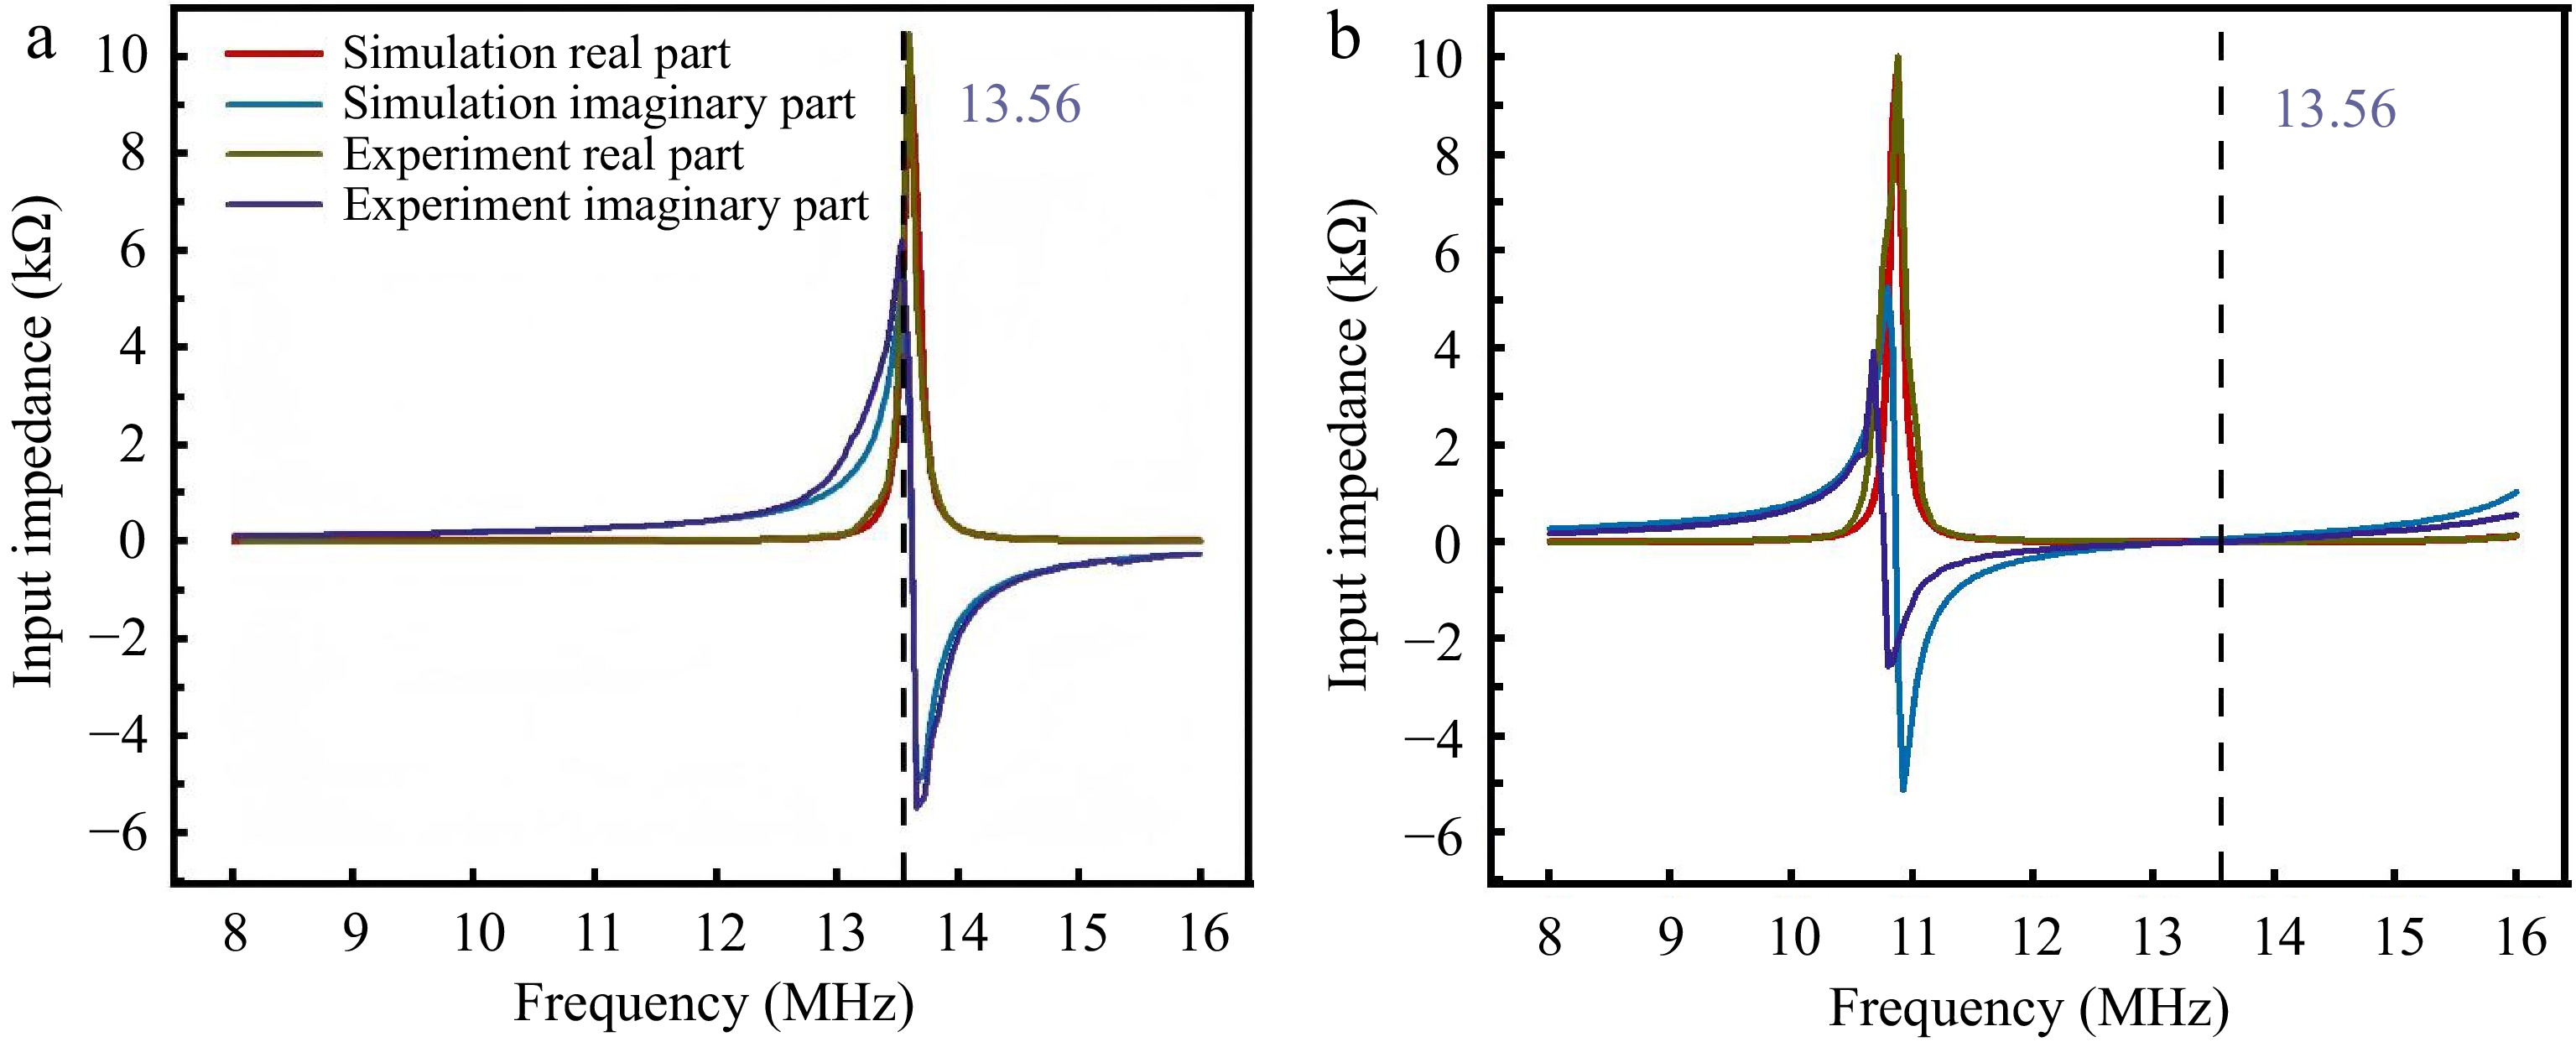
Figure 13.
Experimental-simulation comparison of PAWC impedance characteristics. (a) Transmitter-only operation with OCF mode at 13.56 MHz. (b) 5 mm receiver spacing with SCF mode impedance at 13.56 MHz.
-
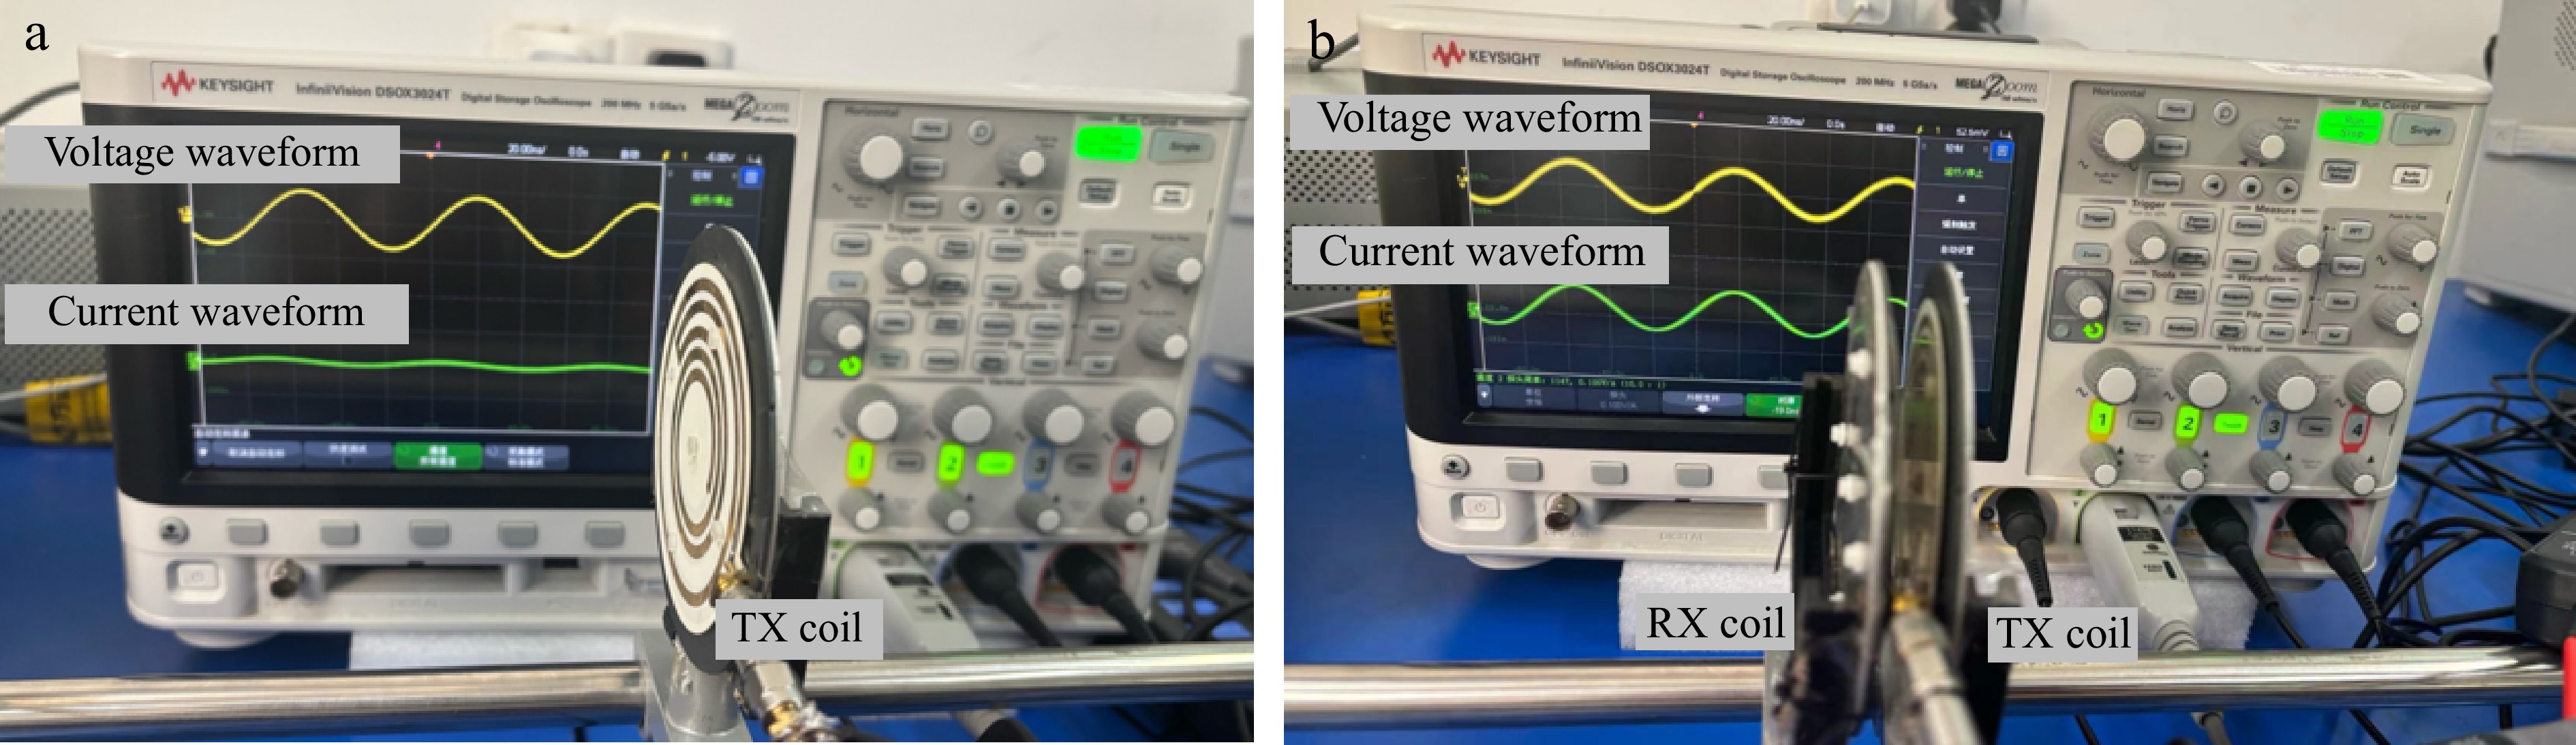
Figure 14.
Switching state verification of PAWC. (a) TX coil only-safety cutoff mode and zero-current protection. (b) Receiver in charging position, showing high-efficiency transfer mode and auto-activation feature.
-
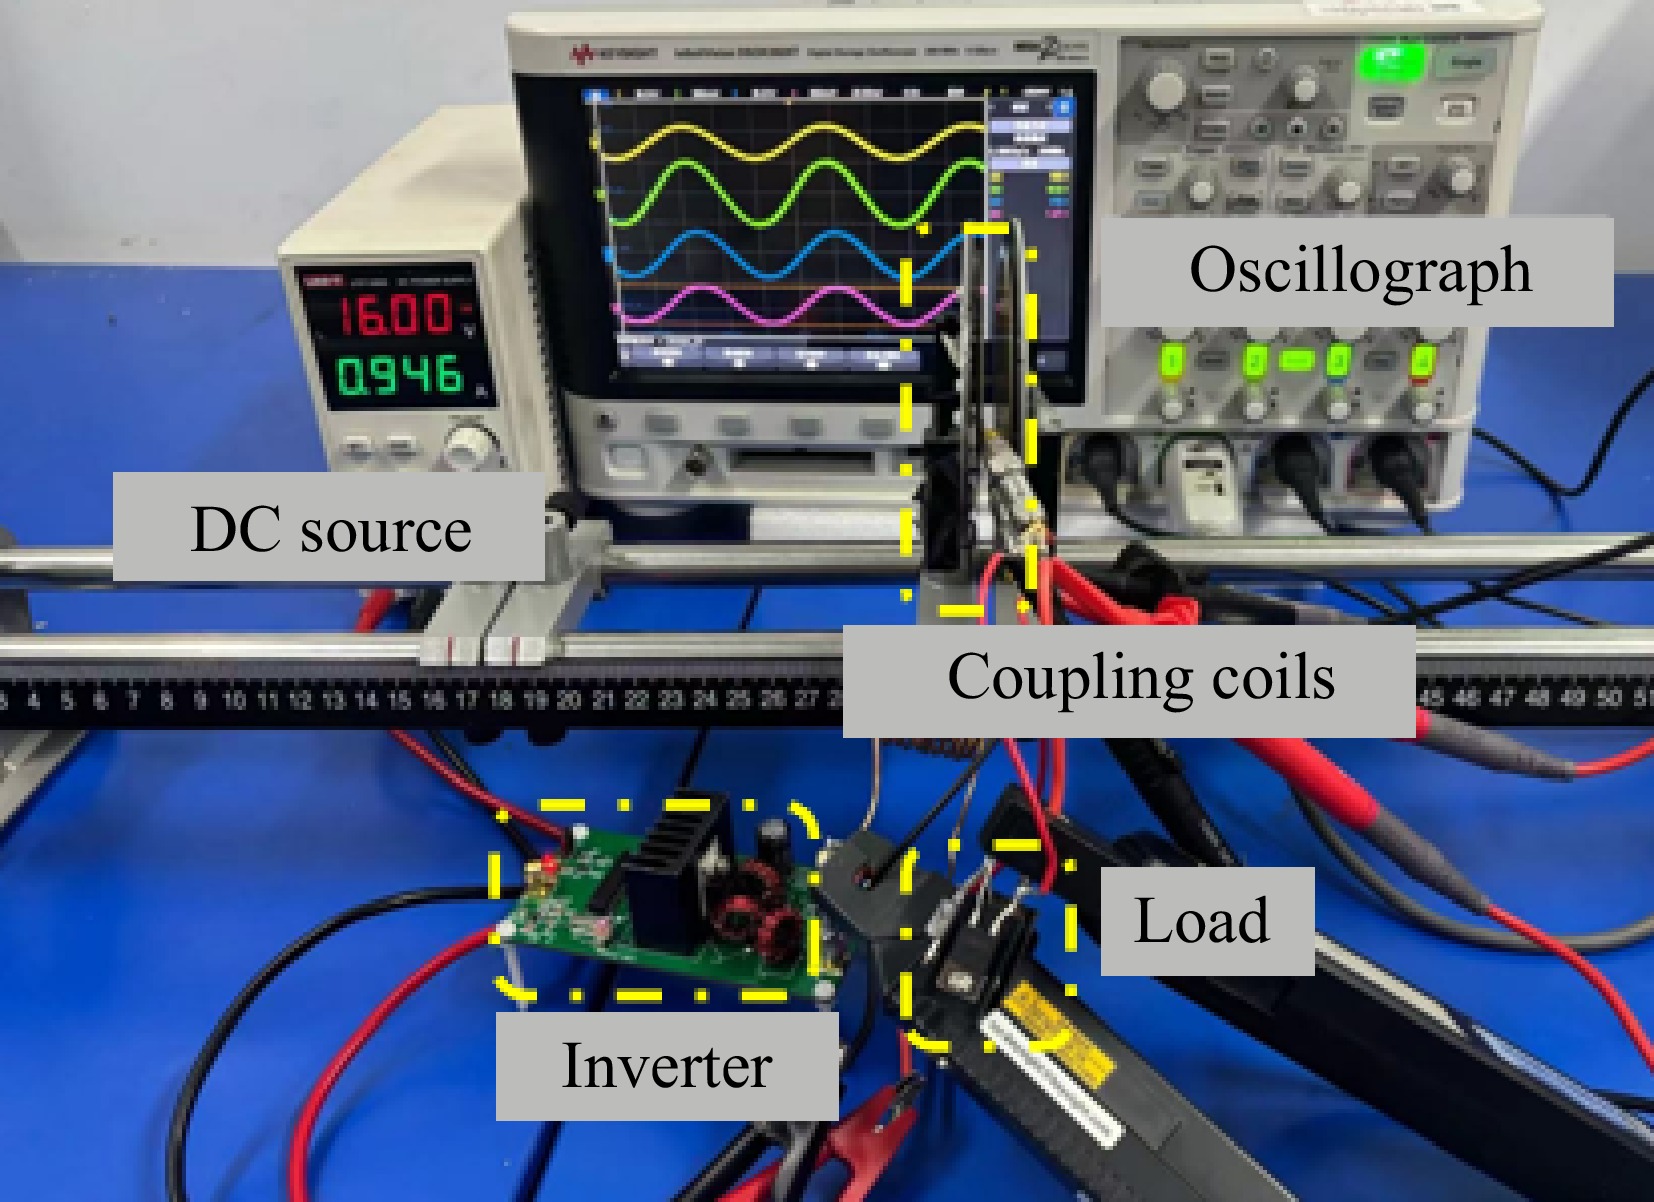
Figure 15.
Experimental setups of PAWC WPT system without compensation circuits.
-
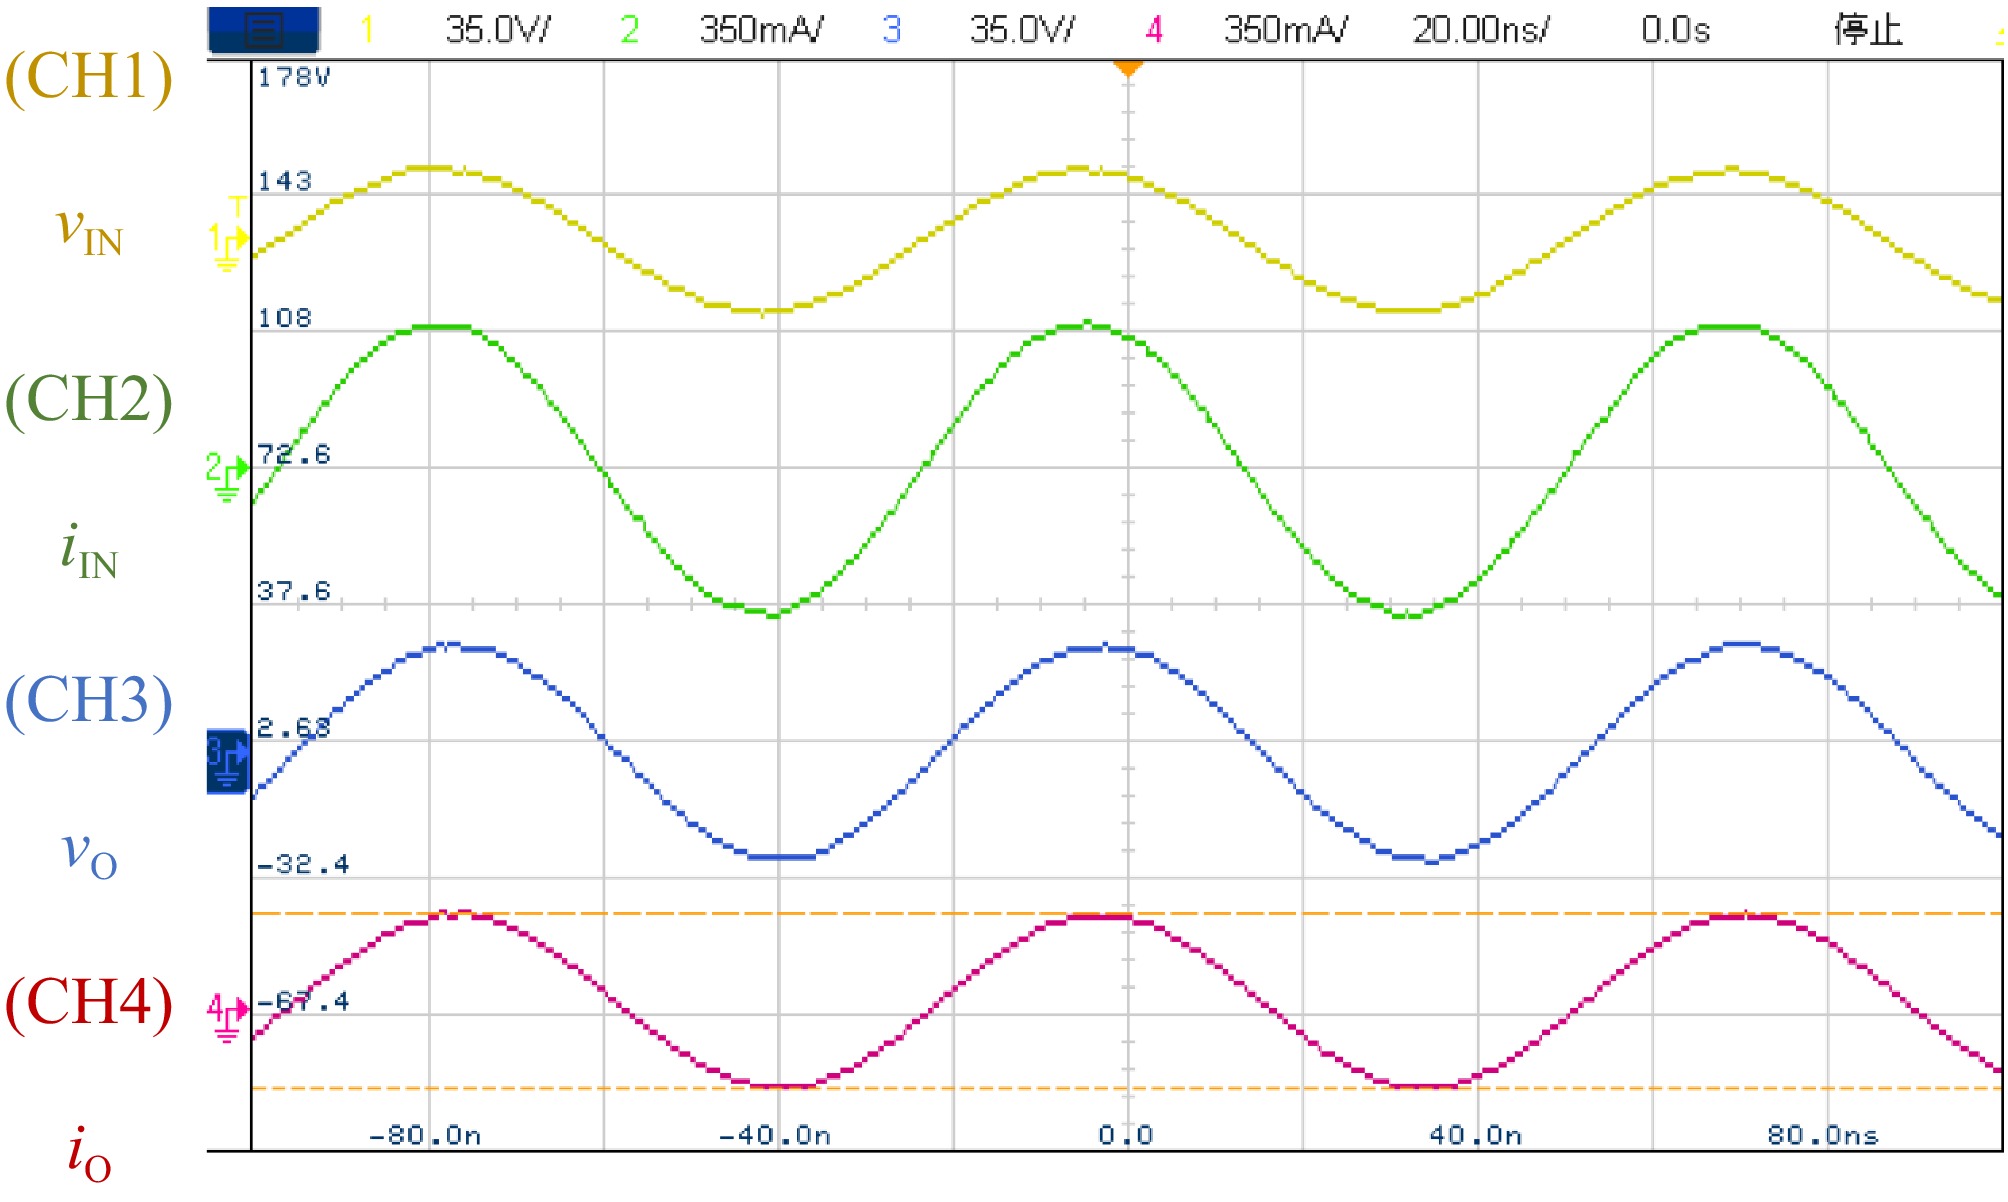
Figure 16.
Measured voltage and current waveforms at both transmitting and receiving coils under 110 Ω AC load condition.
-
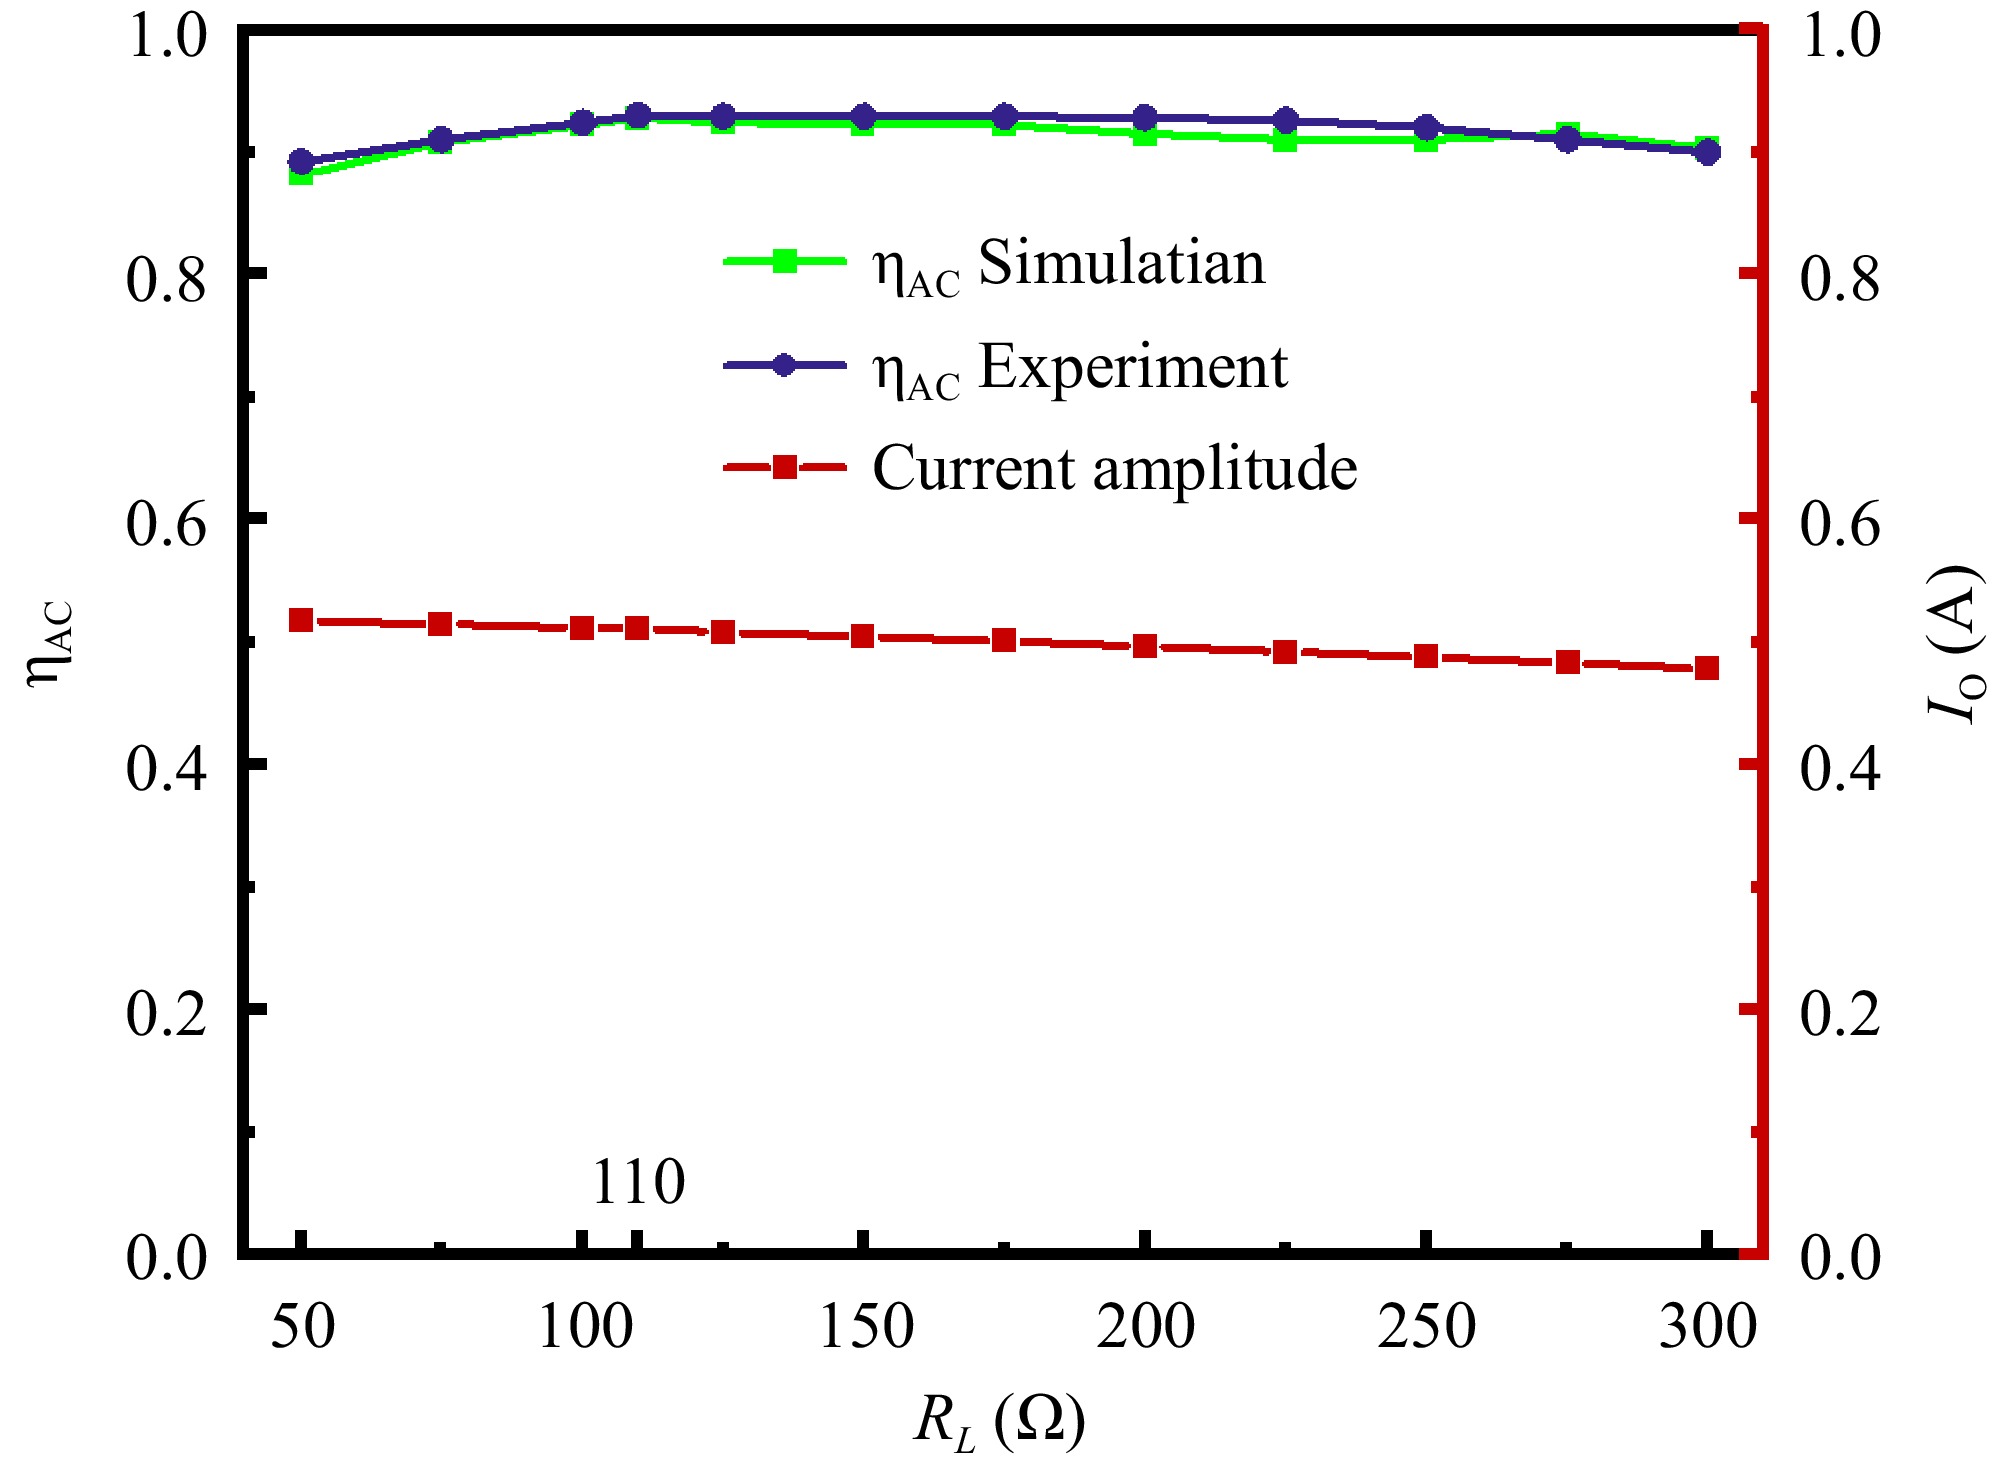
Figure 17.
Measured transmission efficiency of PAWCs across 50−300 Ω AC load range.
-
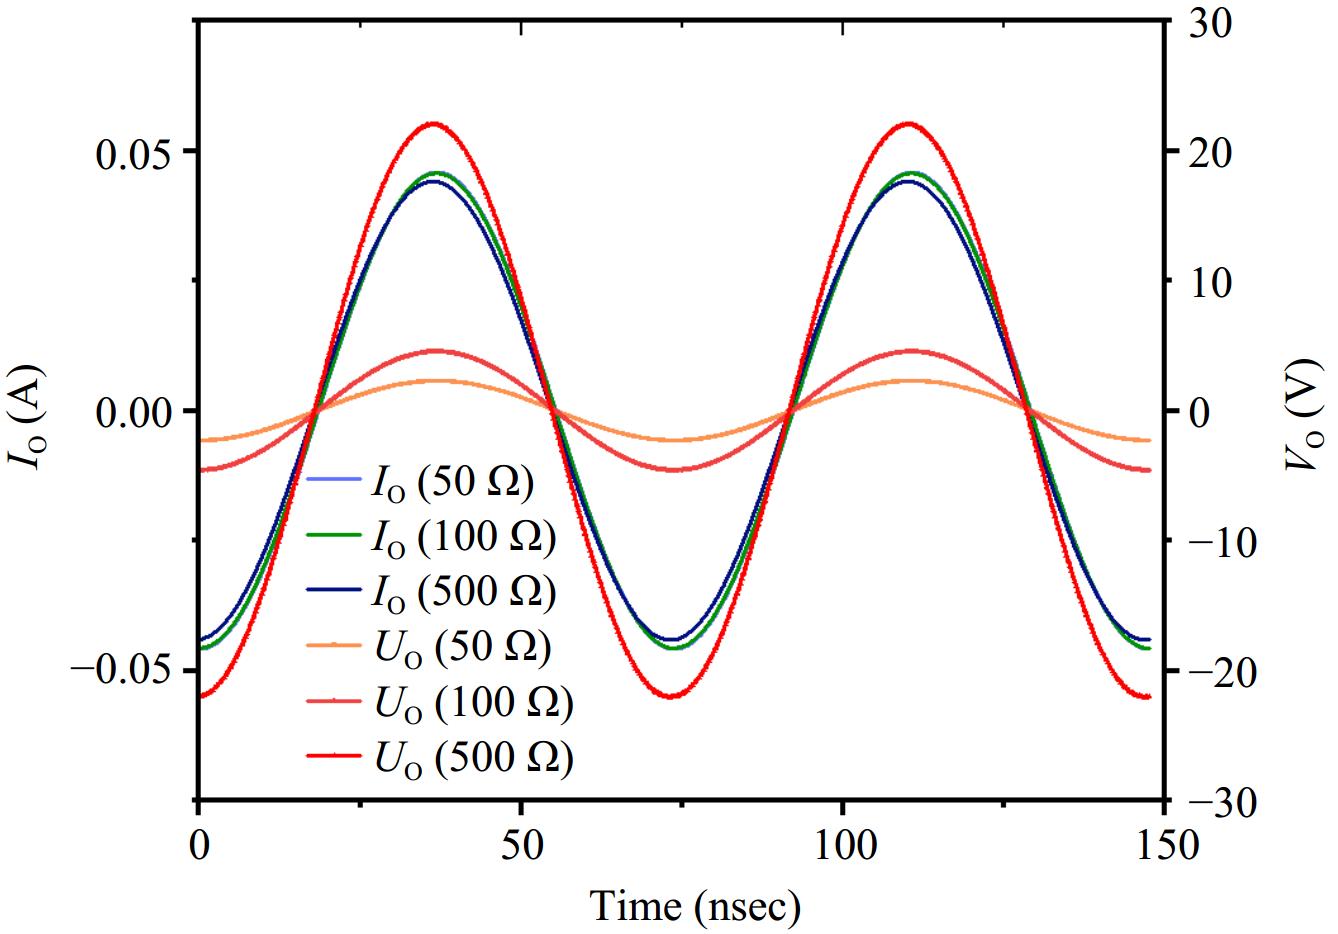
Figure 18.
Waveforms of load-side voltage and current under different loads.
-
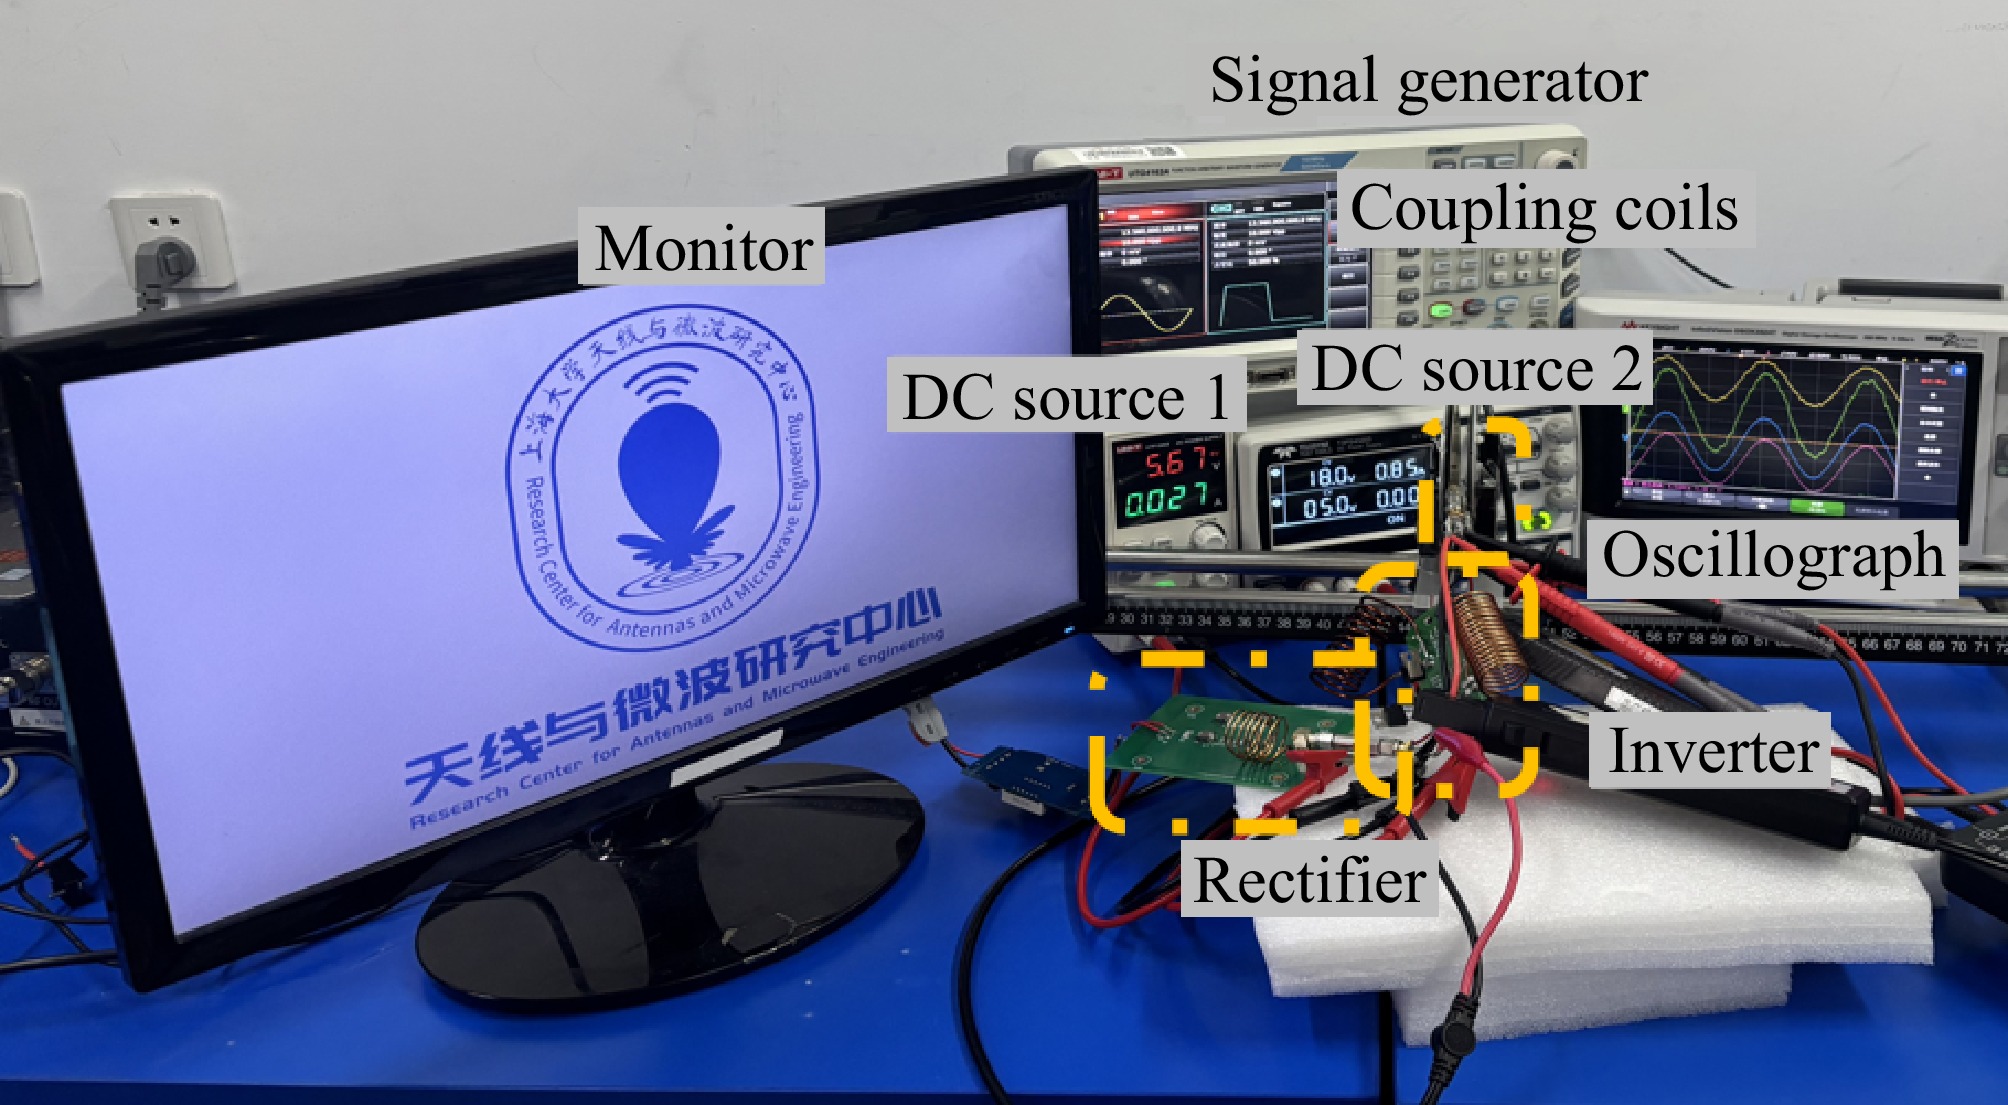
Figure 19.
Test platform for DC-DC systems based on PAWC (coil spacing: 5 mm), used in monitor illumination experiments.
-
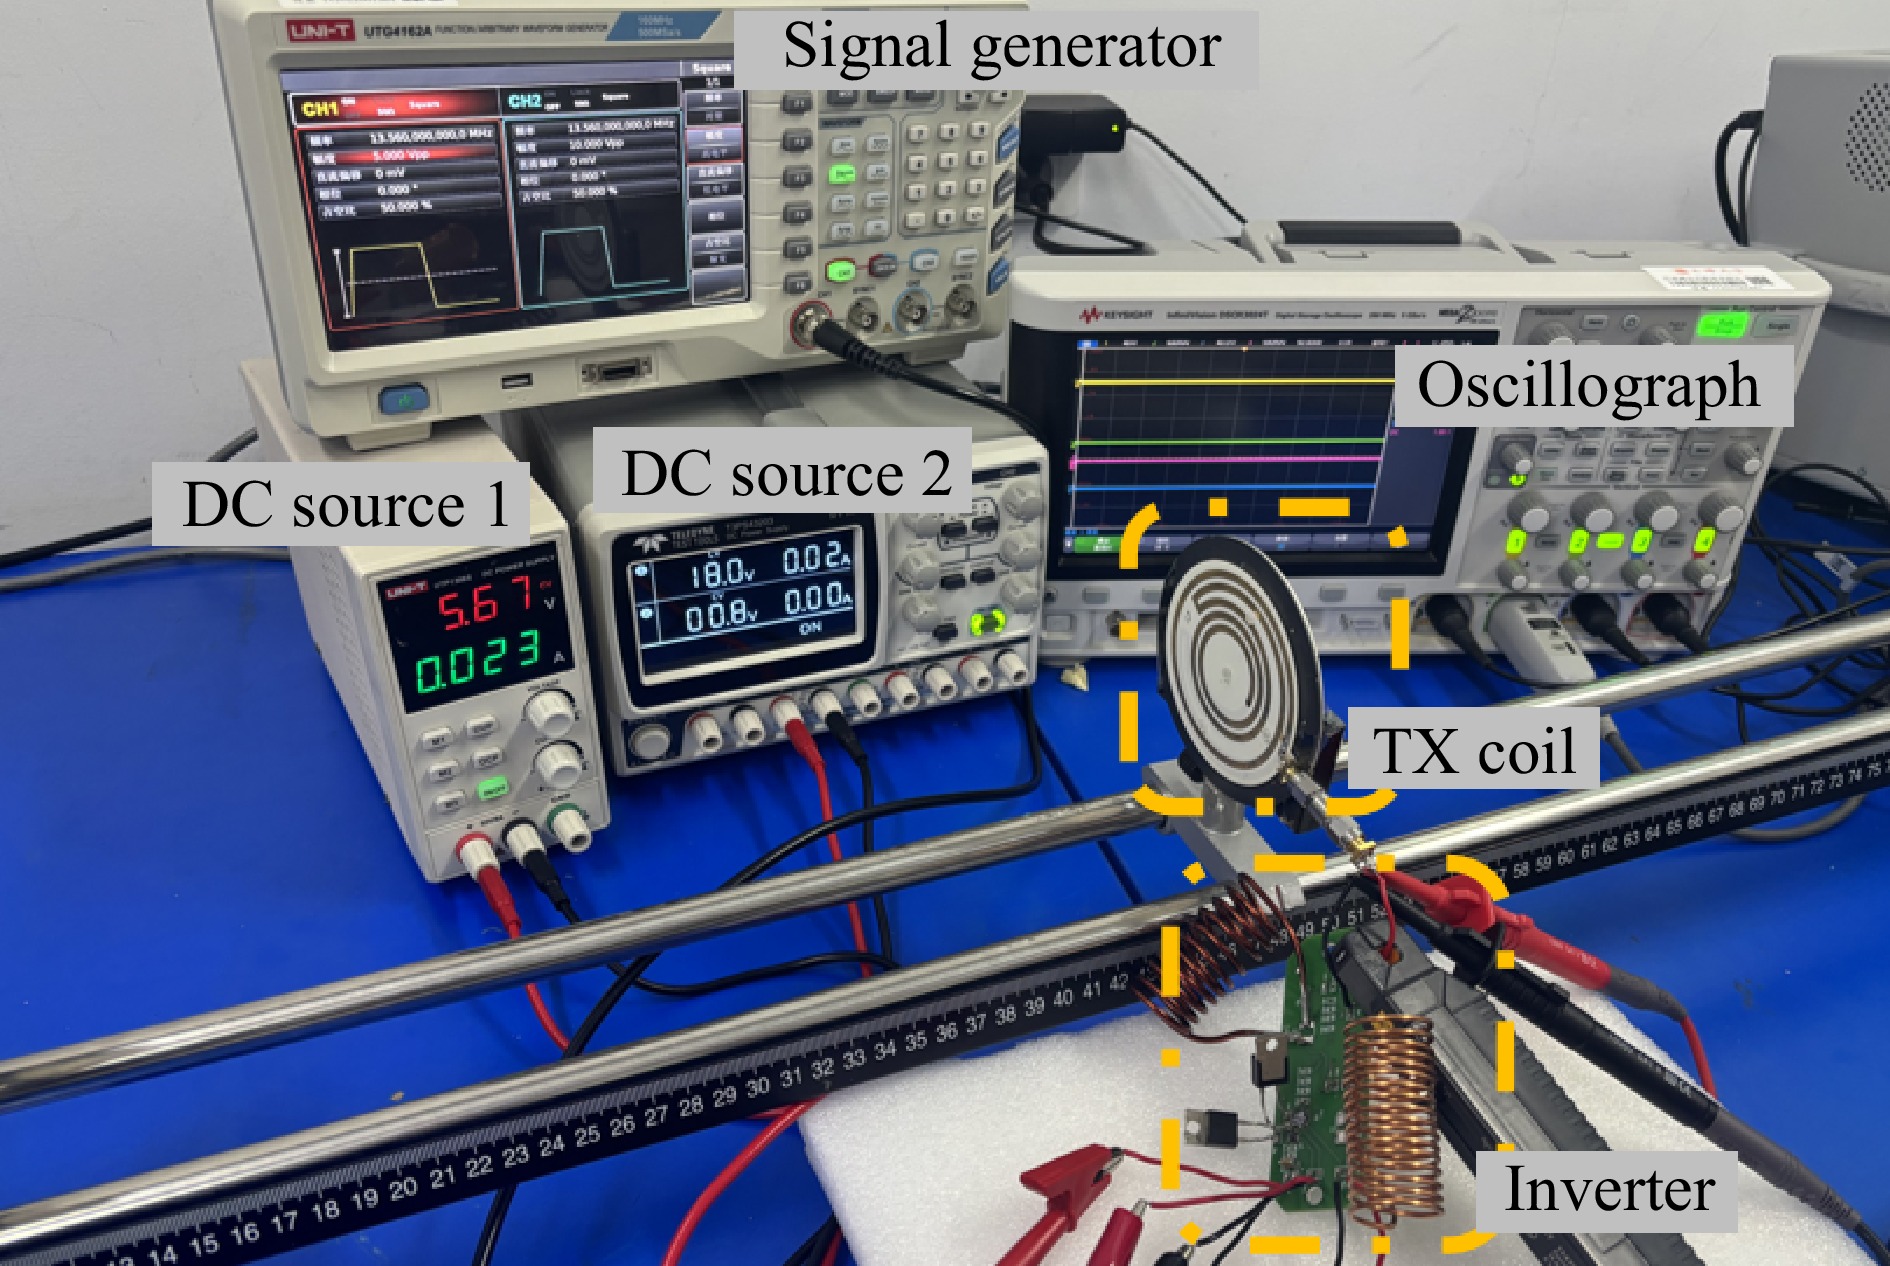
Figure 20.
PAWC system automatic shutdown validation via receiver disconnection.
Figures
(20)
Tables
(0)