-
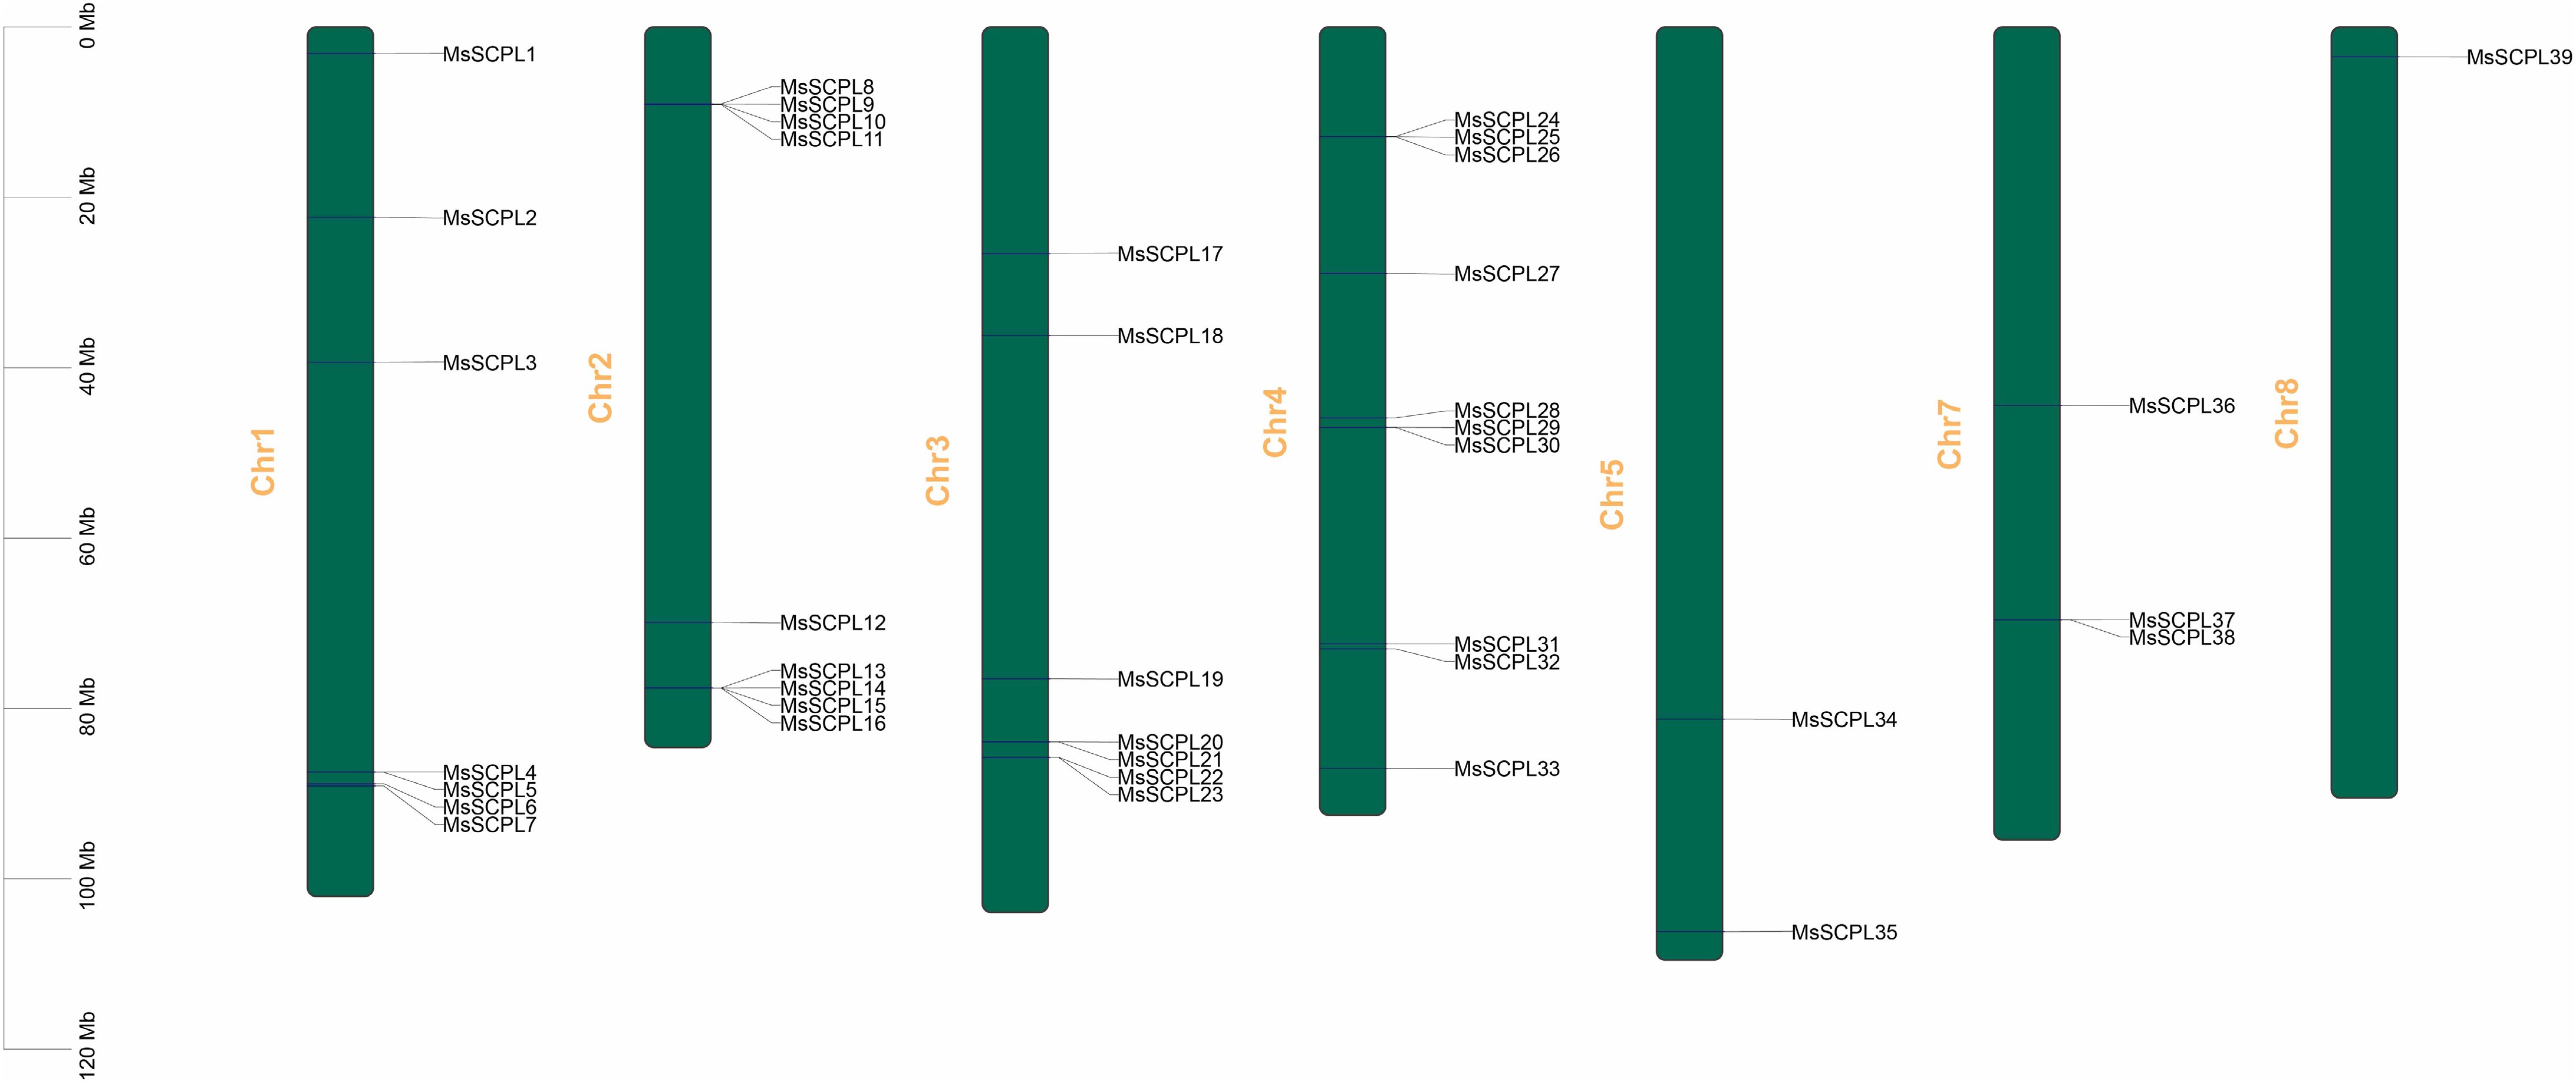
Figure 1.
Chromosomal positions of members of the SCPL gene family in alfalfa.
-
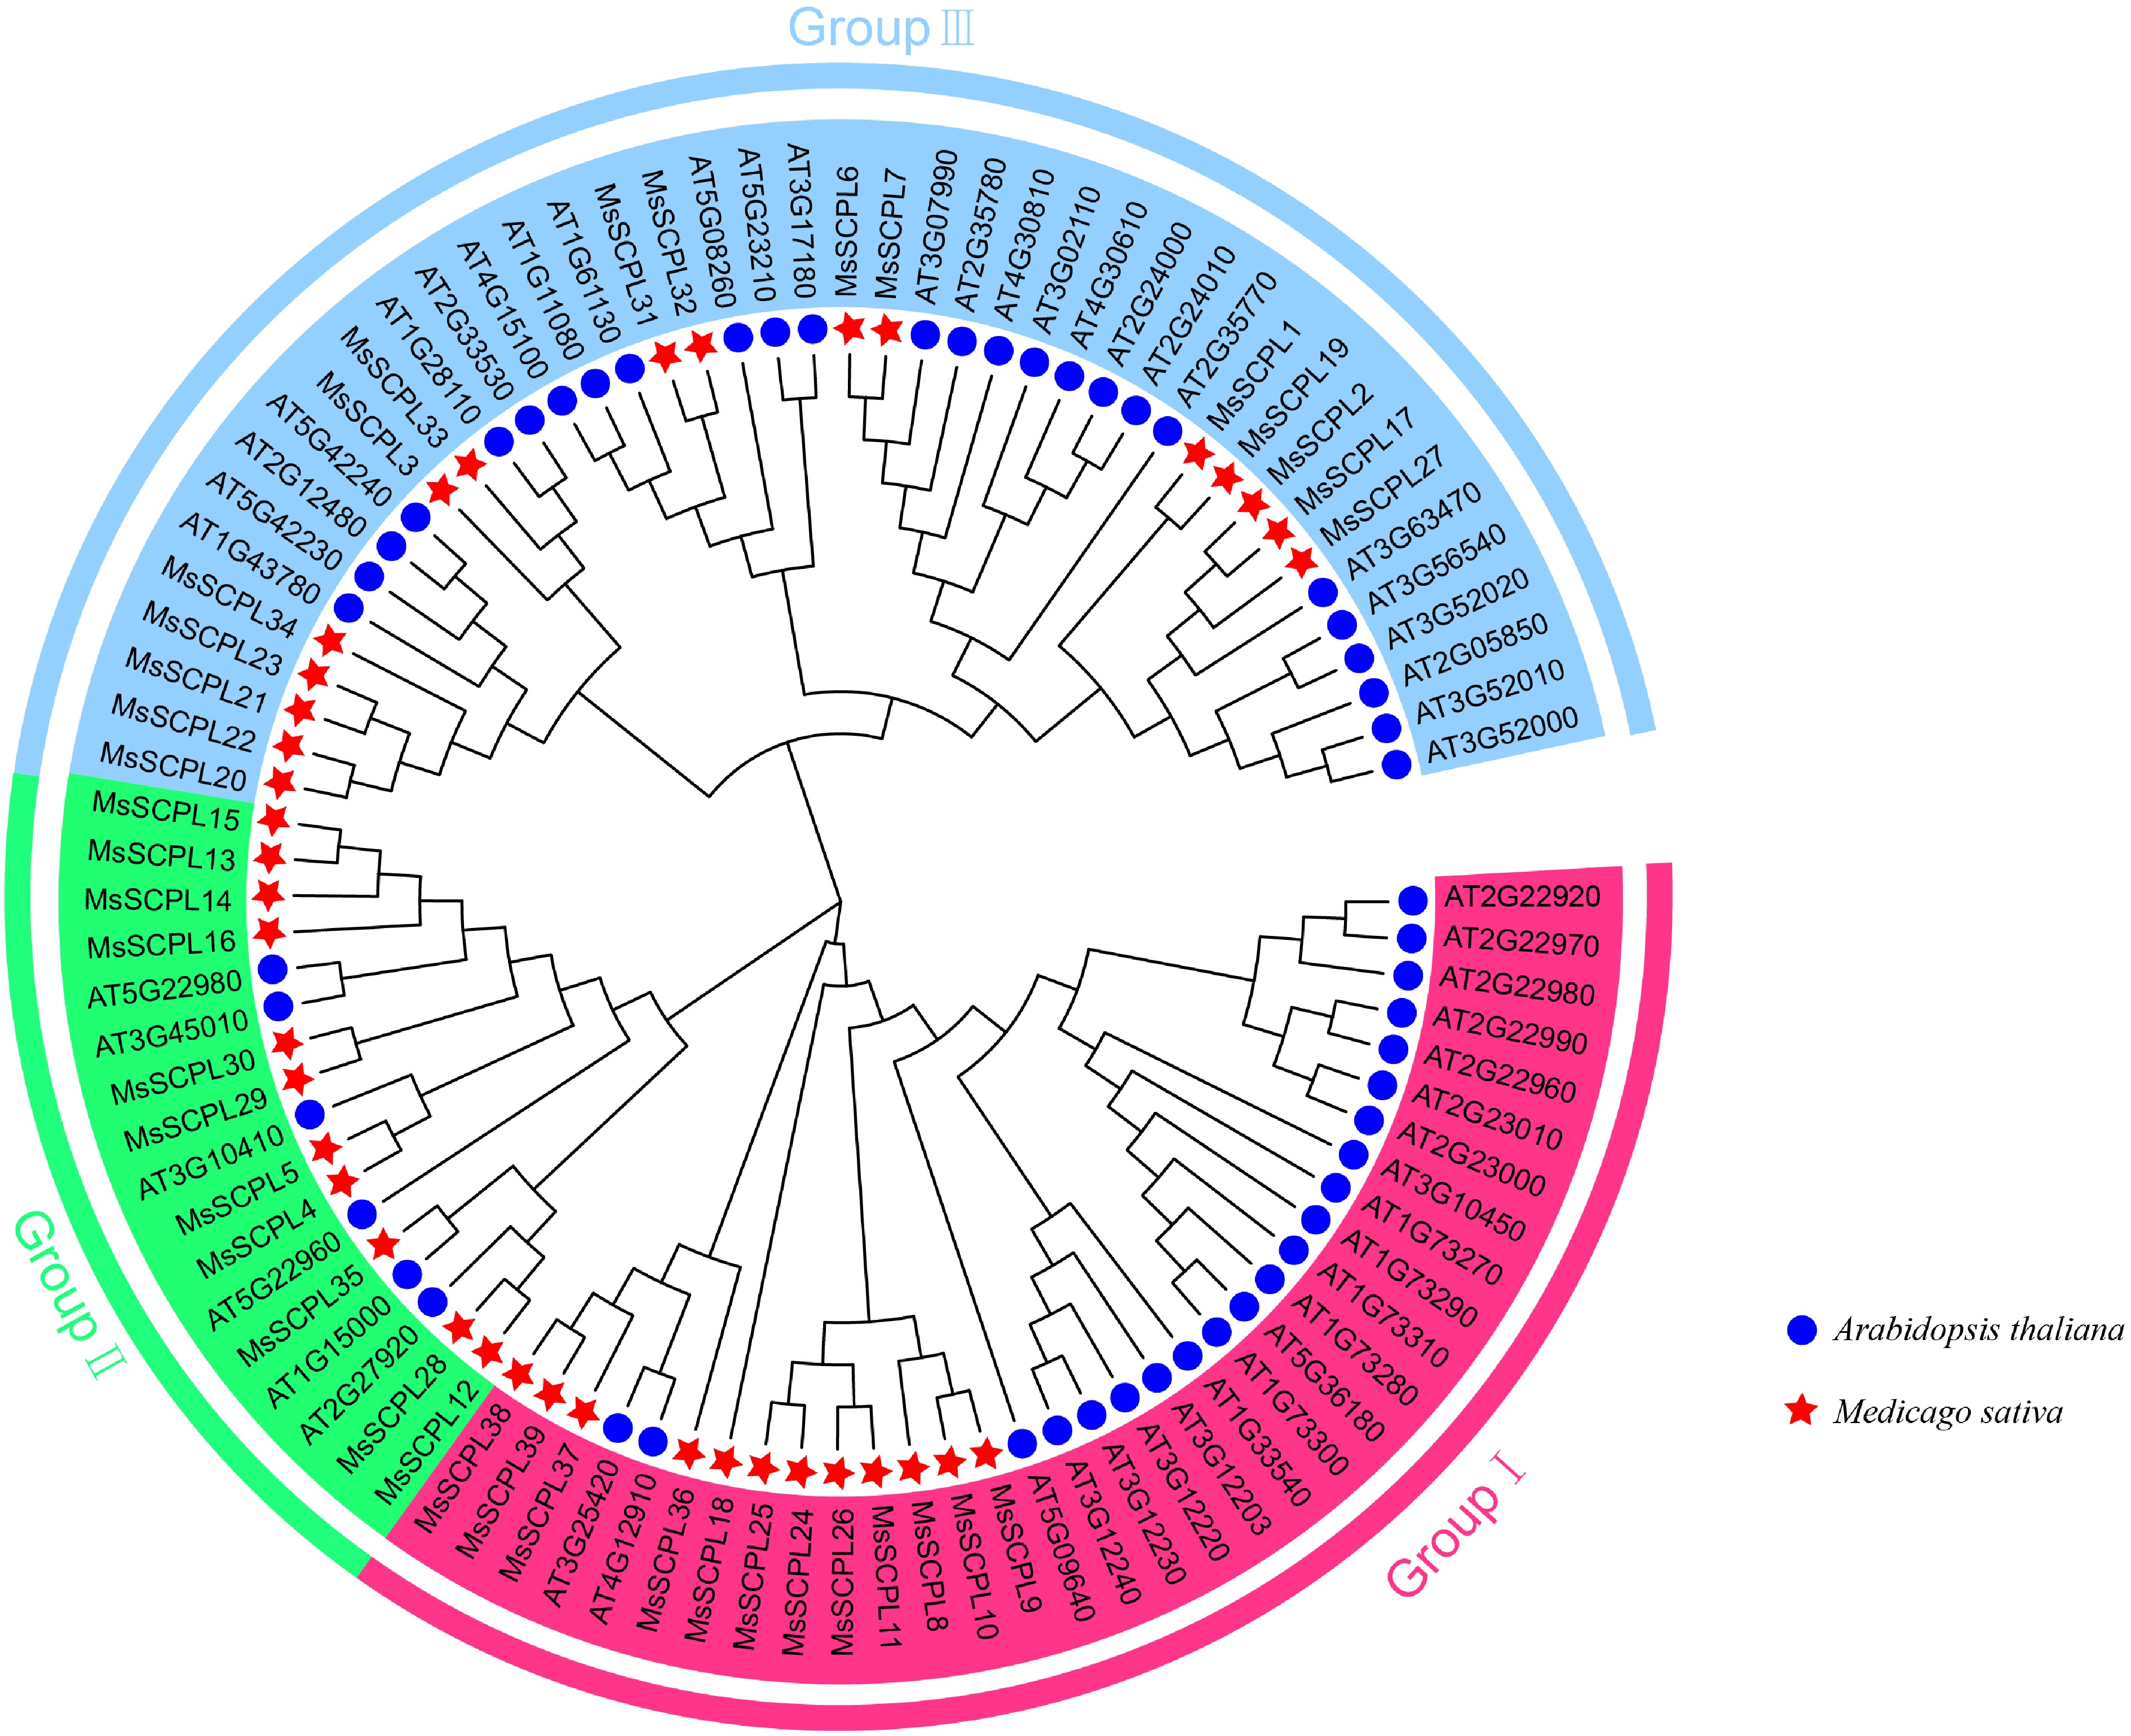
Figure 2.
Phylogenetic tree of the SCPL gene family in A. thaliana and M. sativa.
-
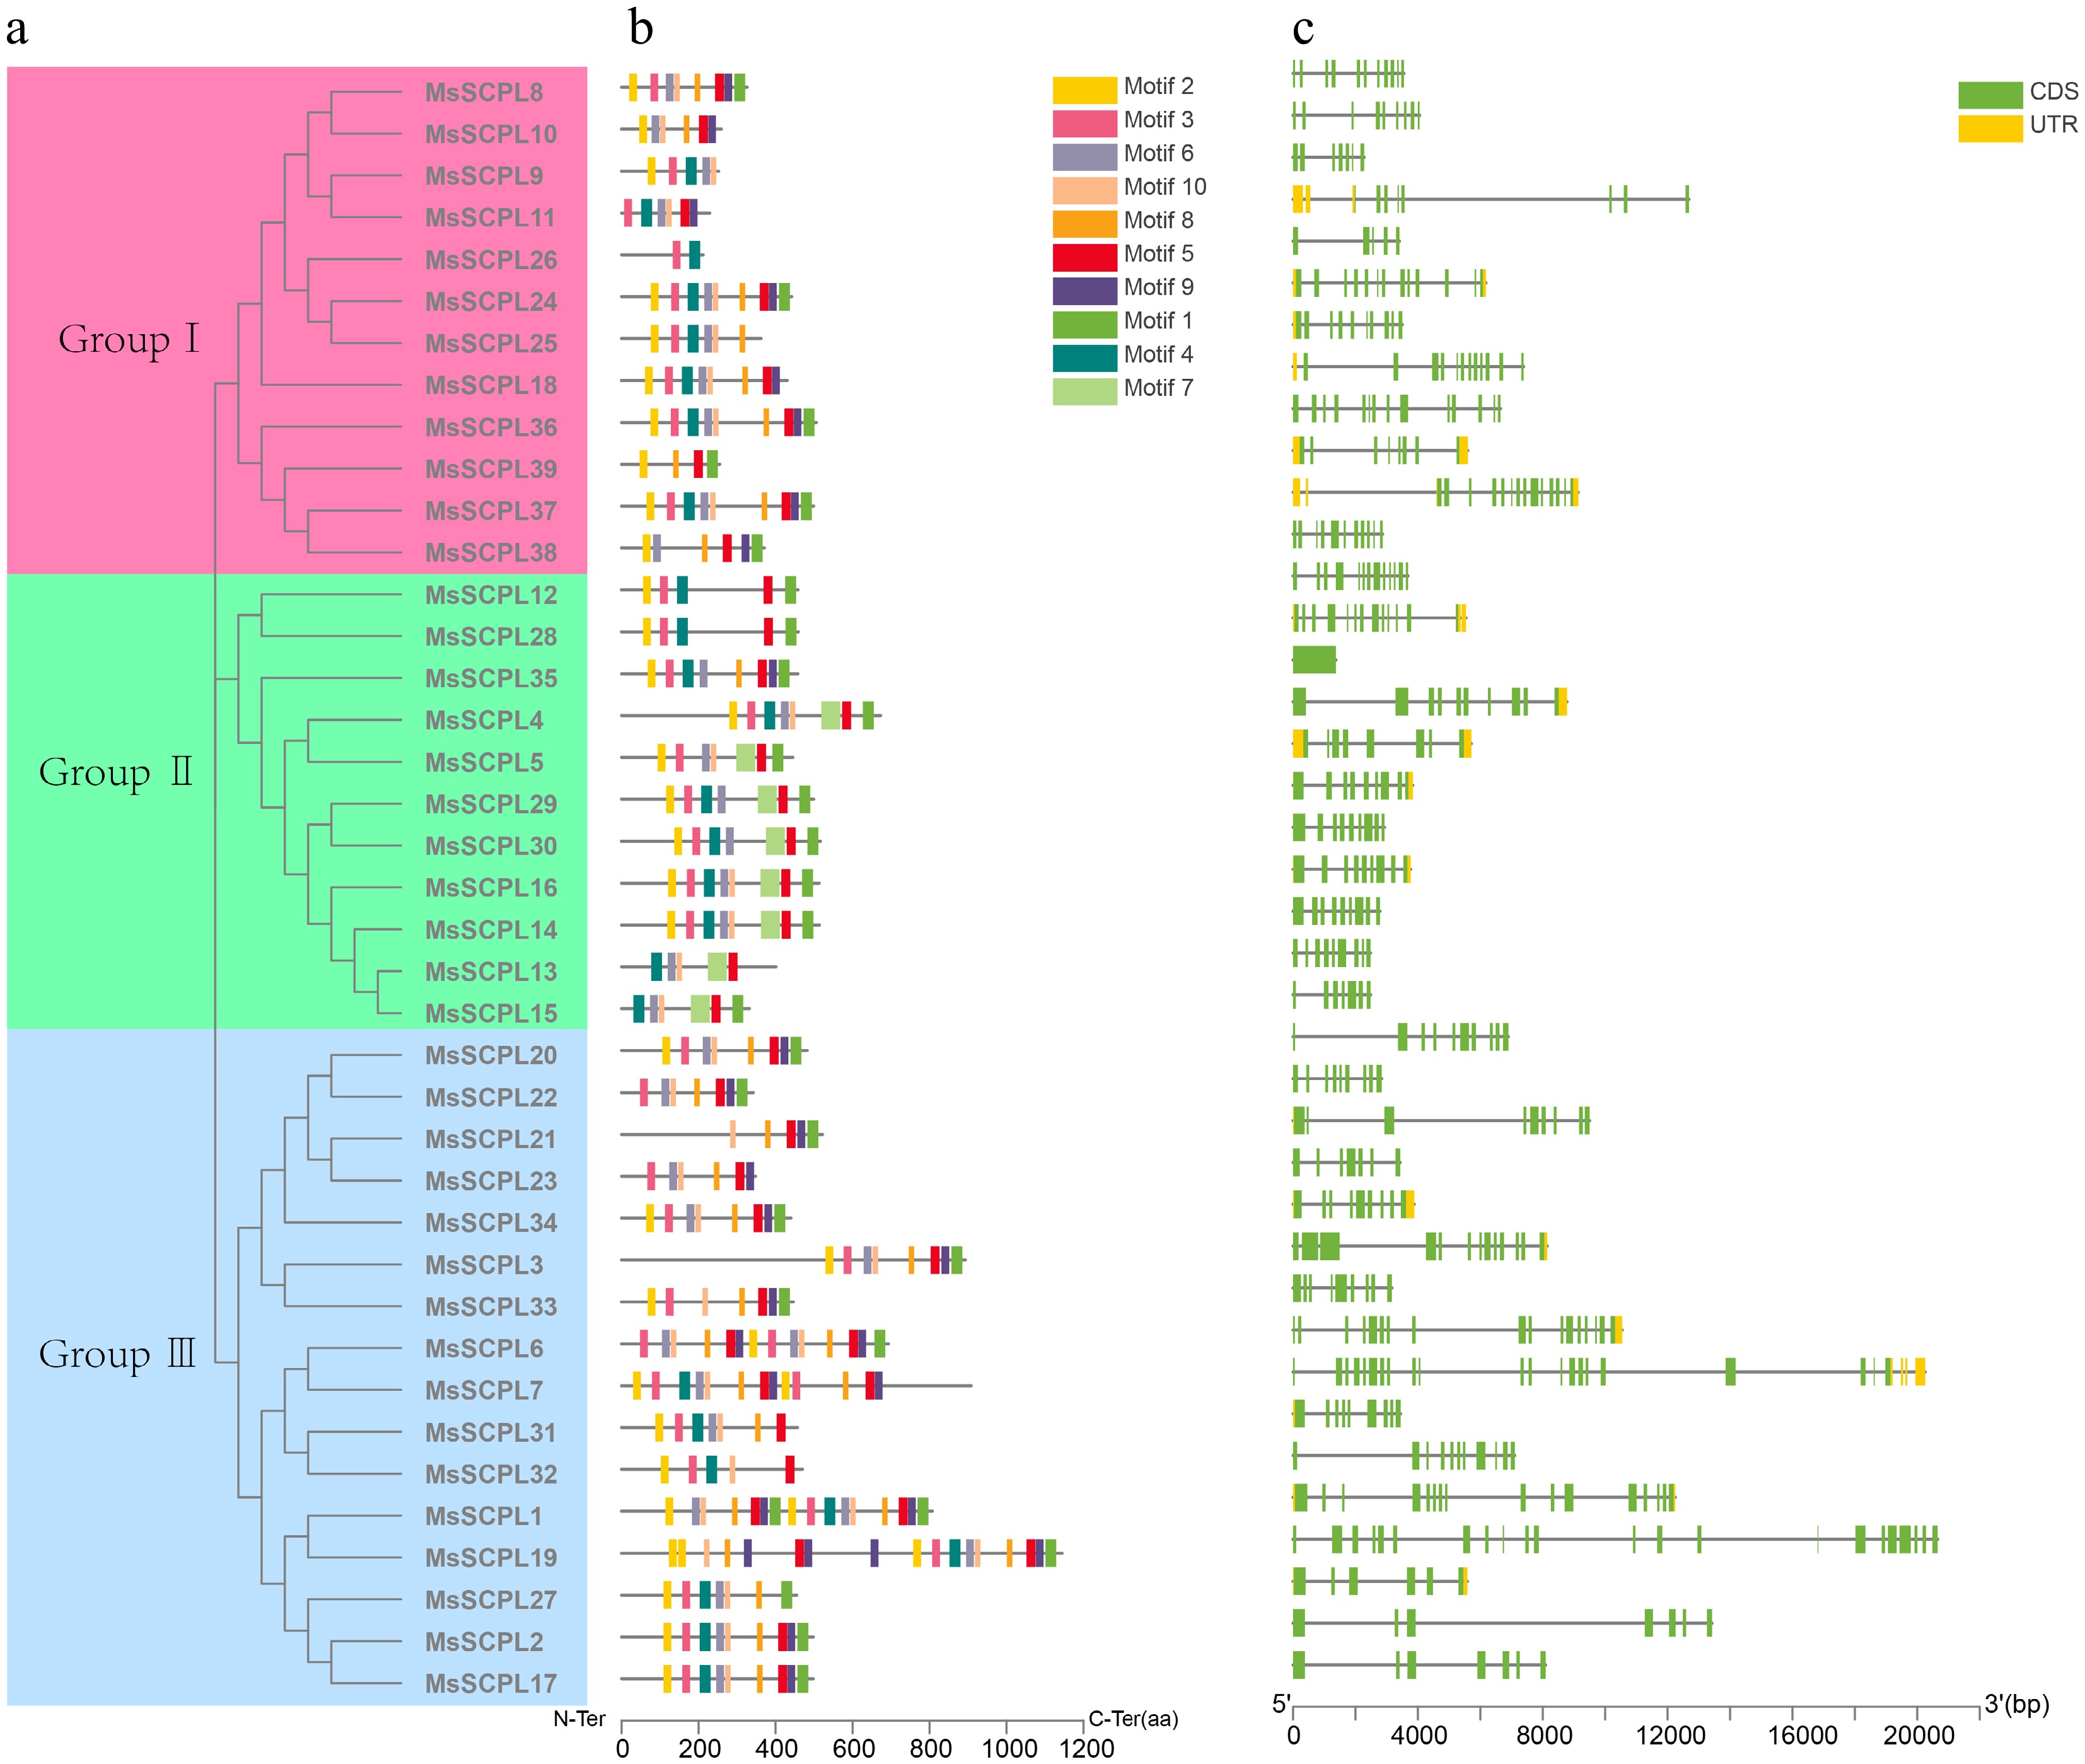
Figure 3.
Structural characterization of SCPL in alfalfa. (a) Phylogenetic analysis of proteins. (b) Predicted motifs of proteins. (c) Exon-intron structure of the gene.
-
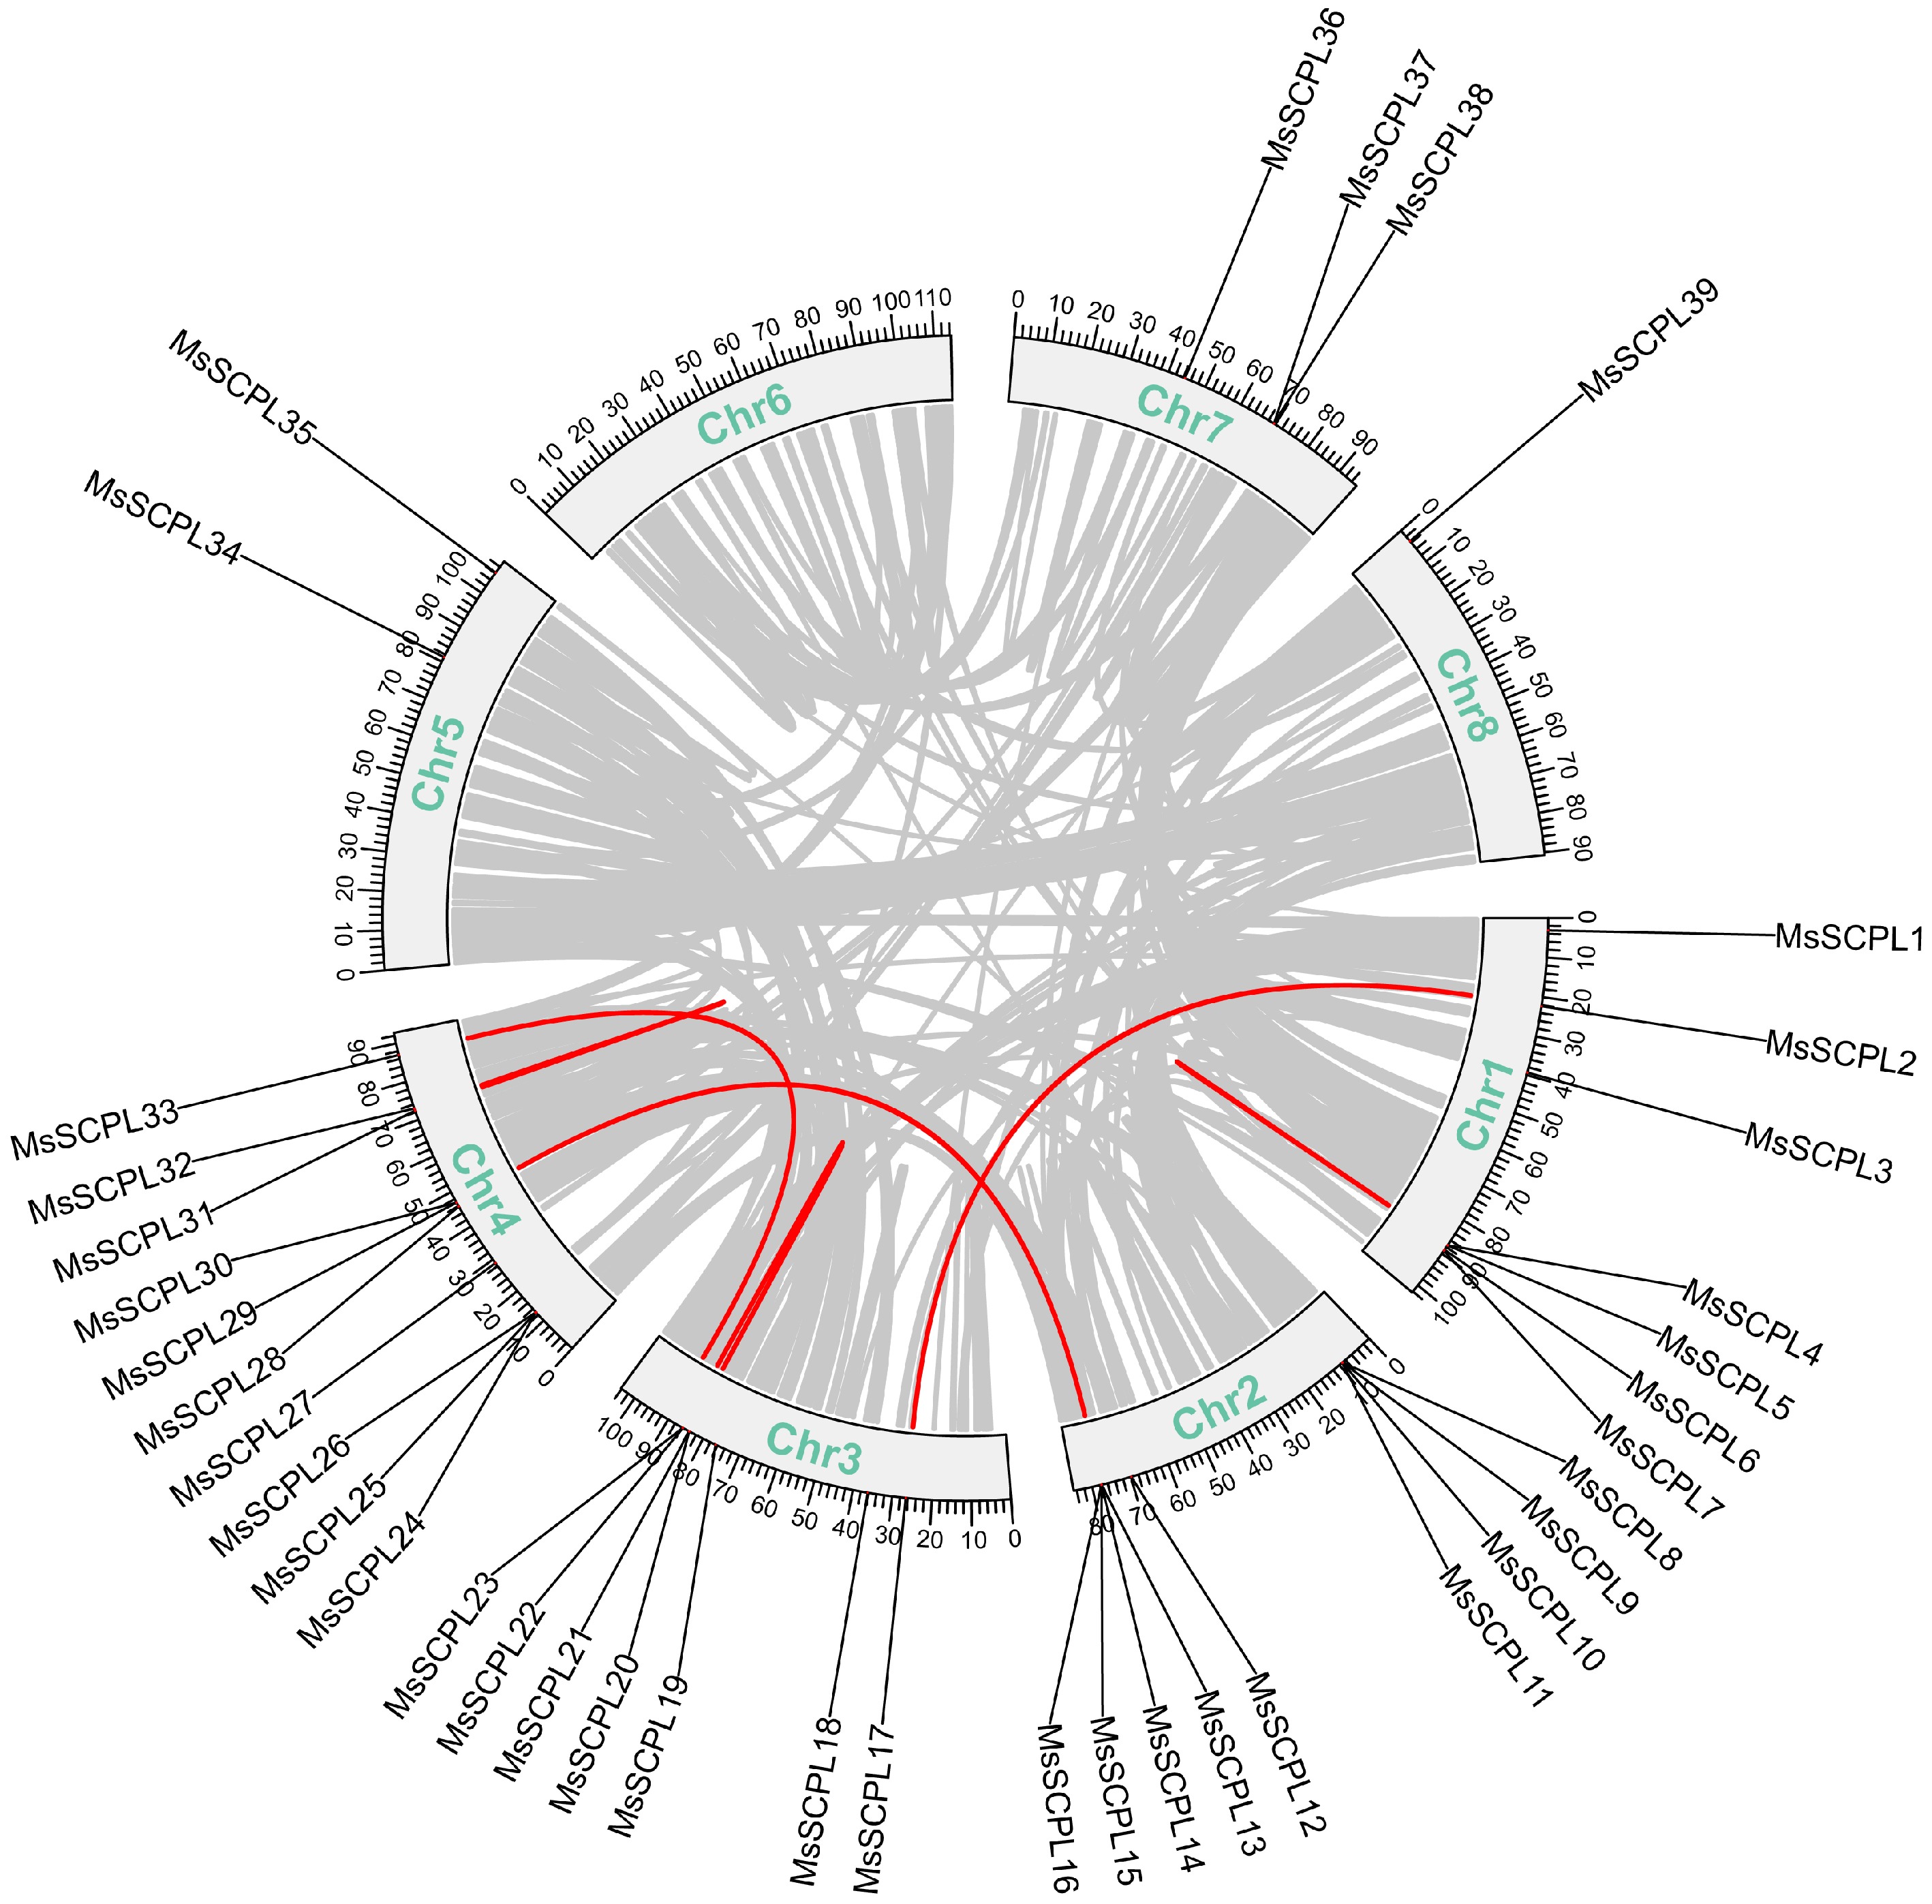
Figure 4.
Schematic representation of collinear connections of the gene in alfalfa. Segmental duplication events in the alfalfa genome are indicated in red, while collinear blocks are represented by grey lines.
-
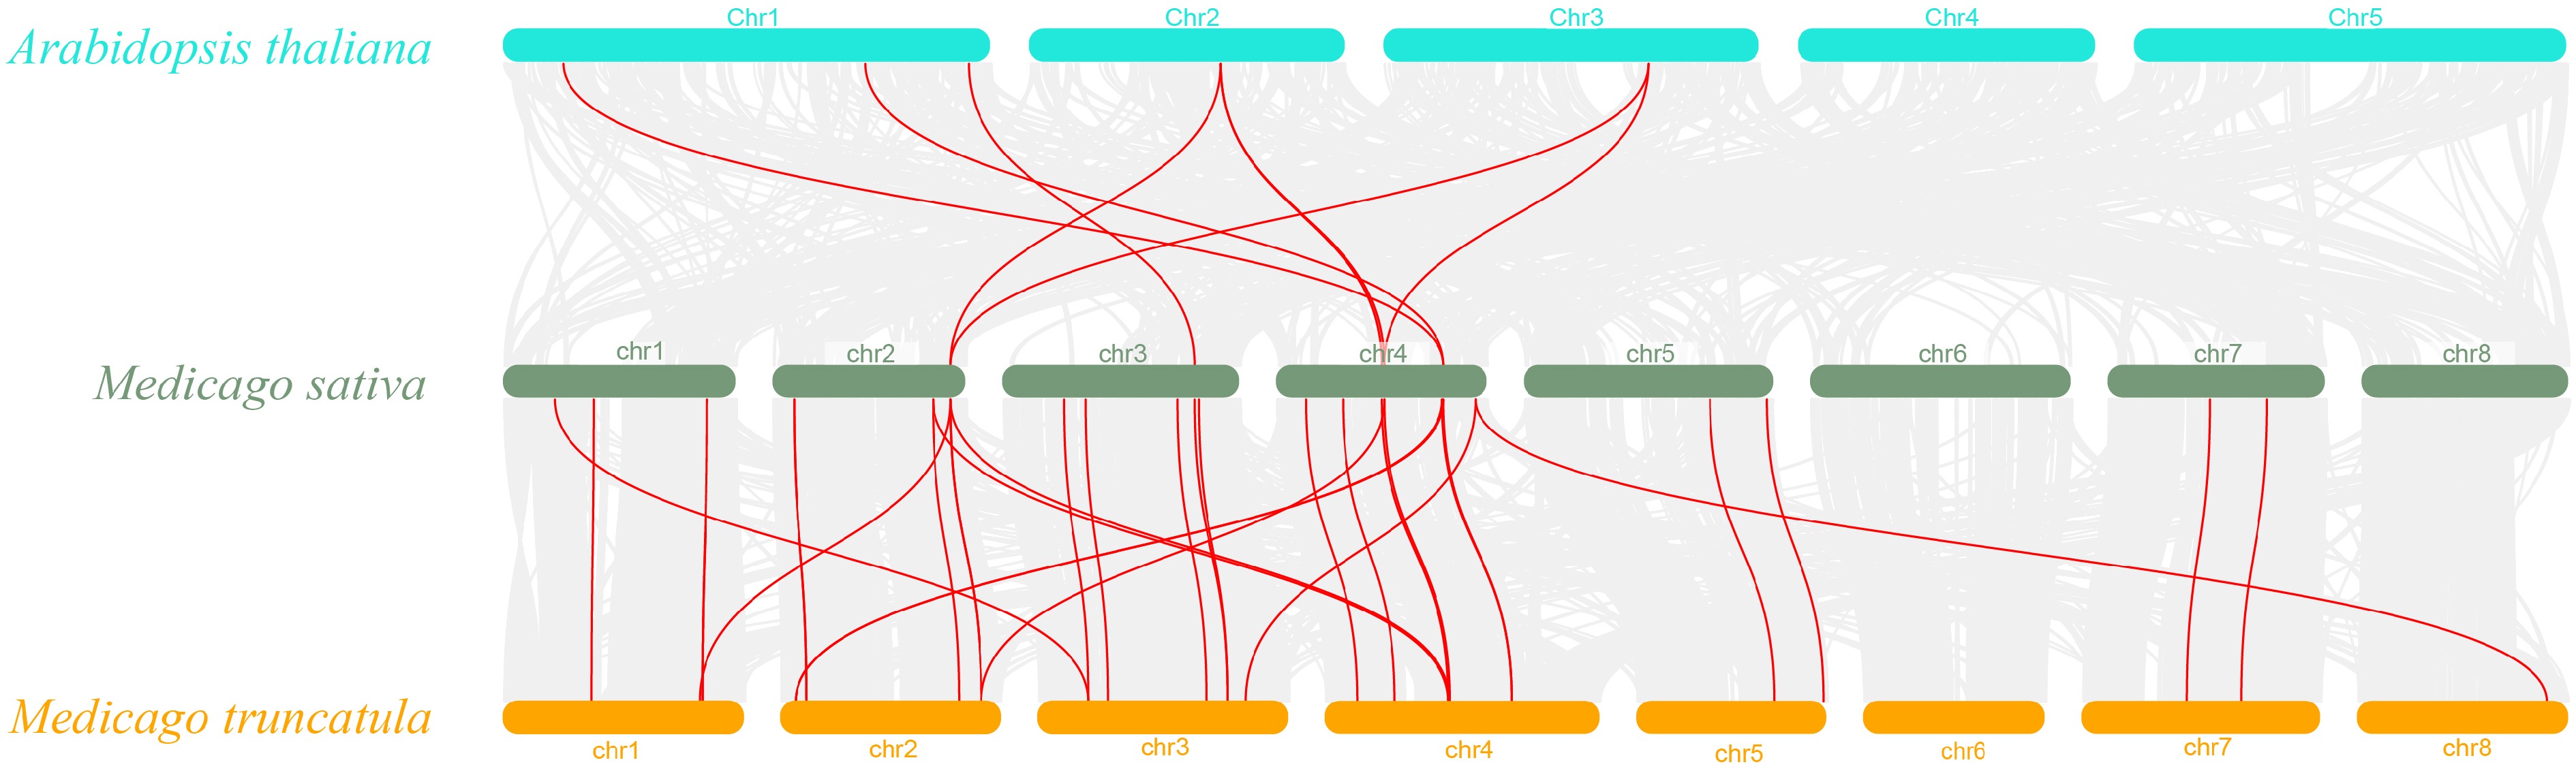
Figure 5.
Synteny analysis of the SCPL gene between M. sativa and two representative plant species. Red lines highlight co-linear SCPL gene pairs, while grey lines in the background illustrate co-linear blocks between M. sativa and the selected plant species.
-
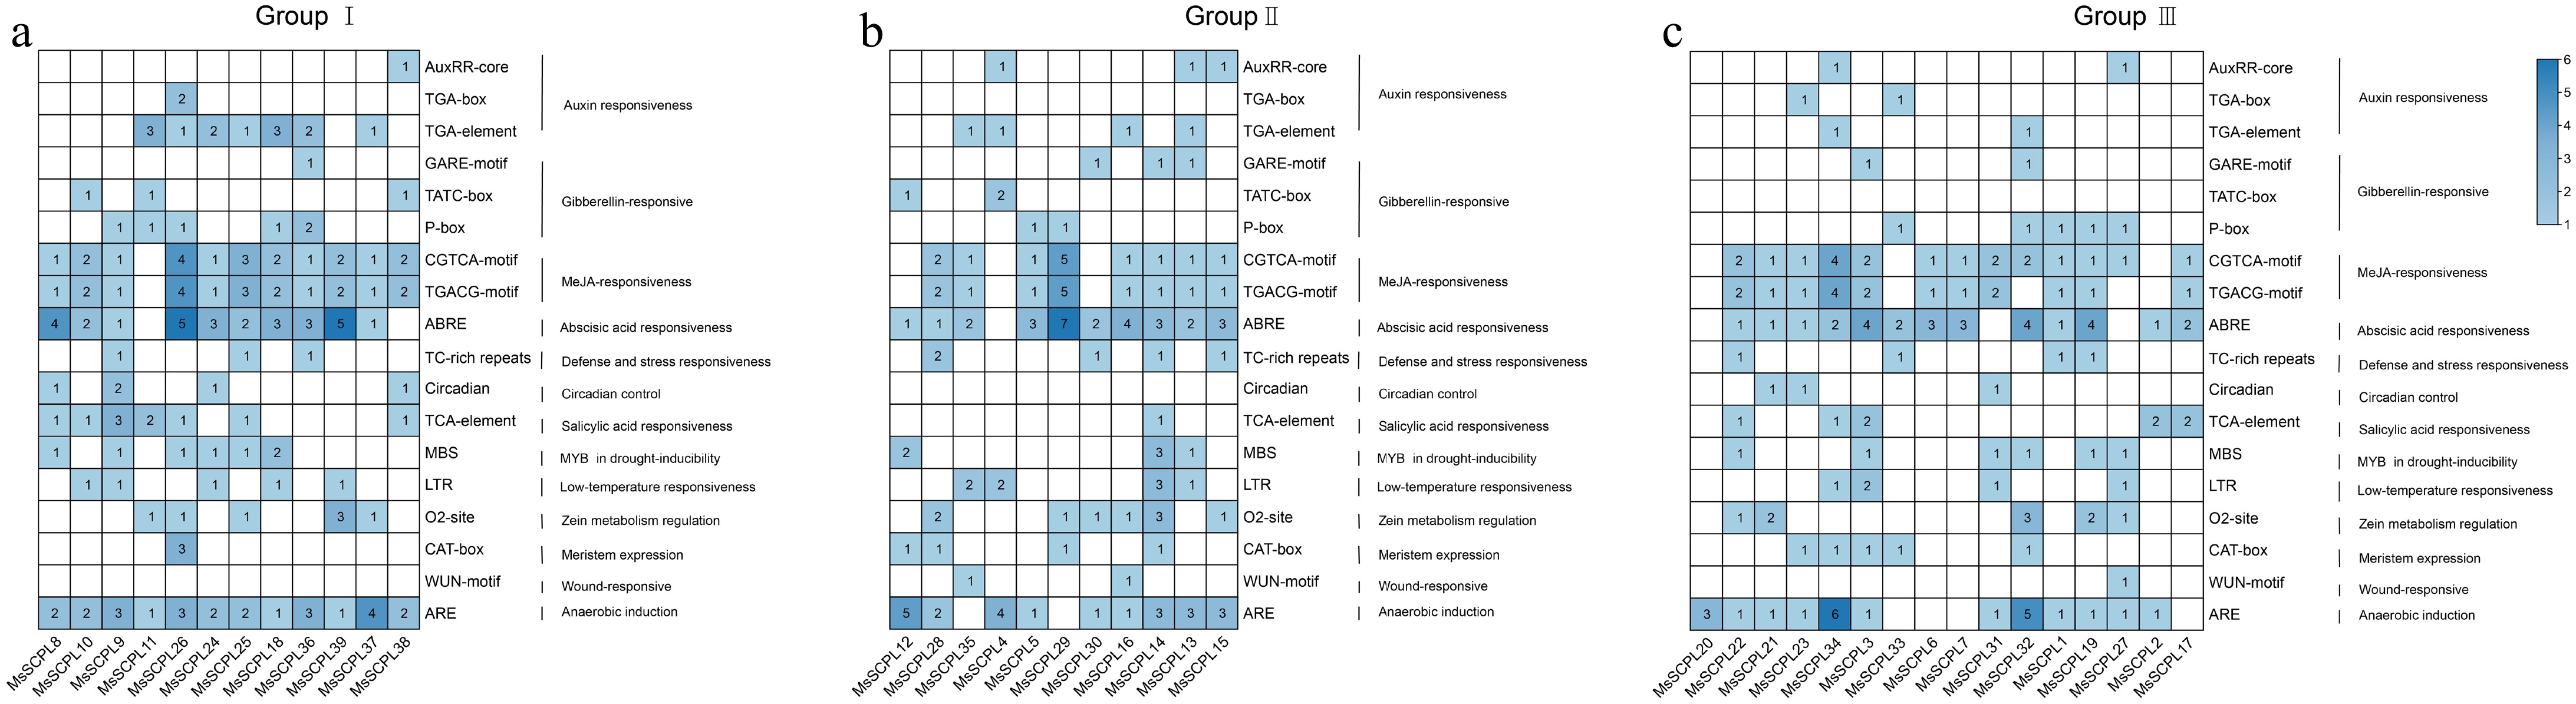
Figure 6.
Analysis of cis-acting elements in alfalfa SCPLs. (a) Panel represents the cis-acting elements of gene family members from Group I. (b) Panel represents the cis-acting elements of gene family members from Group II. (c) Panel represents the cis-acting elements of gene family members from Group III.
-
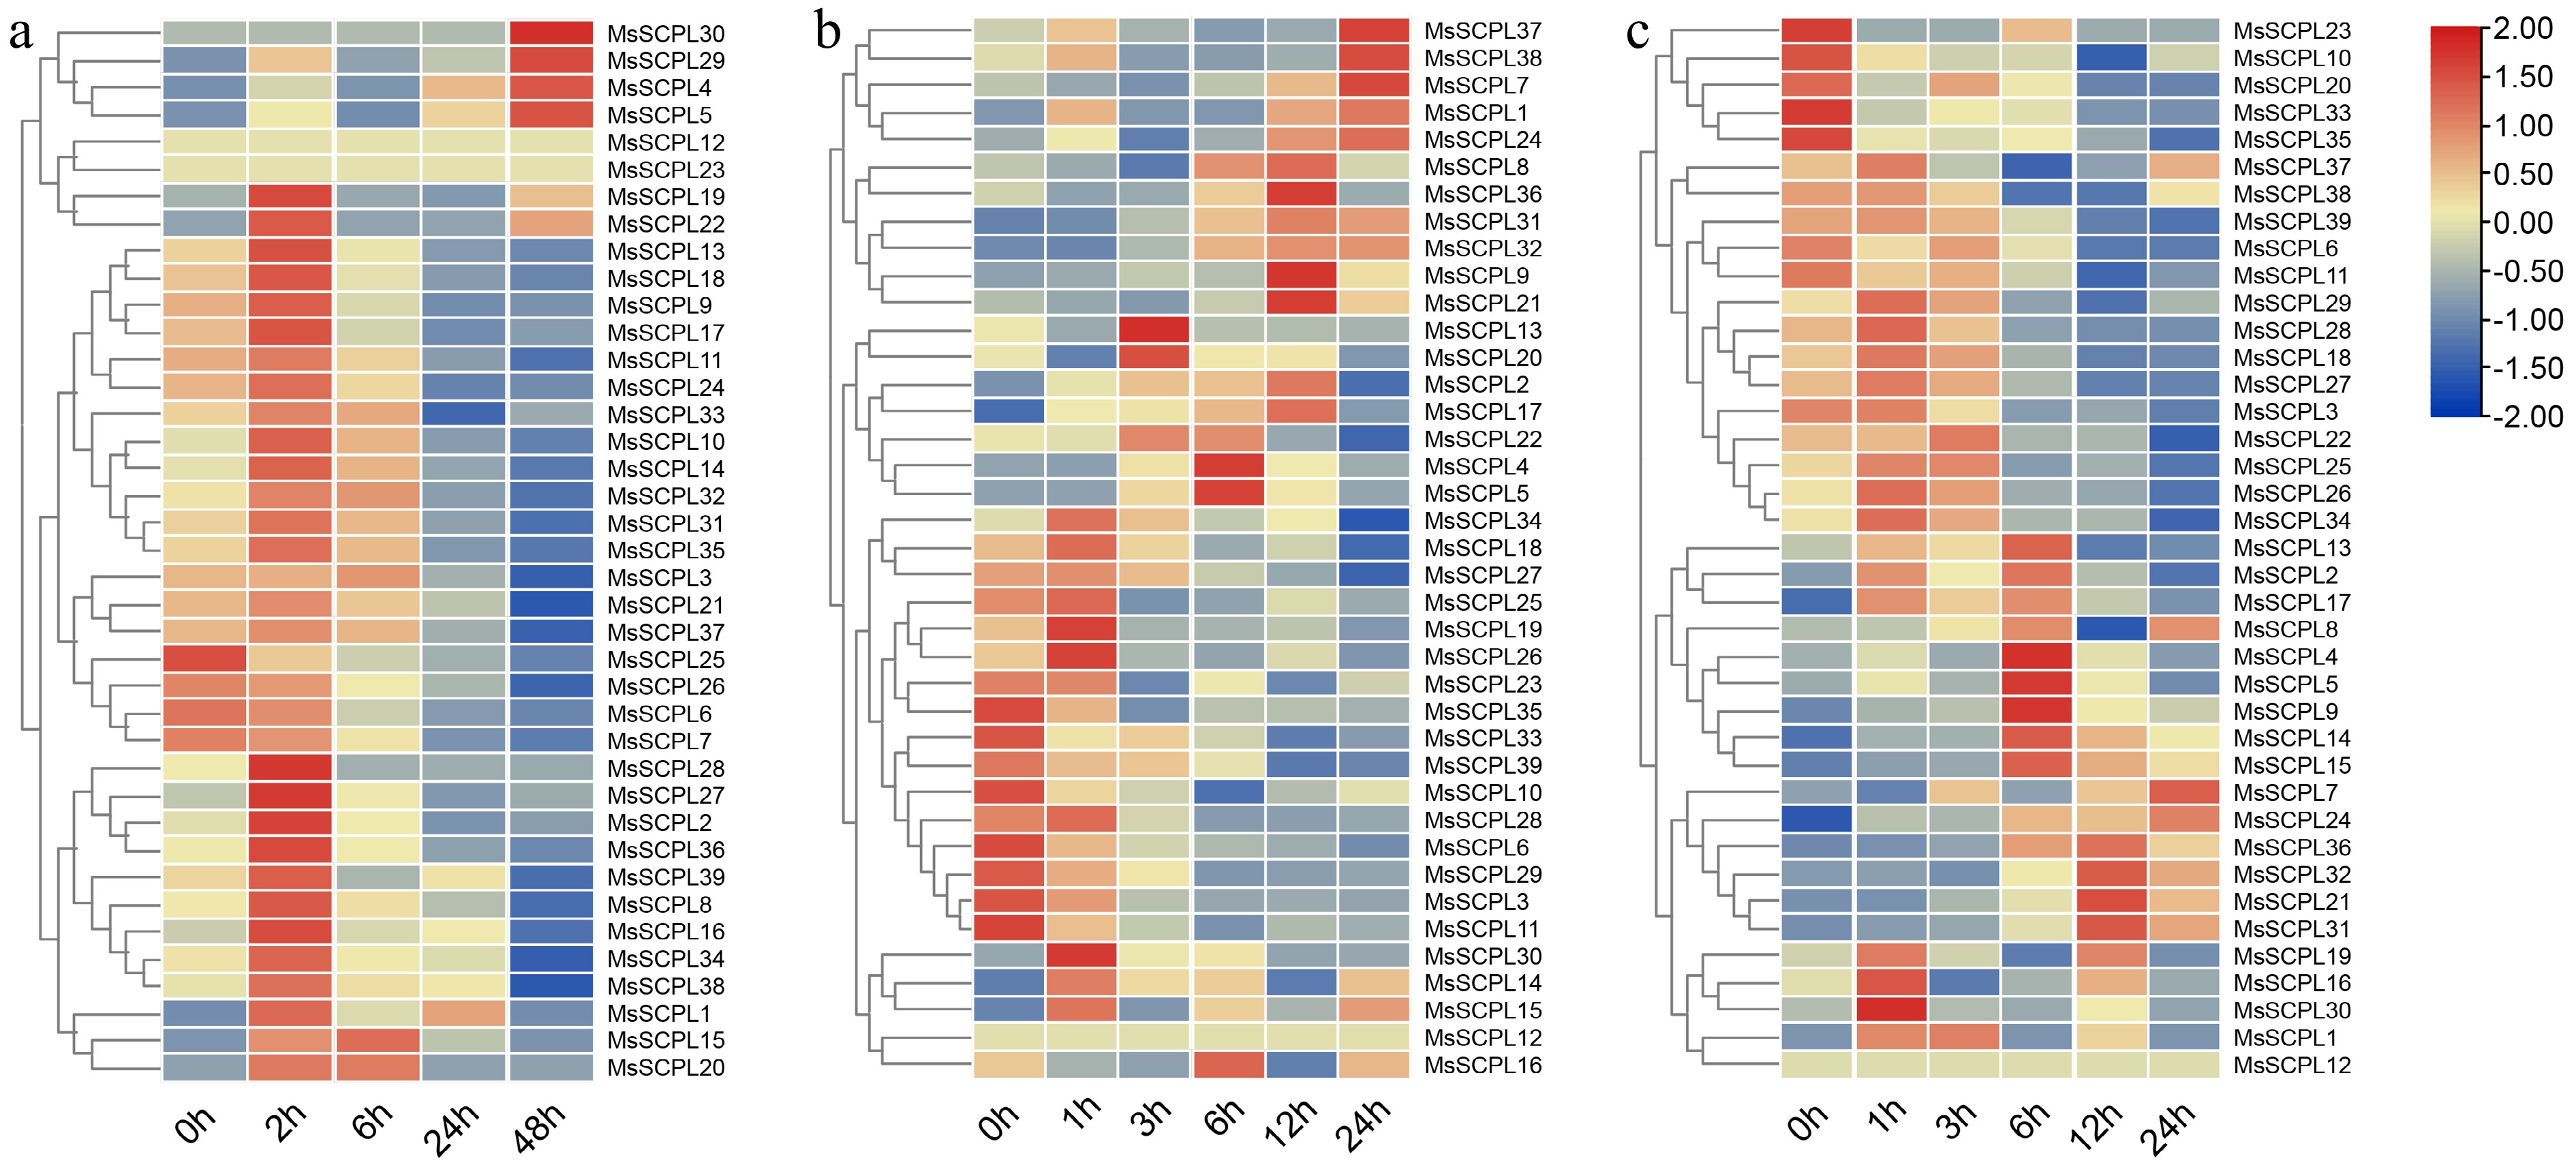
Figure 7.
Expression of genes in response to cold, salt, and drought conditions. (a) Expression of genes under cold stress. (b) Expression of genes under salt stress. (c) Expression of genes under drought stress.
-
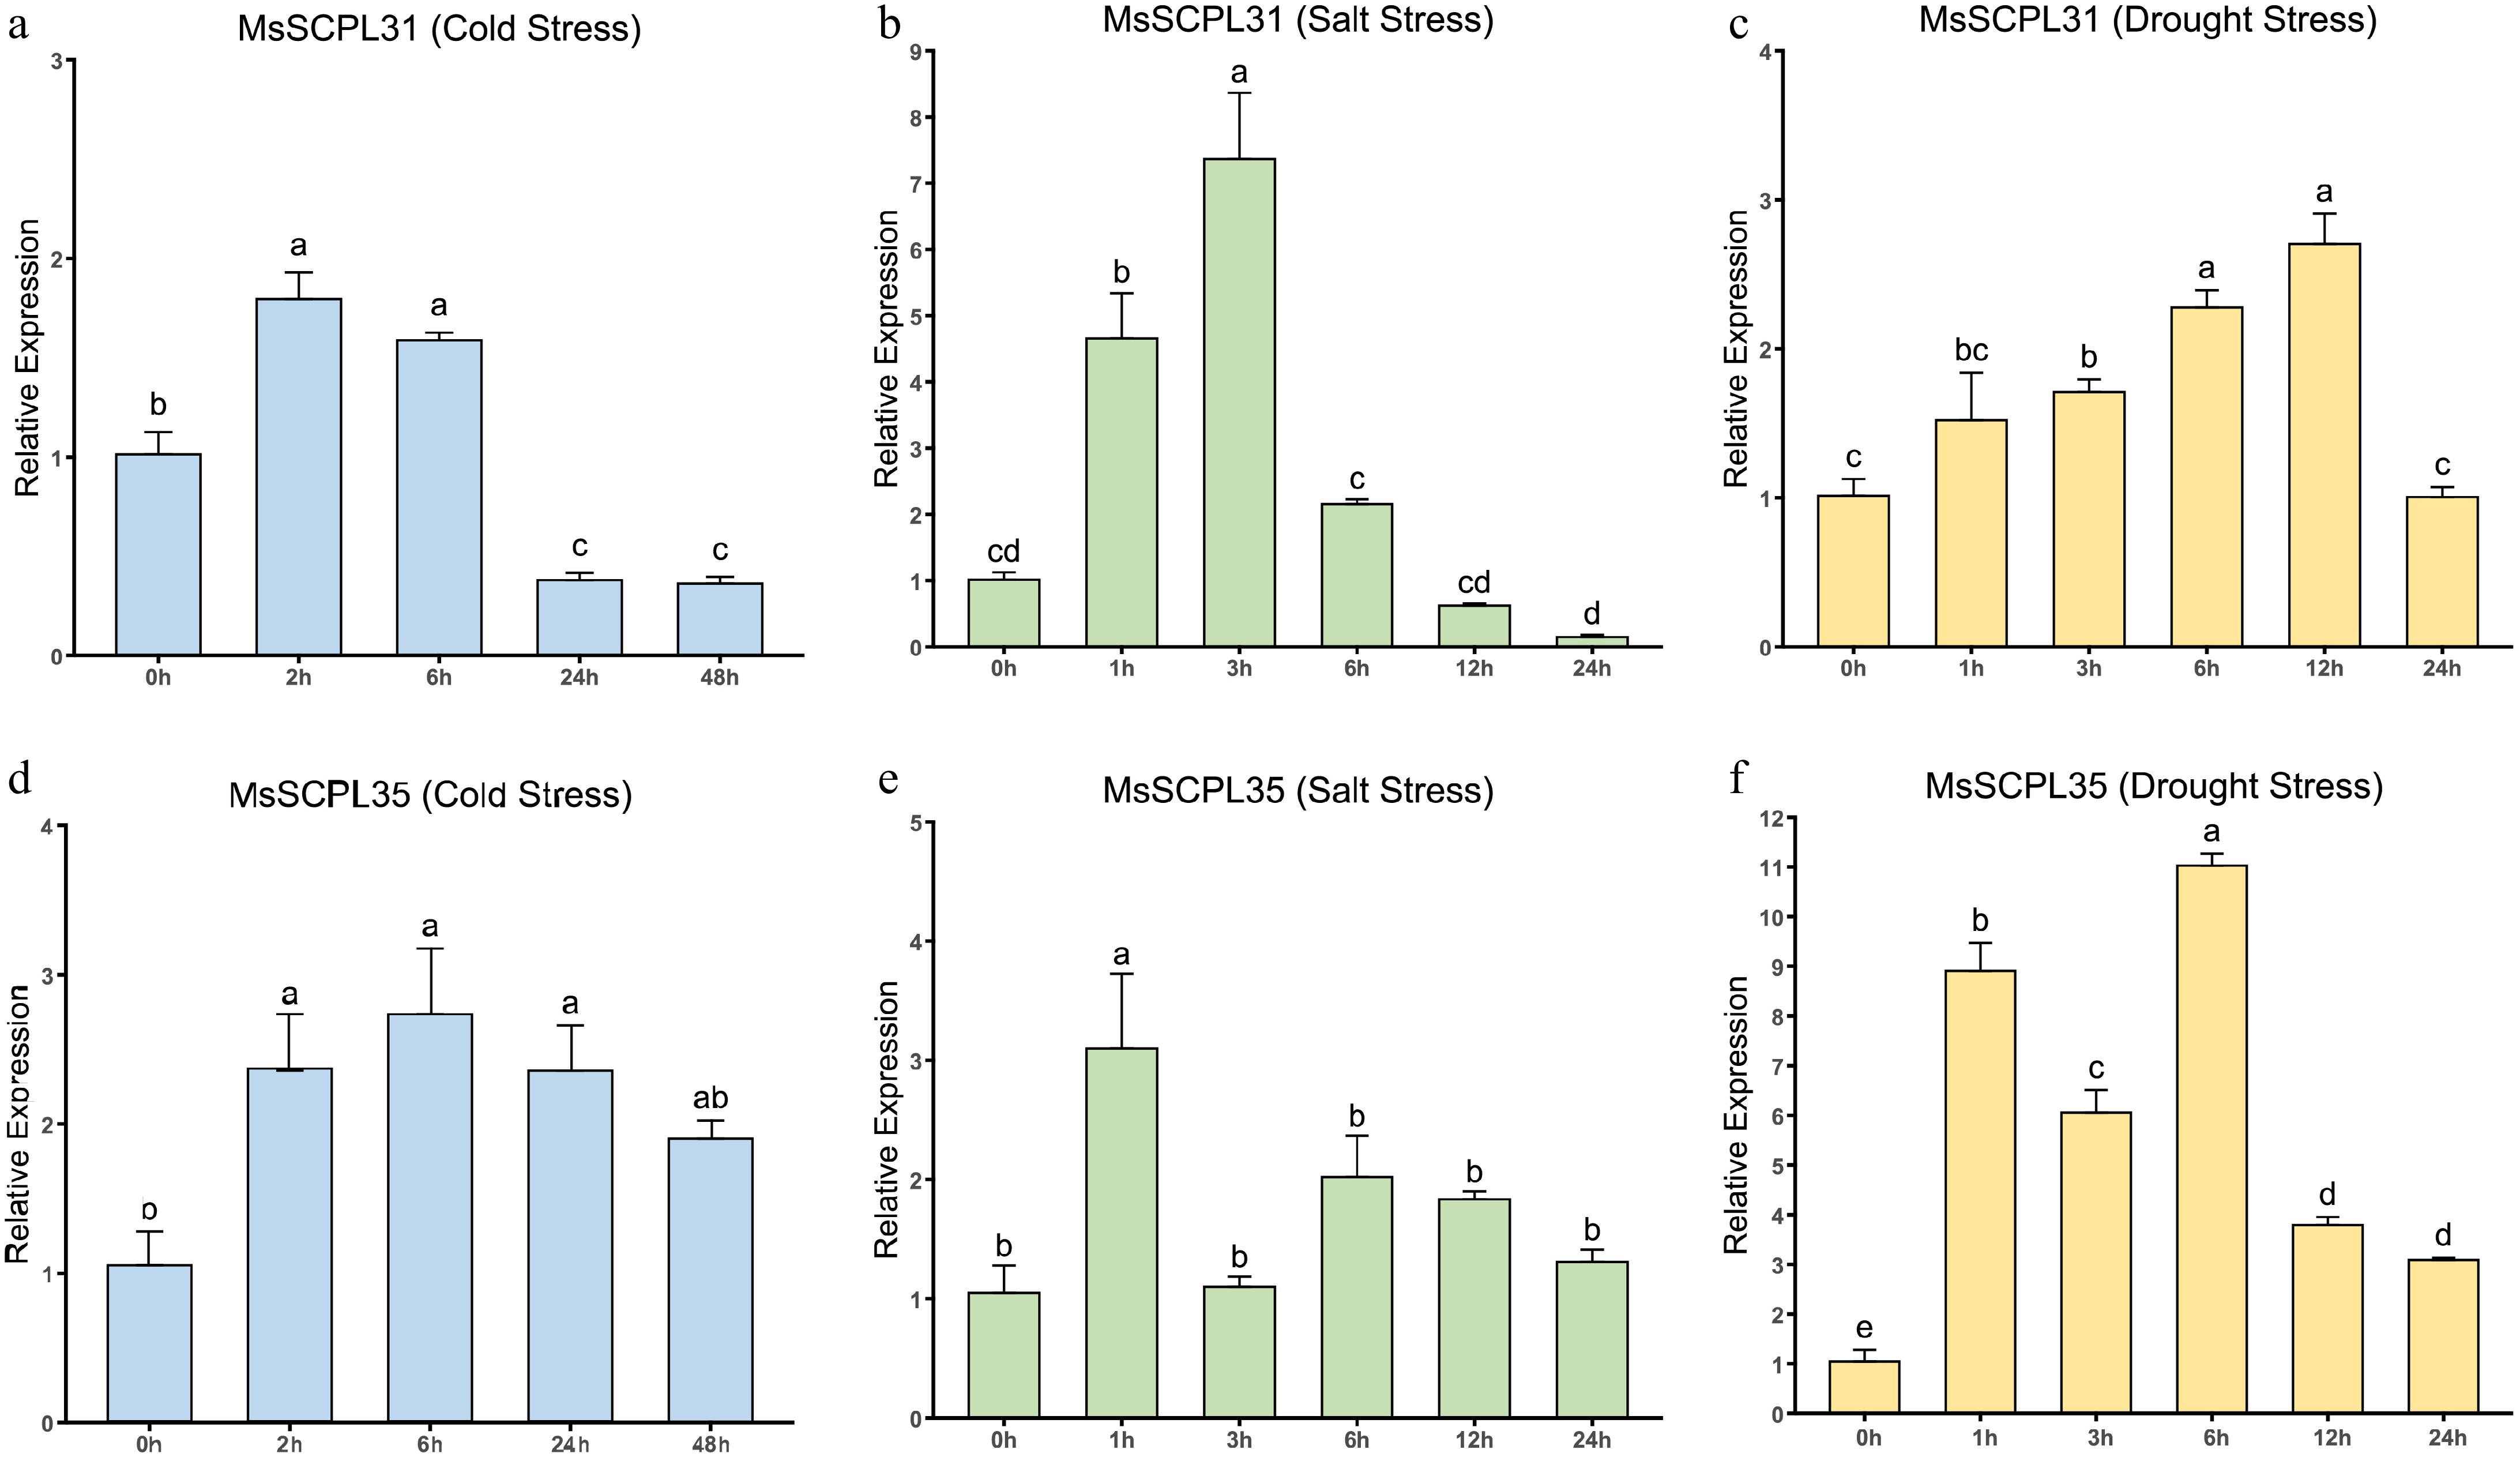
Figure 8.
Expression of genes under drought, salt and cold stress conditions as determined by RT-qPCR. (a) Expression levels of MsSCPL31 under cold stress. (b) Expression levels of 31 under salt stress. (c) Expression levels of MsSCPL31 under drought stress. (d) Expression levels of MsSCPL35 under cold stress. (e) Expression levels of MsSCPL35 under salt stress. (f) Expression levels of MsSCPL35 under drought stress. Different lowercase letters indicate significance at p < 0.05.
Figures
(8)
Tables
(0)