-
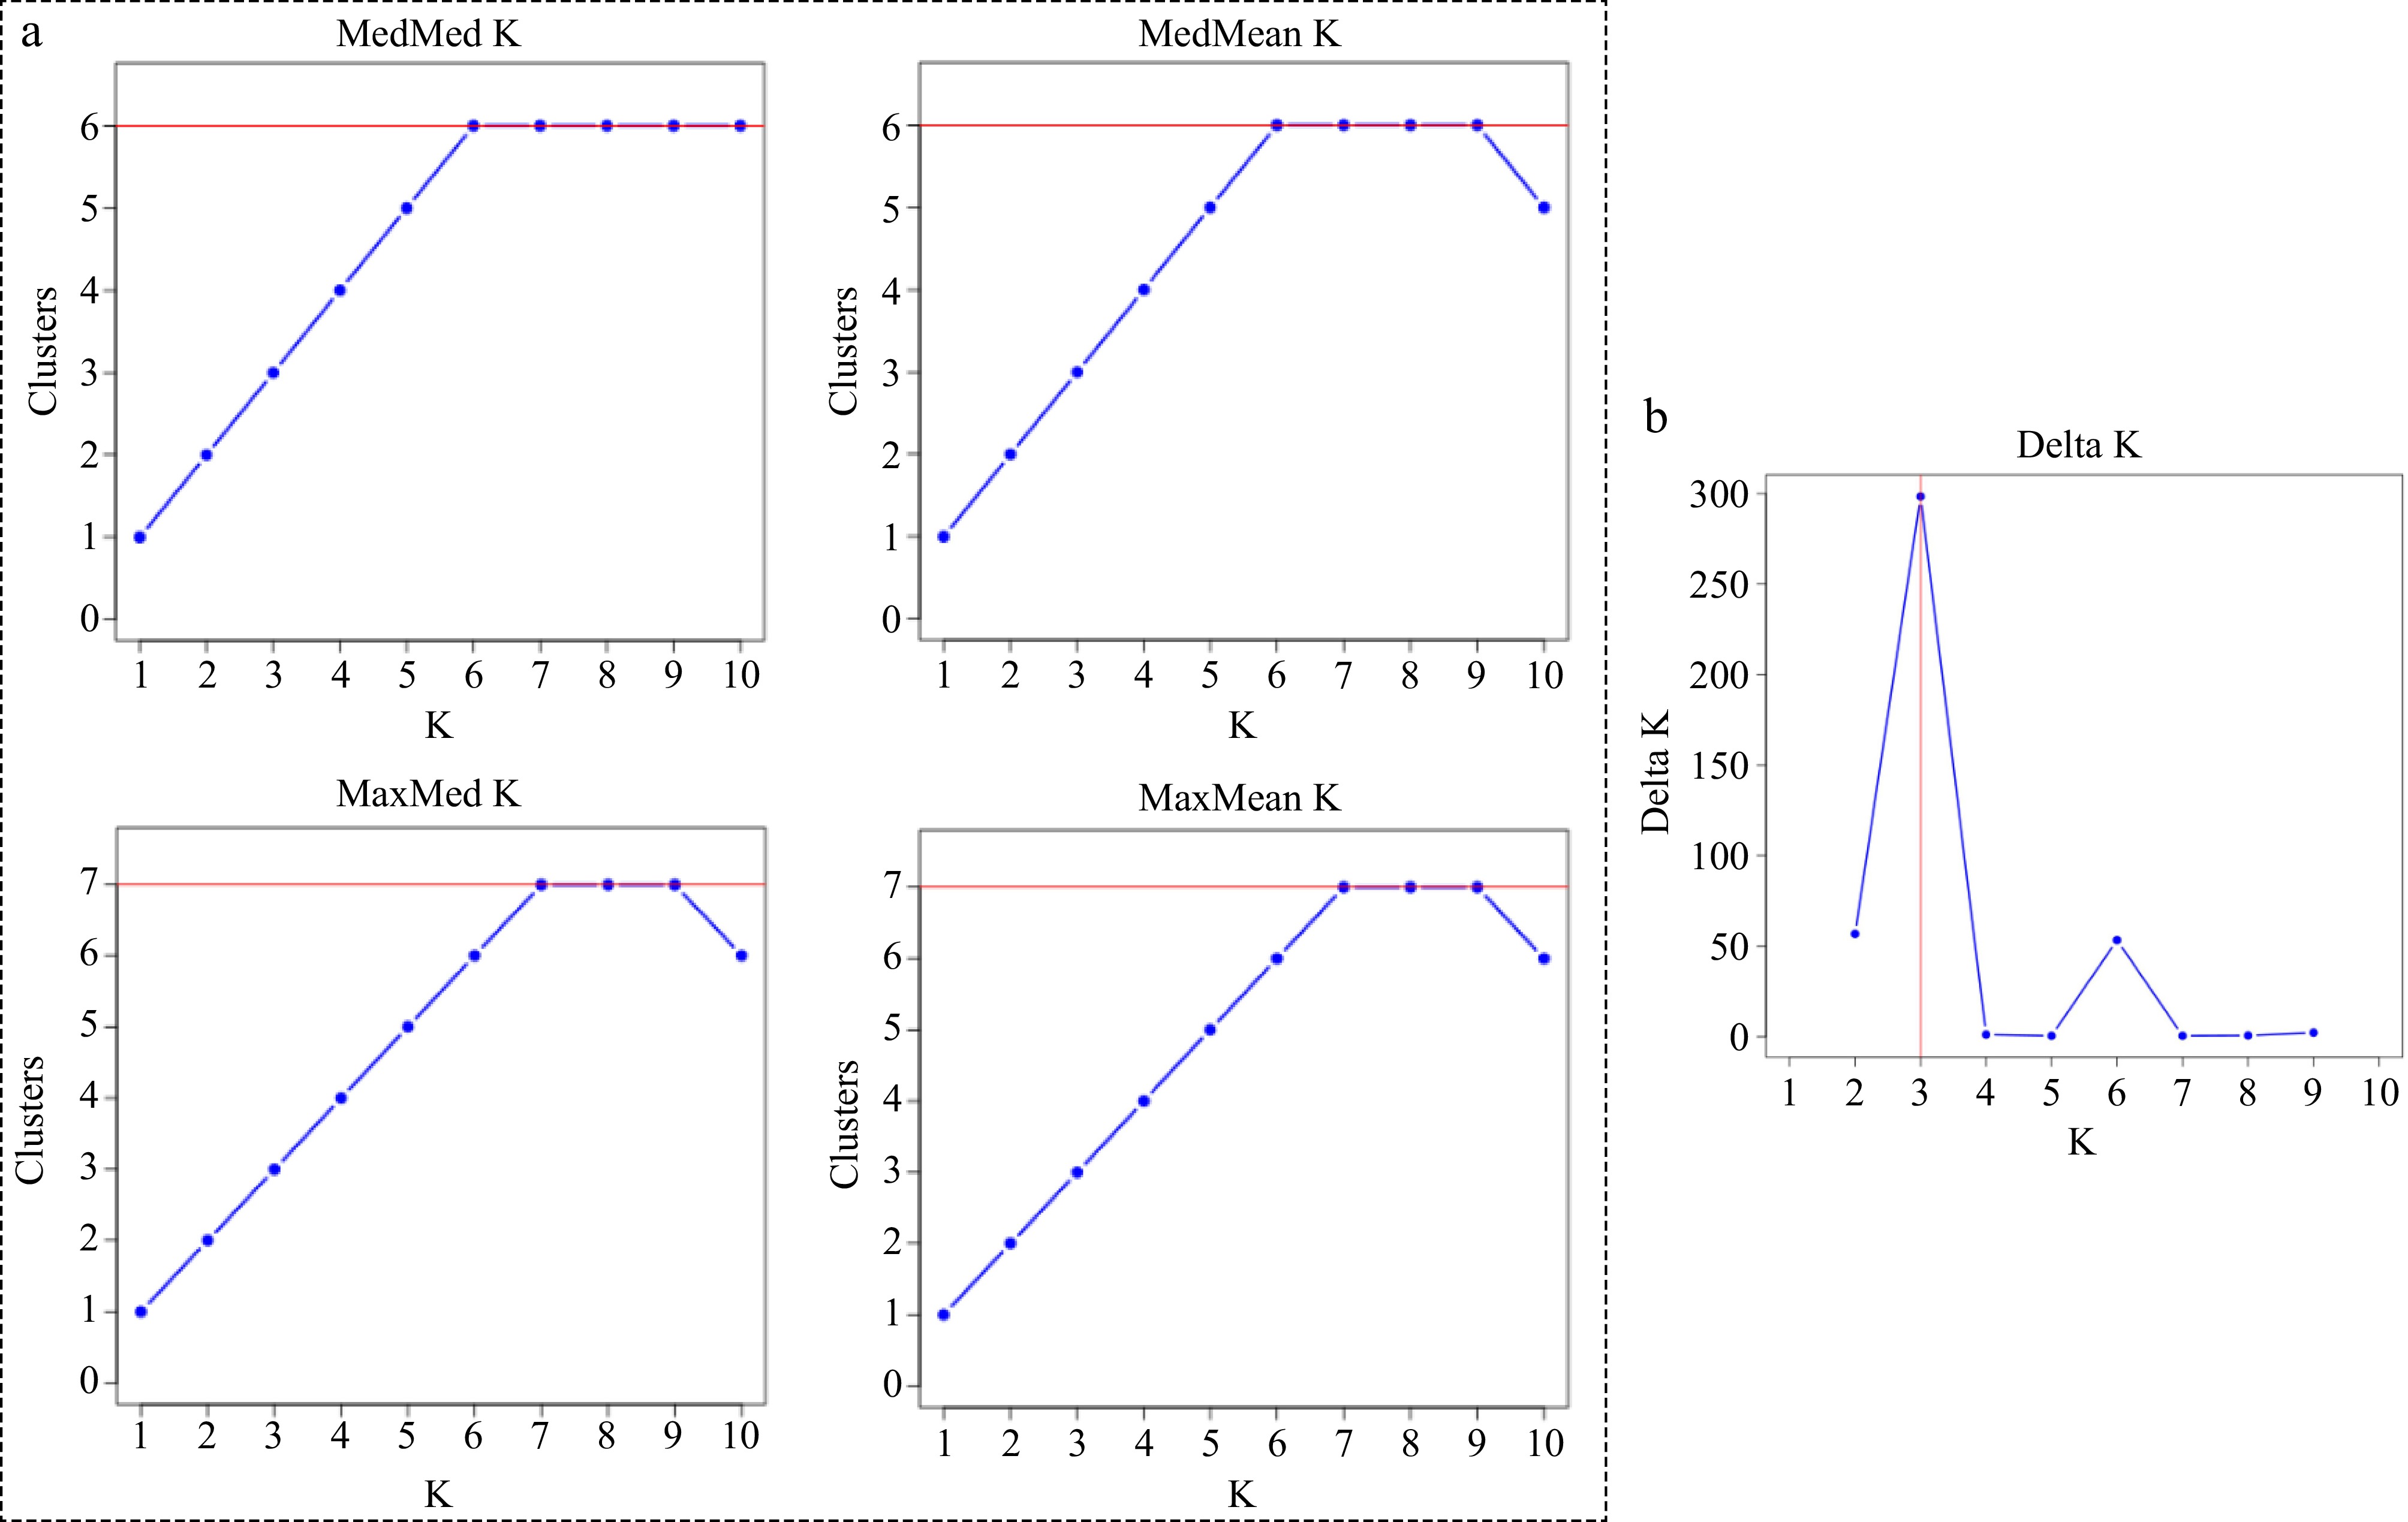
Figure 1.
(a) The most probable number of genetically distinct groups (MedMedK, MedMeaK, MaxMedK, MaxMeaK) using Puechmaille's method as implemented in STRUCTURESELECTOR[29]. (b) Plot of Delta K (filled circles, solid line) calculated as the mean of the second-order rate of change in likelihood of K divided by the standard deviation of the likelihood of K, m(|L(K)|)/s [L(K)].
-
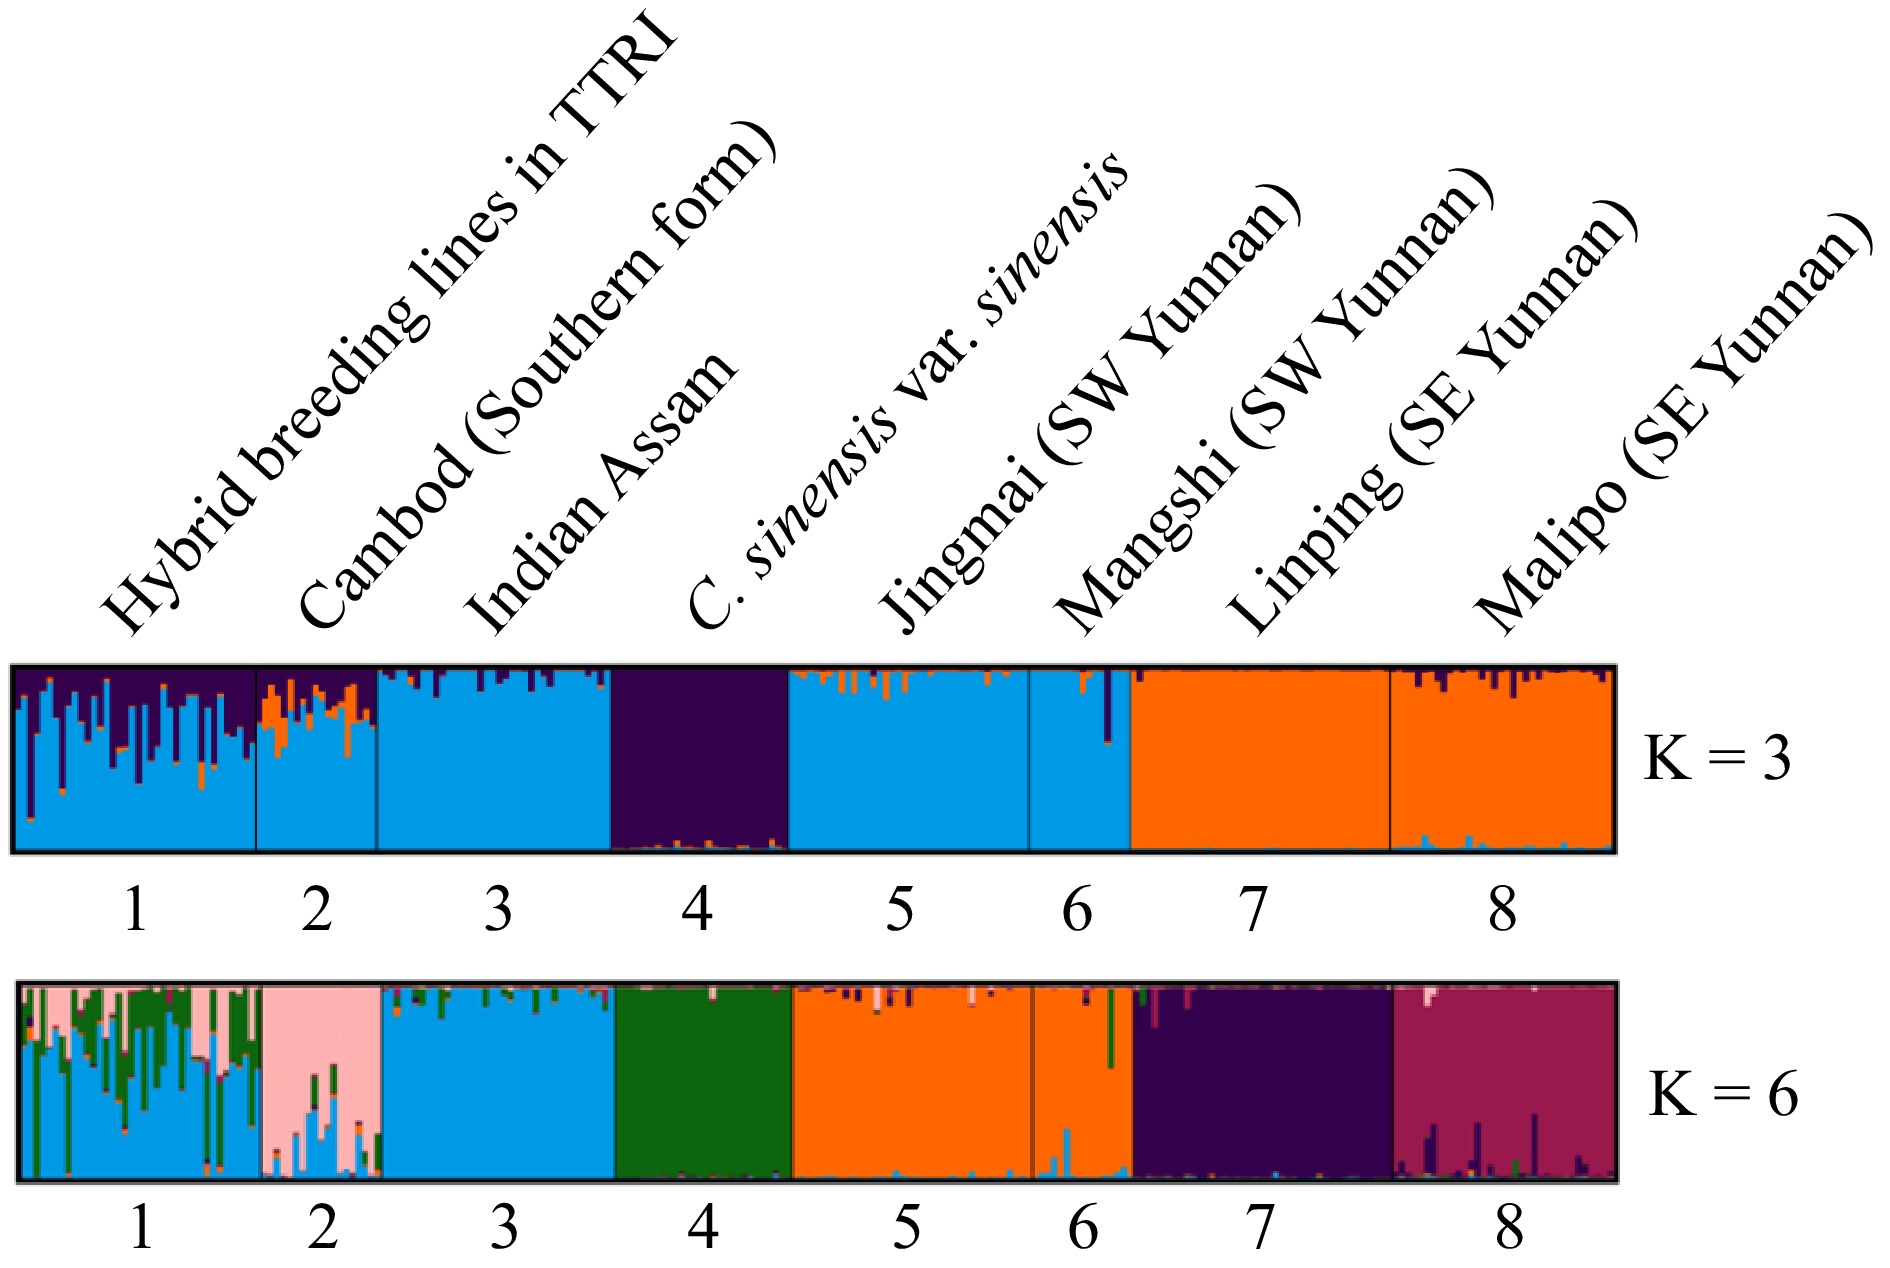
Figure 2.
Population structure of the seven tea germplasm groups using STRUCTURE, where K = 3 and K = 6. Bar plot of reference groups to which the tea samples are descendants of. Each color represents a distinct ancestral germplasm group (or population). Black vertical lines indicate the separation of the genetic groups. Genotypes with multiple colors are denoted as admixed genotypes or inter-population hybrids.
-
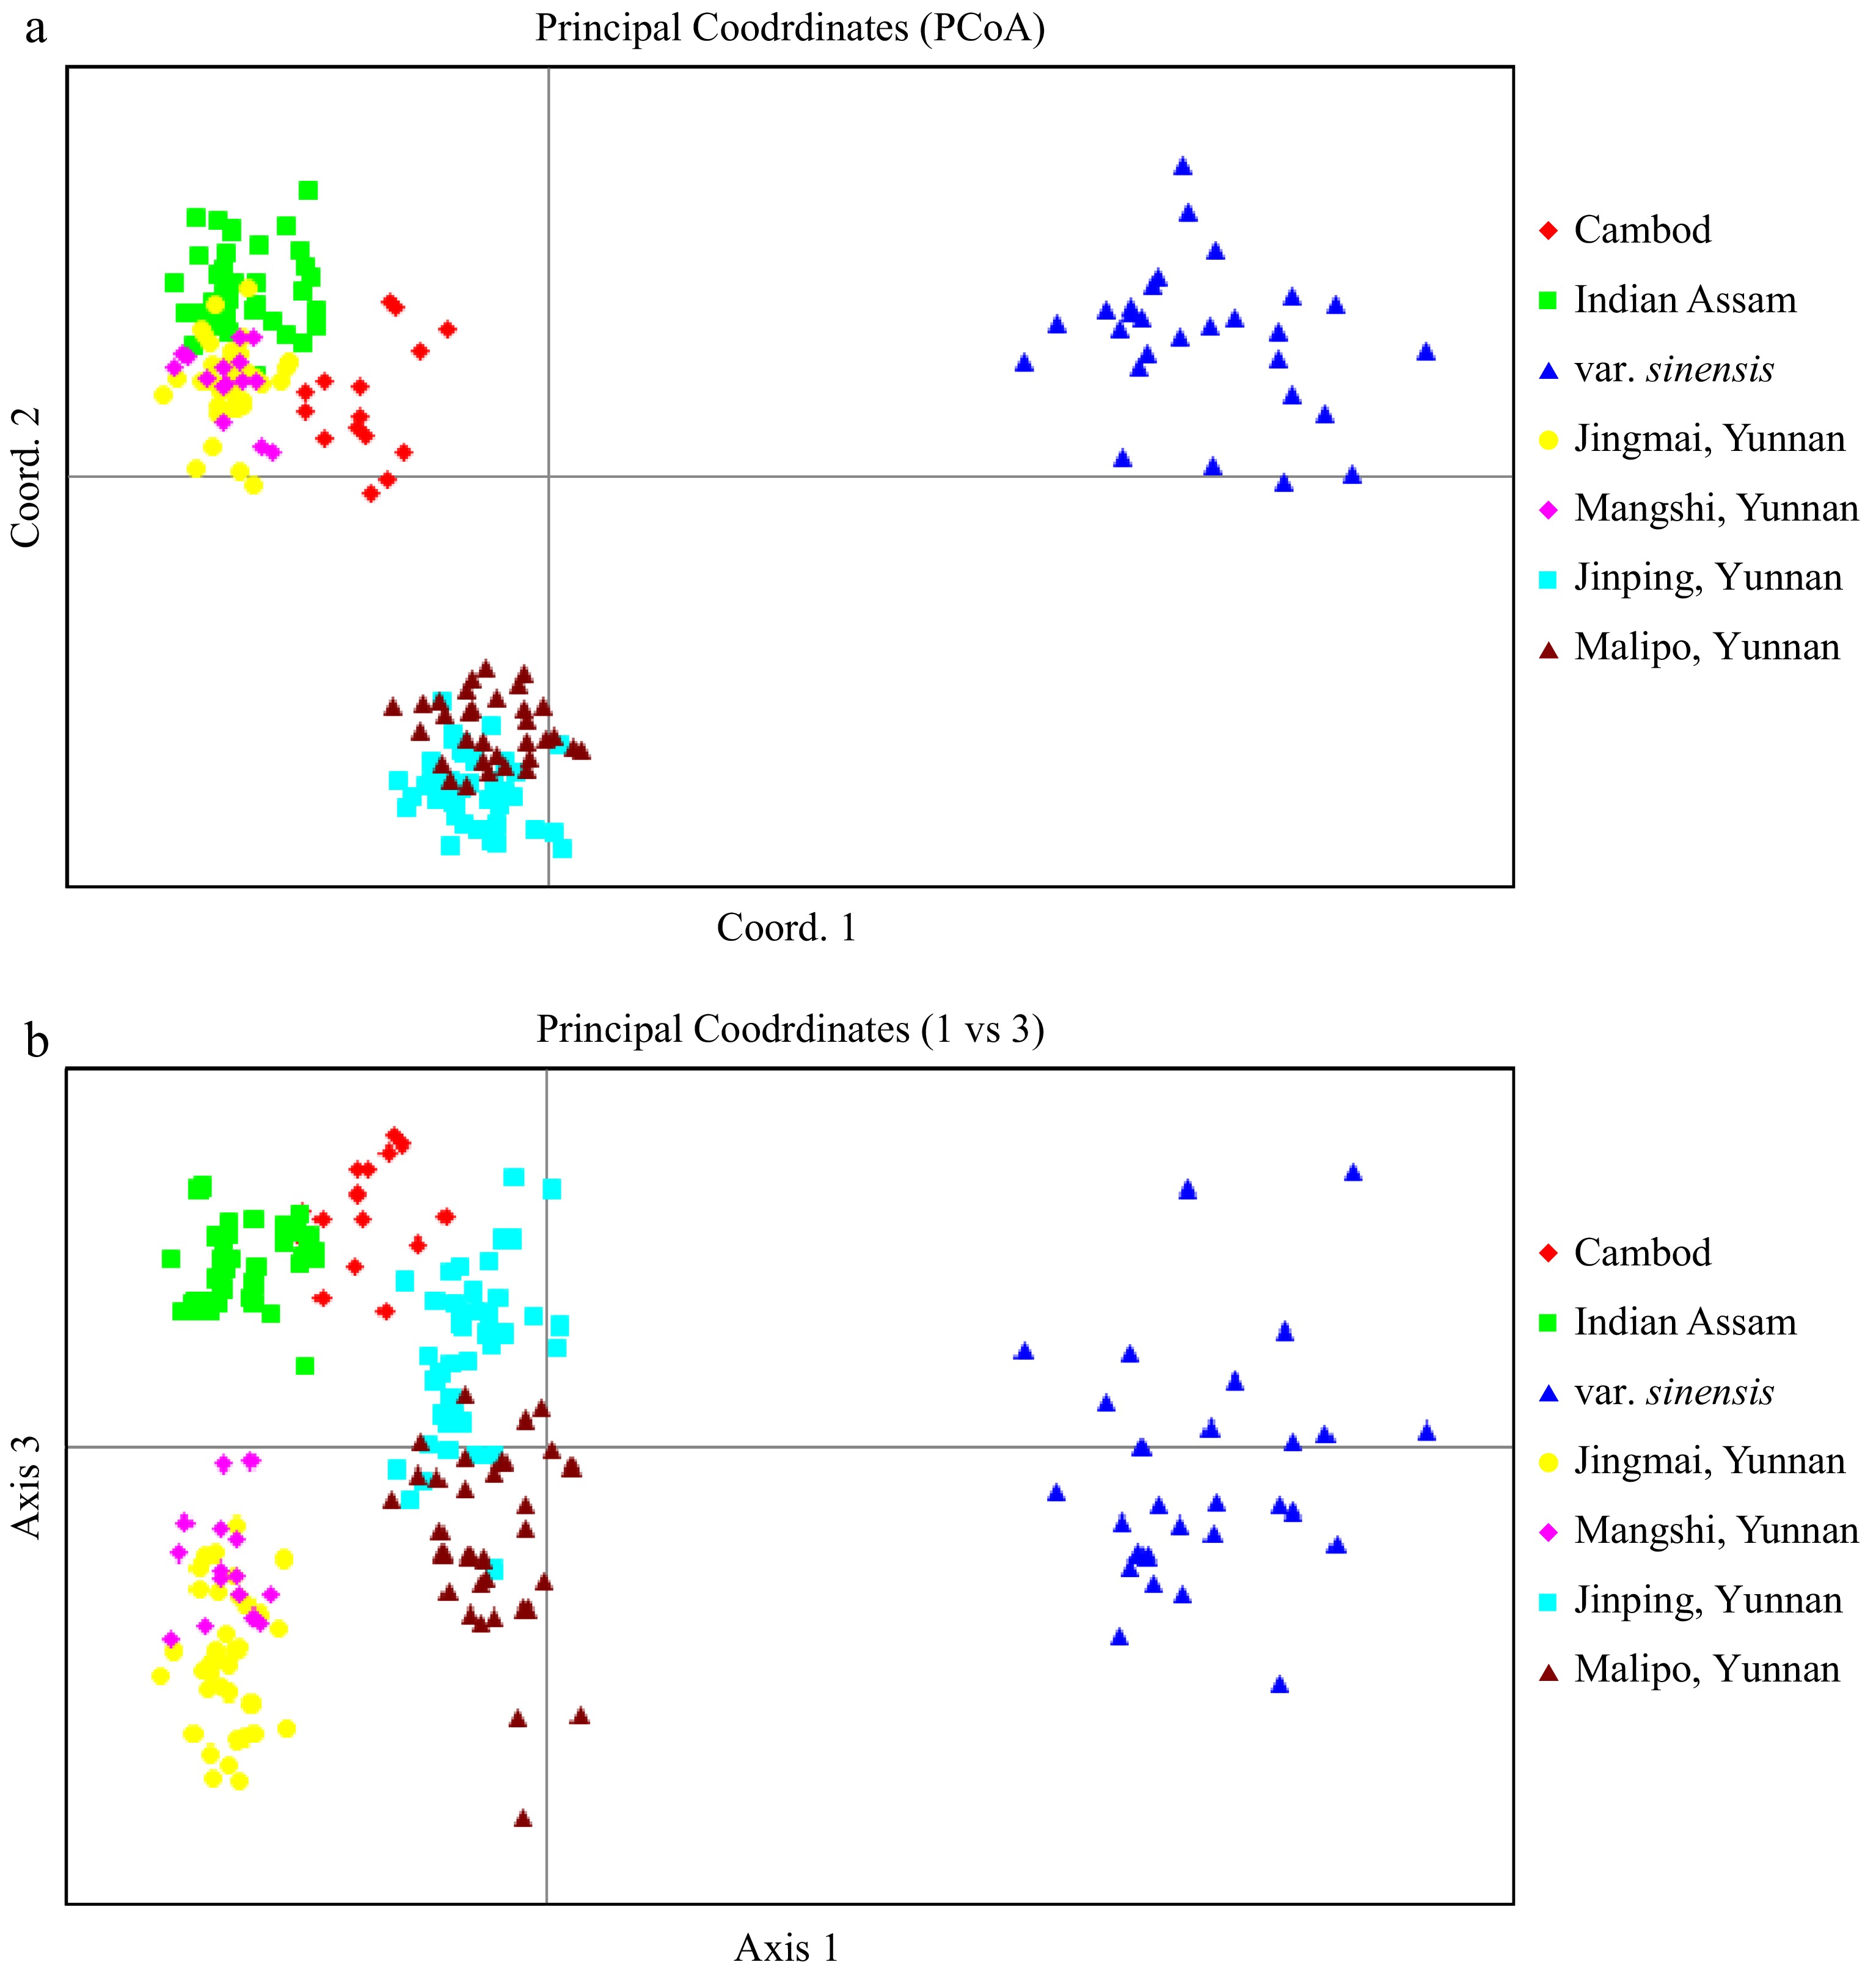
Figure 3.
PCoA plot of tea accessions from Tocklai Tea Research Inst in Assam India, ancient tea gardens and wild populations from Yunnan China, as well as the C. sinensis var sinensis from Chinese national tea collection. All hybrids classified by STRUCTURE analysis (Q value < 0.70) were excluded in the analysis. The plane of the first three main PCO axes accounted for 61.0% of total variation (First axis = 41.1% of total information, the second = 11.9% and the third = 8.0%).
-
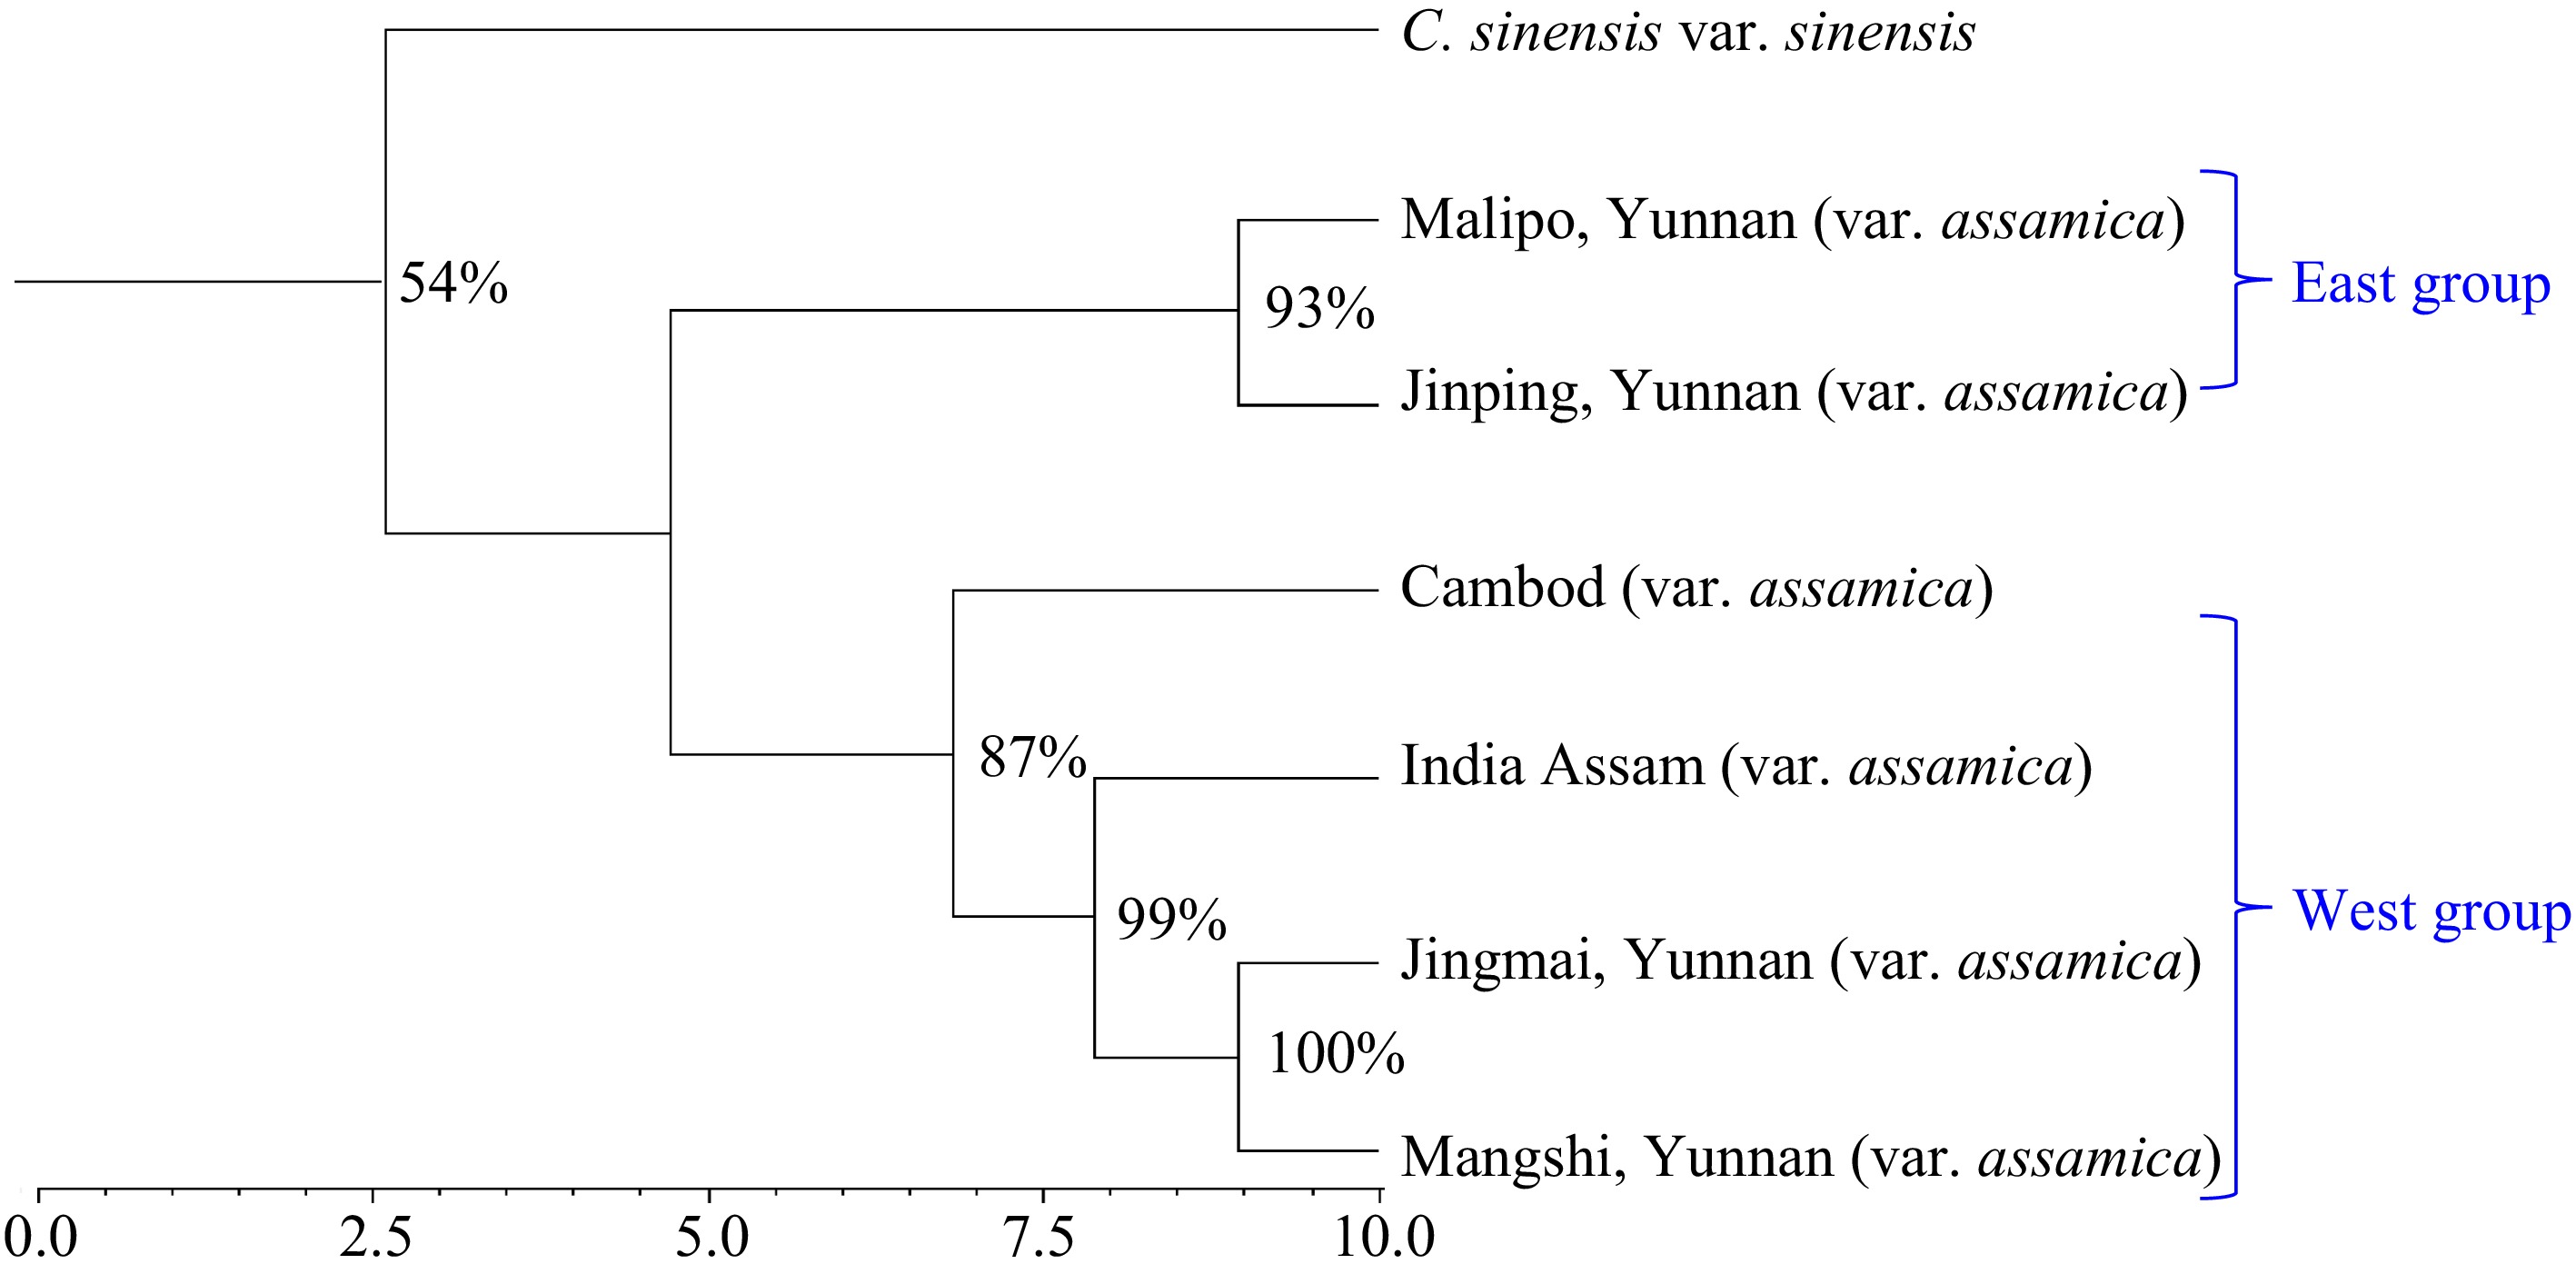
Figure 4.
Neighbor-Joining tree indicating the relationships among the seven analyzed var. assamica germplasm groups/populations.
-
Taxa Number
of sampleSource/
locationType of
germplasmIndia Assam (var. assamica) 37 TTIR, Assam, India Genebank Cambod (var. assamica) 18 TTIR, Assam, India Genebank Breeding line (hybrids) 39 TTIR, Assam, India Genebank C. sinensis var. sinensis 28 Hangzhou, China Genebank China var. assamica 38 Jingmai, Yunnan, China Ancient tea garden China var. assamica 16 Mangshi, Yunnan Ancient tea garden China var. assamica 41 Jinping, Yunnan, China Wild population China var. assamica 35 Malipo, Yunnan, China Wild population Total 252 Table 1.
Sample name, sample size, source and location of tea germplasm analyzed using SNP markers.
-
Name India Assam Cambod var. sinensis China C. sinensis var. assamica Jingmai & Mangshi Malipo Jinping Tingaliam 0.677 0.095 0.208 0.013 0.004 0.002 111/1 0.720 0.008 0.146 0.065 0.004 0.058 128.26.2 0.002 0.288 0.703 0.002 0.003 0.002 14.06.28 0.636 0.009 0.343 0.004 0.005 0.003 19.56.27 0.674 0.315 0.002 0.002 0.002 0.004 19.61.36 0.771 0.206 0.001 0.012 0.007 0.002 292/60 0.545 0.259 0.189 0.003 0.003 0.001 317/3 0.007 0.383 0.573 0.014 0.015 0.007 7.3 0.780 0.016 0.185 0.012 0.004 0.003 B.9F 1/9 0.732 0.143 0.079 0.010 0.033 0.002 B.9F 2/10 0.608 0.085 0.268 0.023 0.009 0.007 Bagh 10 0.577 0.011 0.389 0.006 0.006 0.011 MORNAI 3 0.804 0.009 0.162 0.018 0.004 0.004 N 79 0.440 0.269 0.258 0.011 0.011 0.011 N-89 0.822 0.149 0.008 0.010 0.007 0.004 Namdag 1 0.375 0.051 0.545 0.024 0.003 0.003 Namdag 12 0.184 0.389 0.358 0.036 0.020 0.013 nf100 0.517 0.022 0.420 0.009 0.024 0.009 OPS of Betz 0.774 0.020 0.190 0.010 0.003 0.003 P 126 0.341 0.017 0.619 0.011 0.008 0.004 P38 0.788 0.004 0.198 0.006 0.002 0.002 R/D-3/27 0.458 0.043 0.487 0.004 0.004 0.003 R94 0.583 0.004 0.406 0.003 0.002 0.002 S.13C 1/5 0.866 0.011 0.034 0.004 0.077 0.008 S.3A/5 0.802 0.009 0.182 0.003 0.001 0.003 Sikim 1 DJ 0.461 0.018 0.501 0.003 0.011 0.006 SRI LANKA 4 0.782 0.004 0.206 0.004 0.002 0.002 SS 28 0.604 0.371 0.008 0.006 0.007 0.004 SS 42 0.600 0.375 0.008 0.006 0.007 0.003 STOCK 400 0.009 0.386 0.443 0.062 0.080 0.021 T.3E/14 0.755 0.015 0.214 0.009 0.004 0.003 T383 0.025 0.473 0.423 0.032 0.041 0.005 T3E3 0.524 0.447 0.011 0.004 0.008 0.006 TA 17 0.595 0.031 0.357 0.006 0.006 0.004 Thowra/2-11 0.560 0.058 0.365 0.012 0.003 0.001 TJ 37 0.639 0.004 0.335 0.013 0.005 0.003 TRA/D/SNT 1 0.254 0.292 0.438 0.010 0.004 0.002 UPASI 1 0.564 0.018 0.404 0.006 0.003 0.004 Cj 17 0.657 0.019 0.053 0.168 0.051 0.052 Mean 0.552 0.137 0.275 0.017 0.013 0.007 Table 2.
Inferred parentage/ancestry for 39 hybrid breeding lines from Tocklai tea germplasm collection, Assam, India based on six populations, using Bayesian clustering analysis.
-
Population Observed
heterozygosityGene diversity Cambod 0.299 ± 0.023 0.233 ± 0.016 India Assam 0.147 ± 0.017 0.136 ± 0.014 var. sinensis 0.346 ± 0.018 0.323 ± 0.013 Jinmai, Yunnan 0.190 ± 0.022 0.158 ± 0.016 Mangshi, Yunnan 0.164 ± 0.022 0.133 ± 0.016 Jinping, Yunnan 0.163 ± 0.020 0.151 ± 0.015 Malipo, Yunnan 0.272 ± 0.021 0.241 ± 0.016 Table 3.
Observed heterozygosity and gene diversity in eight tea germplasm groups, based on 150 SNP markers.
-
Source DF SS MS Est. Var. Percentile p-value* Among pops 6 6,043.3 1,007.224 33.883 54% < 0.001 Within pops 199 5,773.4 29.012 29.012 46% Total 205 11,816.8 62.895 100% * Probability, P (rand ≥ data), for PhiPT is based on standard permutation across the full data set. Table 4.
Analysis of Molecular Variance (AMOVA) and partitioning of total molecular variance within and among seven tea germplasm groups.
-
Population Cambod Indian Assam var. sinensis Jingmai Mangshi Jinping Malipo Cambod 0.000 0.001 0.001 0.001 0.001 0.001 0.001 India Assam 0.197 0.000 0.001 0.001 0.001 0.001 0.001 var. sinensis 0.356 0.493 0.000 0.001 0.001 0.001 0.001 Jingmai 0.268 0.251 0.486 0.000 0.001 0.001 0.001 Mangshi 0.240 0.249 0.455 0.113 0.000 0.001 0.001 Jinping 0.324 0.446 0.418 0.402 0.409 0.000 0.001 Malipo 0.226 0.357 0.330 0.306 0.301 0.161 0.000 Table 5.
Pairwise population Fst analysis among seven tea germplasm groups - Fst values below diagonal. Probability, P (rand ≥ data) based on 9,999 permutations is shown above diagonal.
Figures
(4)
Tables
(5)