-
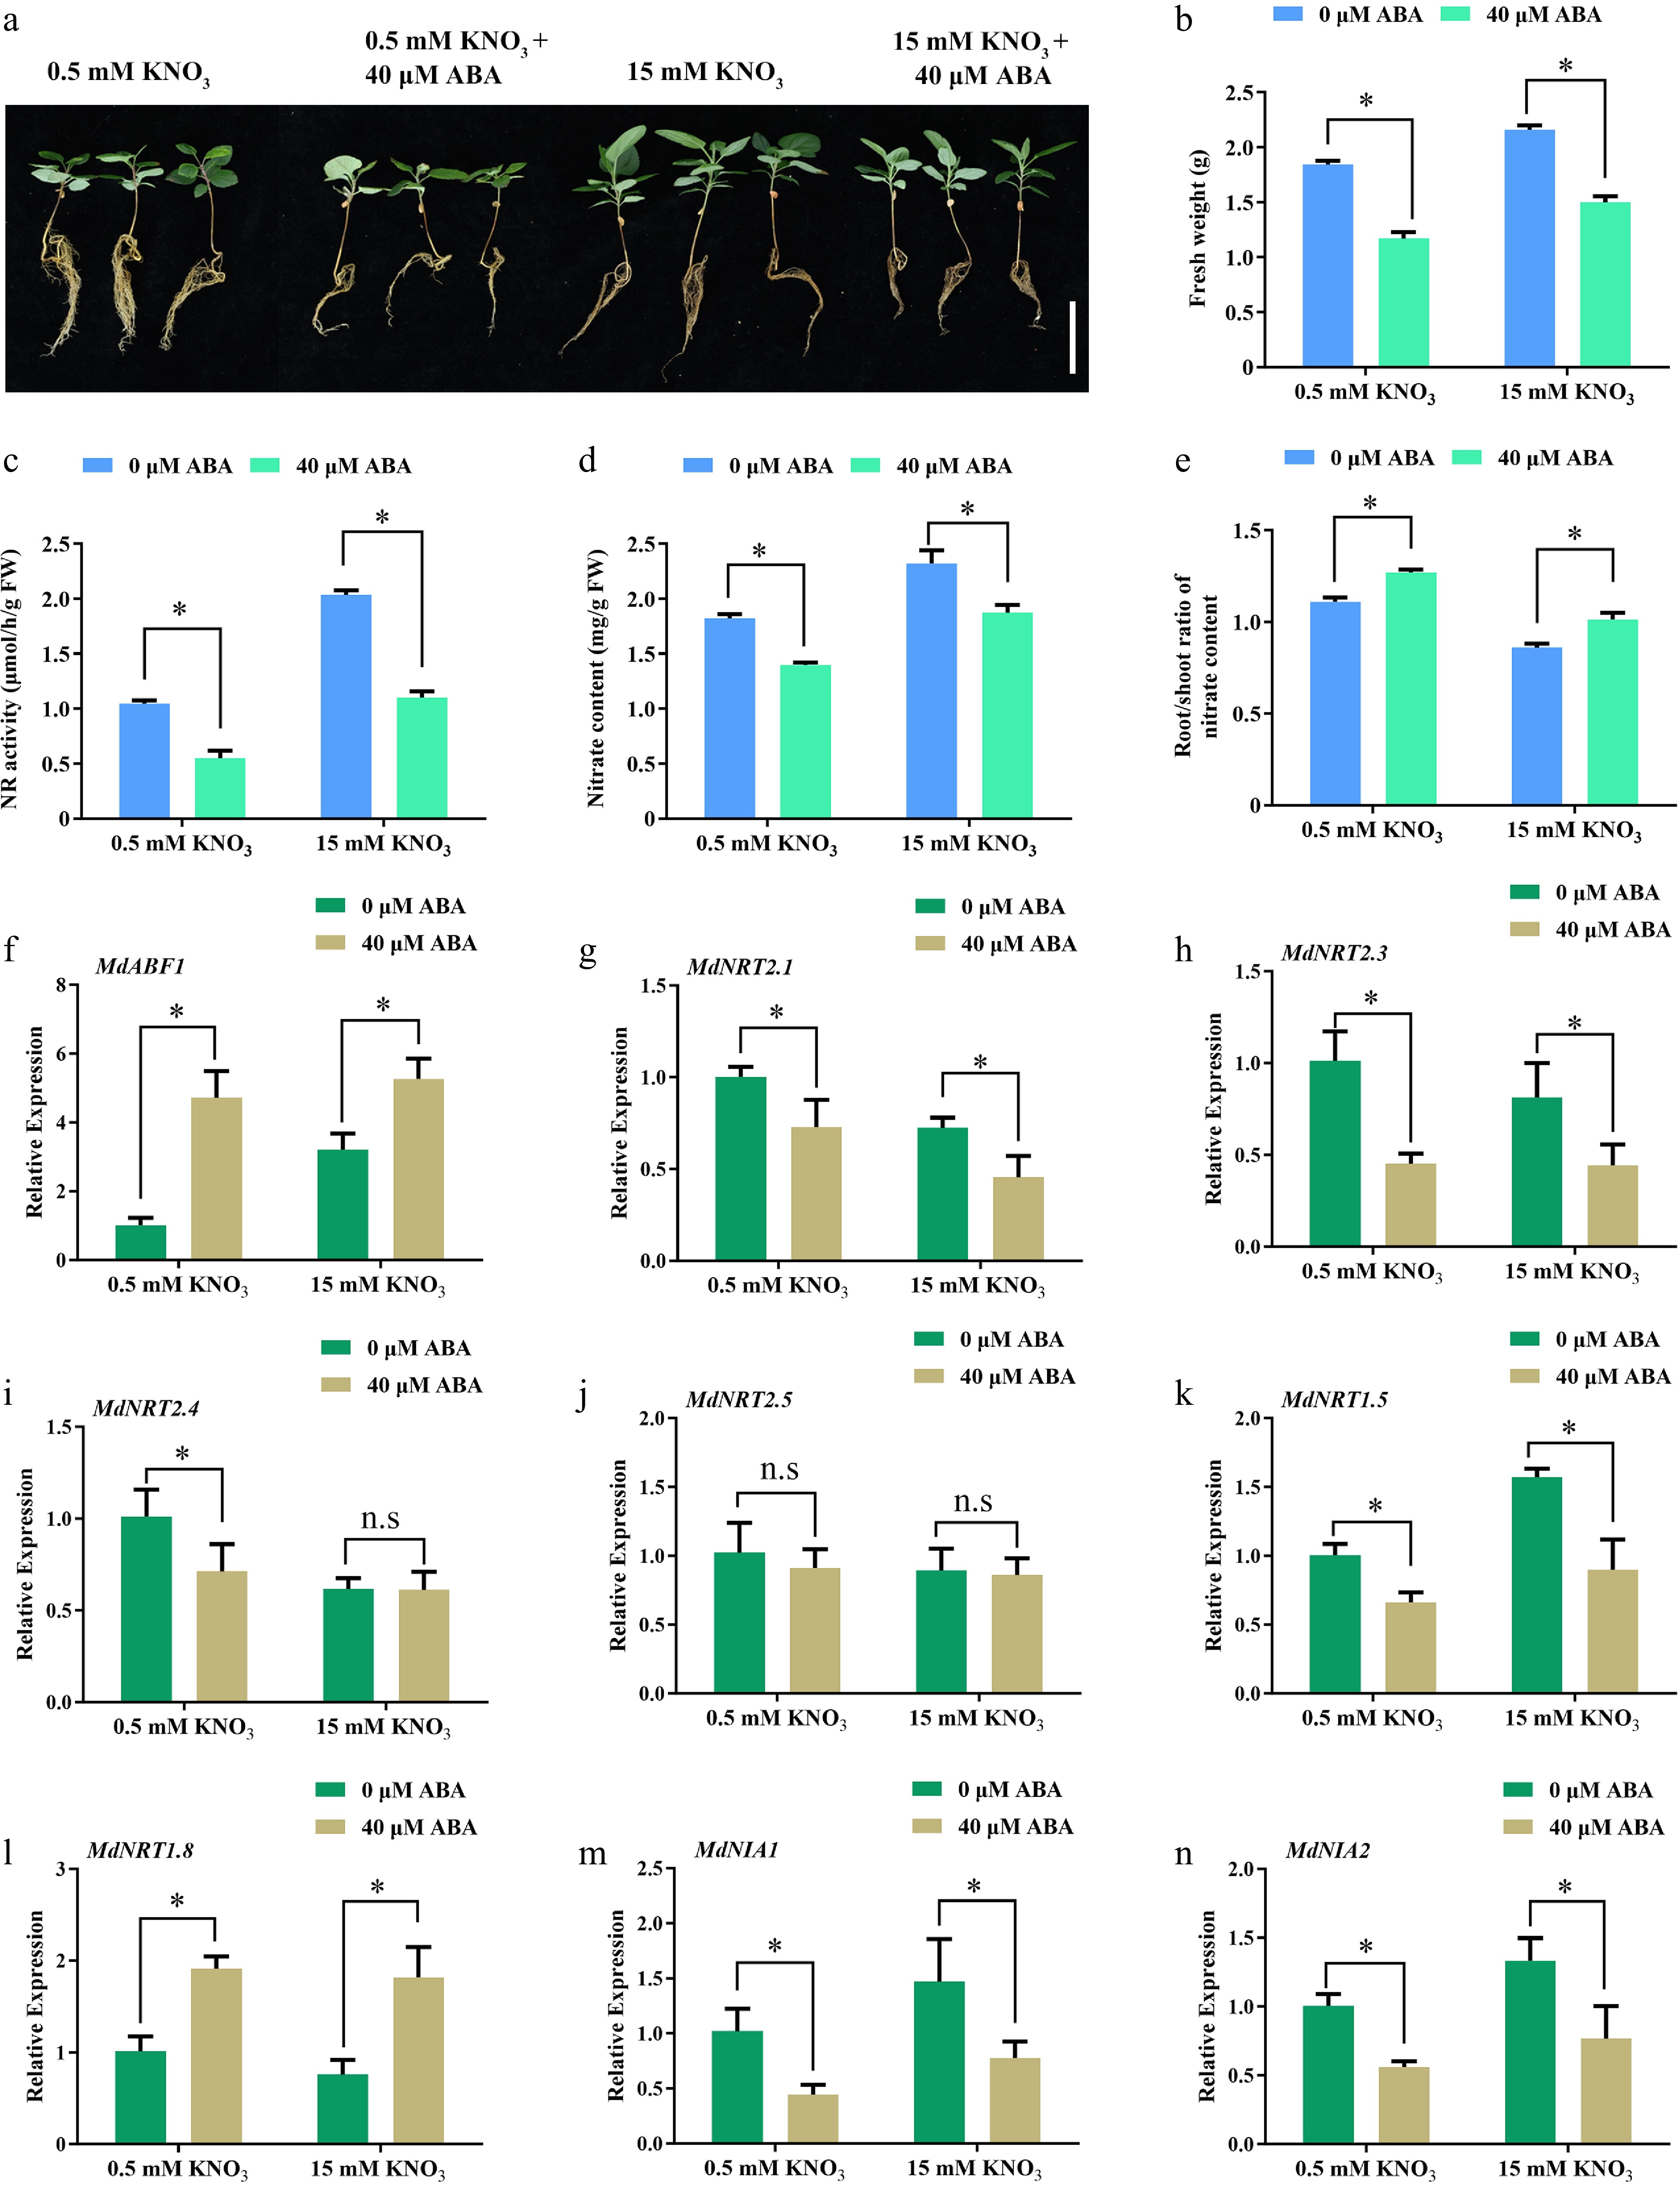
Figure 1.
ABA regulates nitrate absorption and assimilation. (a) Phenotype of apple seedlings grown on low (0.5 mM KNO3), and high (15 mM KNO3) nitrate nutrient solutions containing different ABA concentrations (0 or 40 μM). (b) Fresh weight, (c) nitrate reductase activity, (d) nitrate content, (e) root/shoot ratio of nitrate content in (a). The relative expression of (f) MdABF1, and (g)−(n) nitrate absorbing, transporting, and assimilation genes. Plants were treated with high (15 mM) or low nitrate (0.5 mM) concentrations containing different ABA (0 or 40 μM) for 2 h, and RNA was extracted for gene expression analysis. Error bars exhibit the means ± SD of three independent replicates. Asterisks indicate significant differences (LSD test, *p < 0.05).
-
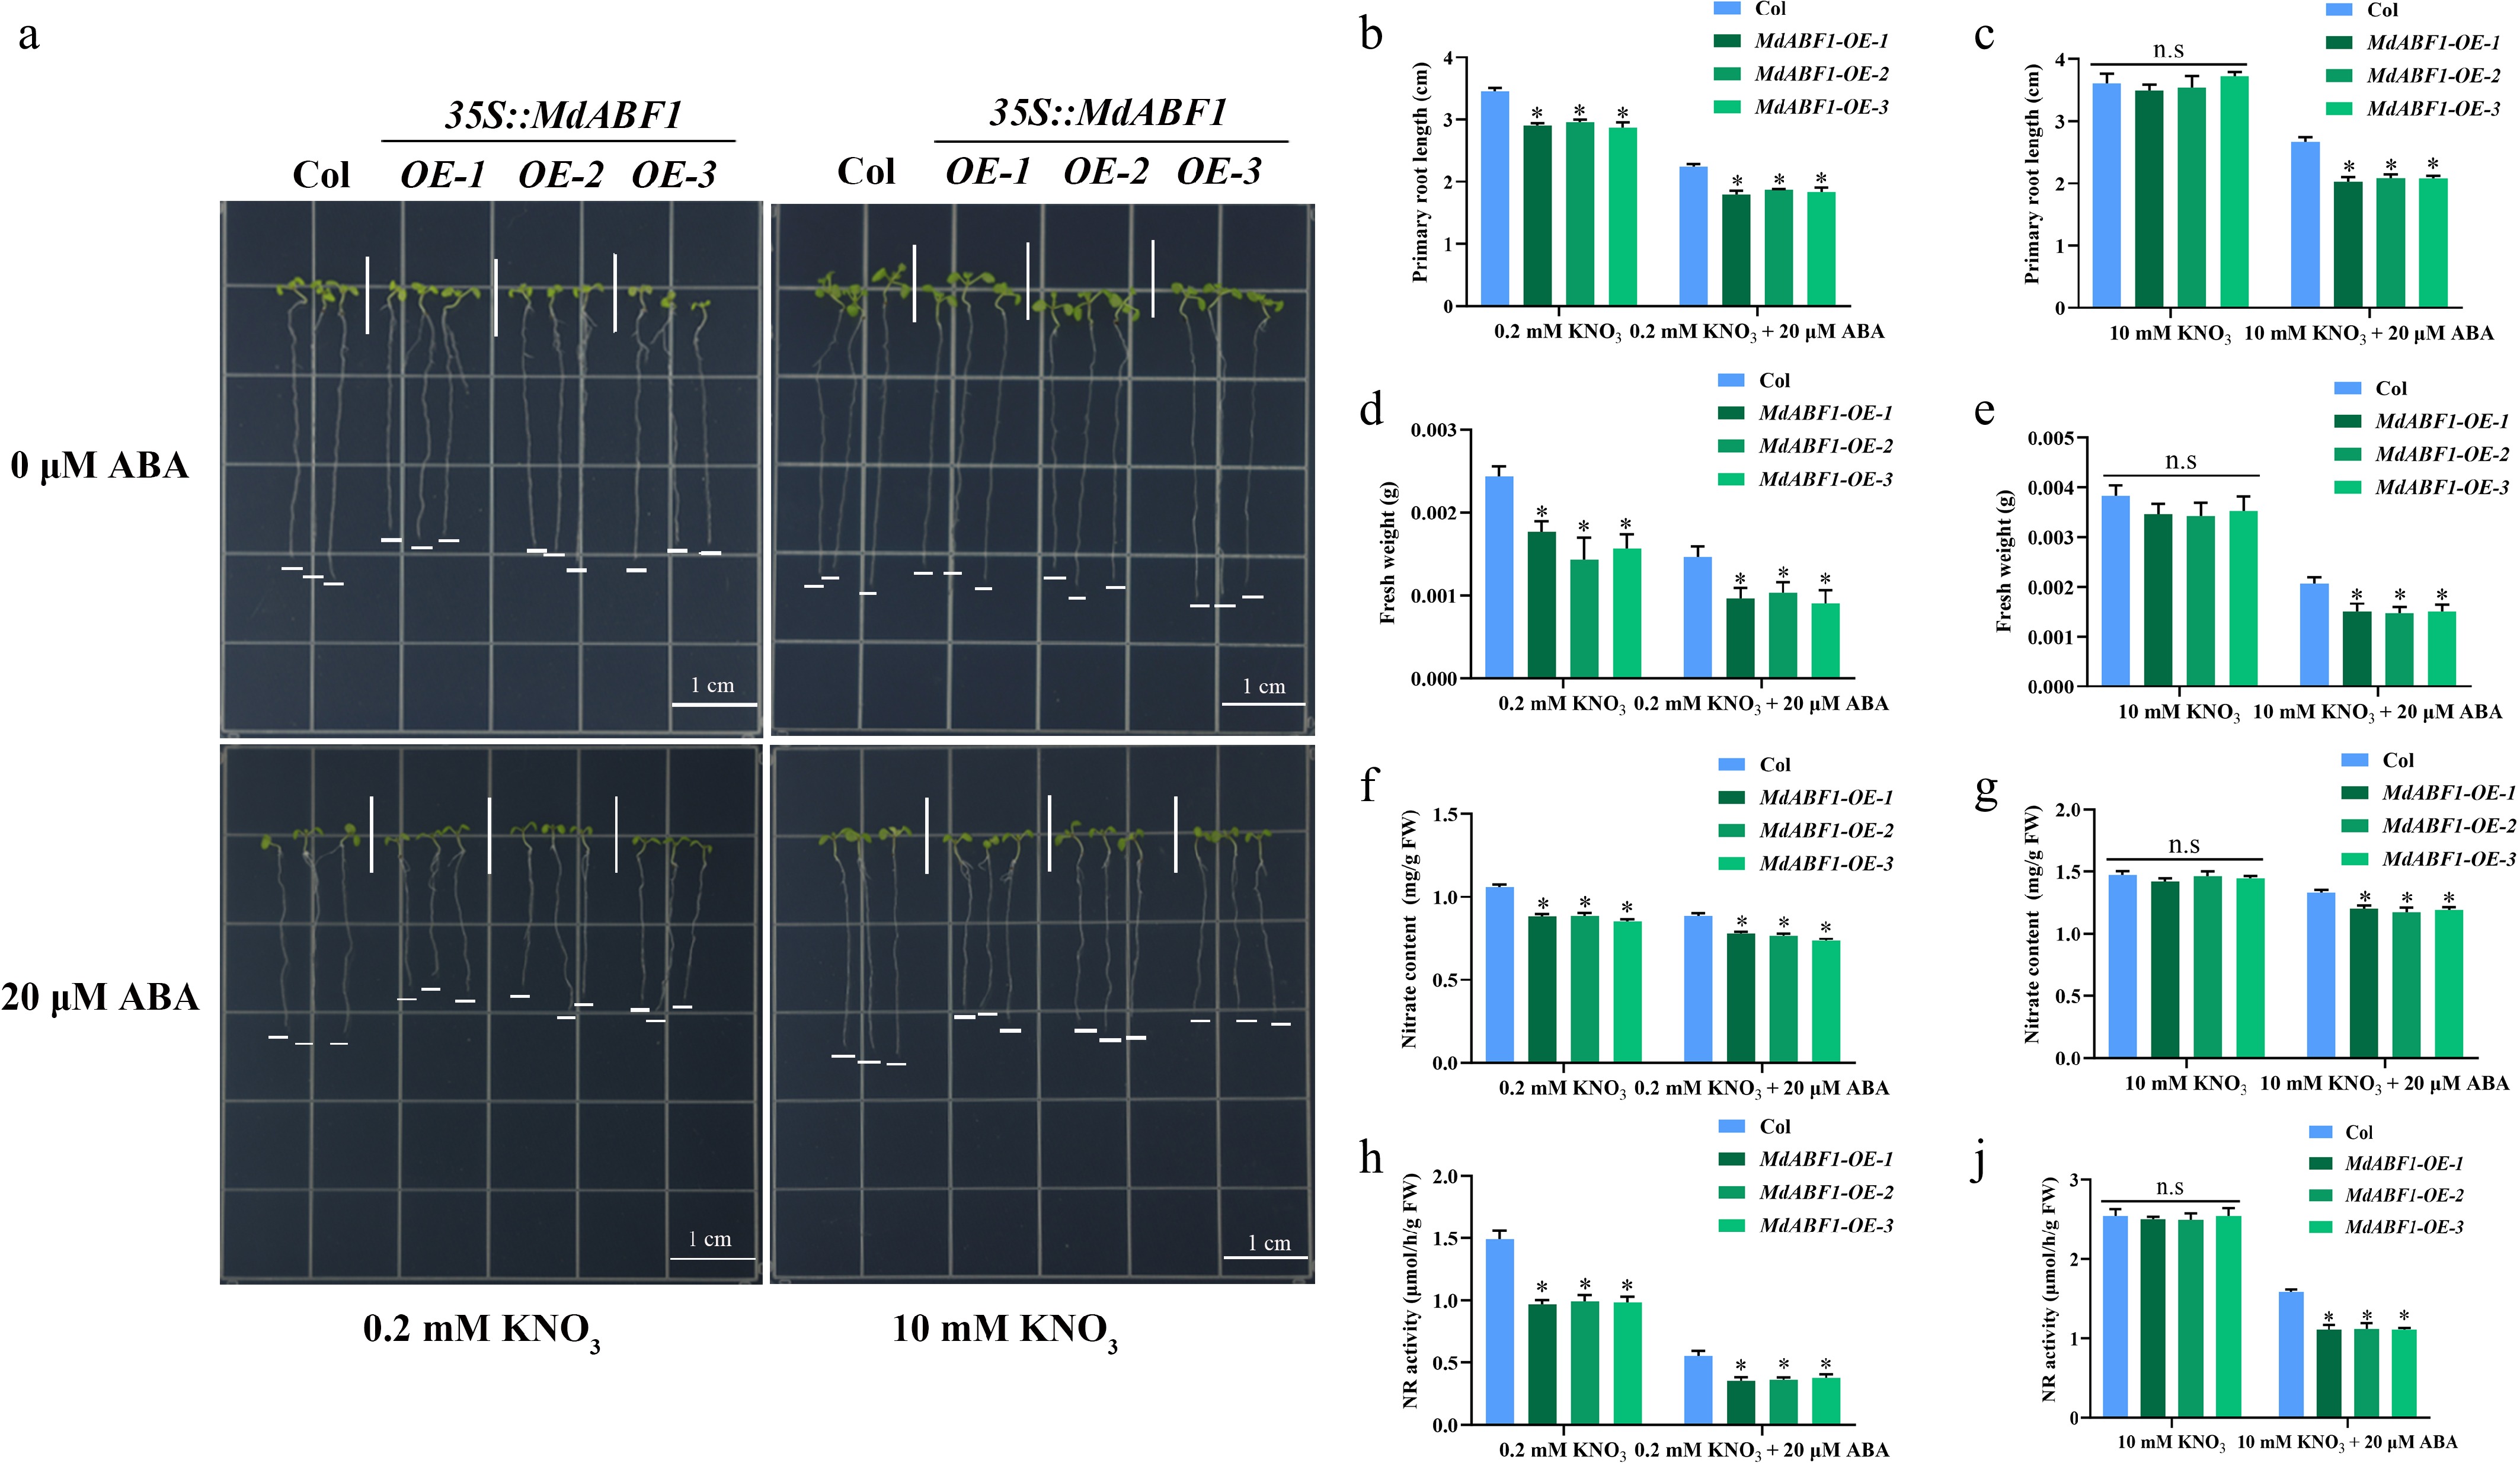
Figure 2.
Ectopic expression of MdABF1 in Arabidopsis regulates nitrate absorption and assimilation under ABA treatment. (a) Morphological characteristics of MdABF1 transgenic plants under low (0.2 mM), or high (10 mM) nitrate supplemented with 0 or 20 μM ABA treatment. Determination of (b), (c) primary root length, (d), (e) fresh weight, (f), (g) nitrate content, (h), (i) NR activity. Error bars exhibit the means ± SD of three independent replicates. Asterisks indicate significant differences (LSD test, *p < 0.05).
-
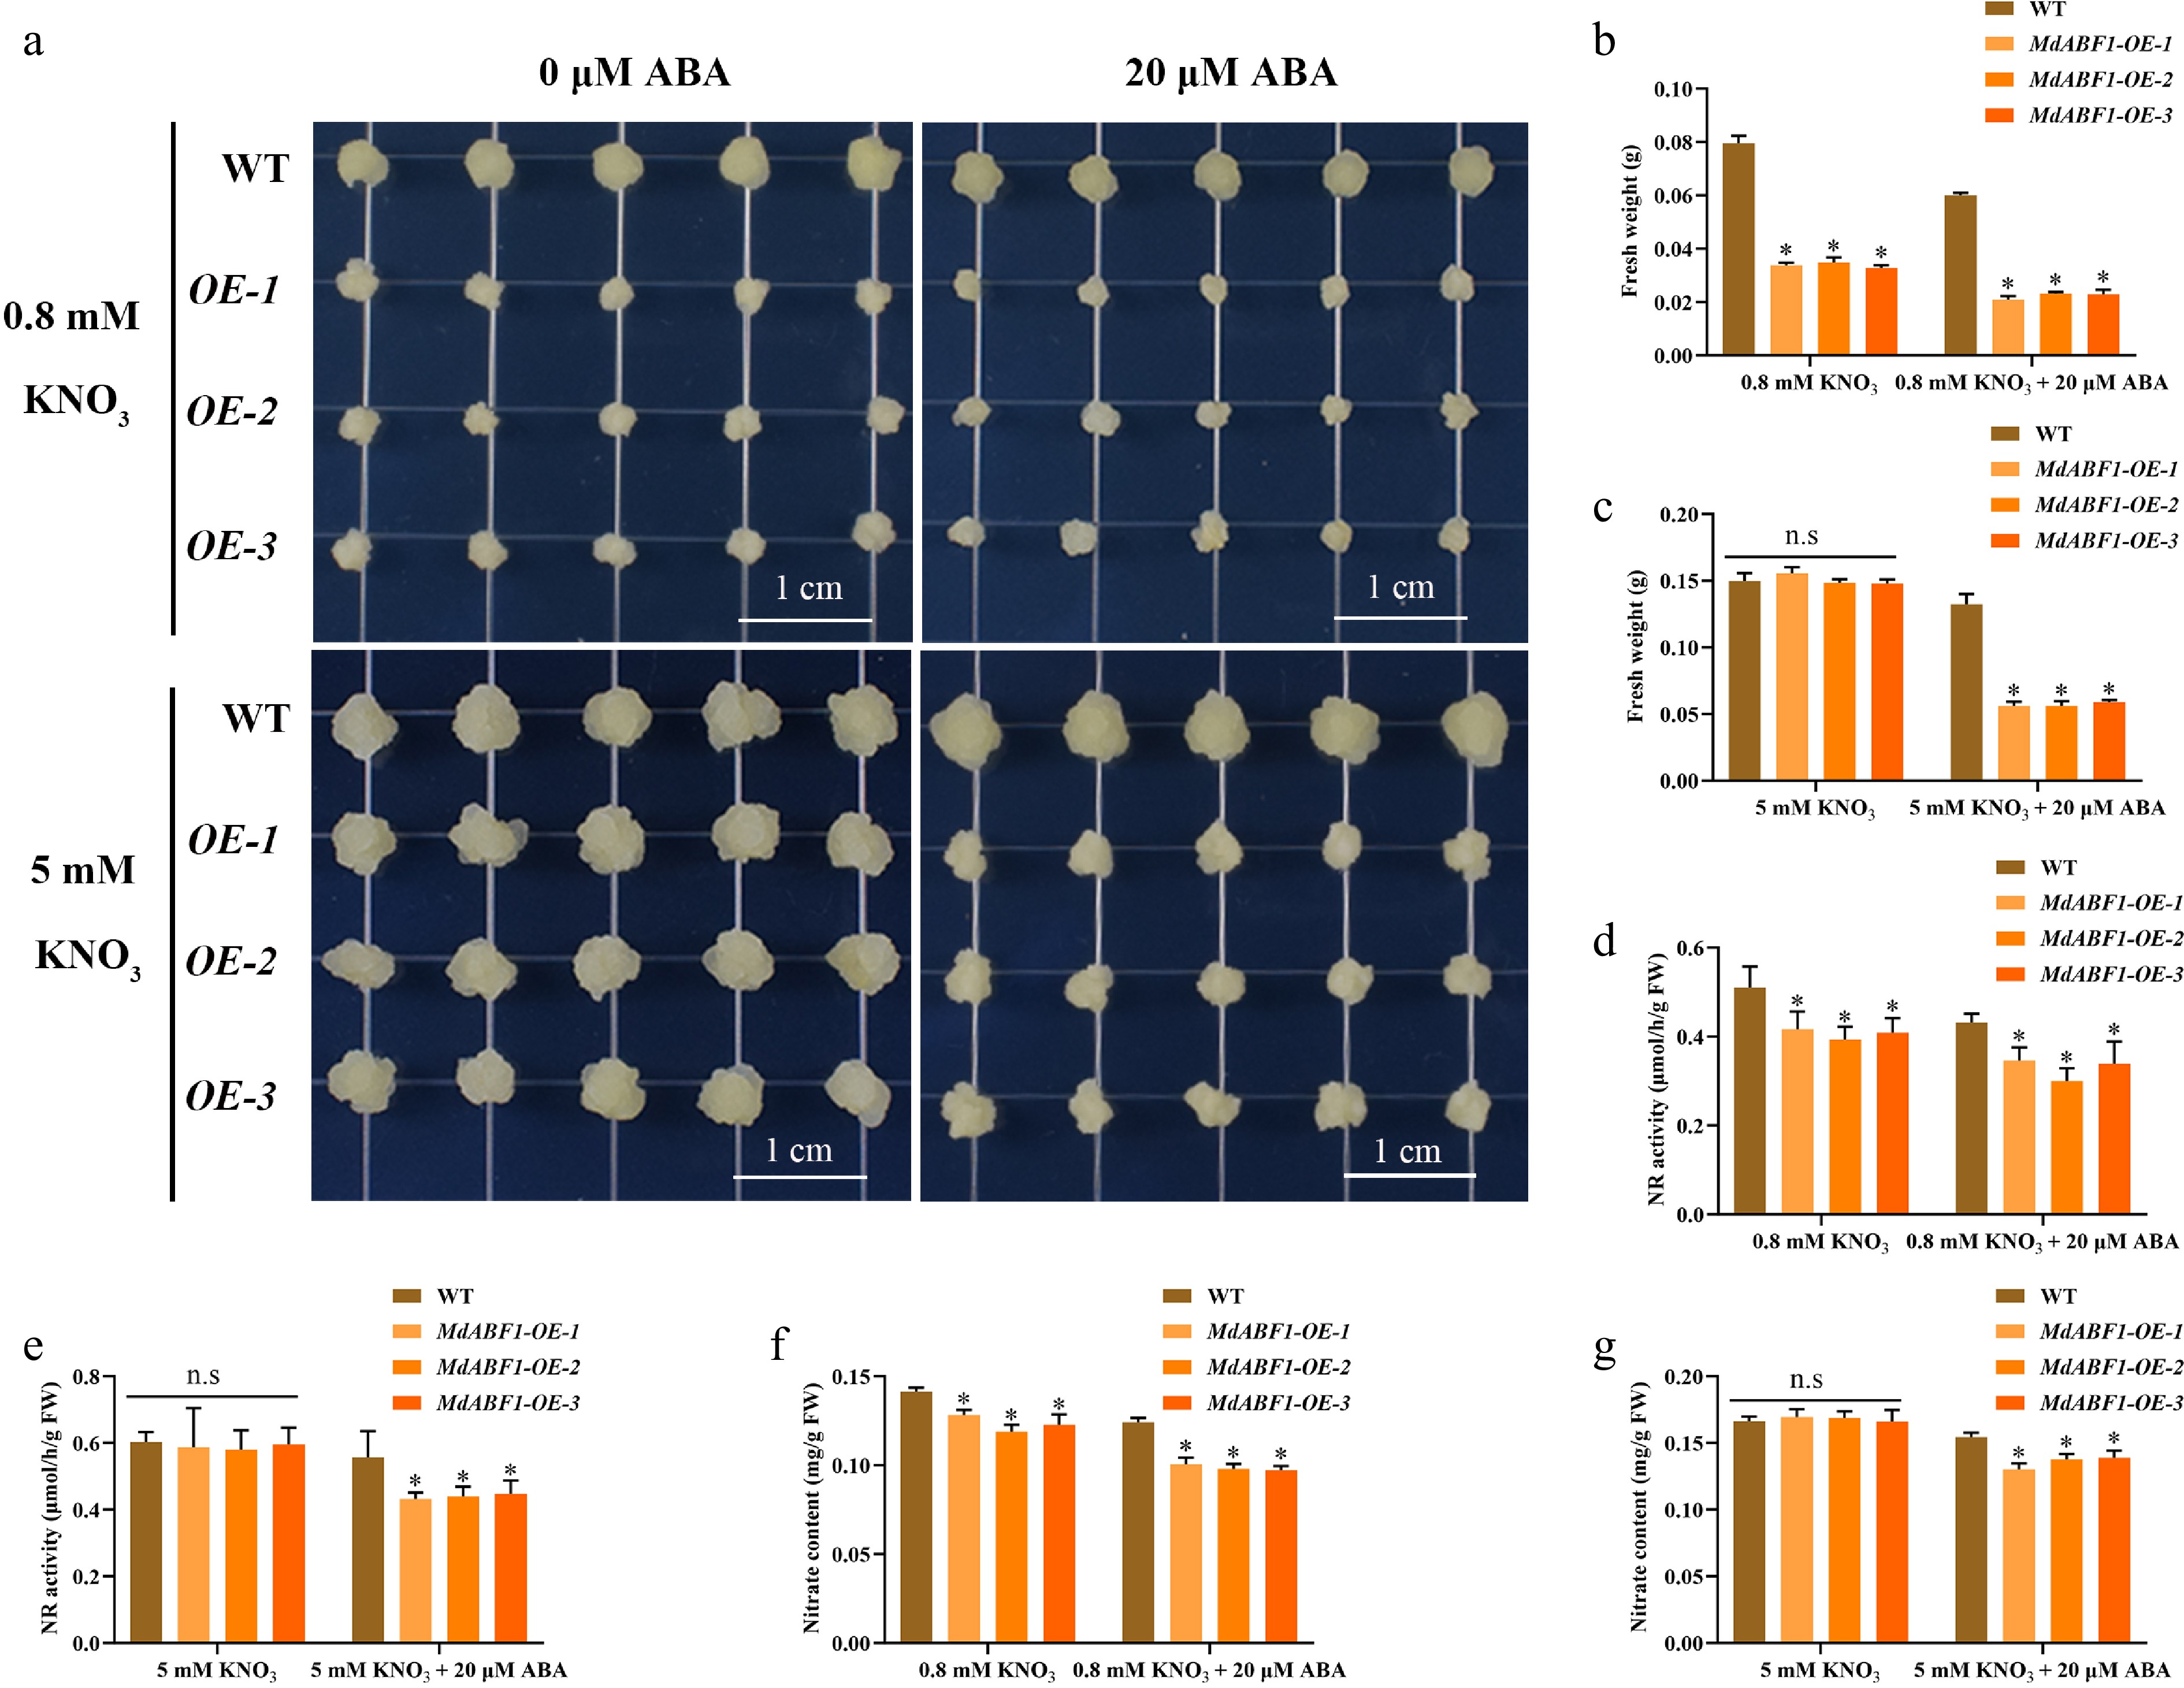
Figure 3.
Response of MdABF1 transgenic apple calli to different nitrate and ABA conditions. (a) Phenotypes of apple calli cultured under 0.8 mM and 5 mM KNO3 supplemented with 0 or 20 μM ABA. (b−g) Fresh weight (b, c), NR activity (d, e), nitrate content (f, g) in (a). Error bars exhibit the means ± SD of three independent replicates. Asterisks indicate significant differences (LSD test, *p < 0.05).
-
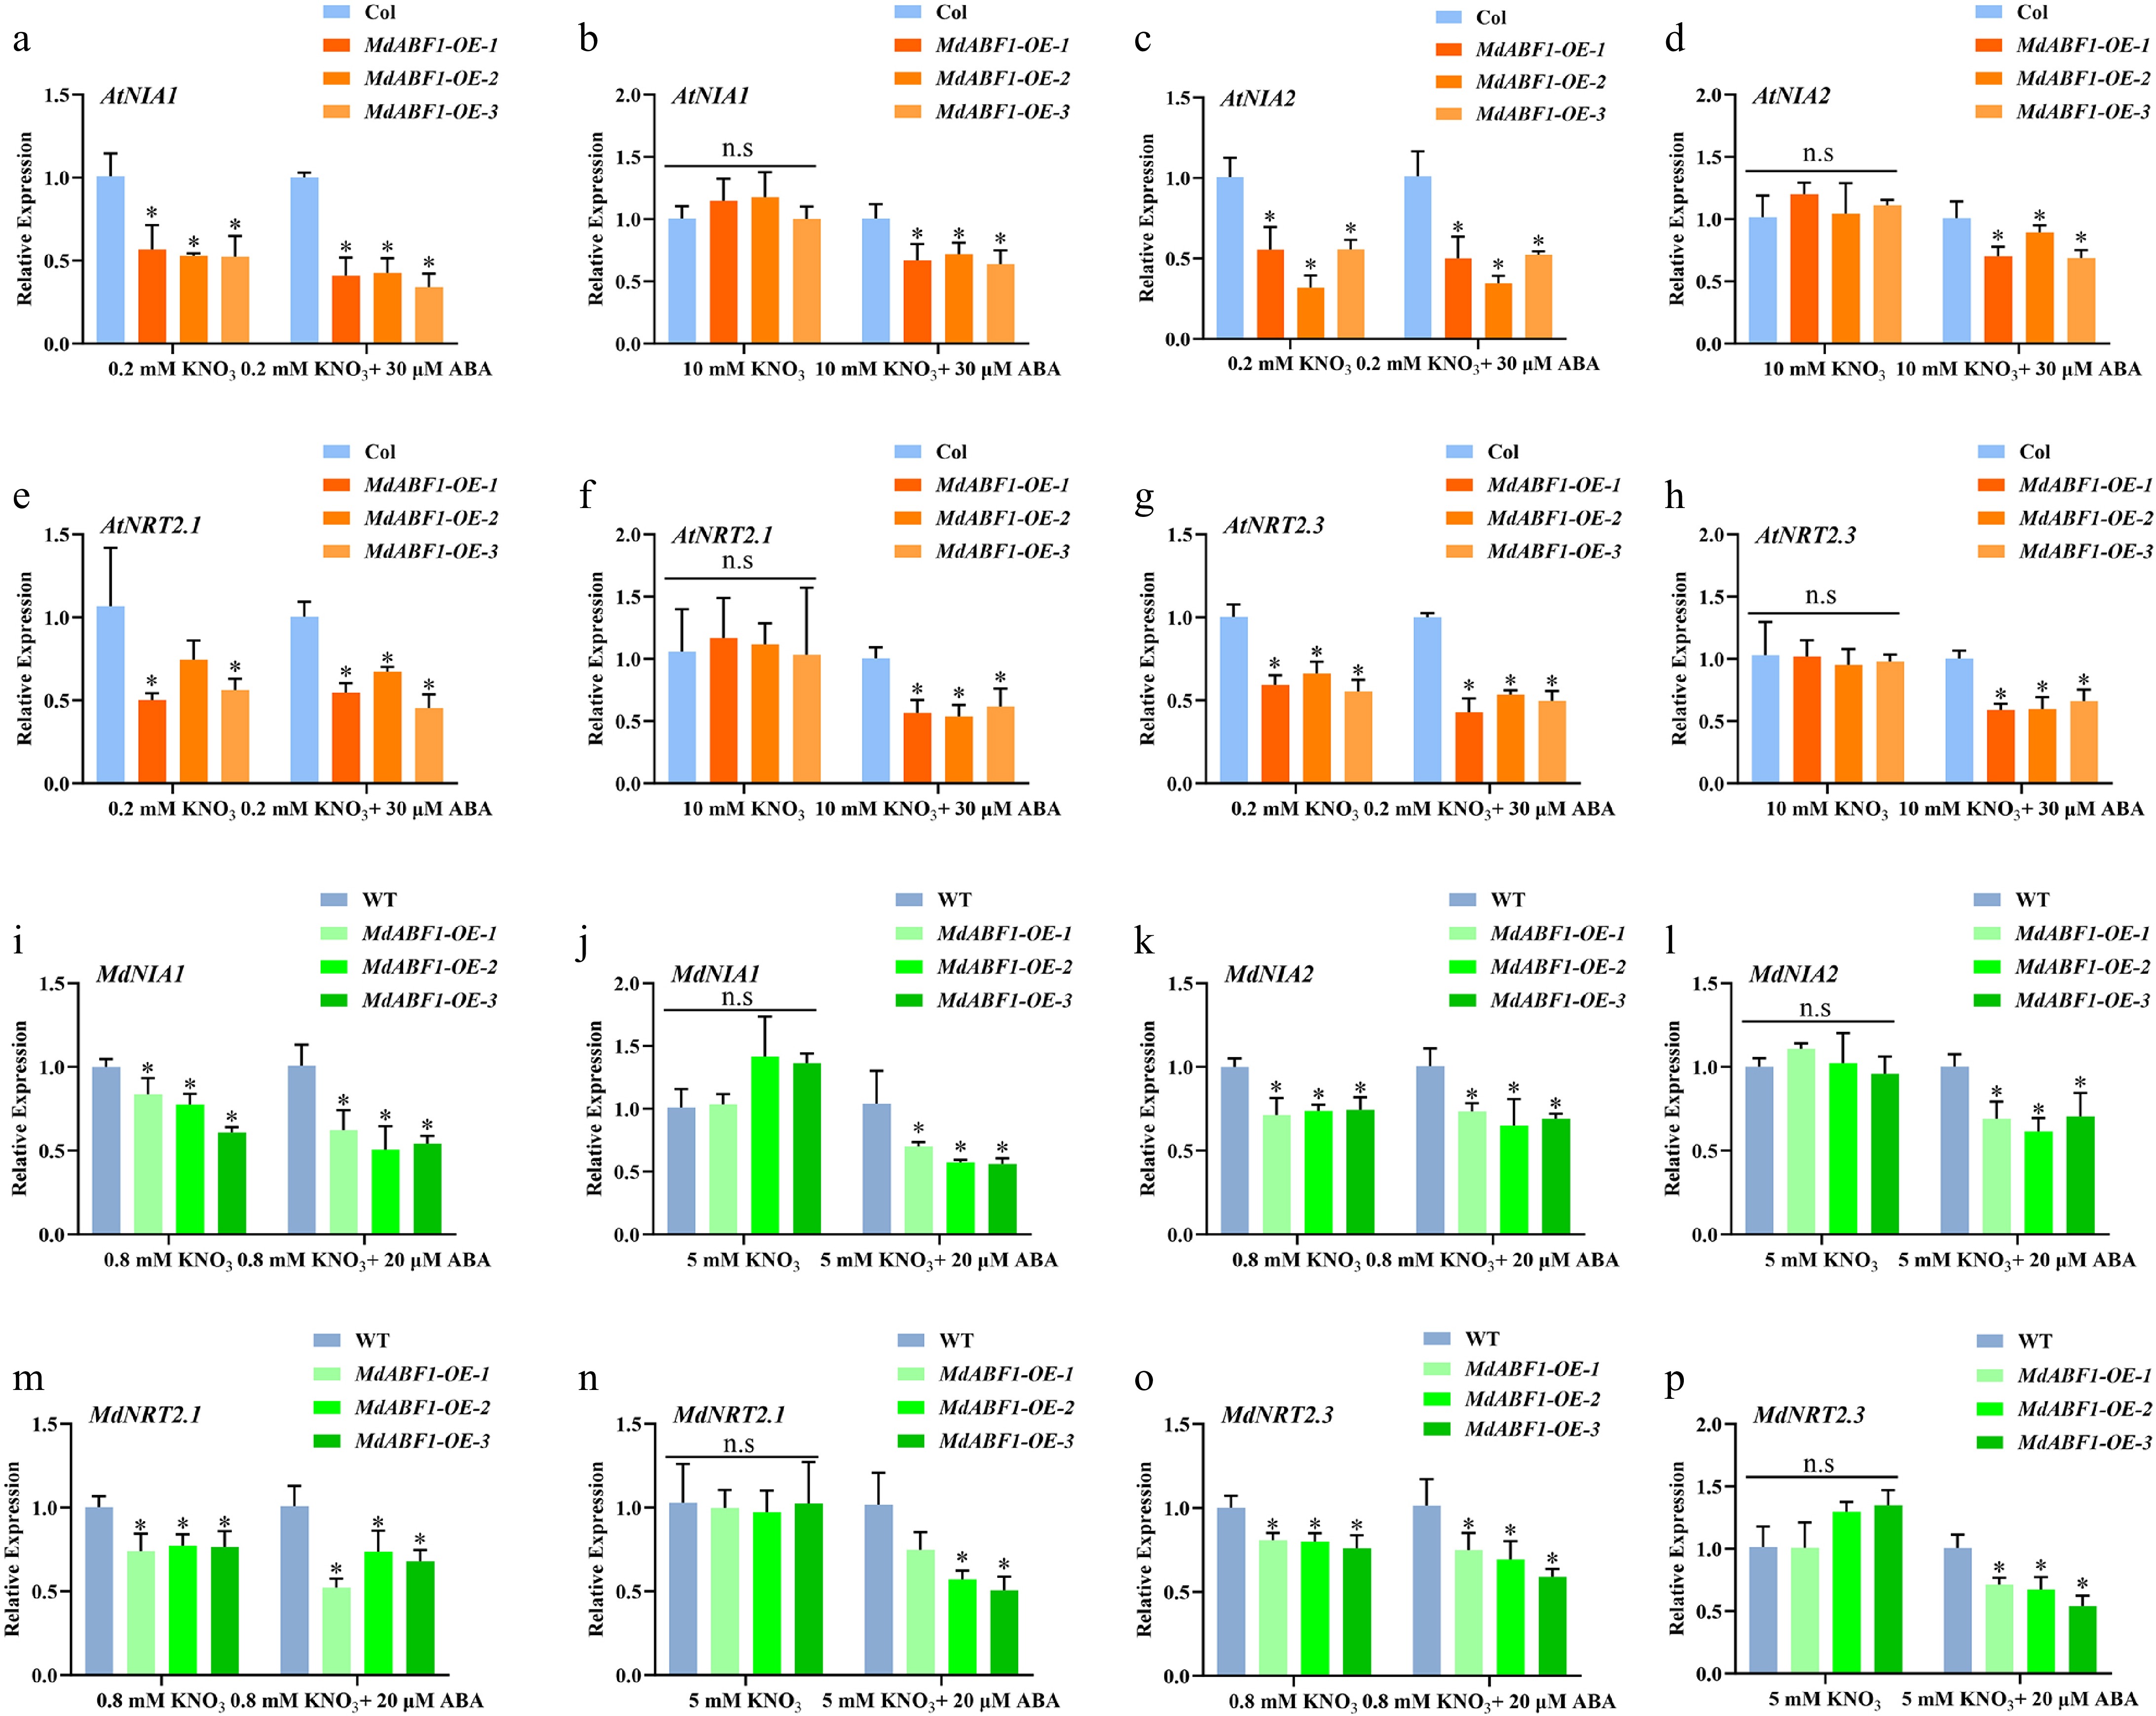
Figure 4.
Relative expression of NRT2s and NIAs in MdABF1 transgenic plants in response to nitrate and ABA. (a)−(h) Relative expression of AtNRT2s and AtNIAs in MdABF1 transgenic Arabidopsis under 0.2 mM and 10 mM nitrate conditions supplemented with 0 or 20 μM ABA. (i)−(p) Relative expression of MdNRT2s and MdNIAs in MdABF1 transgenic apple calli was incubated in 0.8 mM and 5 mM KNO3 with 0 or 20 μM ABA. Error bars exhibit the means ± SD of three independent replicates. Asterisks indicate significant differences (LSD test, *p < 0.05).
-
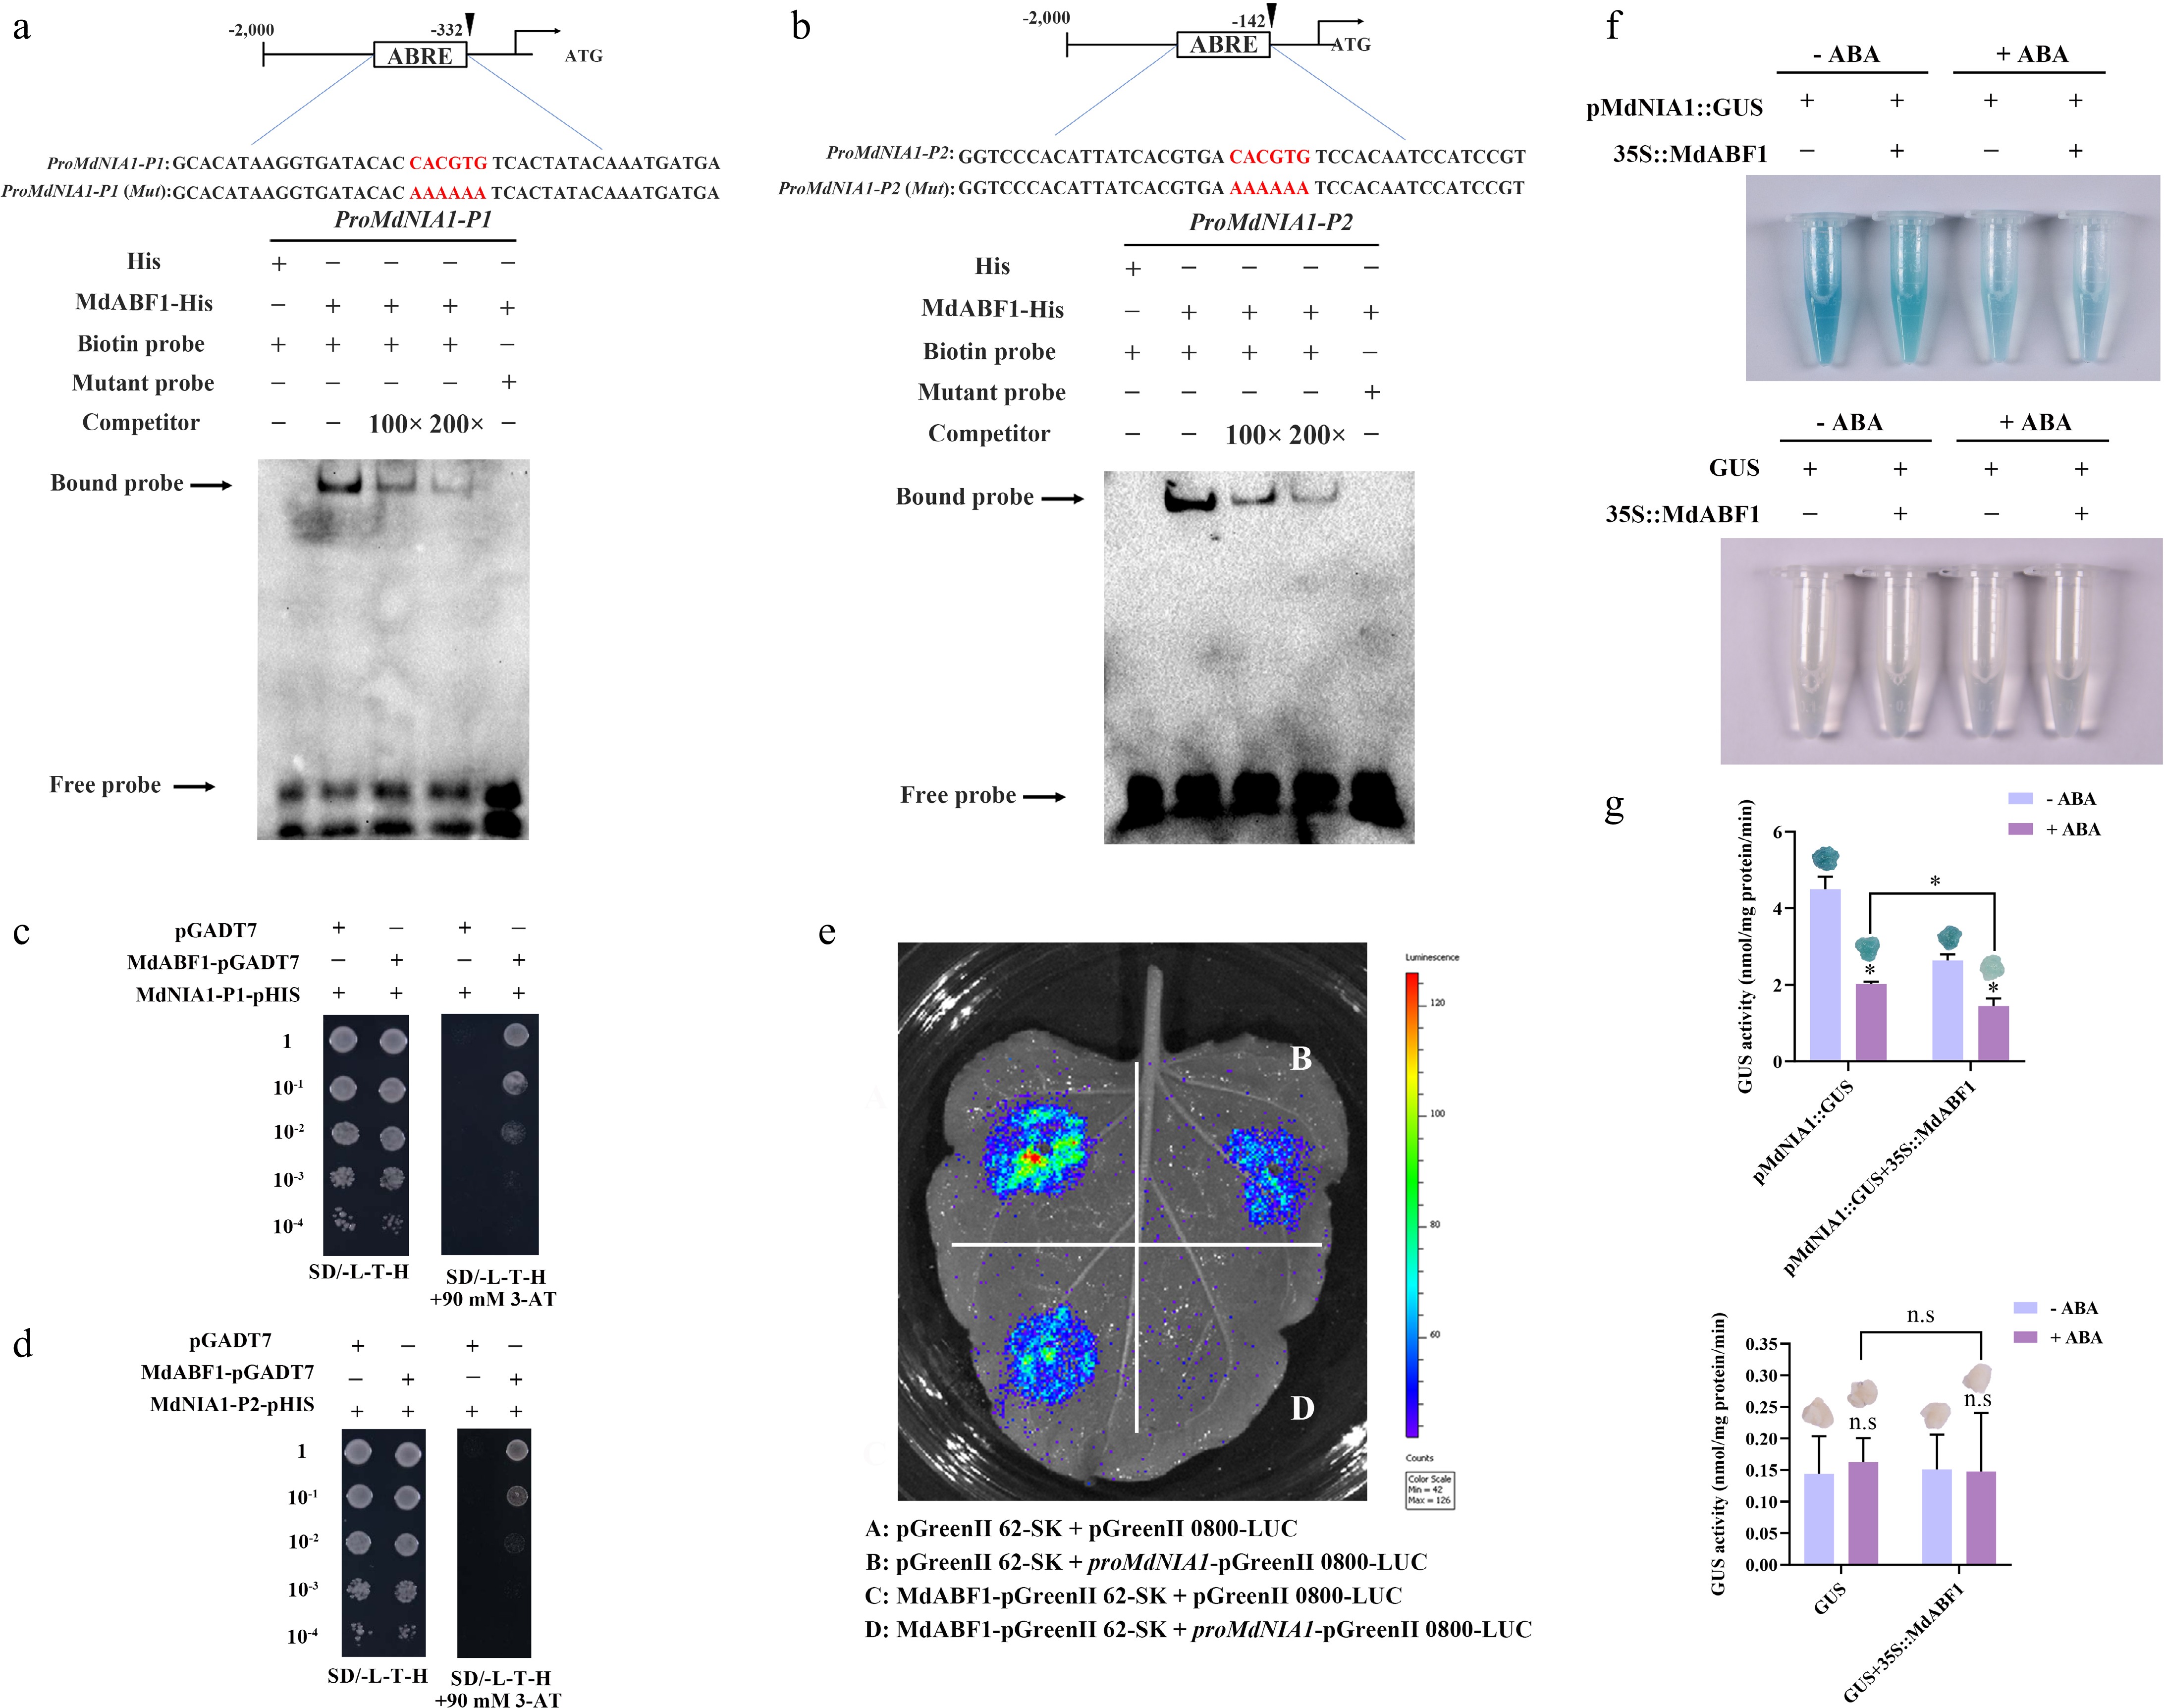
Figure 5.
MdABF1 binds to the promoter of MdNIA1. EMSA analysis showing the binding of MdABF1 to the (a) P1, and (b) P1 fragments of MdNIA1 promoter. Diagrams of the promoter of MdNIA1 are shown above. (c), (d) Y1H assay of the binding of MdABF1 to the MdNIA1 promoter in vitro. (e) Dual luciferase assays in tobacco leaves showing that MdABF1 transcriptionally repressed the expression of MdNIA1. (f) GUS staining experiment of apple calli showing that the repression of MdABF1 to the MdNIA1 promoter dependent on ABA. (g) GUS activity in (f). Error bars exhibit the means ± SD of three independent replicates. Asterisks indicate significant differences (LSD test, *p < 0.05).
-
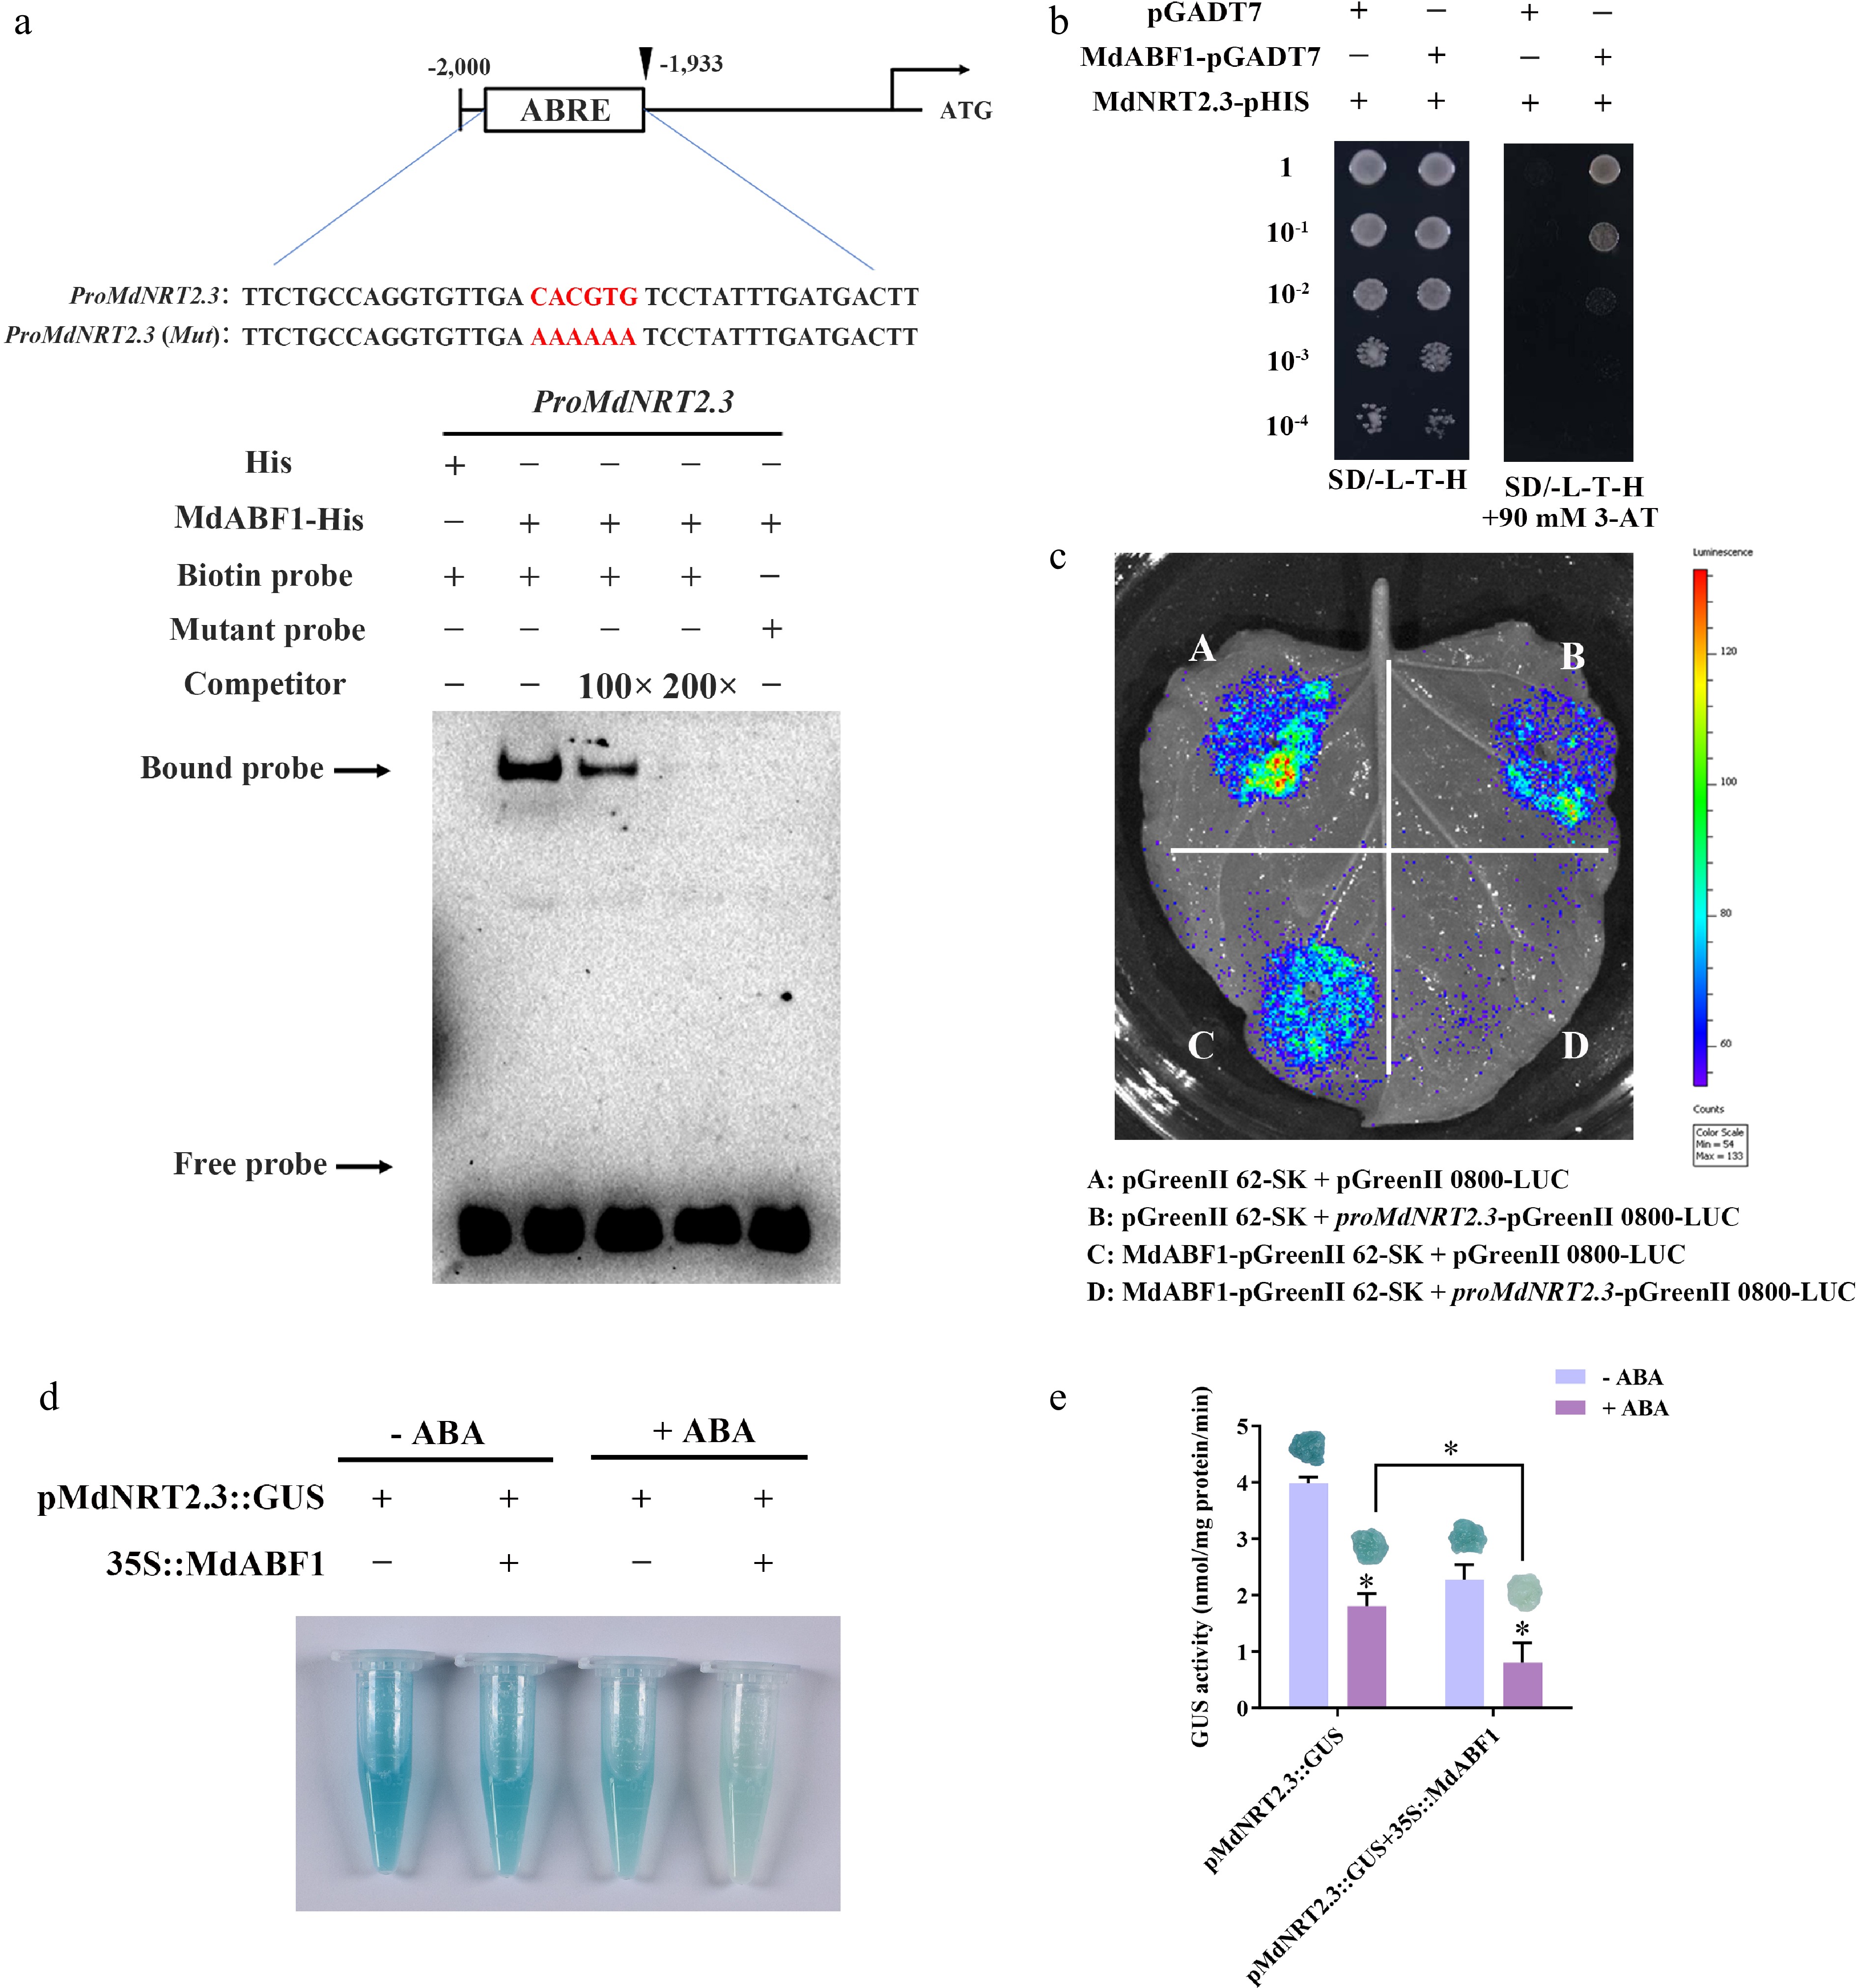
Figure 6.
MdABF1 binds to the promoter of MdNRT2.3. (a) EMSA analysis showing the binding of MdABF1 to the MdNRT2.3 promoter. Diagram of the promoter of MdNRT2.3 is shown above. (b) Y1H assay of the binding of MdABF1 to the MdNRT2.3 promoter in vitro. (c) Dual luciferase assays in tobacco leaves showing that MdABF1 transcriptionally repressed the expression of MdNRT2.3. (d) GUS staining experiment of apple calli showing the repression of MdABF1 to the MdNRT2.3 promoter. (e) GUS activity in (d). Error bars exhibit the means ± SD of three independent replicates. Asterisks indicate significant differences (LSD test, *p < 0.05).
-
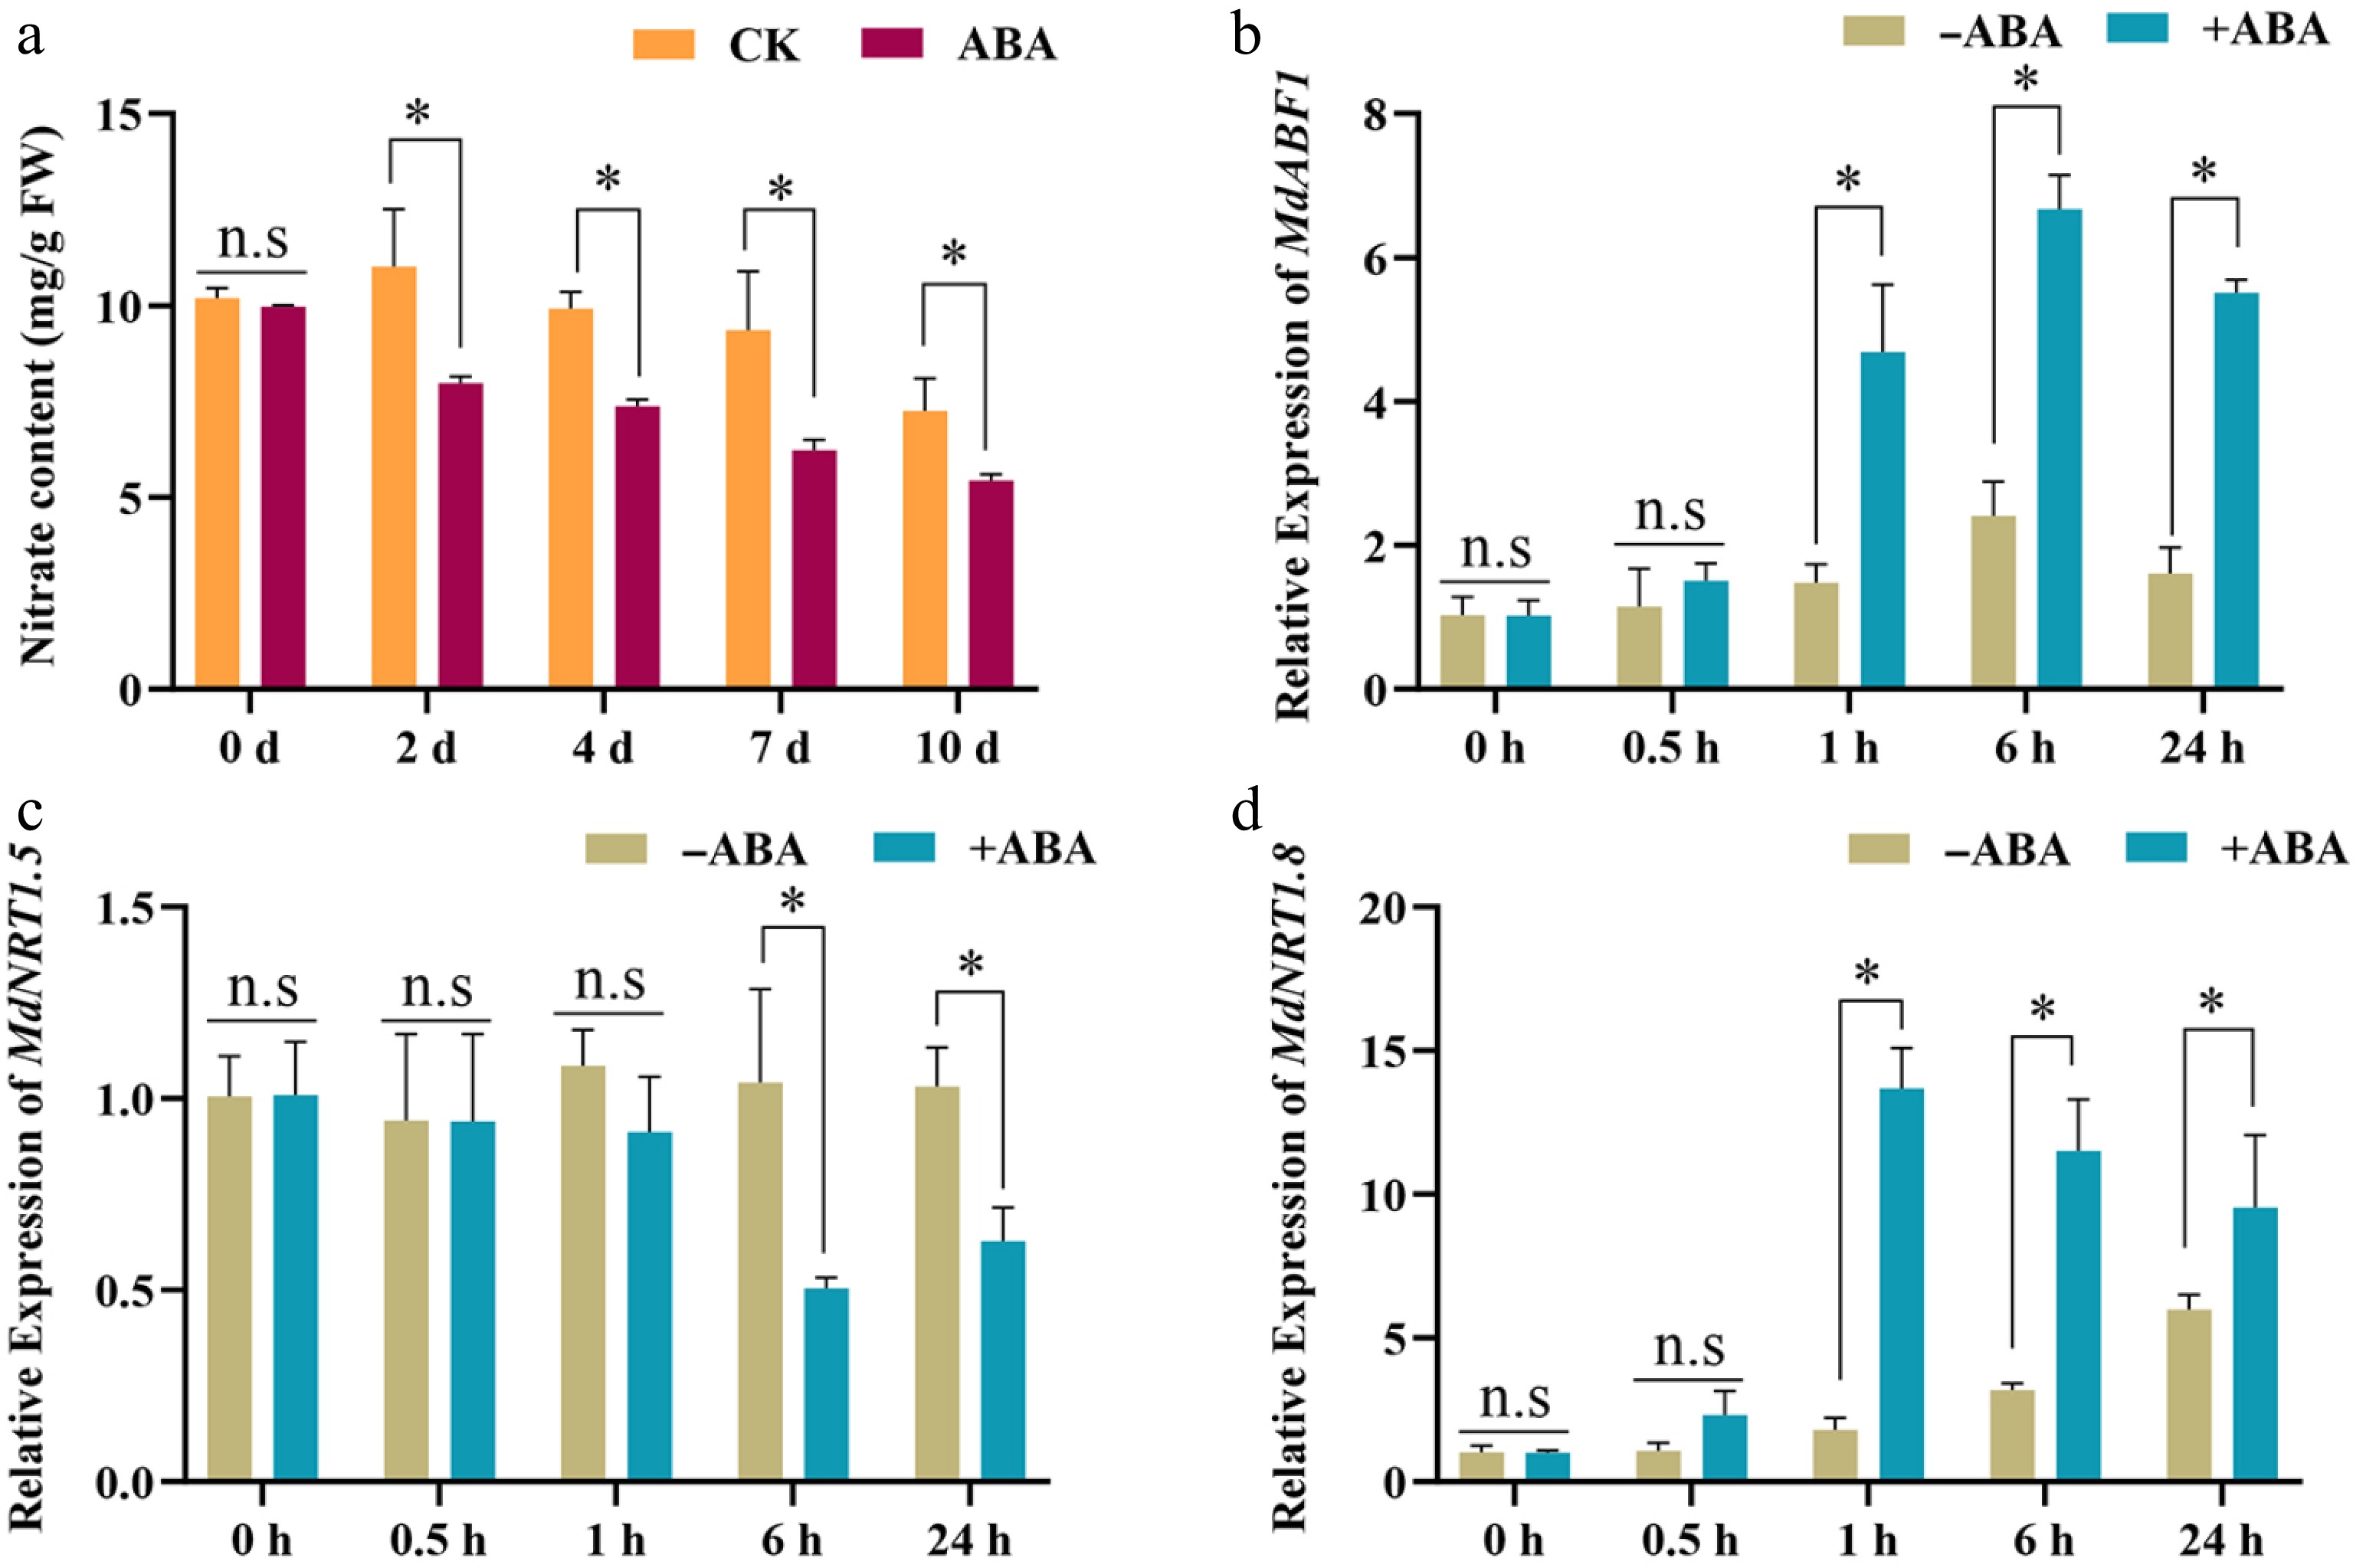
Figure 7.
ABA regulates nitrate allocation. (a) The nitrate content of apple branches. The samples were collected and analyzed for nitrate content treated by ABA for 2, 4, 7, and 10 d. (b)−(d) Expression analysis of MdABF1, MdNRT1.5, and MdNRT1.8 in apple branches treated by ABA. Error bars exhibit the means ± SD of three independent replicates. Asterisks indicate significant differences (LSD test, *p < 0.05).
-
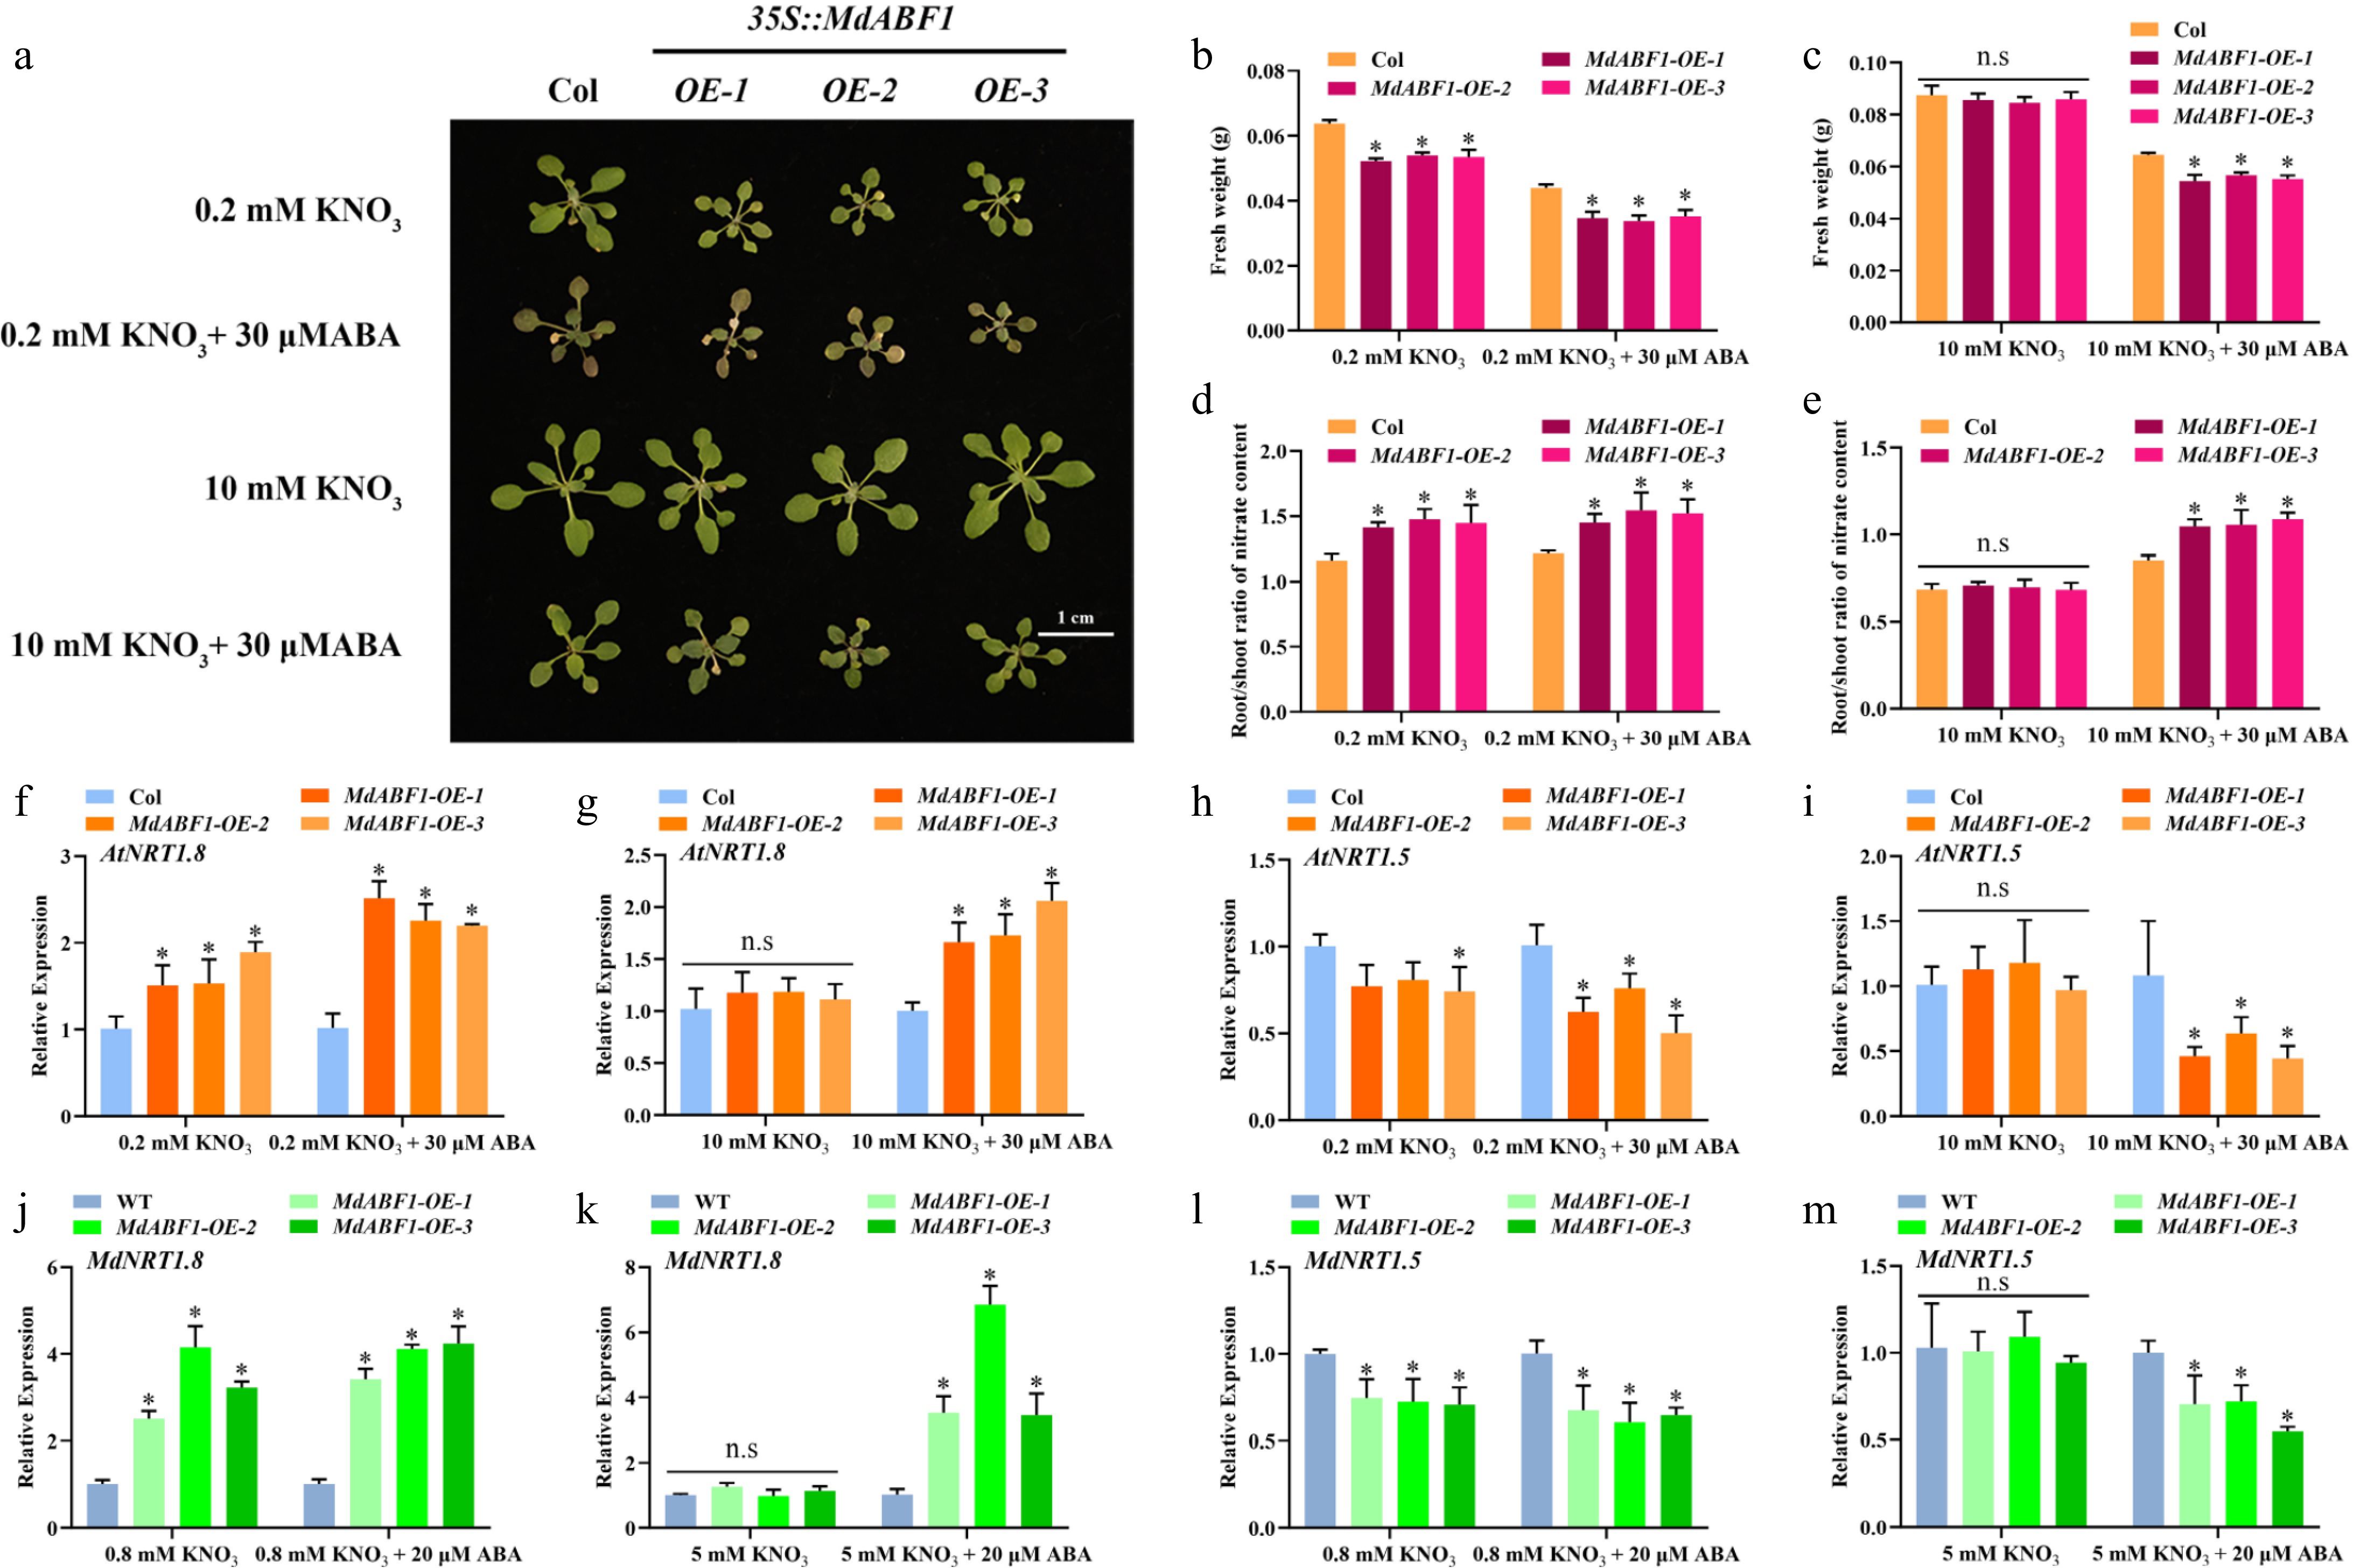
Figure 8.
MdABF1 plays a positive role in nitrate transport. (a) Phenotype of MdABF1 overexpression Arabidopsis treated with different concentrations of nitrate (0.2 or 10 mM KNO3), and ABA (0 or 30 μM). (b), (c) Fresh weight and (d), (e) root/shoot ratio of nitrate content in (a). Expression of (f), (g) AtNRT1.8 and (h), (i) AtNRT1.5 genes in Arabidopsis. Expression of (j), (k) AtNRT1.8 and (l), (m) AtNRT1.5 genes in apple calli. Error bars exhibit the means ± SD of three independent replicates. Asterisks indicate significant differences (LSD test, *p < 0.05).
-
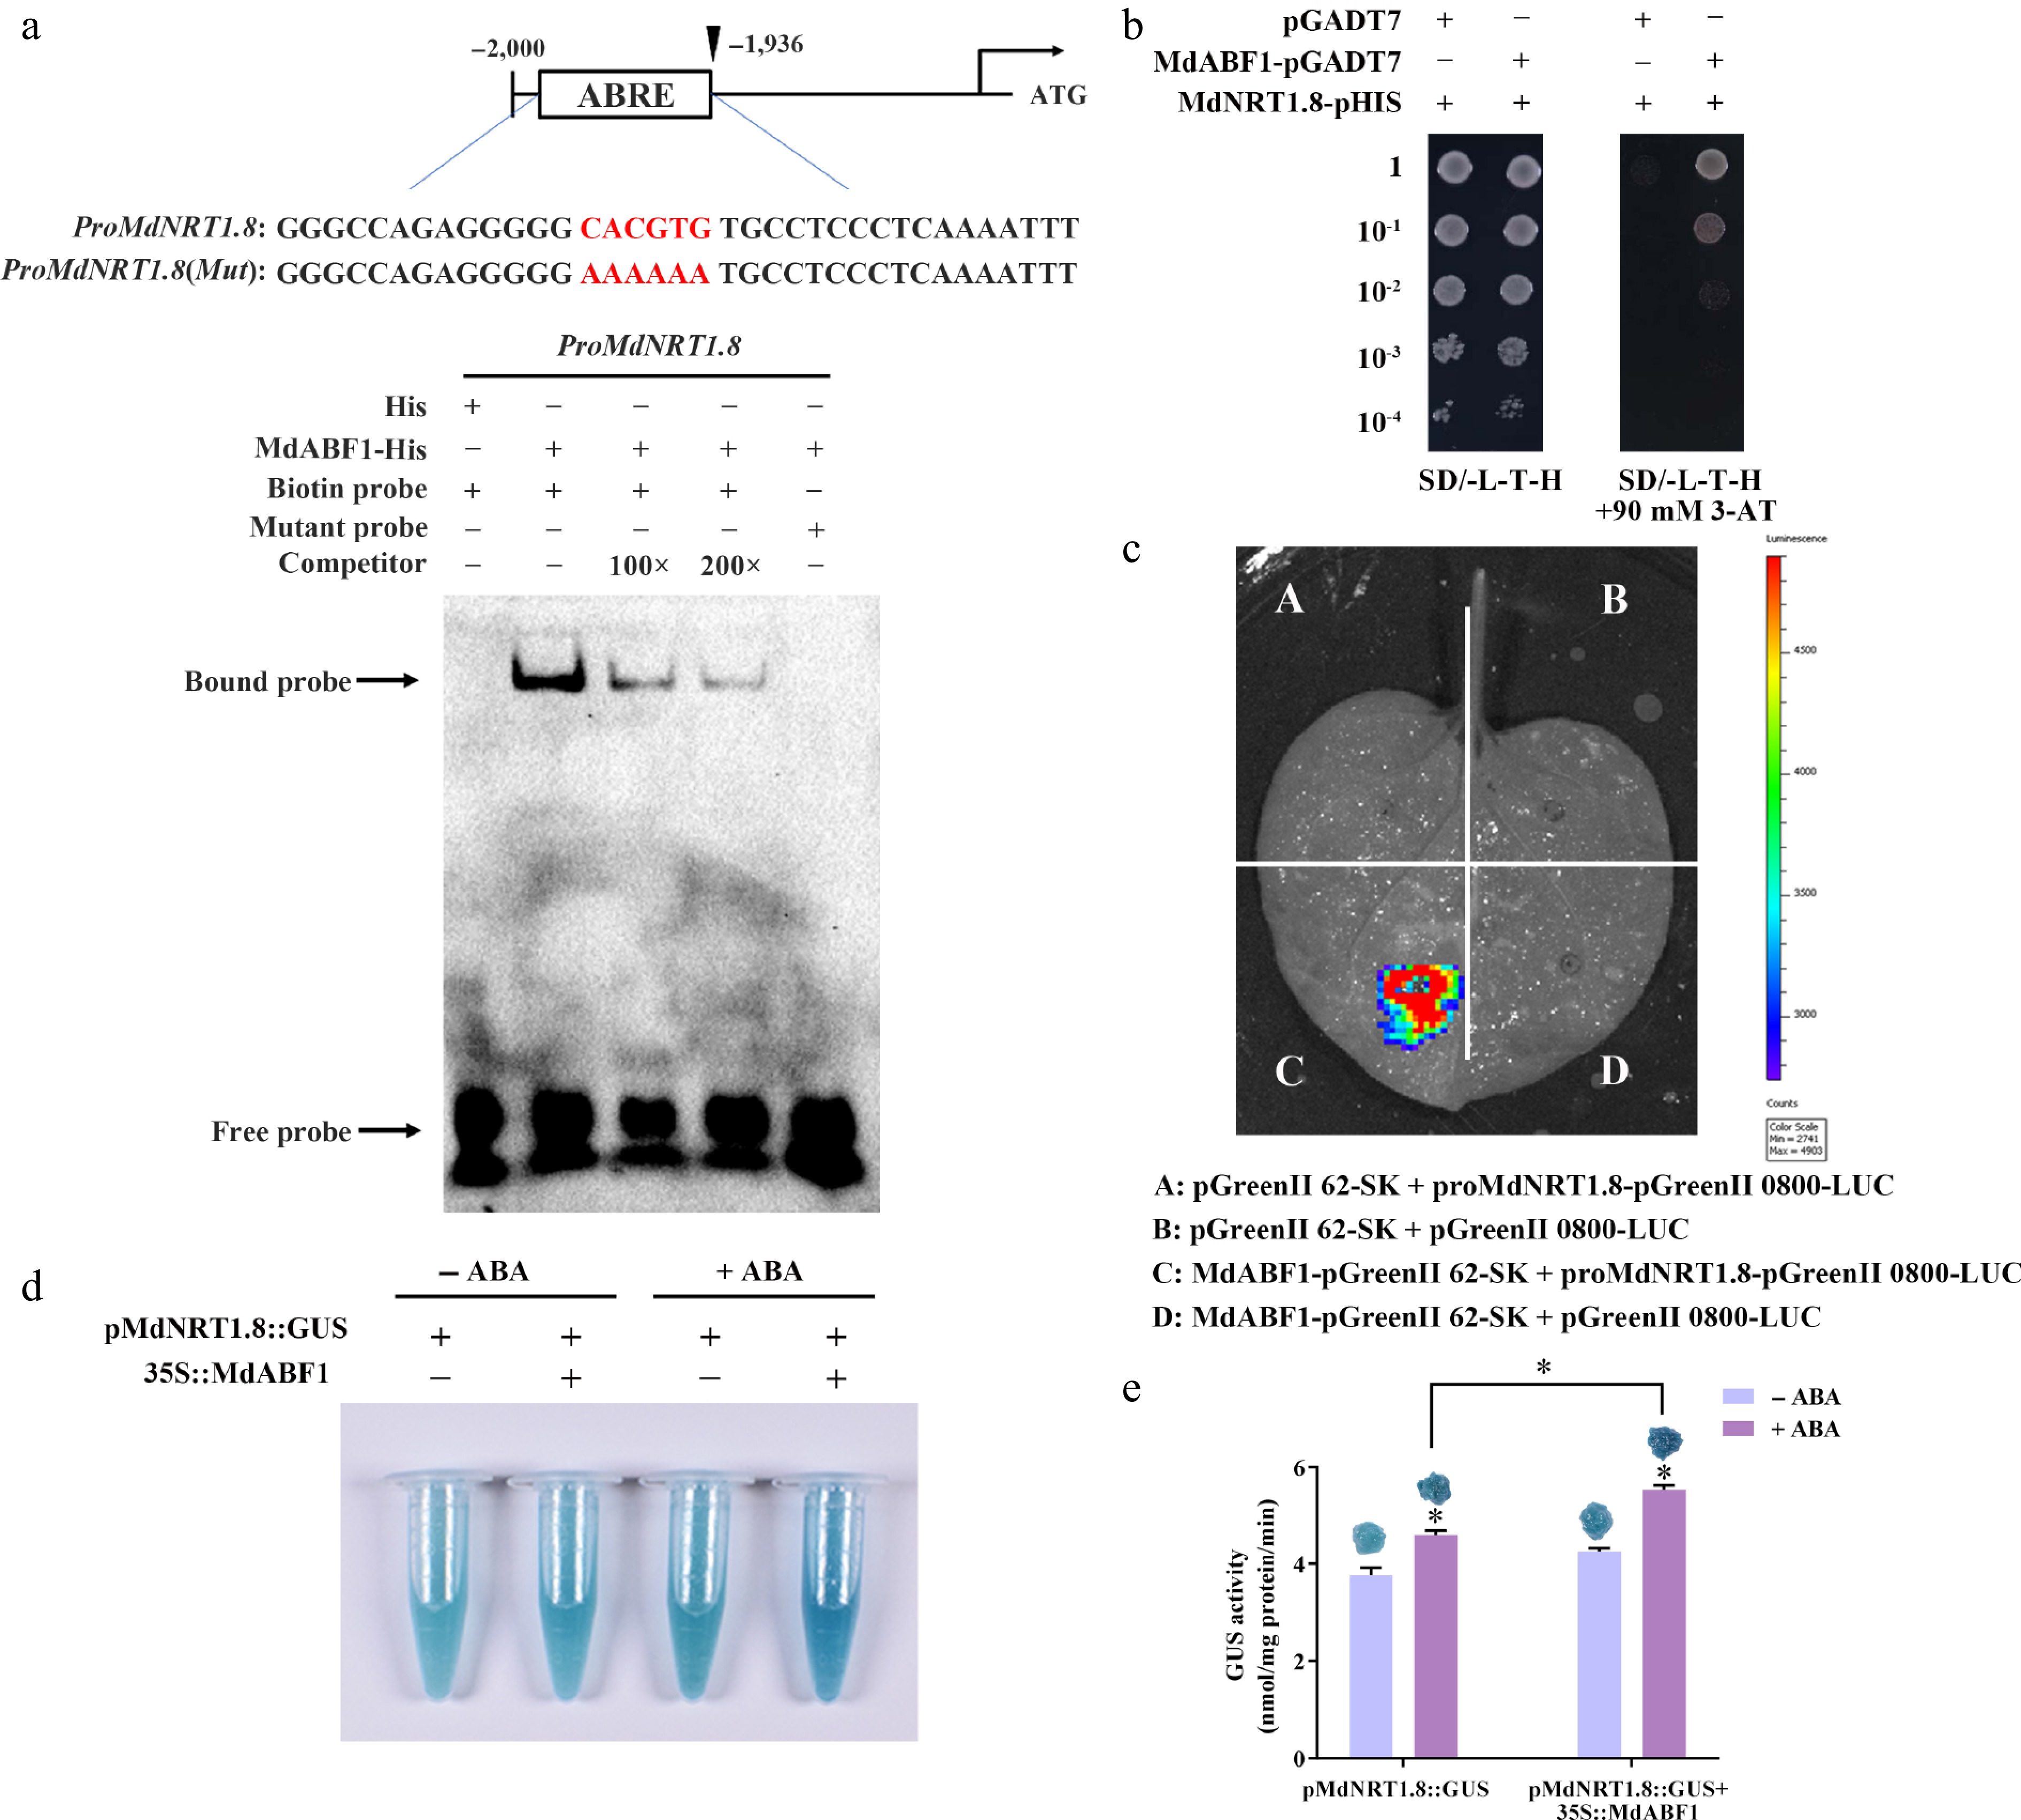
Figure 9.
MdABF1 binds directly to the promoter of MdNRT1.8 and activates its expression. (a) EMSA analysis showing MdABF1 binding to the MdNRT1.8 promoter. Diagram of the promoter of MdNRT1.8 are shown above. (b) Y1H assay of MdABF1 binding to the MdNRT1.8 promoter in vitro. (c) Dual luciferase assays in tobacco leaves showing that MdABF1 transcriptionally repressed the expression of MdNRT1.8. (d) GUS staining experiment of apple calli showing the repression of MdABF1 to the MdNRT2.3 promoter. (e) GUS activity in (d). Error bars exhibit the means ± SD of three independent replicates. Asterisks indicate significant differences (LSD test, *p < 0.05).
-
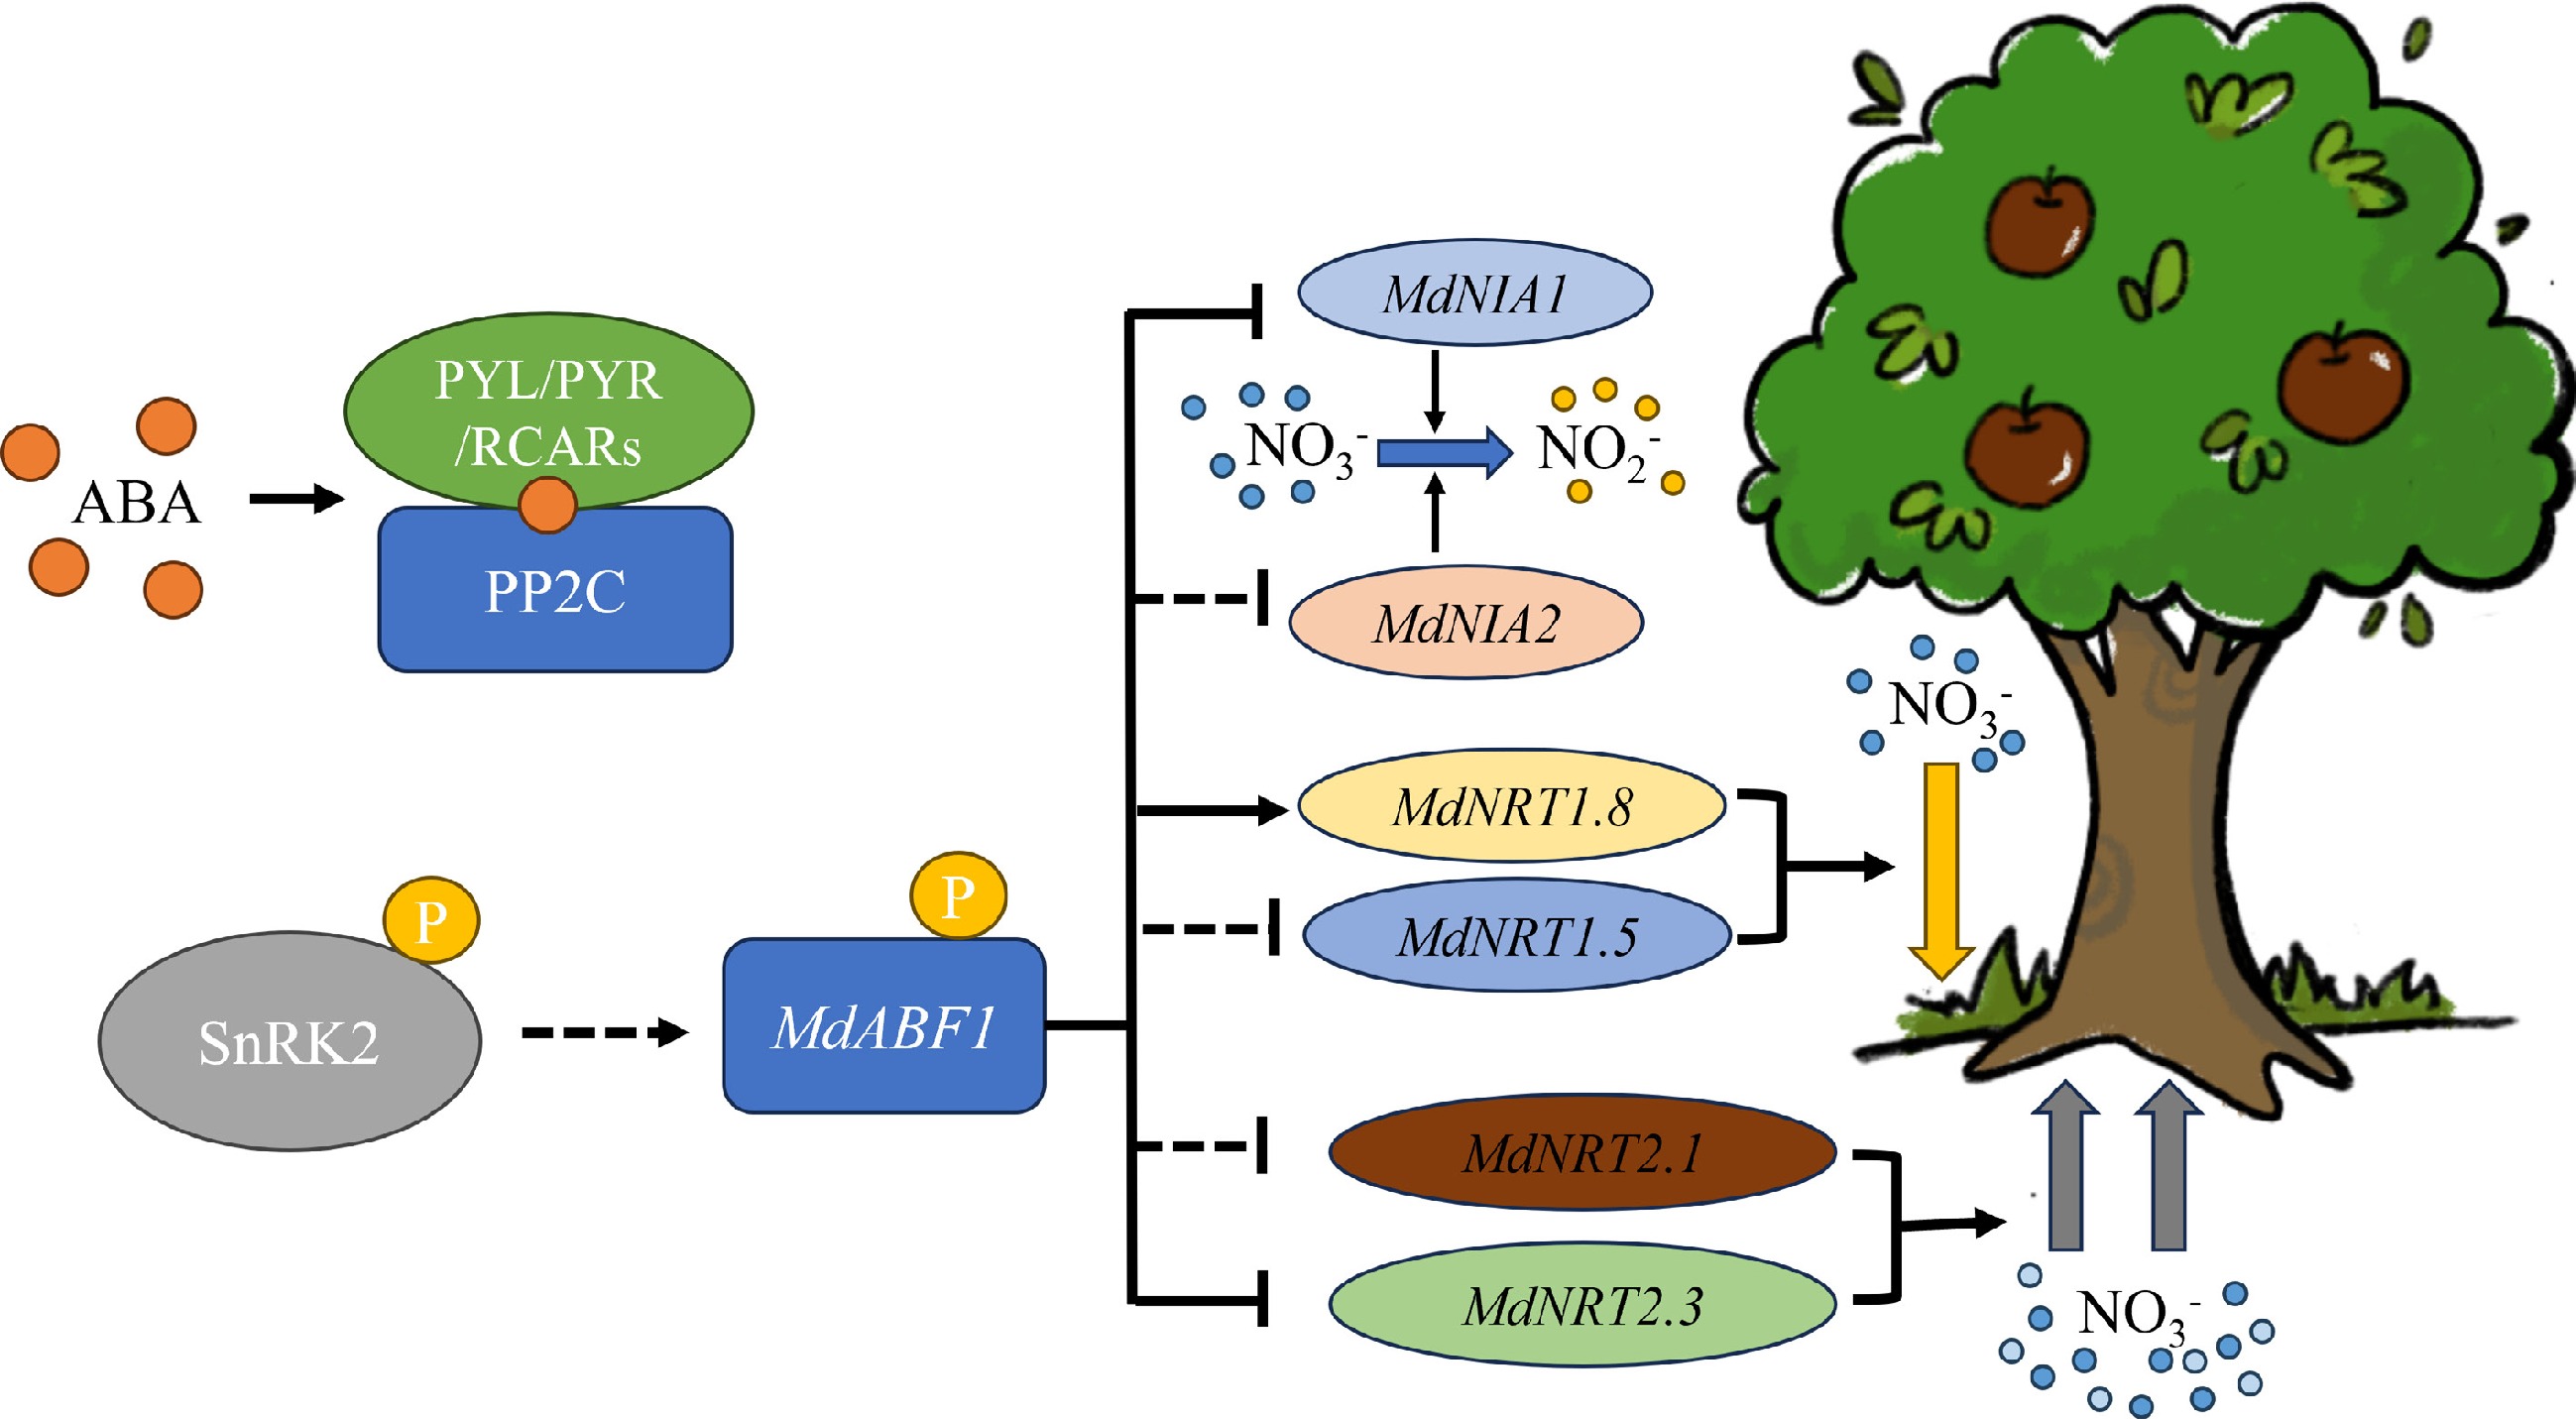
Figure 10.
Working model of an ABA mediated MdABF1-MdNRTs/NIAs module in regulating nitrate utilization in apple. In the presence of nitrate, ABA-mediated MdABF1 can be activated. This occurrence has a direct negative moderator effect on MdNIA1 and MdNRT2.3, and a positive moderator effect on MdNRT1.8. At the same time MdABF1 has an indirect regulatory effect on MdNIA2, MdNRT1.5, and MdNRT2.1. Nitrate absorption was inhibited by downregulation of MdNRT2.1 and MdNRT2.3. The down regulation of the MdNIA1 and MdNIA2 transcripts inhibited the process of nitrate assimilation. In contrast, increasing the level of MdNRT1.8 and decreasing the level of MdNRT1.5 favored the reallocation of nitrate to the root system.
Figures
(10)
Tables
(0)