-
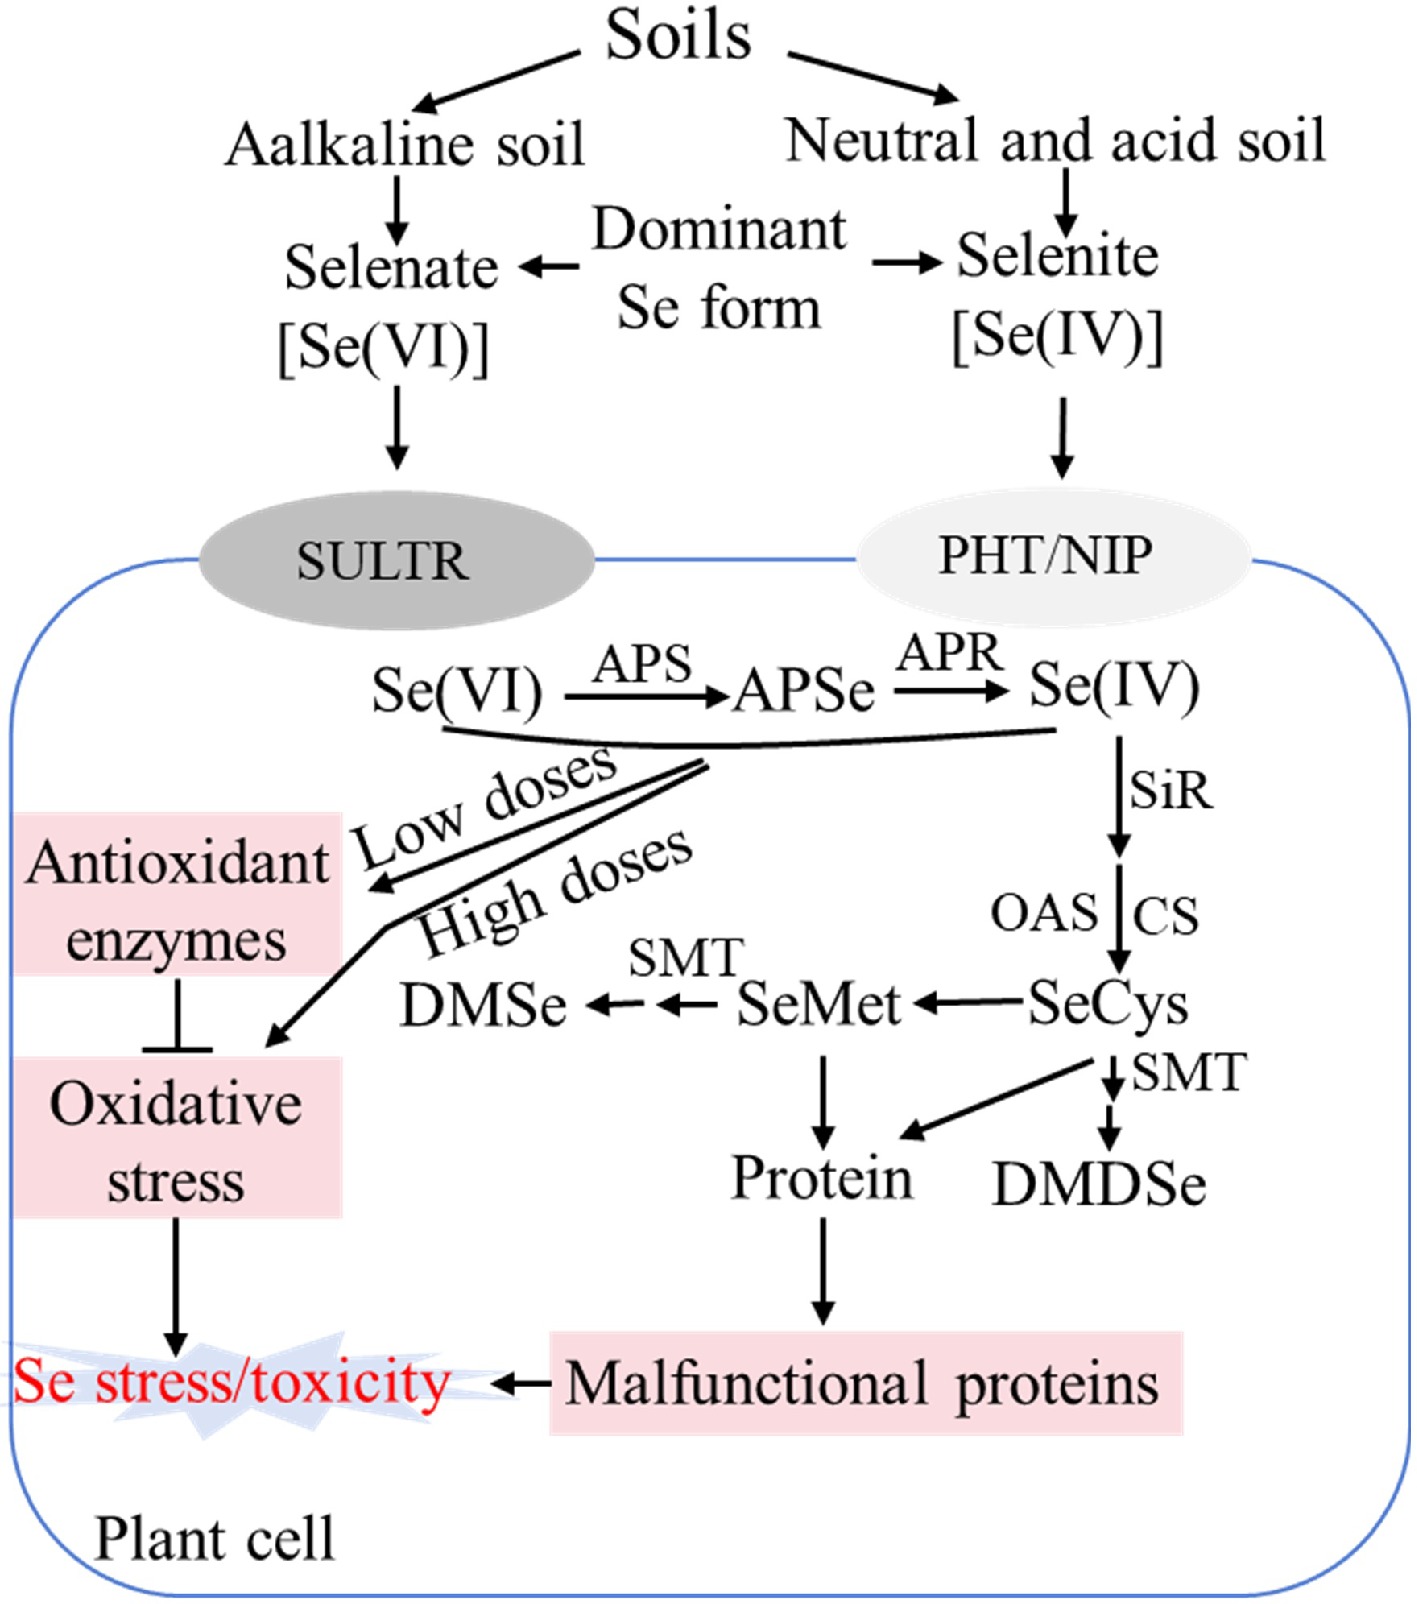
Figure 1.
Schematic diagram showing selenium assimilation pathway and roles in plants. SULTR: Sulfate transporter; PHT: Phosphate transporter; NIP: Nodulin 26-like intrinsic protein. APS: ATP sulfurylase; APSe: Adenosine phosphoselenate; APR: APS reductase; SiR: Sulfite reductase; CS: Cysteine synthase; OAS: O-acetylserine; SeCys: Selenocysteine; SeMet: selenomethionine. SMT: Selenocysteine methyltransferase; DMSe: non-toxic dimethylselenide; DMDSe: dimethyldiselenide; ROS: Reactive oxygen species; Se: Selenium.
-
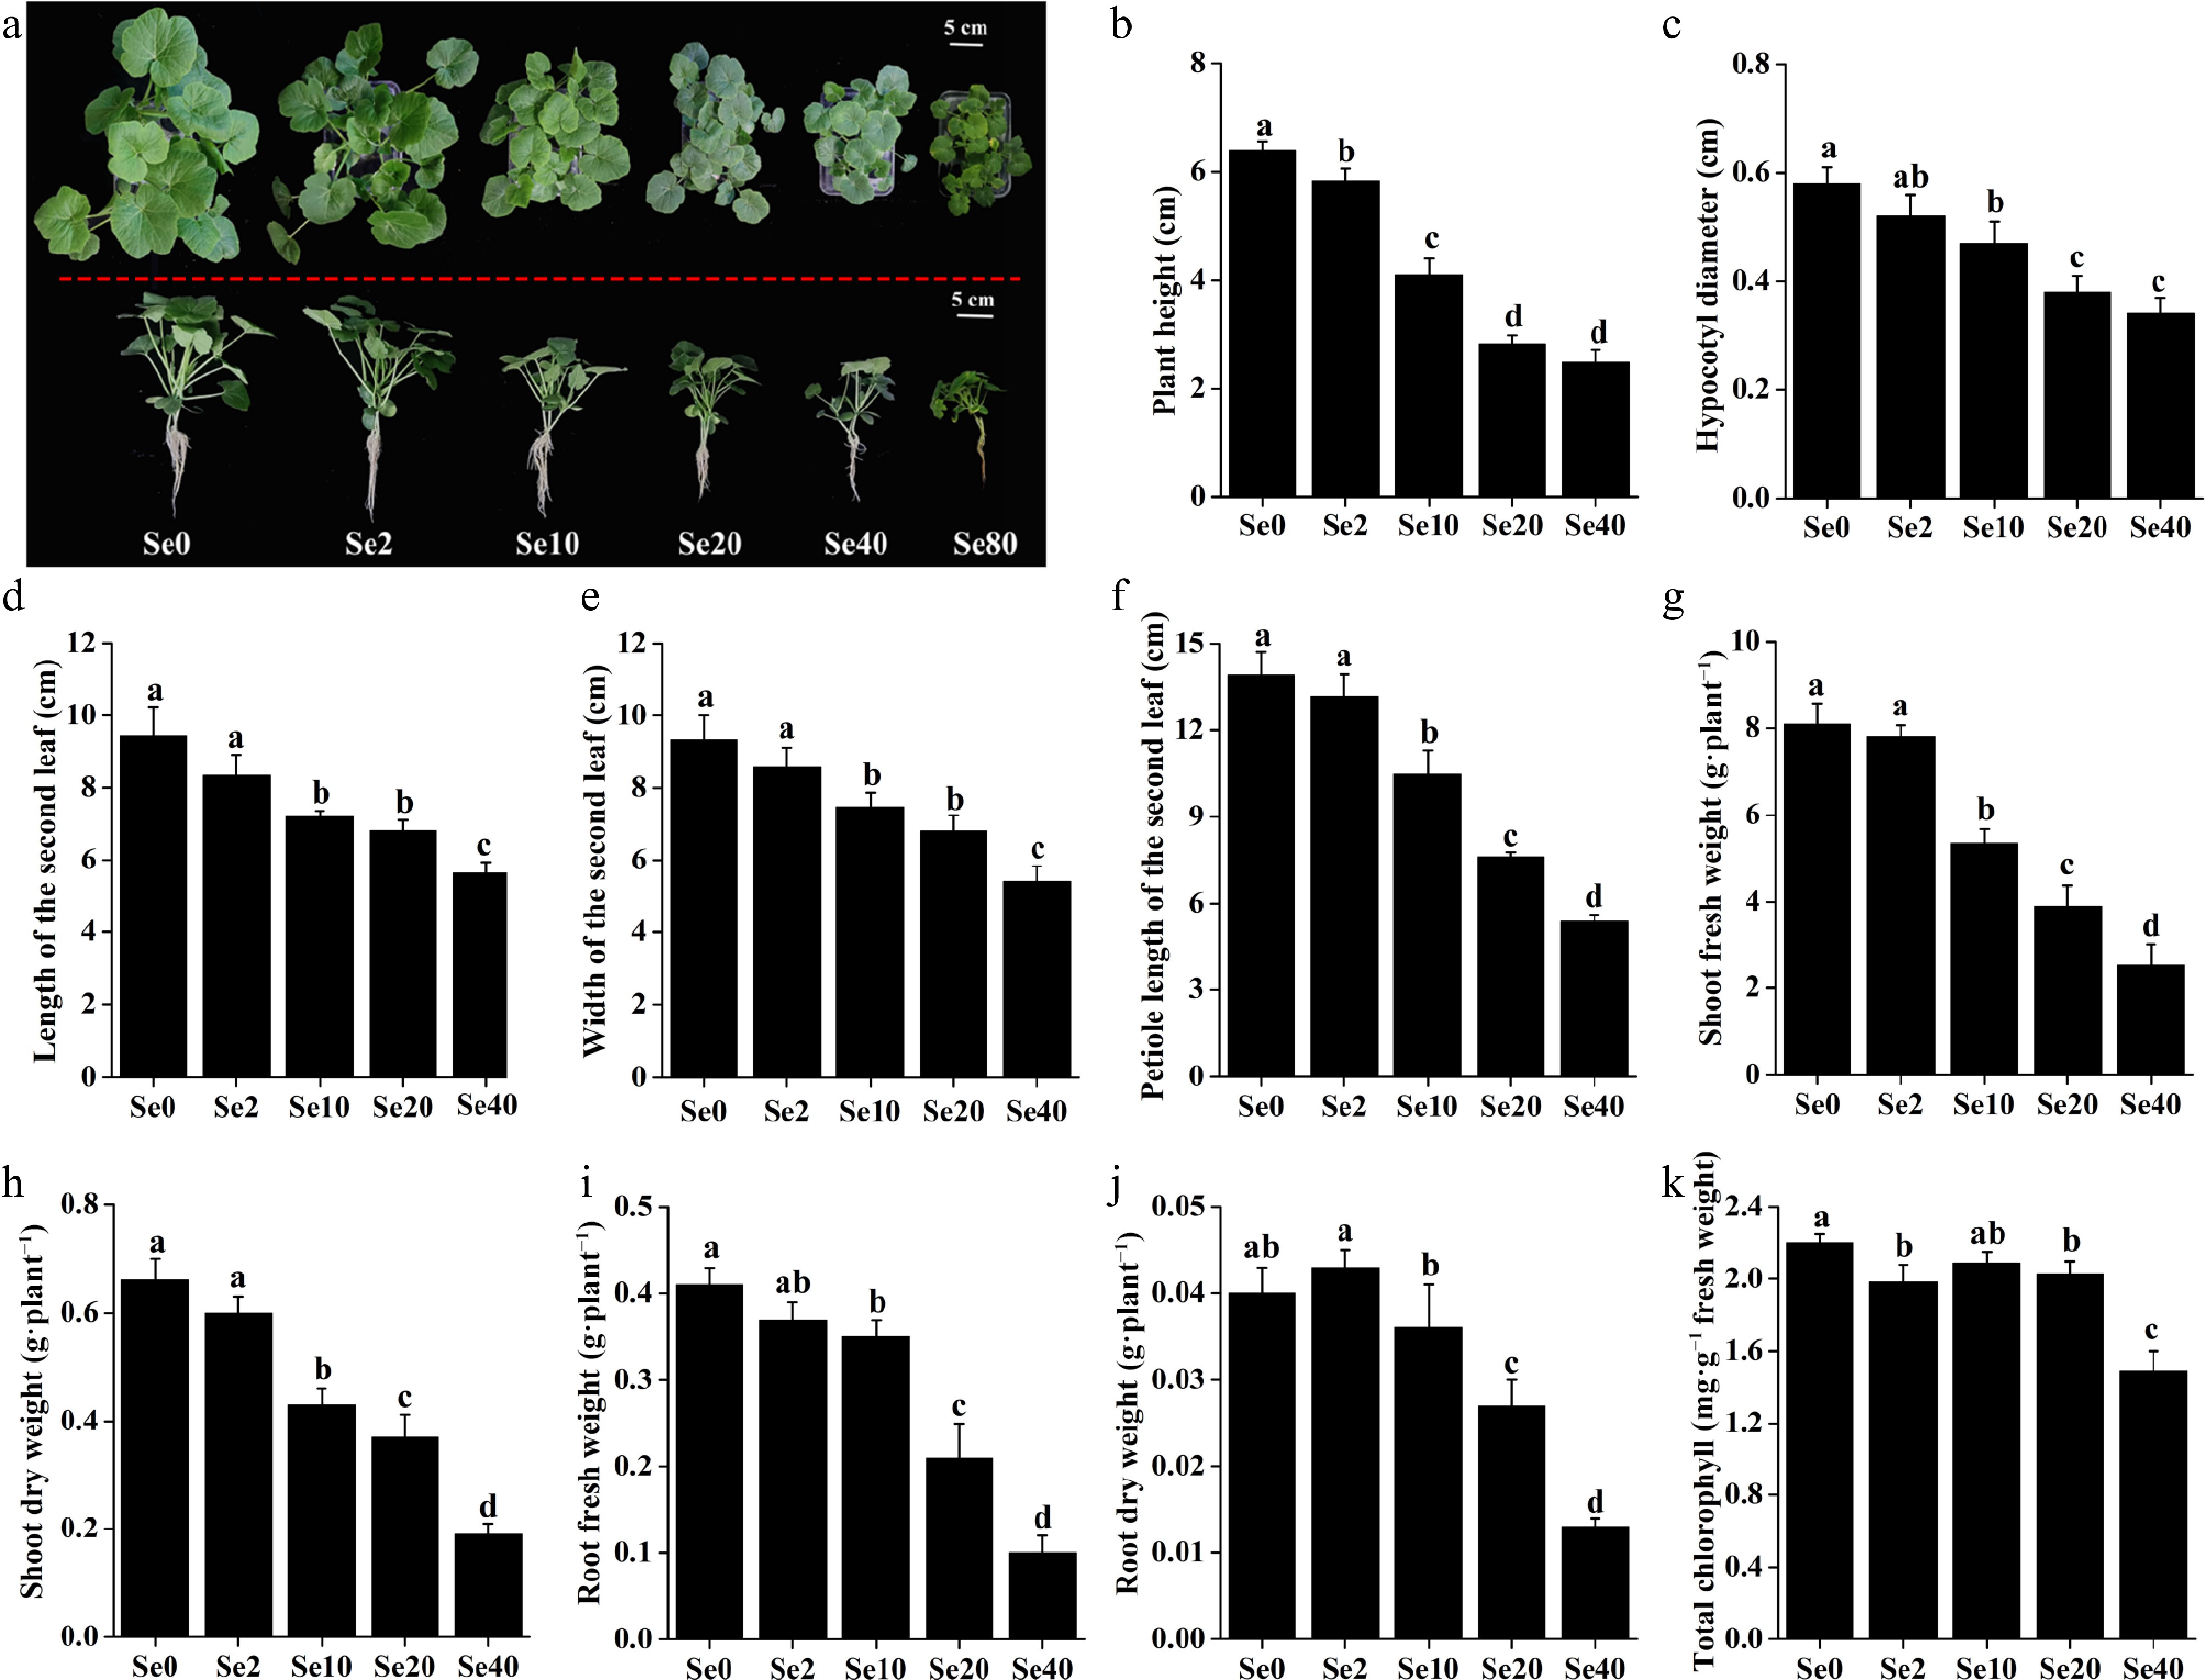
Figure 2.
Effects of different selenite concentrations on the growth of WCO39 seedlings. (a) Phenotypes after 10 d of selenite treatment with different selenite concentrations. The aerial and lateral views of WCO39 seedlings are shown. (b)–(k) Statistical analysis of different growth parameters resulting from different doses of selenite. Different small letters on the bars stand for significant differences at p < 0.05 according to Duncan's multiple scope tests. Se0, Se2, Se10, Se20, Se40, and Se80 represent 0, 2, 10, 20, 40, and 80 μM selenite treatment, respectively.
-
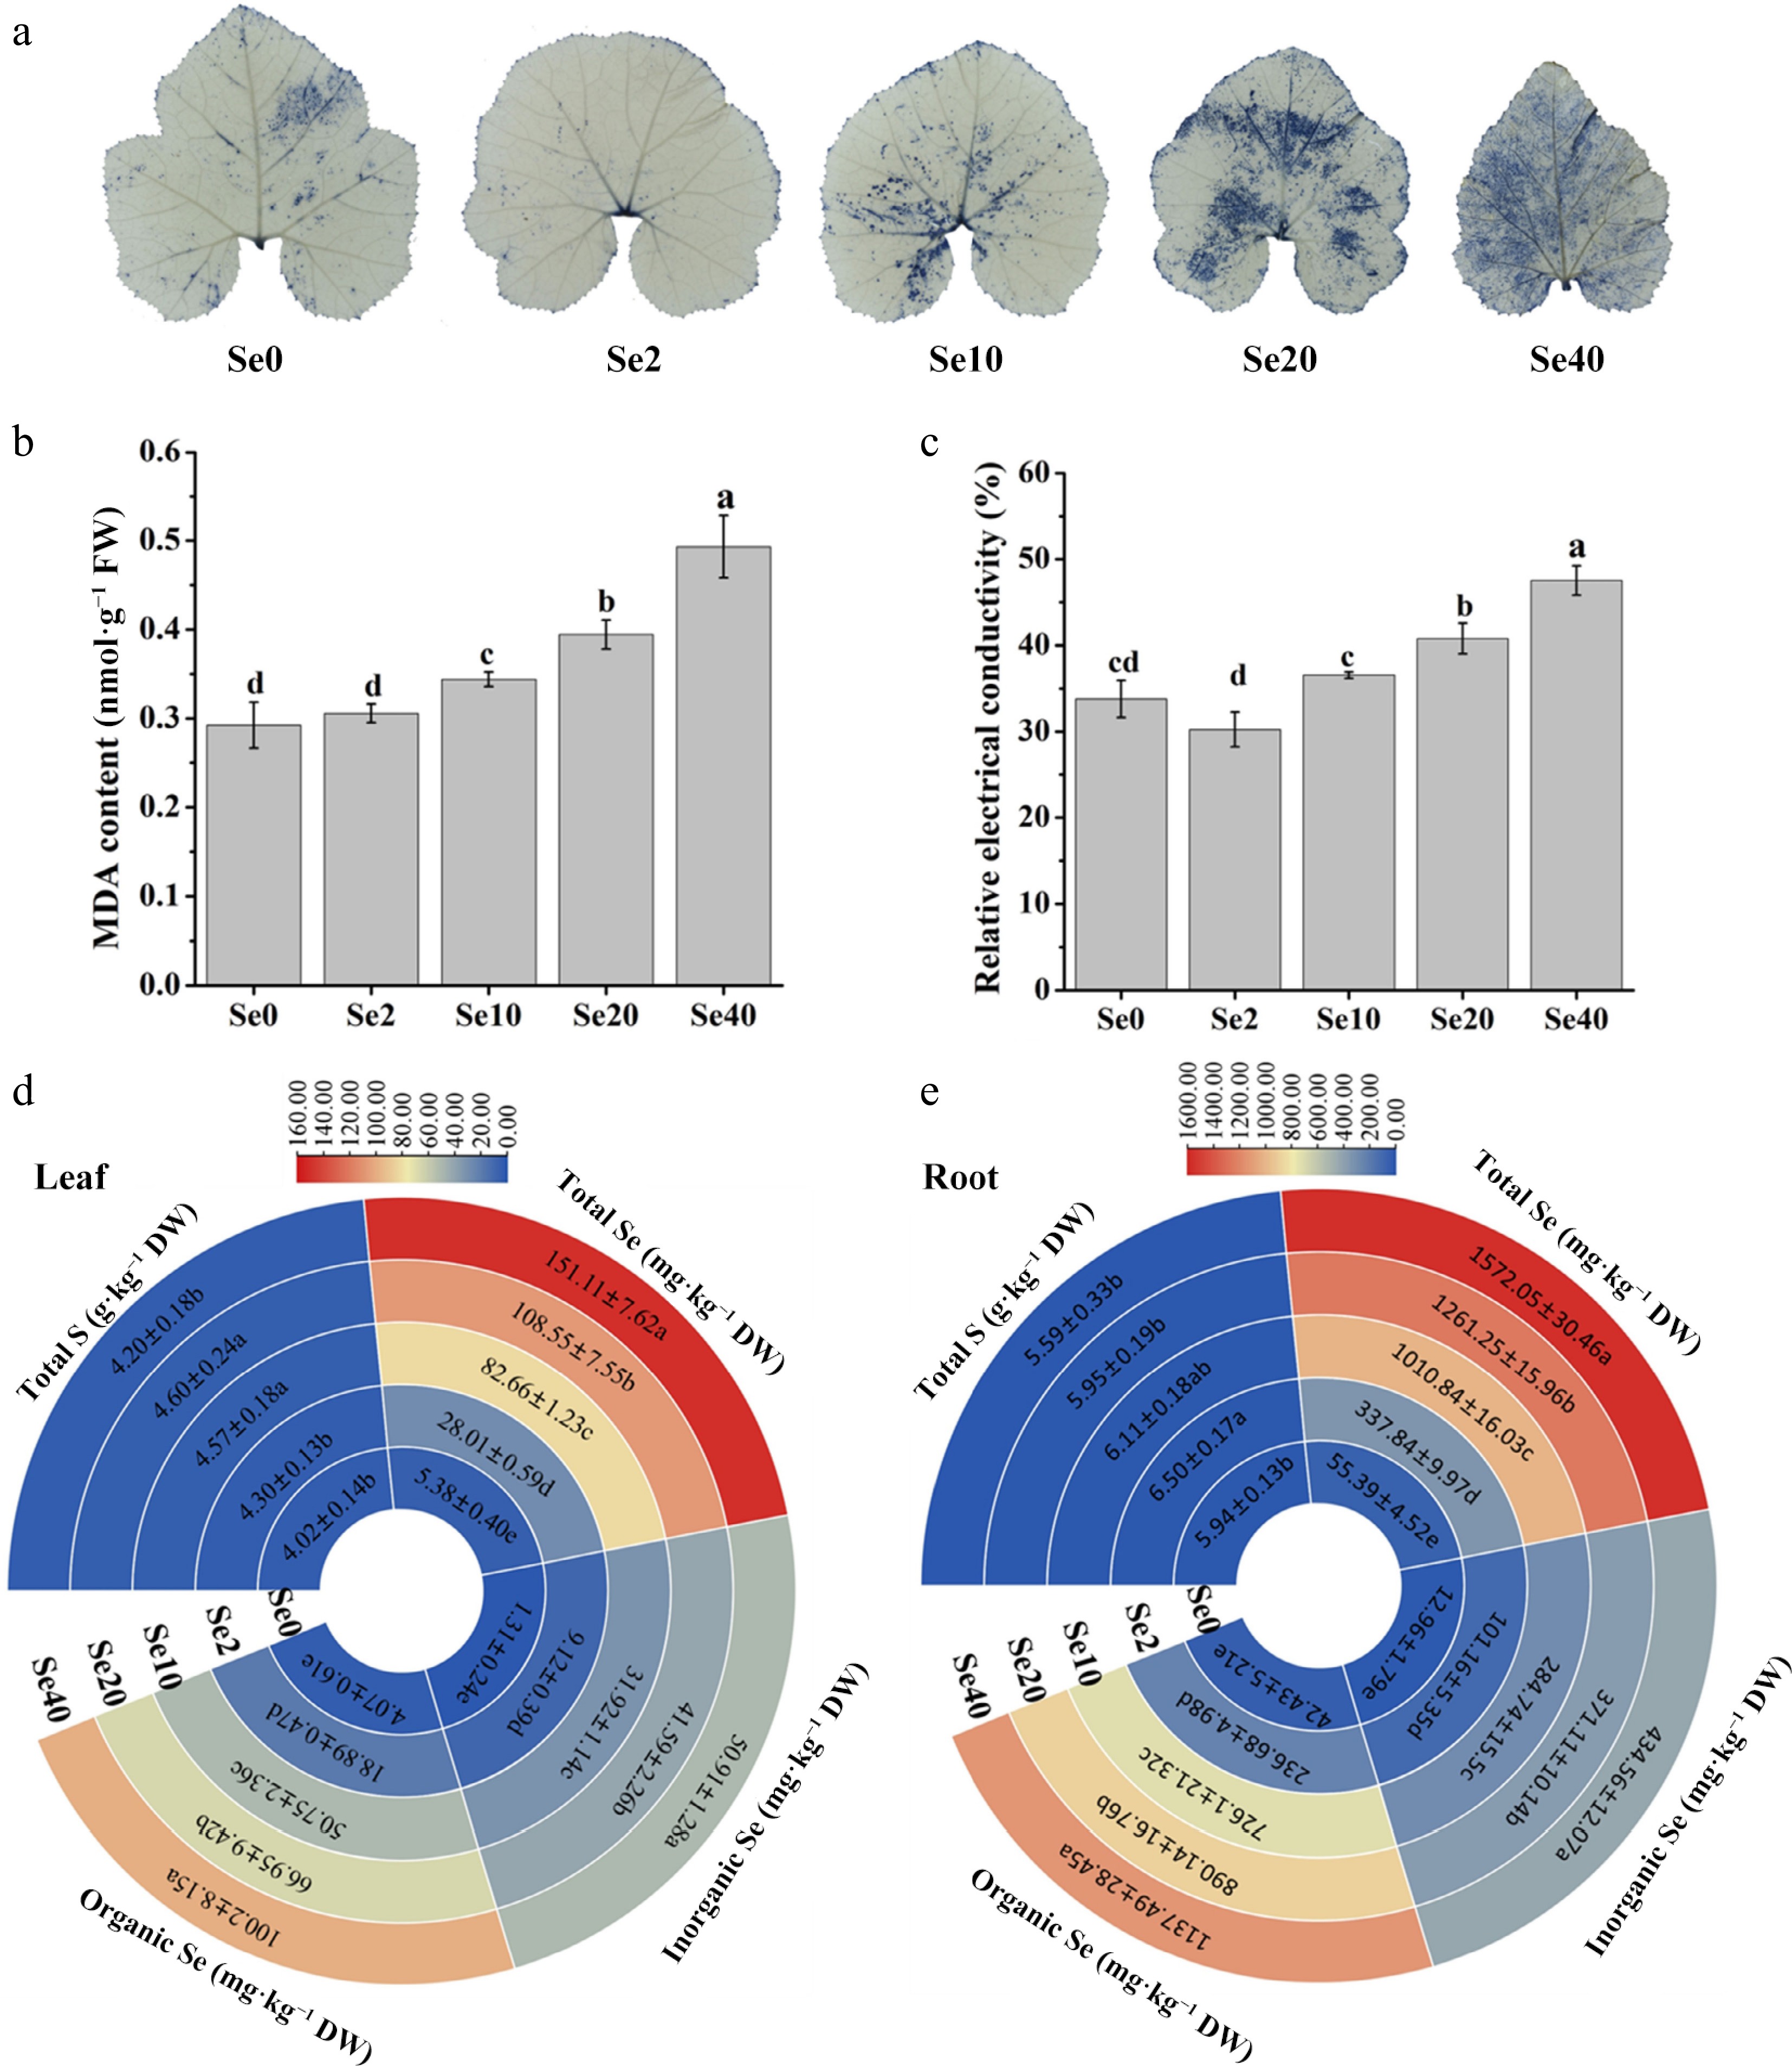
Figure 3.
Influence of selenite on various physiological parameters in WCO39 seedlings. (a) Accumulation of O2·− in leaves visualized by NBT staining. (b) MDA content. (c) Relative electrical conductivity. (d), (e) Heatmaps showing the content of total S, Se, inorganic Se, and organic Se in leaves and roots, respectively. Se0, Se2, Se10, Se20, Se40, and Se80 represent 0, 2, 10, 20, 40, and 80 μM selenite treatment, respectively. The data are shown as mean ± SD (n = 3). Different small letters on the bars and heatmaps stand for significant differences at p < 0.05 according to Duncan's multiple scope tests.
-
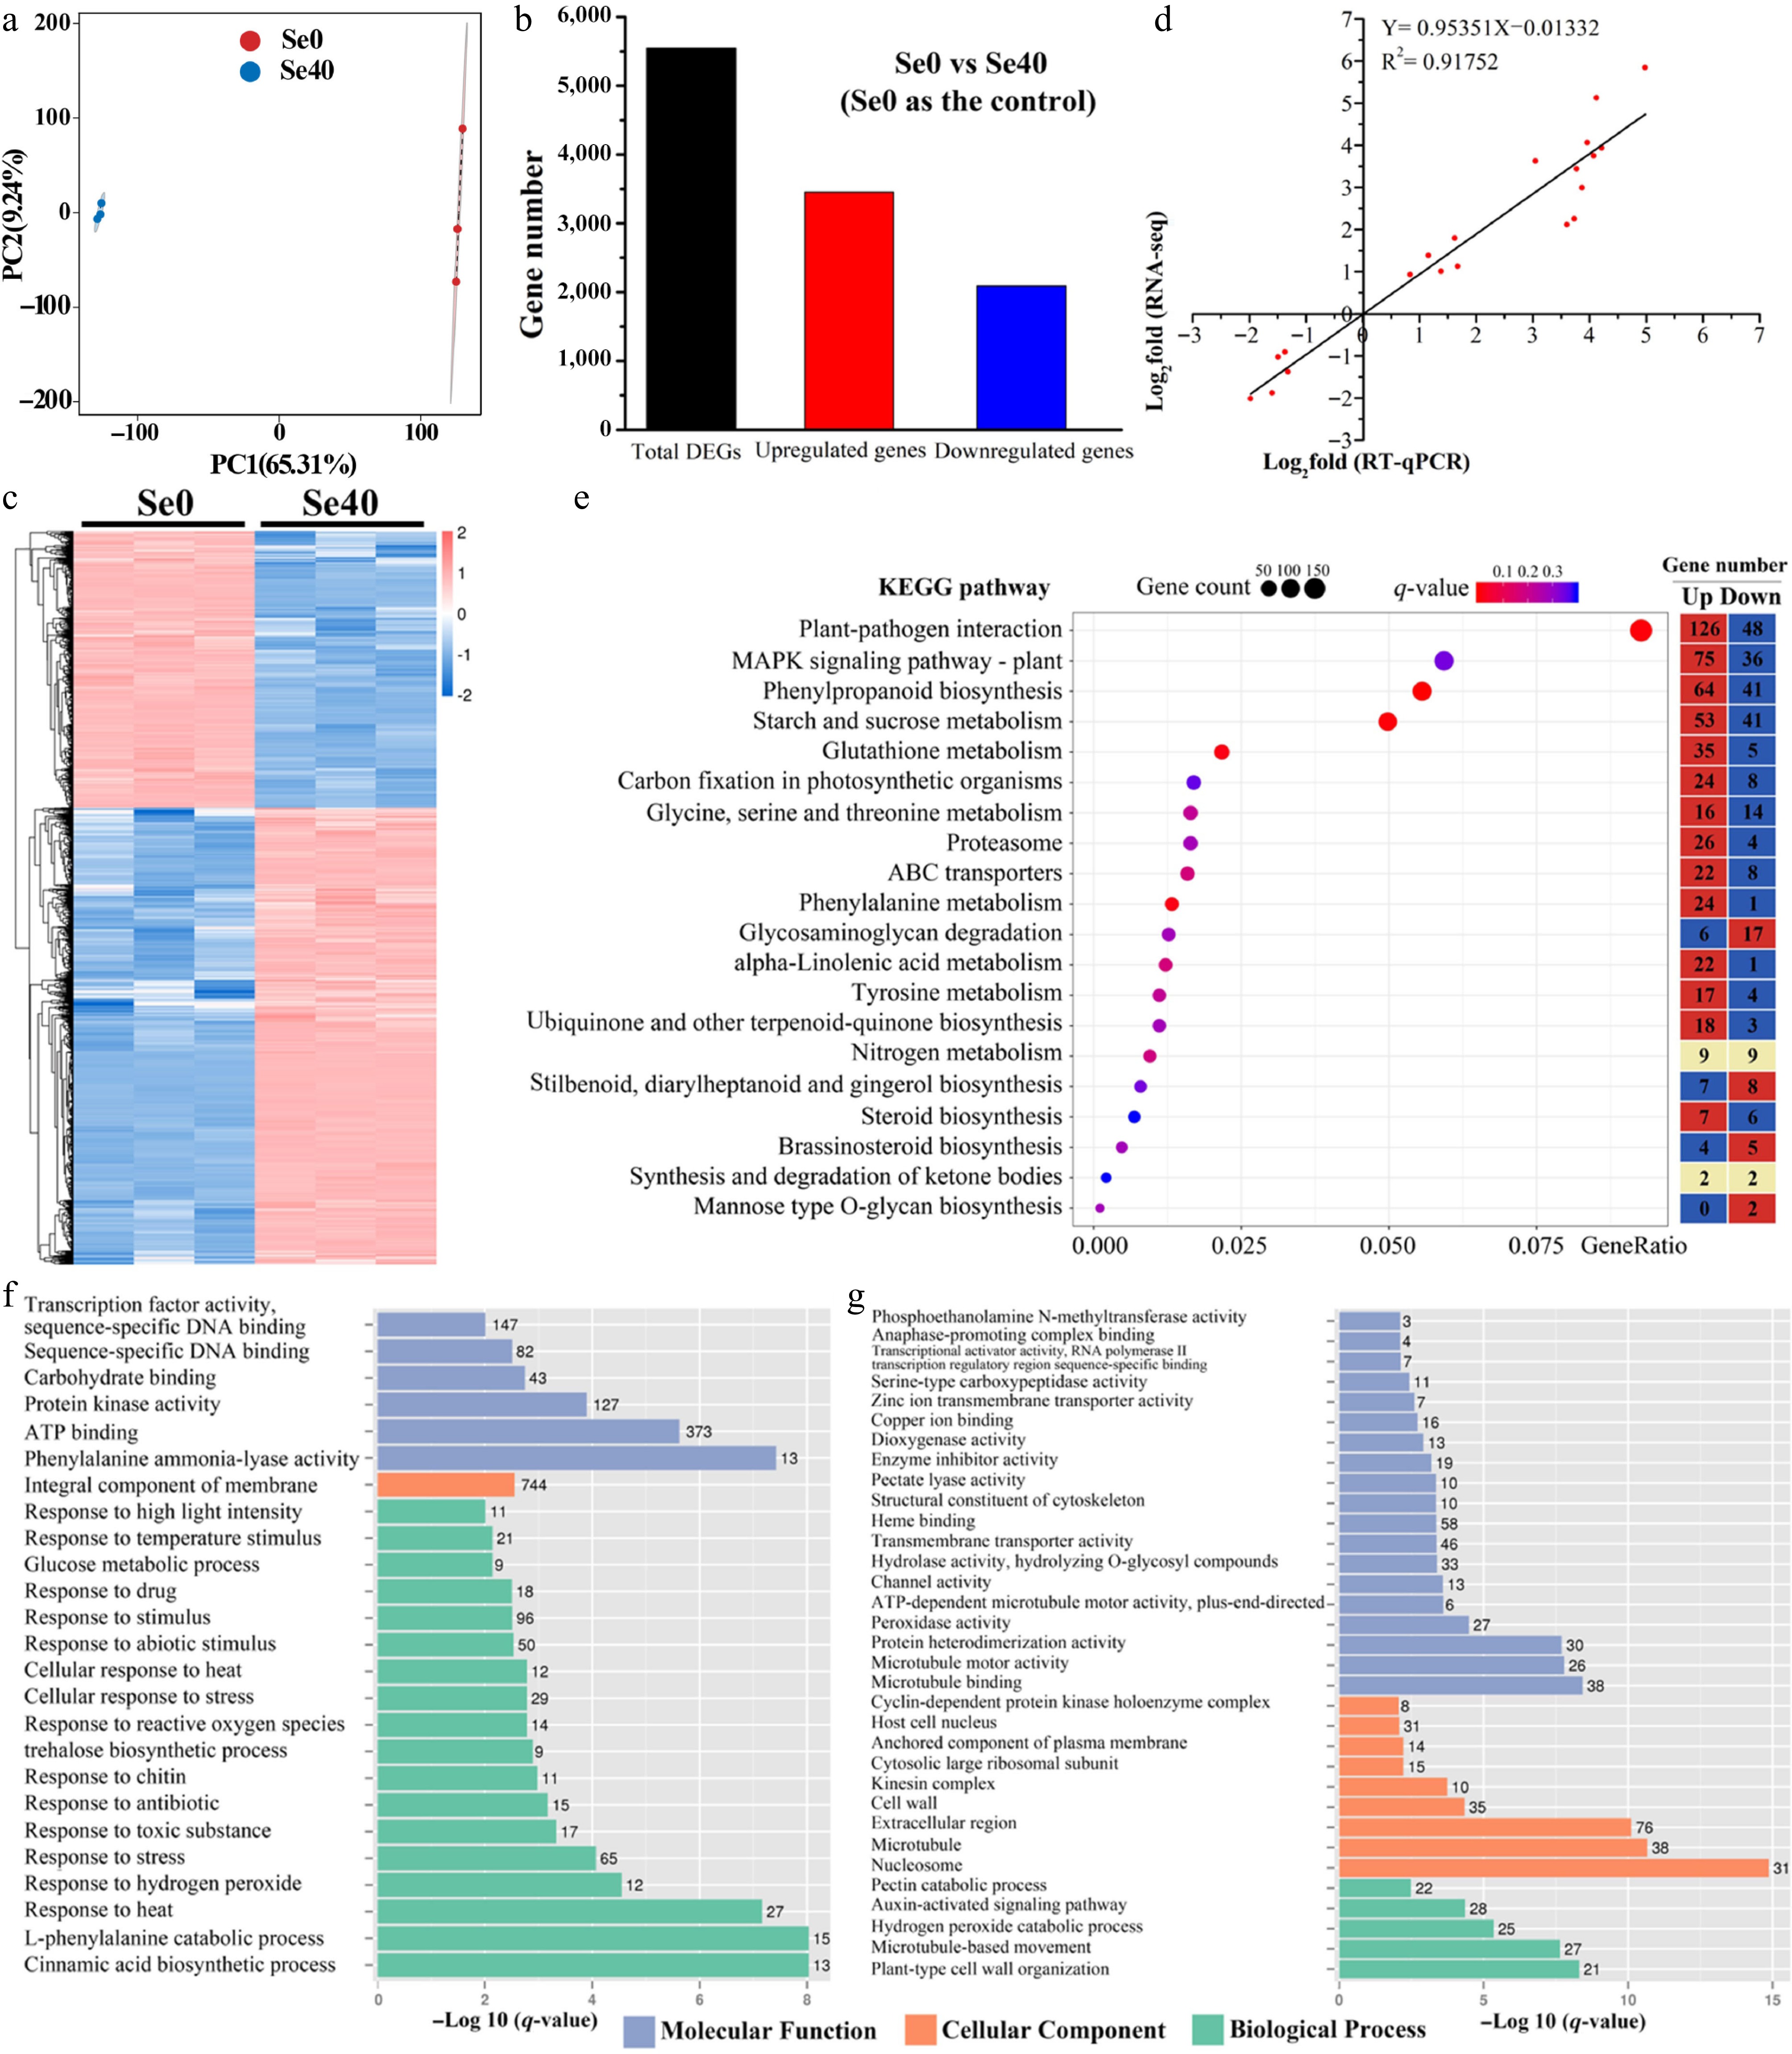
Figure 4.
Analysis of differentially expressed genes (DEGs) identified in Se0 vs Se40 comparison. (a) Principal component analysis (PCA) analysis. (b) Number of DEGs in Se0 vs Se40. (c) Heatmap showing the hierarchical clustering of DEGs. Both the rows and the columns are scaled by normalization. (d) Correlation analysis between the RNA-seq and qRT-PCR results. The abscissa (X-Ais) and ordinate (Y-Ais) quantitatively represent the Log2-transformed fold-change values (Se40/Se0) derived from RNA-seq and qRT-PCR analyses, respectively. (e) KEGG pathway enrichment analysis of DEGs. The topmost enriched 20 KEGG pathways with the lowest q-values are shown. Gene ratio refers to the ratio of the DEGs to the total number of annotated genes in each pathway. The heatmap on the right side shows the number of upregulated and downregulated genes in each KEGG pathway. (f), (g) GO enrichment analysis of the upregulated and downregulated genes, respectively. The topmost enriched GO terms under the three main GO categories are displayed.
-
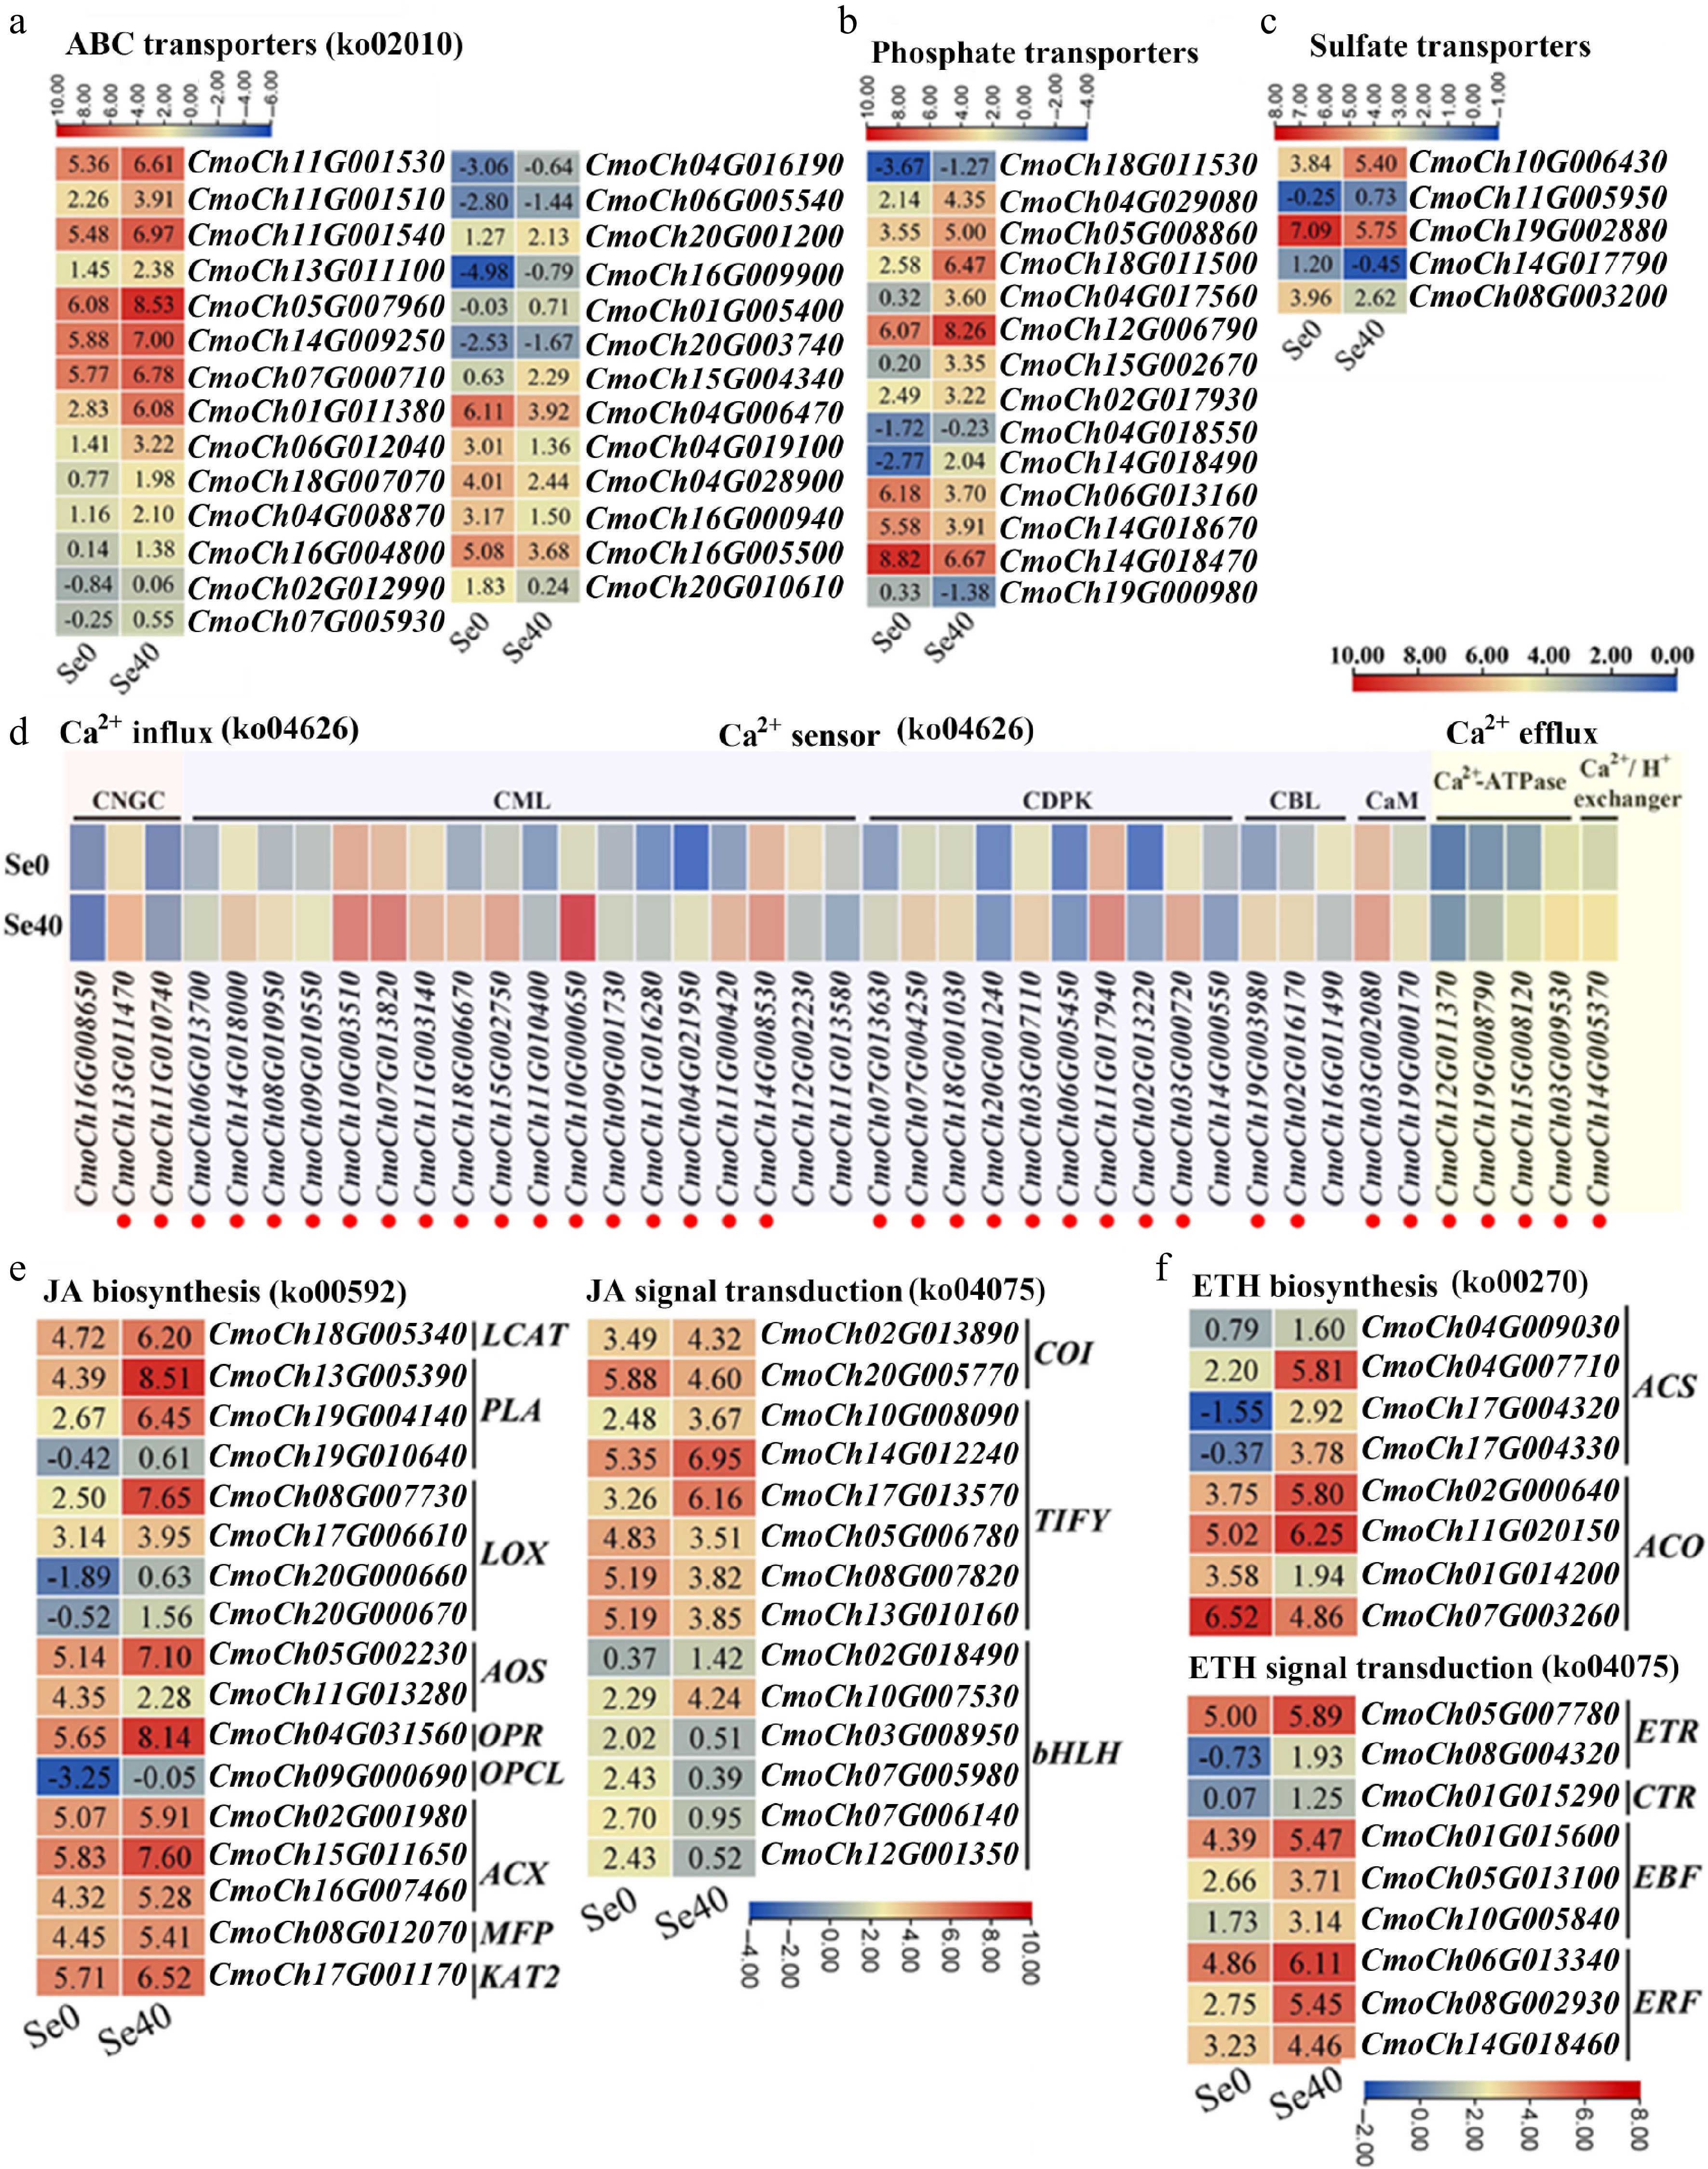
Figure 5.
Heatmaps showing DEGs involved in several important pathways. (a)–(c) ABC transporters, phosphate transporters, and sulfate transporters, respectively. Upregulated genes are marked in red. (d) Ca2+ influx, sensors, and efflux. CNGC: cyclic nucleotide-gated ion channel; CaM, calmodulin; CML: CaM-like protein; CBL: calcineurin B-like protein; CDPK: calcium-dependent protein kinase. (e), (f) DEGs related to the biosynthesis and signal transduction of JA and ETH, respectively. LCAT: lecithin-cholesterol acyltransferase; PLA: phospholipas; LOX: lipoxygenase; AOS: allene oxide synthase; OPR: oxophytodienoate reductase; ACX: acyl-coenzyme A oxidase; MFP: multifunctional protein; OPCL: 4-coumarate—CoA ligase; KAT: ketoacyl-CoA thiolase; COI: coronatine-insensitive protein; bHLH: basic helix-loop-helix protein; ACS: 1-aminocyclopropane-1-carboxylate synthase; ACO: 1-aminocyclopropane-1-carboxylate oxidase; ETR: ethylene receptor; CTR: constitutive triple response protein; EBF: EIN3-binding F-box protein; ERF: ethylene-responsive transcription factor. Some pathways have been listed with their corresponding KEGG pathway ID numbers behind them. The Log2 (FPKM) for each gene in different samples is shown in the appropriate grid.
-
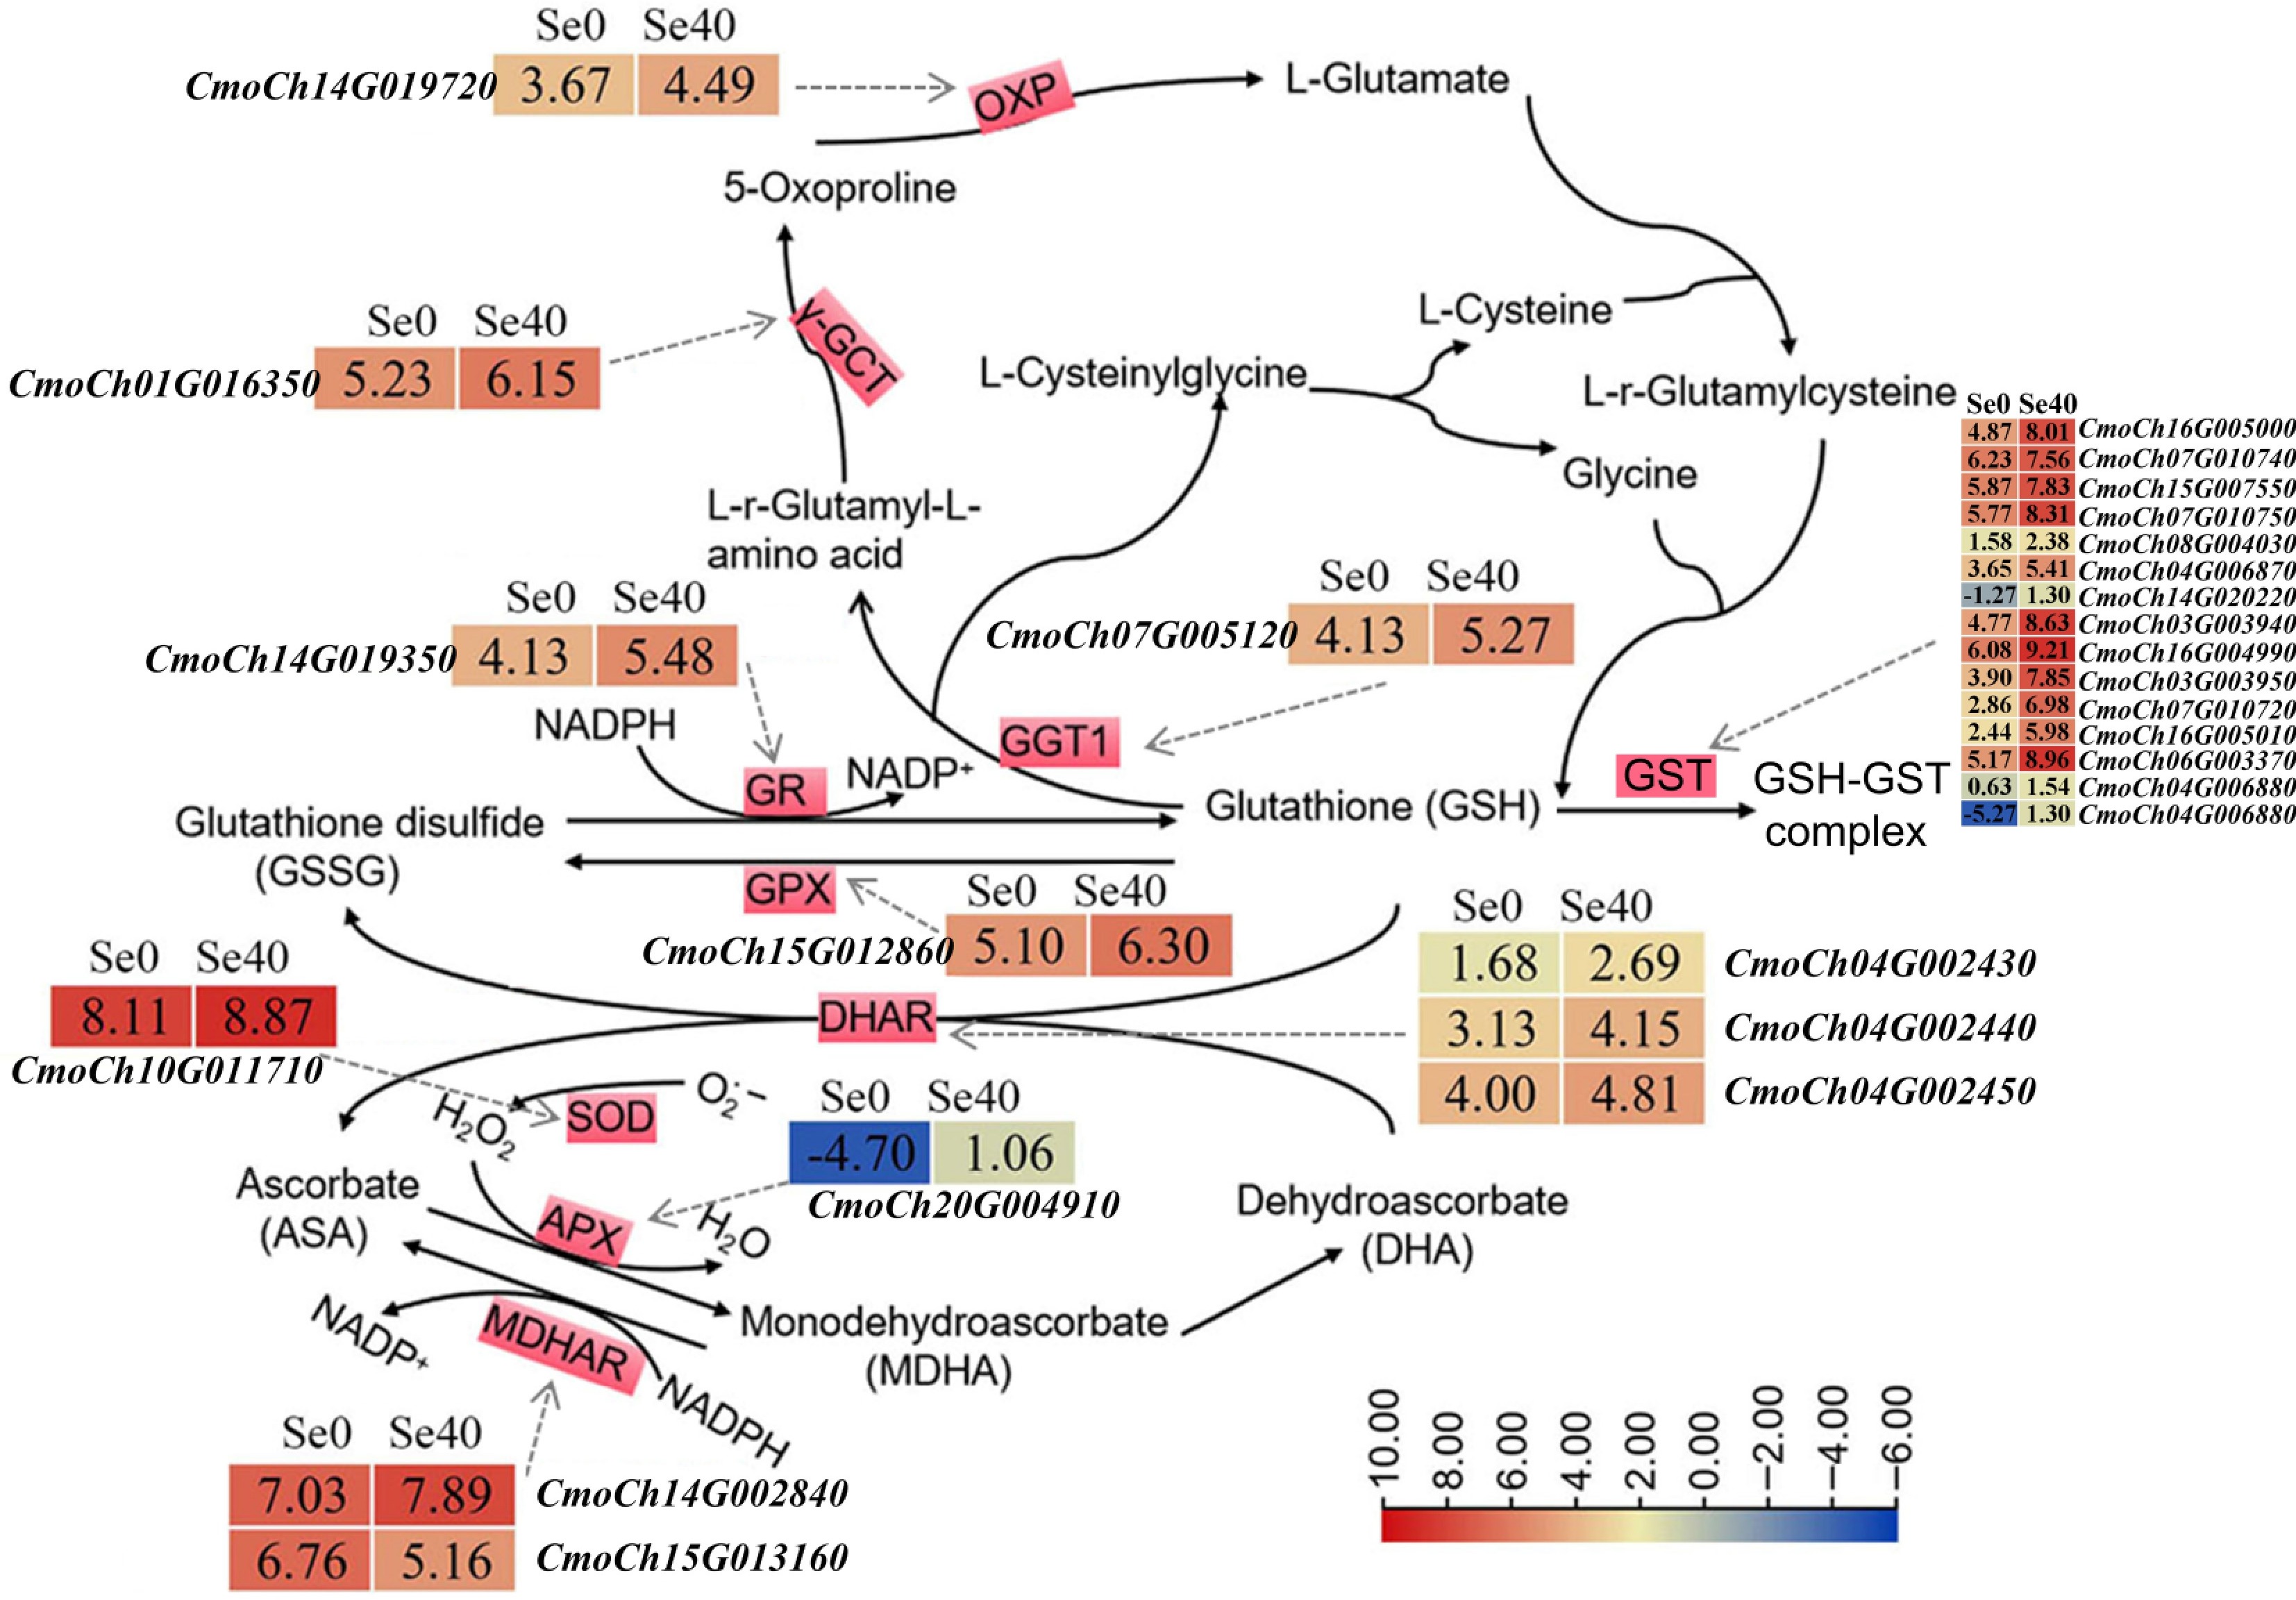
Figure 6.
DEGs related to GSH and ASA-GSH cycles. The solid arrows indicate the substrates and products of the metabolic reaction. The dotted arrows represent the enzymes encoded by the corresponding DEGs identified in Se0 vs Se40 (Se0 as the control). The heatmaps represent the corresponding expression levels of DEGs, and the Log2 (FPKM) for each gene is shown in the appropriate grid.
-
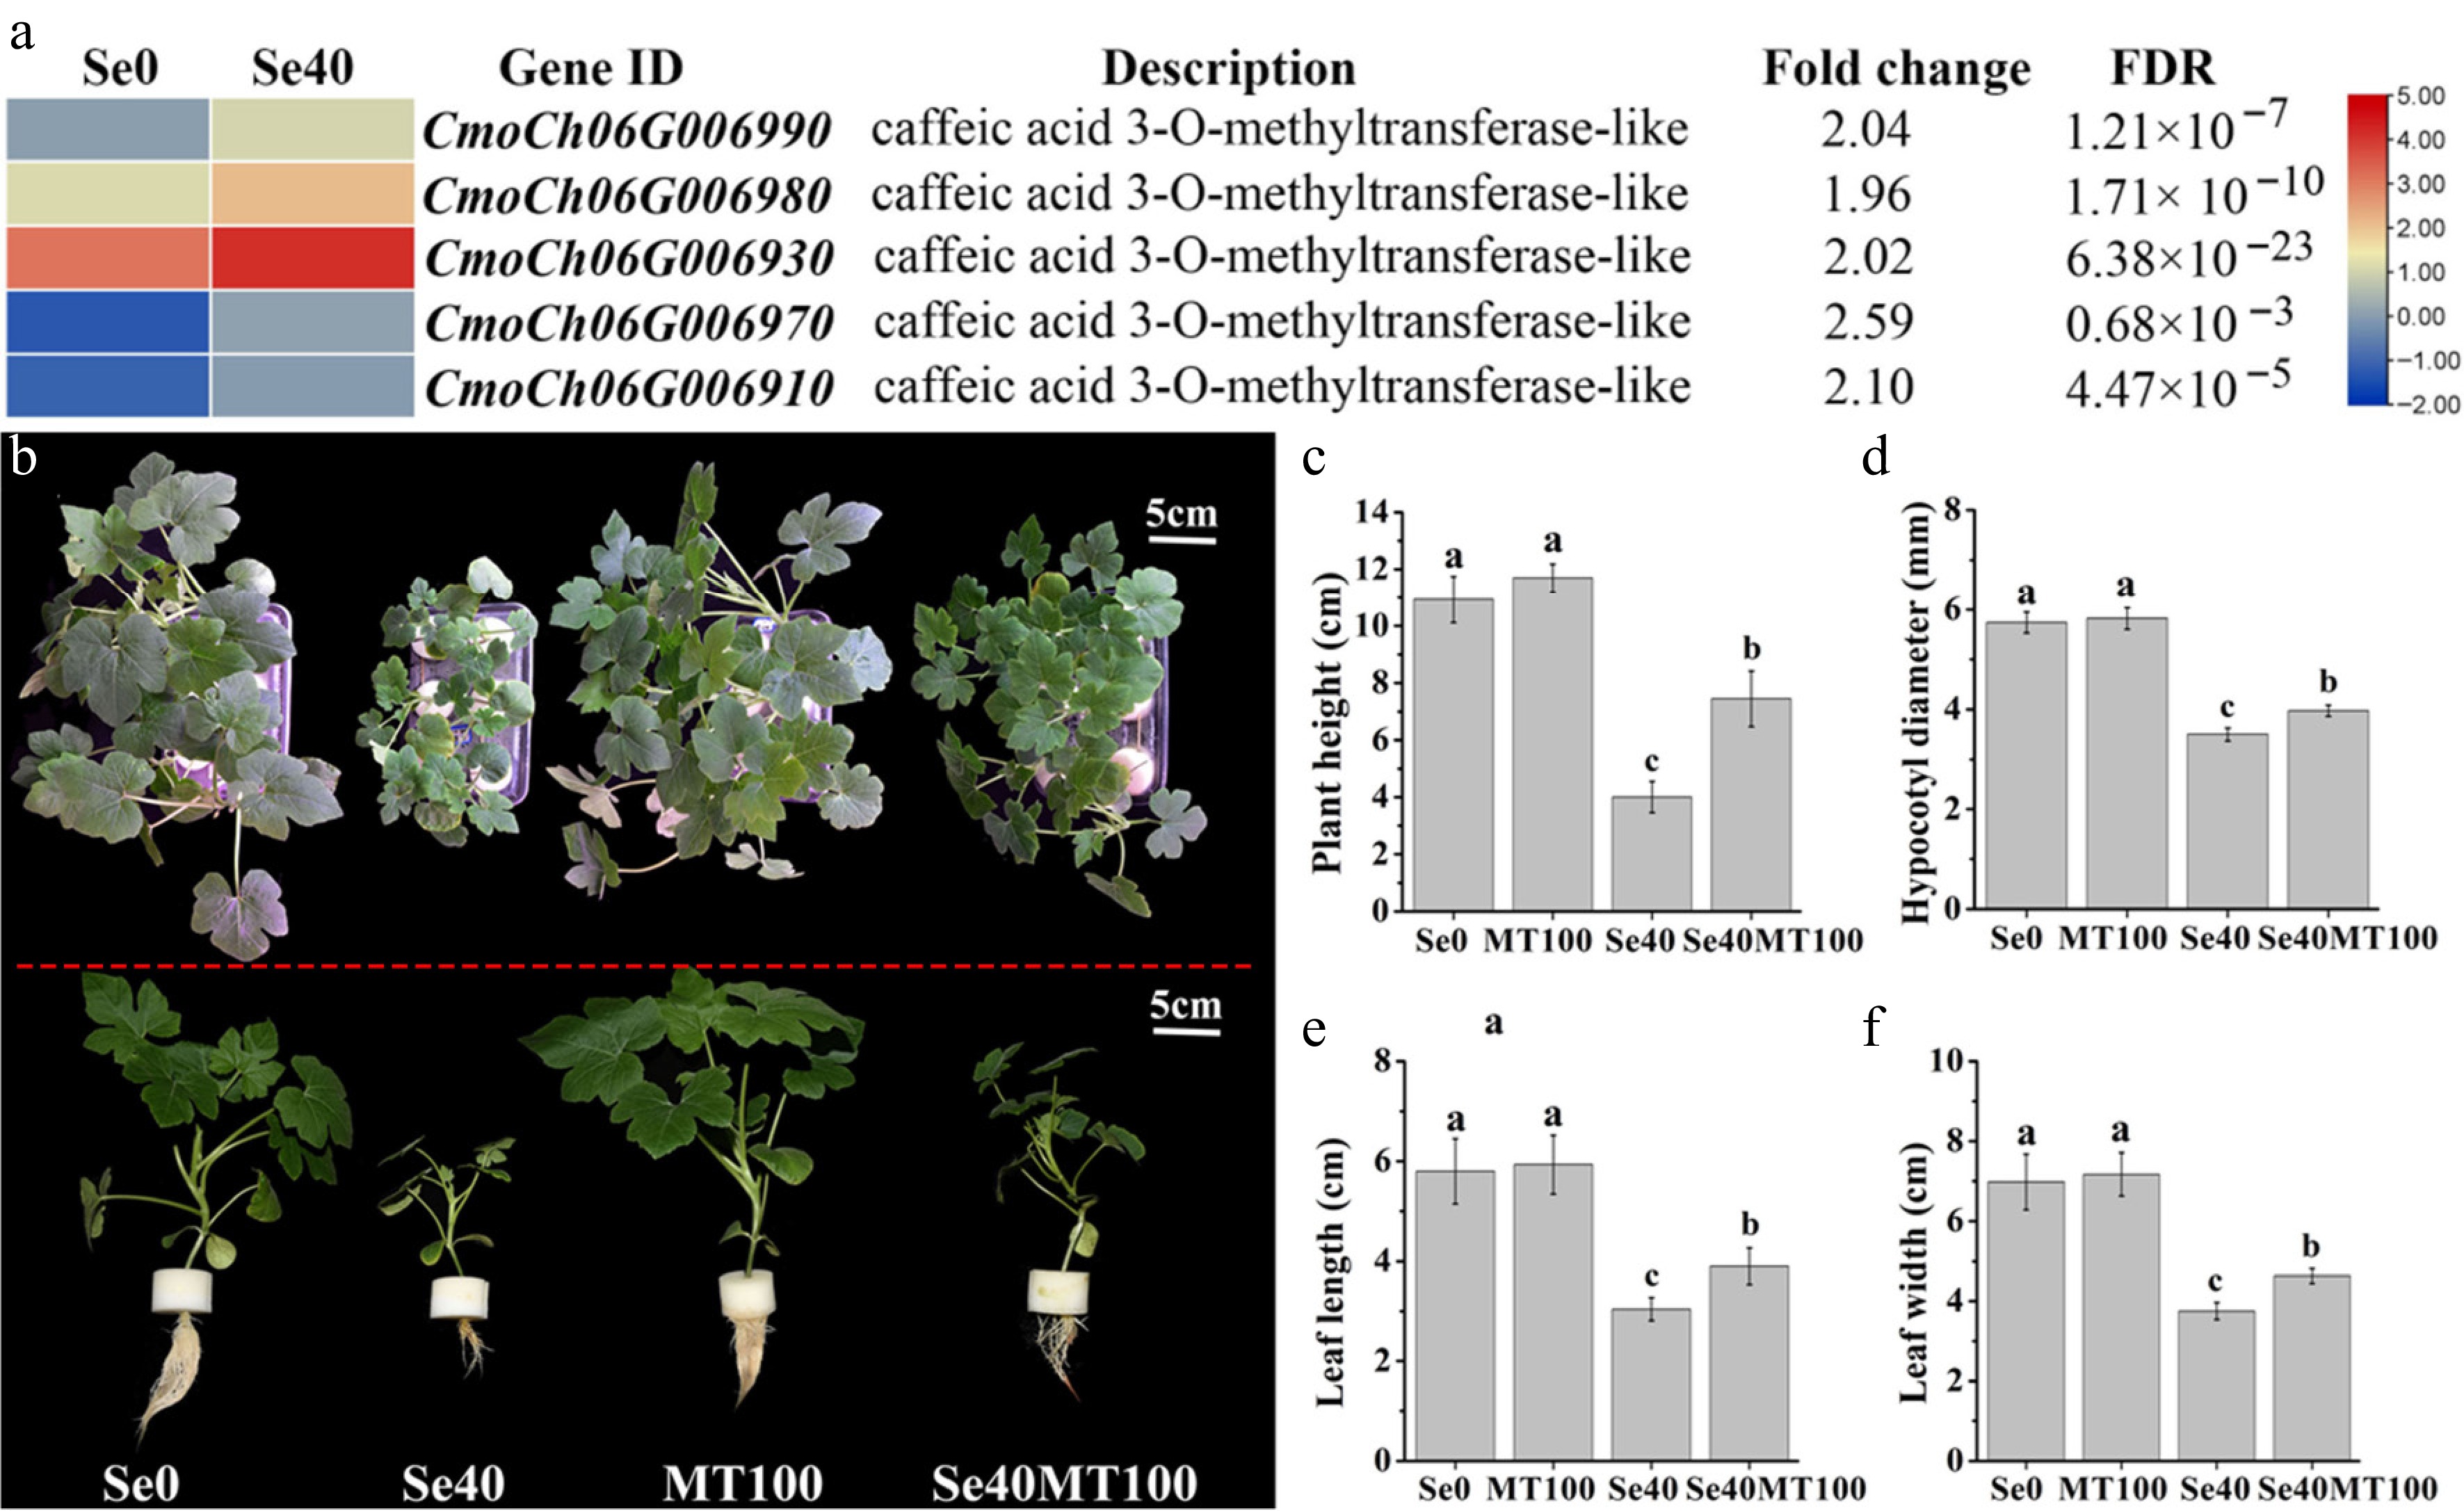
Figure 7.
Analysis of DEGs involved in melatonin biosynthesis and the influence of exogenous melatonin treatment on selenite stress. (a) Heatmap showing DEGs annotated to encoding caffeic acid 3-O-methyltransferase. The Log2 (FPKM) for each gene is used to generate this heatmap. (b) Phenotypes of WCO39 seedlings under different treatments. (c)–(f) Statistical analysis of different growth indicators. Se0 represents normal seedlings; Se40 represents seedlings irrigated with 40 µM selenite; MT100 represents seedlings grown in normal culture with foliar application of 100 µM melatonin; Se40MT100 represents seedlings treated with 40 µM selenite and also sprayed with 100 µM melatonin. The data are shown as mean ± SD (n = 3). Different small letters on the bars stand for significant differences at p < 0.05 according to Duncan's multiple scope tests.
-
Gene ID Gene description Gene synonym Se0_FPKM Se40_FPKM log2 (fold change) CmoCh01G020230 ATP sulfurylase 2 CmoAPS 2.86 0.85 −1.47 CmoCh14G017980 ATP sulfurylase 1 2.80 4.96 1.09 CmoCh16G003340 Adenylyl-sulfate kinase 3 CmoAPK 2.13 5.31 1.58 CmoCh06G017430 5'-adenylylsulfate reductase 5 CmoAPR 22.22 40.04 1.12 CmoCh15G000800 Sulfite oxidase CmoSO 10.46 25.85 1.58 CmoCh11G008630 Sulfite reductase CmoSiR 38.88 14.97 –1.10 CmoCh10G011250 Cysteine synthase CmoCS 37.43 115.32 1.90 CmoCh10G011260 Cysteine synthase 1.69 3.08 1.14 CmoCh14G019350 Glutathione reductase CmoGR 17.50 44.68 1.63 CmoCh01G005840 Mitogen-activated protein kinase 3 CmoMAPK 92.46 207.21 1.44 CmoCh04G000390 Mitogen-activated protein kinase 9 21.45 38.13 1.10 CmoCh18G000490 Mitogen-activated protein kinase 9 3.04 6.83 1.44 CmoCh13G010340 Mitogen-activated protein kinase 9 0.38 1.98 2.67 CmoCh12G013530 Mitogen-activated protein kinase kinase 1 CmoMAPKK 13.07 25.41 1.23 CmoCh07G007160 Mitogen-activated protein kinase kinase kinase 17 CmoMAPKKK 4.45 12.19 1.73 CmoCh19G009390 Mitogen-activated protein kinase kinase kinase 17 0.51 1.21 1.51 CmoCh01G011670 Mitogen-activated protein kinase kinase kinase 18 19.82 4.70 –1.80 CmoCh02G001800 Mitogen-activated protein kinase kinase kinase 18 0.20 1.29 2.87 CmoCh15G007330 Mitogen-activated protein kinase kinase kinase 1 8.21 19.54 1.52 CmoCh17G002450 Mitogen-activated protein kinase kinase kinase 7.65 1.68 –1.91 The false discovery rate (FDR) values for all genes are less than 0.001. Table 1.
List of genes related to selenium assimilation and MAPK cascade.
Figures
(7)
Tables
(1)