-
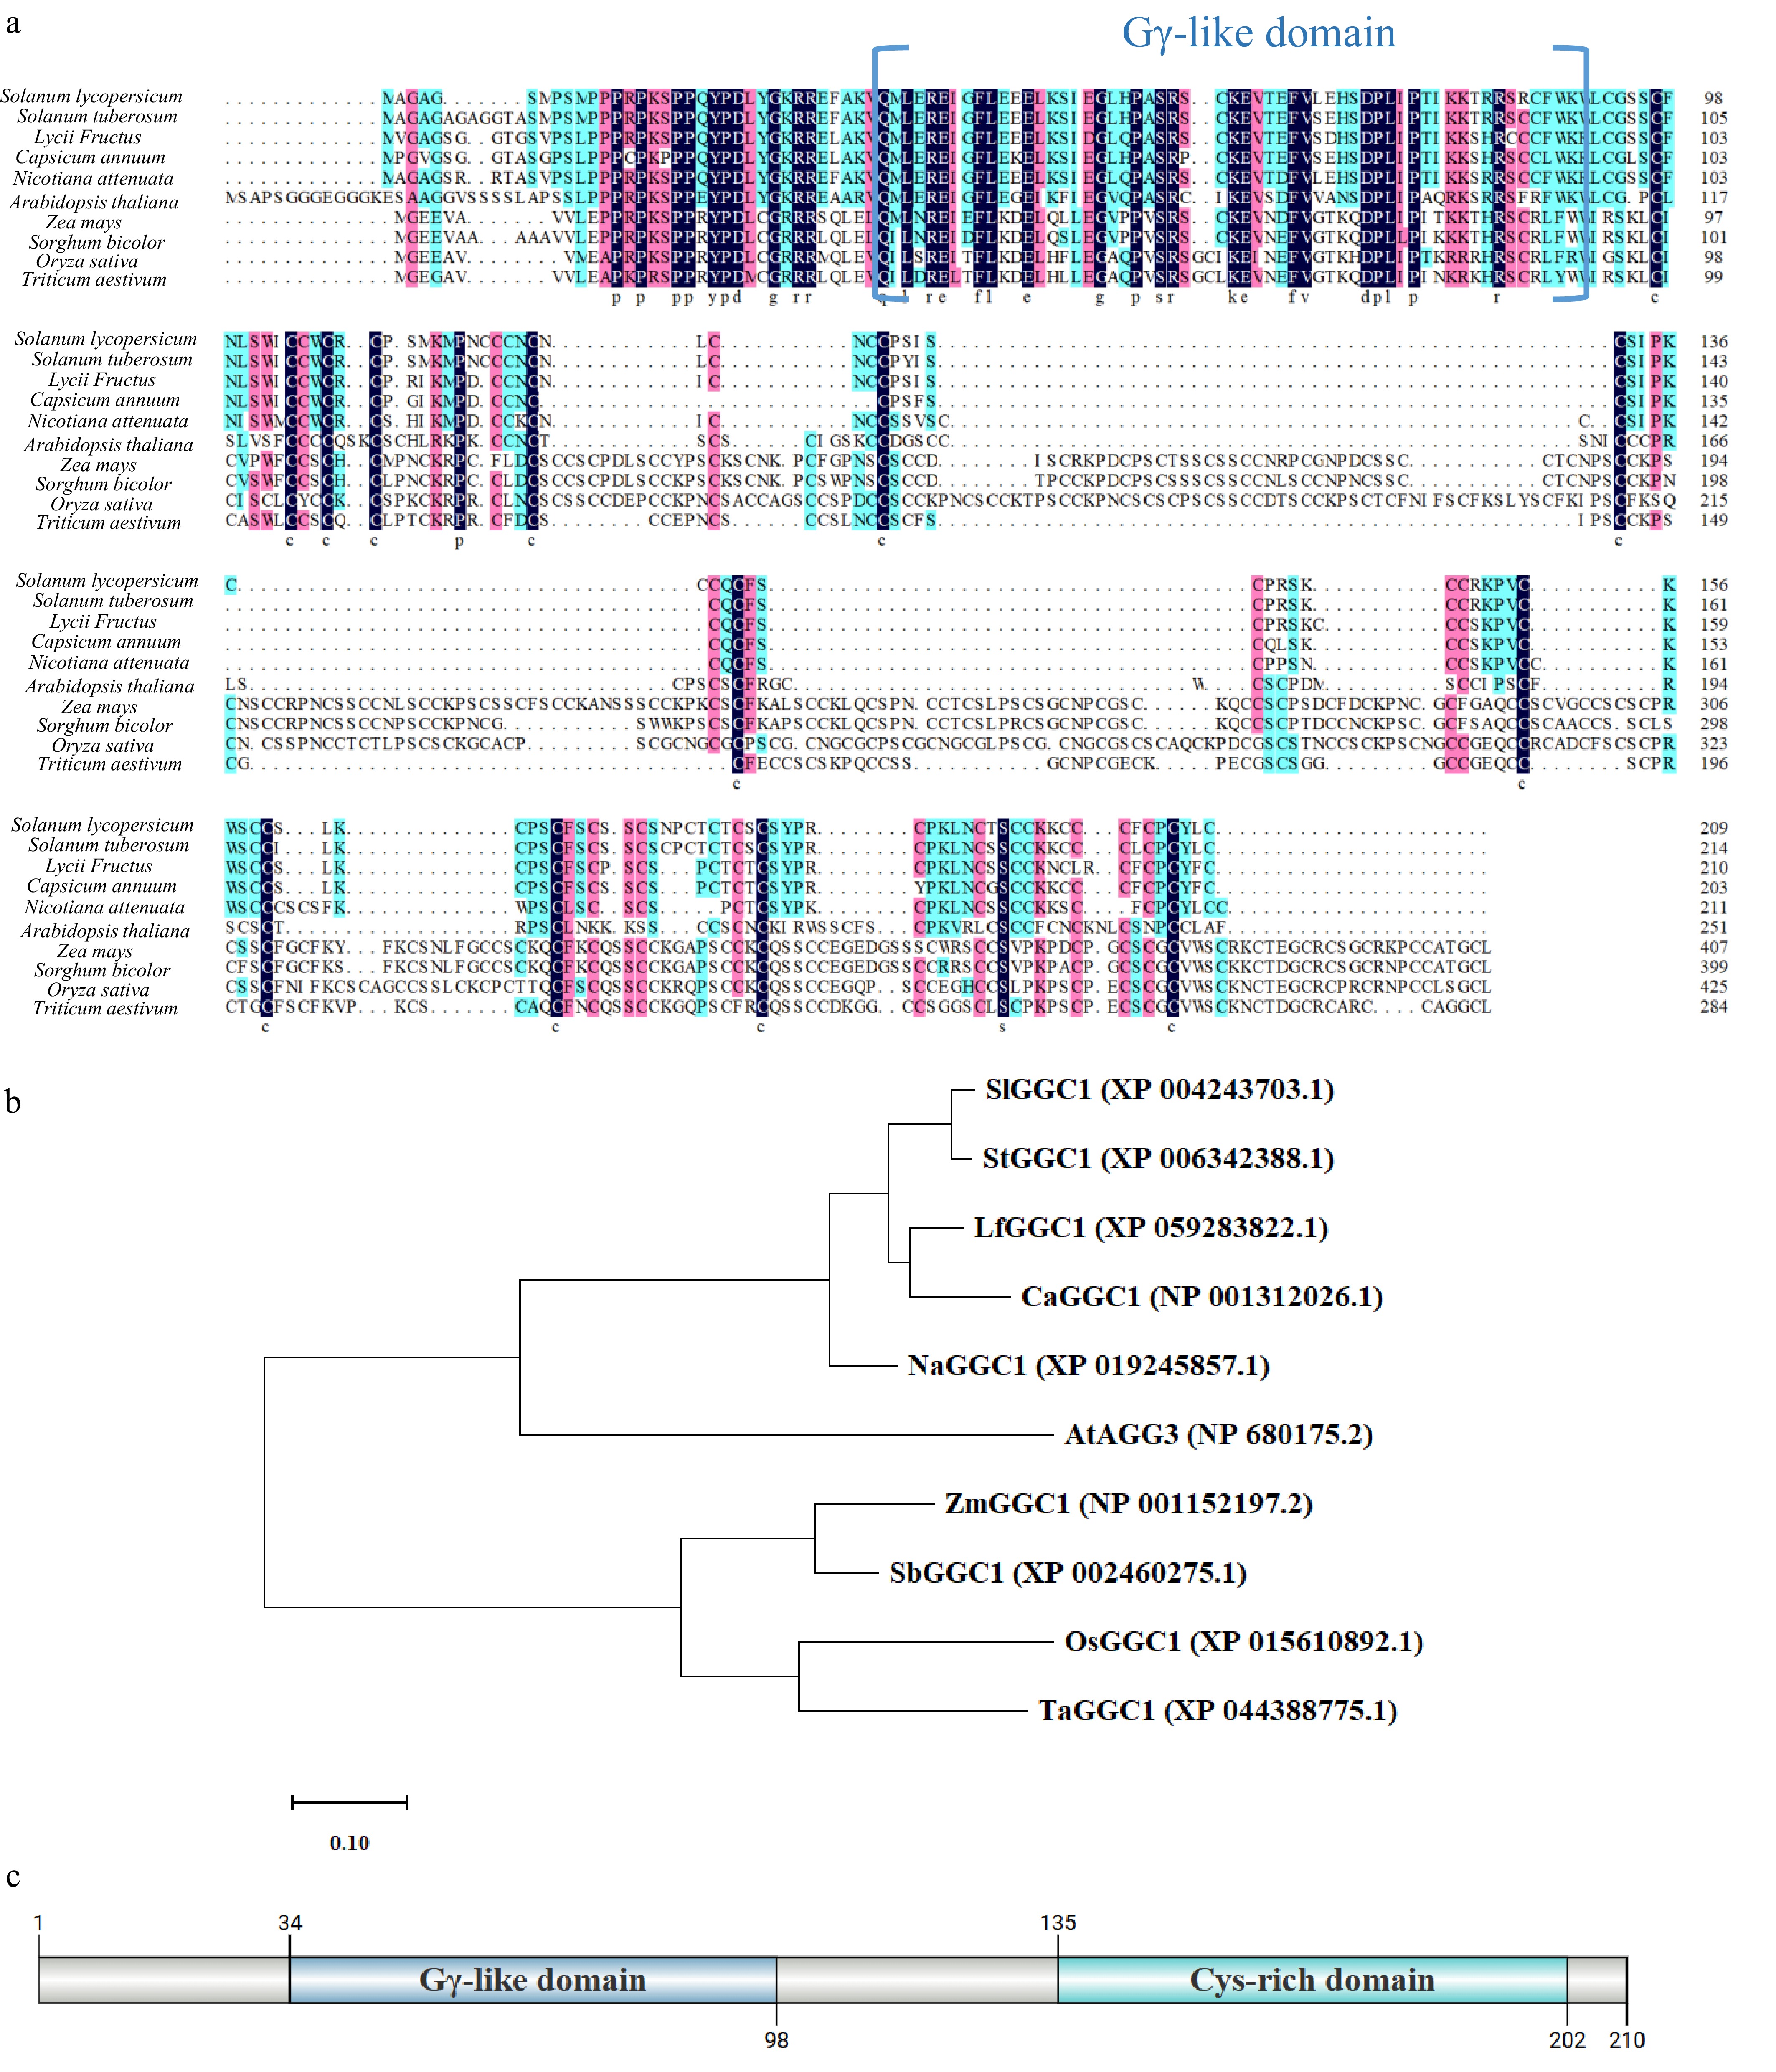
Figure 1.
SlGGC1 is highly conserved in Solanaceae. (a) Amino acid sequence alignment of GGC1 in Solanum lycopersicum, Solanum tuberosum, Lycii Fructus, Capsicum annuum, Nicotiana attenuata, Arabidopsis thaliana, Zea mays, Sorghum bicolor, Oryza sativa, and Triticum aestivum. (b) Phylogenetic relationship between tomato SlGGC1 and GGC1 of other plant species. The phylogenetic tree of multi-species GGC1 proteins was constructed using MEGA11, with an evolutionary distance scale set to 0.1. The protein sequences used for the construction, including AtAGG3 (NP_680175.2), SlGGC1 (XP_004243703.1), OsGGC1 (XP_015610892.1), ZmGGC1 (NP_001152197.2), SbGGC1 (XP_002460275.1), TaGGC1 (XP_044388775.1), StGGC1 (XP_006342388.1), LfGGC1 (XP_059283822.1), CaGGC1 (NP_001312026.1), and NaGGC1 (XP_019245857.1), were obtained from GenBank. (c) Structure of SlGGC1 protein. The SlGGC1 protein represents an atypical class of Gy proteins, characterized by a C-terminal G protein gamma subunit-like domain (GGL) and an N-terminal cysteine-rich domain.
-
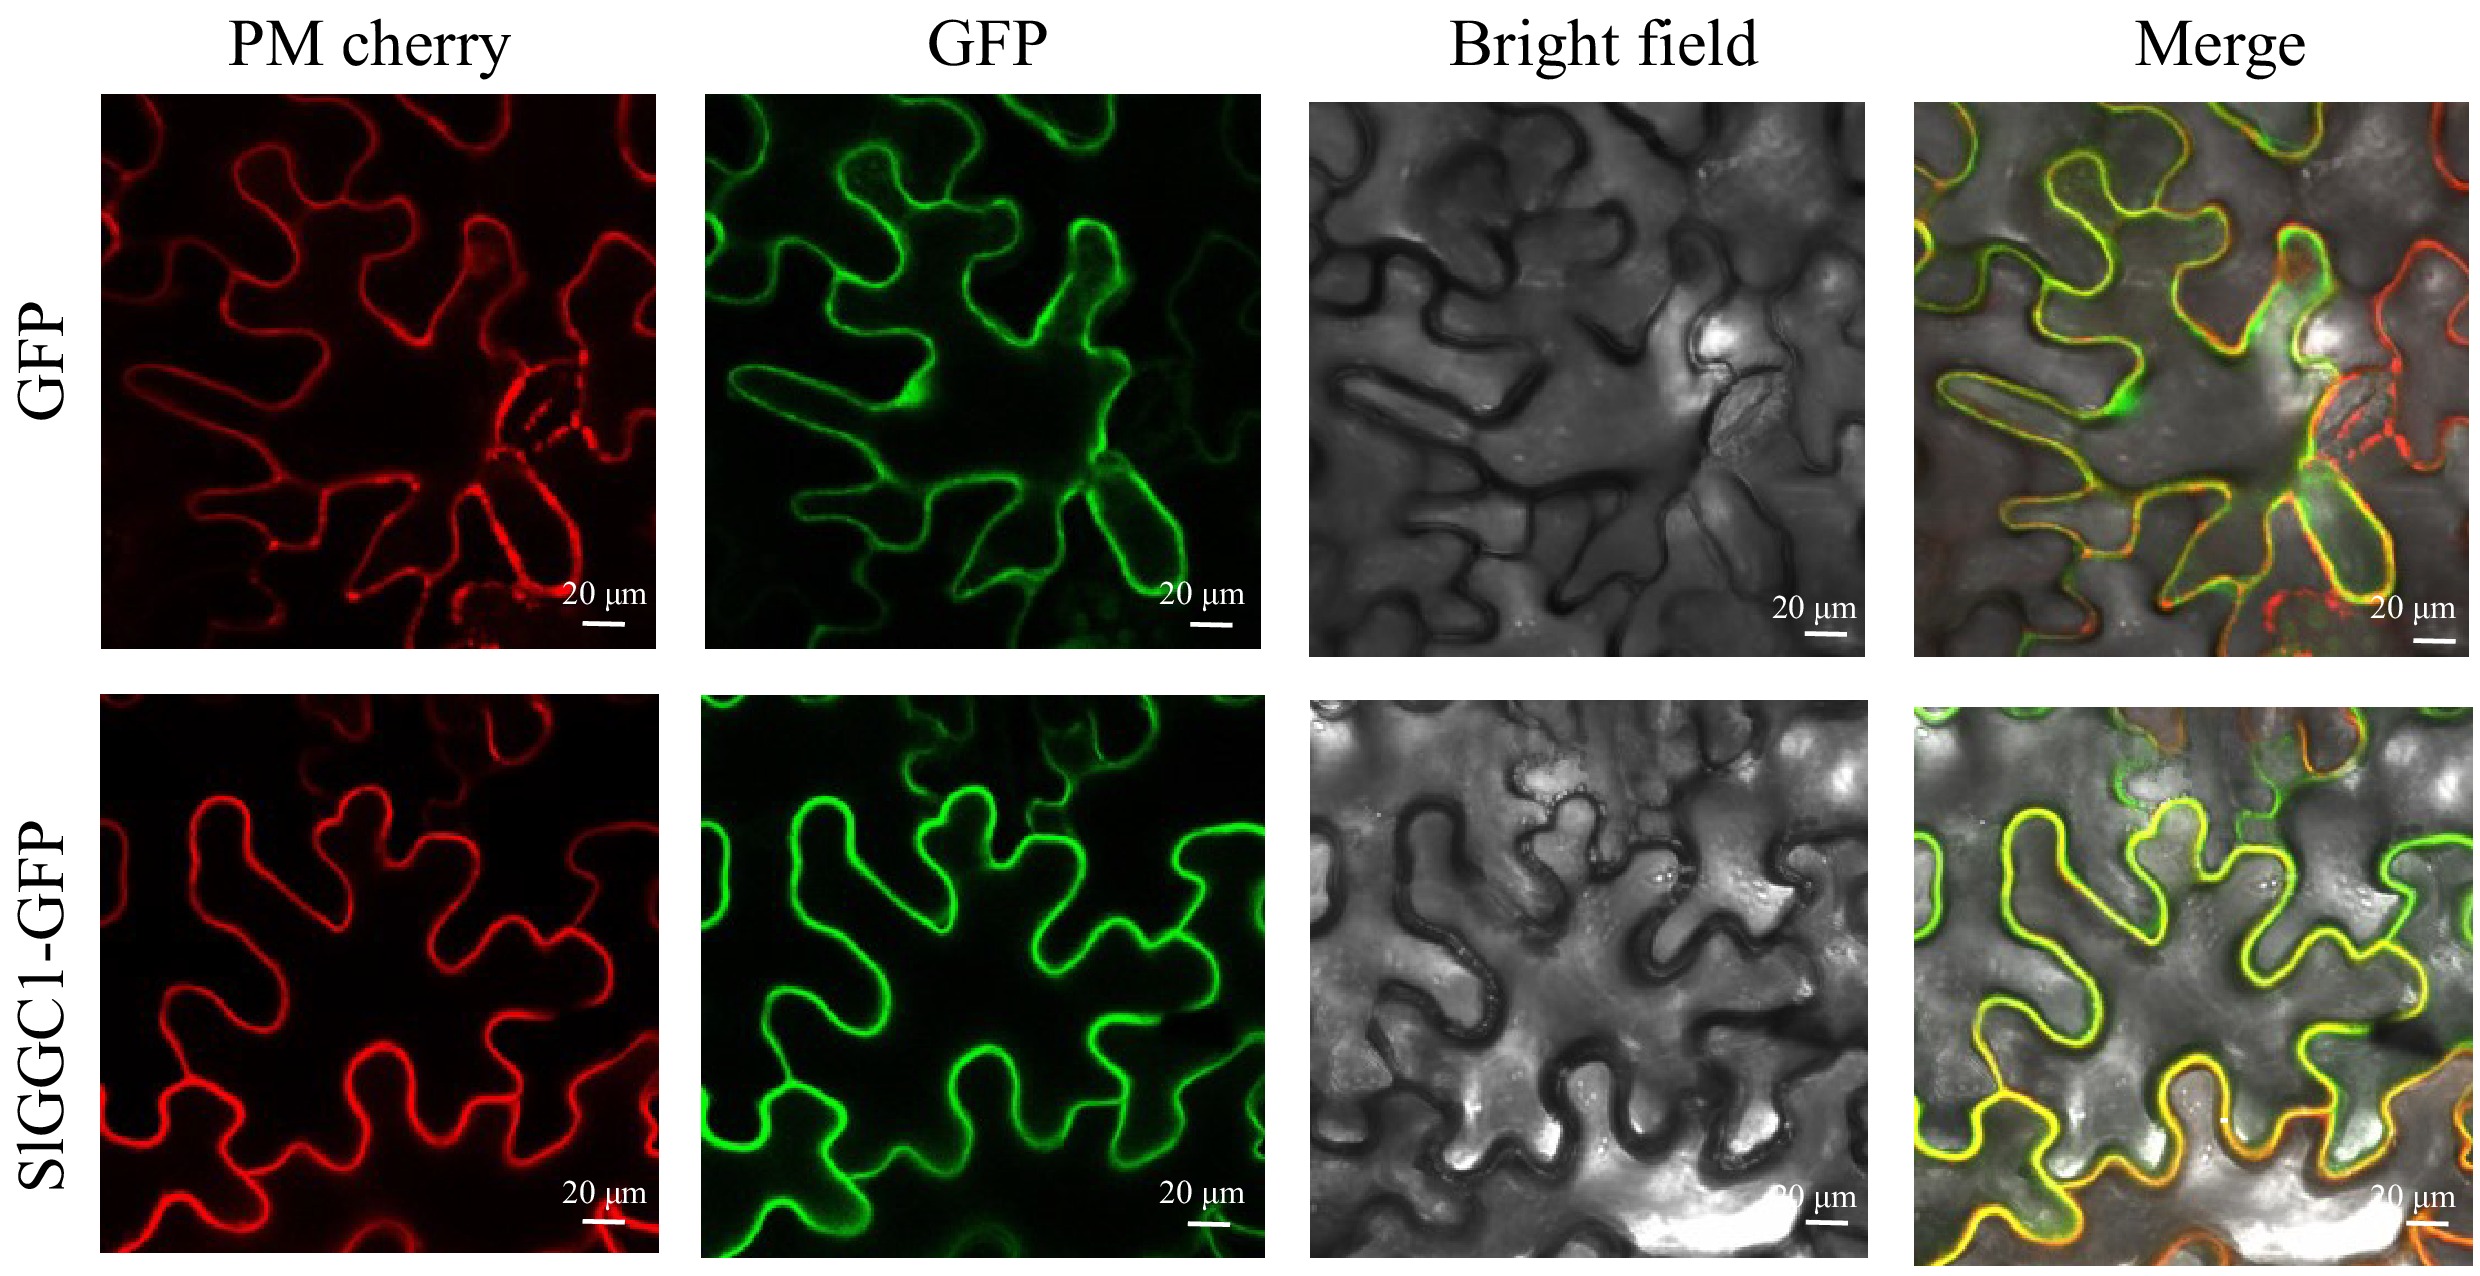
Figure 2.
SlGGC1 is localized in the plasma membrane. Subcellular localization of SlGGC1. The GFP fusion of SlGGC1 was co-expressed with the plasma membrane marker PM-mCherry in N. benthamiana leaves and visualized by confocal microscopy. 35S::GFP is used as a positive control. The GFP and mCherry signals are represented in green and red, respectively. Bars = 20 μm.
-
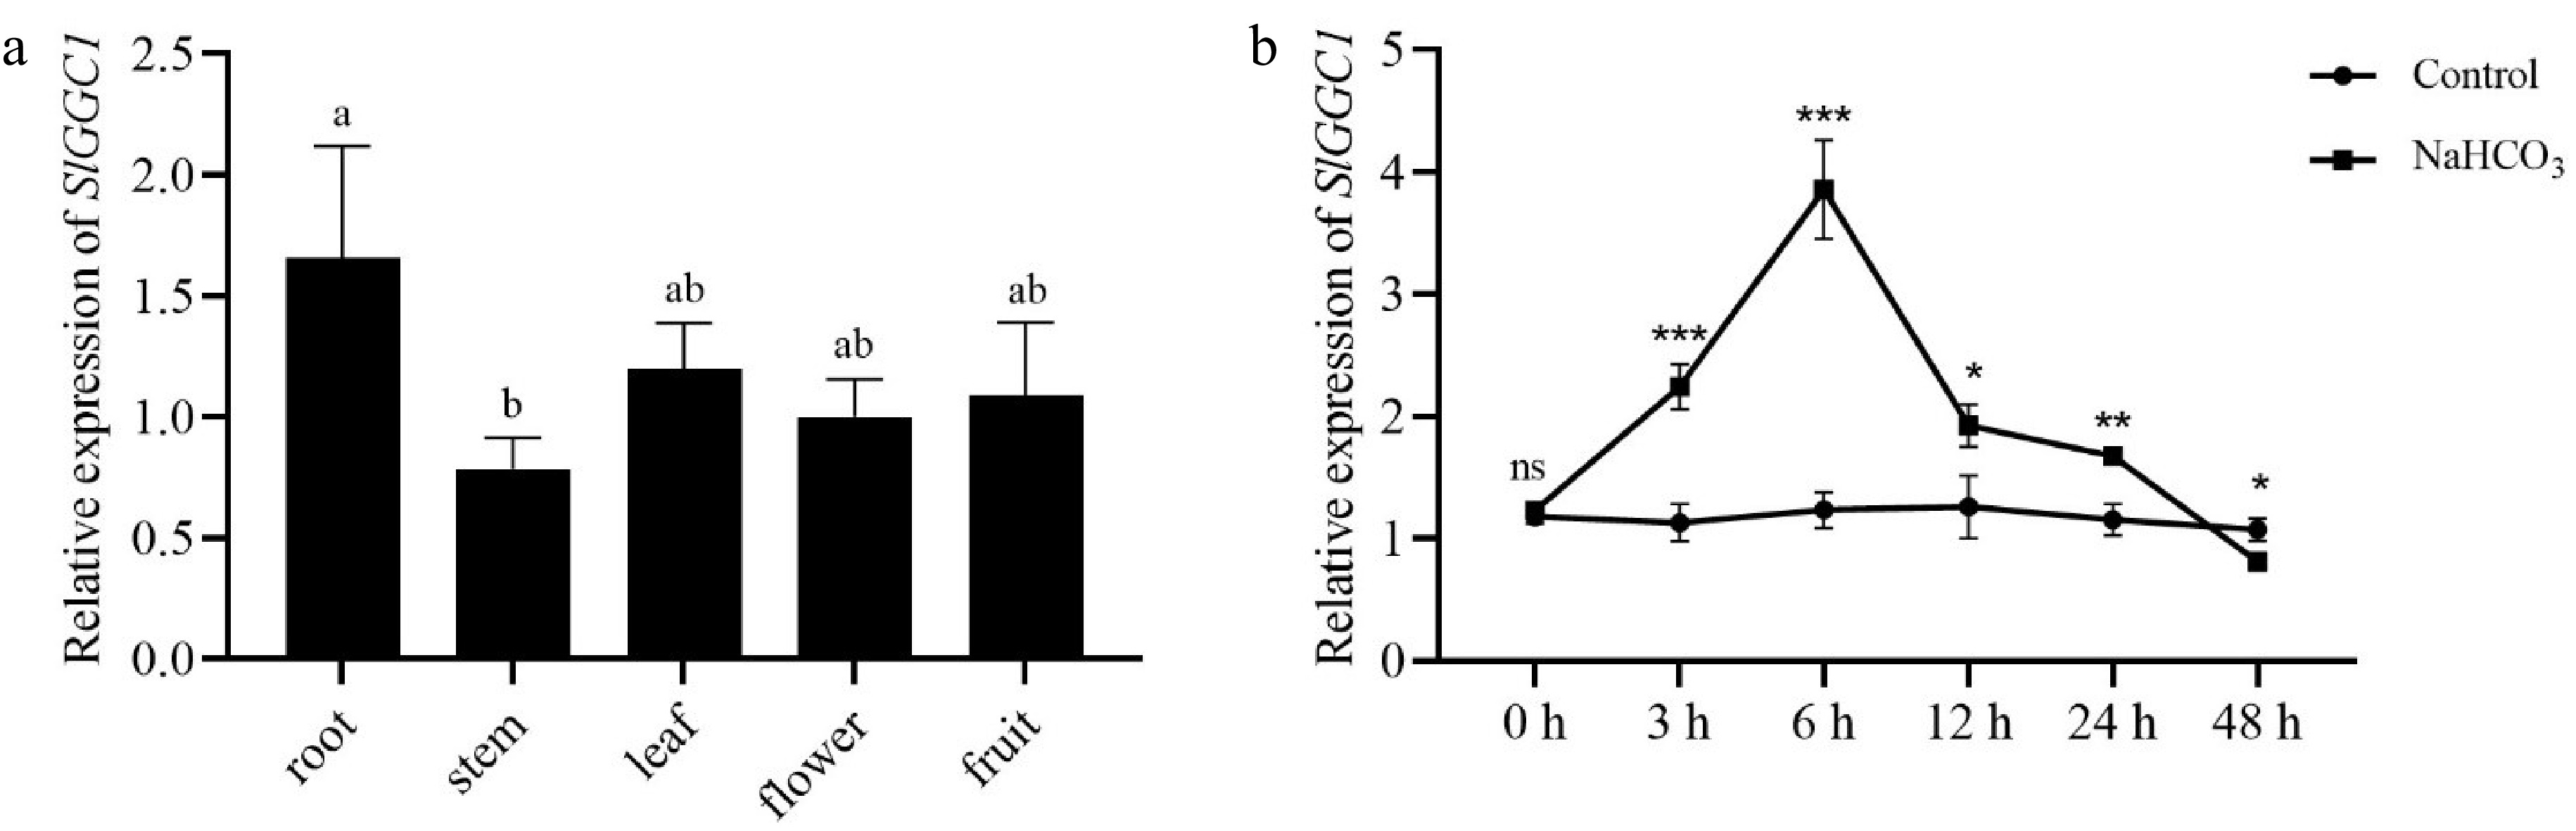
Figure 3.
SlGGC1 expression pattern in tomato and its response to saline-alkali stress. (a) Relative expression levels of SlGGC1 in root, stem, leaf, flower, and fruit detected by qRT-PCR. Statistical significance was determined by one-way ANOVA. Significant differences are indicated by different lowercase letters. (b) The expression of SlGGC1 with or without NaHCO3 treatment. Total RNA was extracted from 5-day-old seedlings treated with or without 10 mM NaHCO3 for 0, 3, 6, 12, 24, and 48 h. The experiments were performed with three biological replicates with similar results. Asterisks indicate significant differences between control and NaHCO3 treatment (* p < 0.05, ** p < 0.01, *** p < 0.001).
-
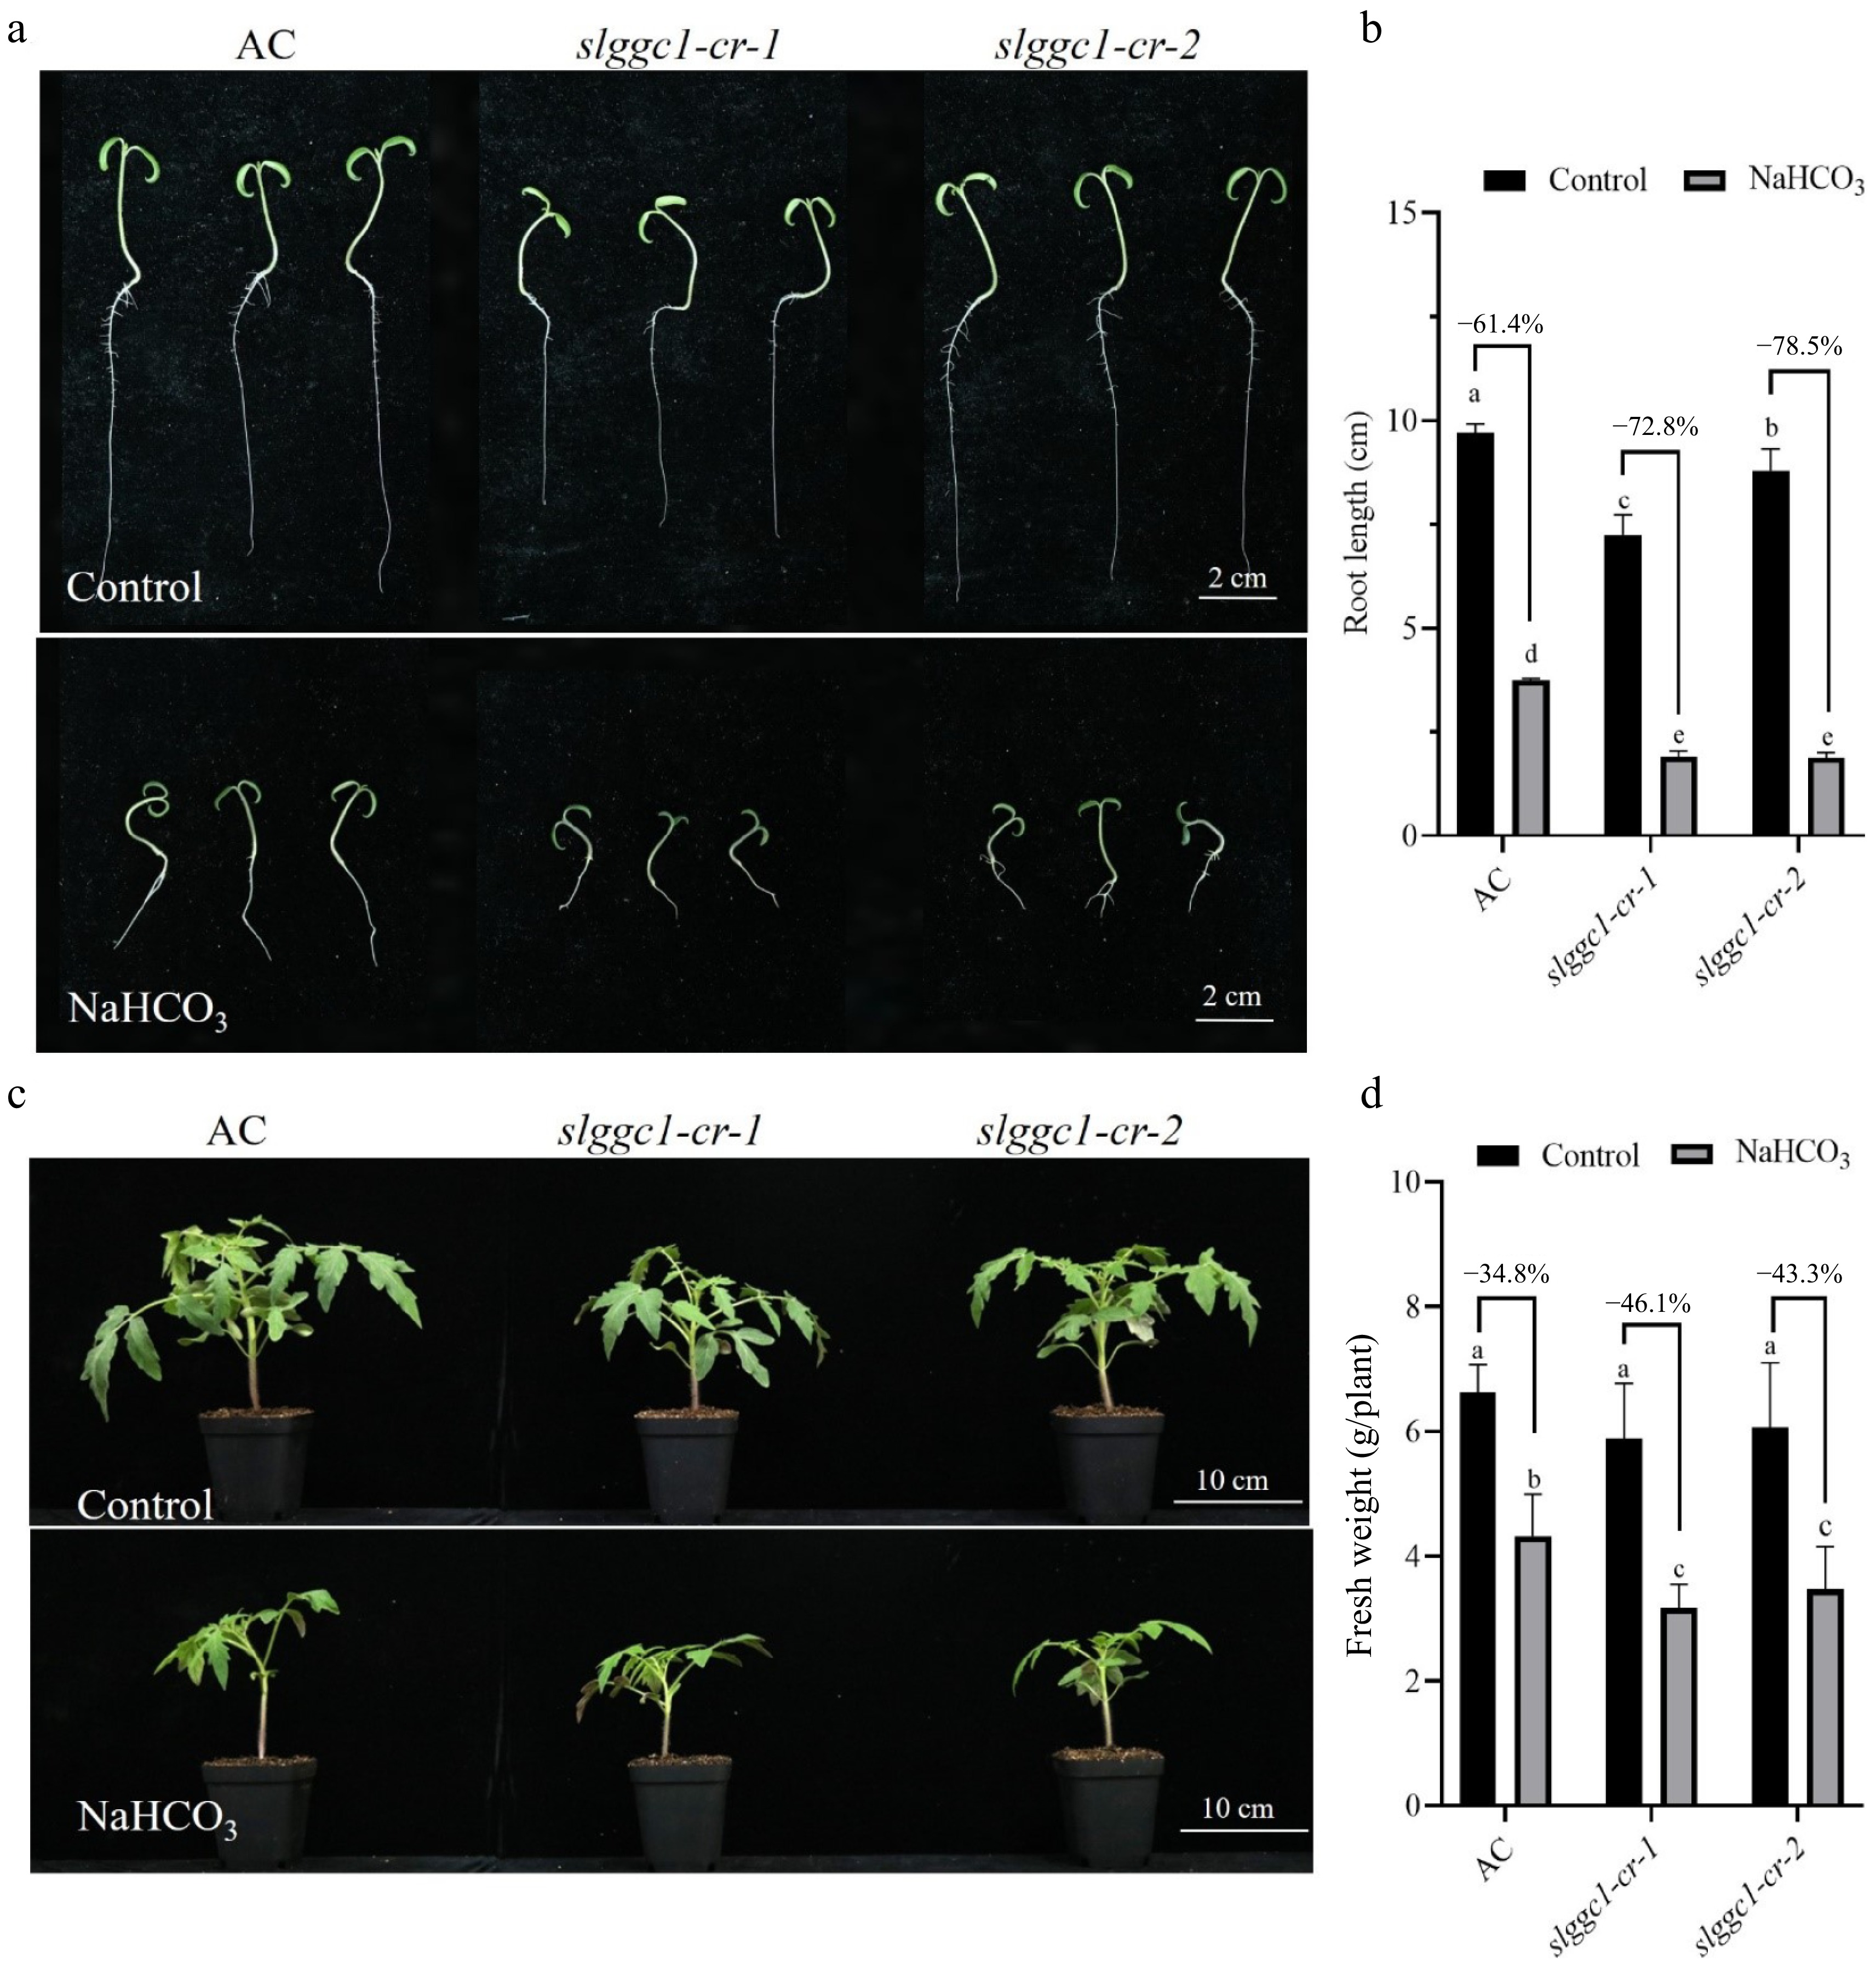
Figure 4.
slggc1 is more sensitive to saline-alkali stress. (a) Phenotype analysis of 'AC' and slggc1 grown on Murashige and Skoog (MS) medium without or with 10 mM NaHCO3. (b) The root length of 'AC' and slggc1 under saline-alkali stress for 5 d. Seedlings were cultivated in a climate chamber with 60% relative humidity under a 16 h light period at 26 °C and an 8 h dark period at 20 °C. (c) Phenotype analysis of three-week-old 'AC' (wild-type) and slggc1 grown in soil without or with 75 mM NaHCO3. (d) The biomass of AC and slggc1 grown under saline-alkali stress for 21 d. The experiments were performed with three biological replicates with similar results. Statistical significance was determined by two-way ANOVA, p < 0.05. Significant differences are indicated by different lowercase letters.
-
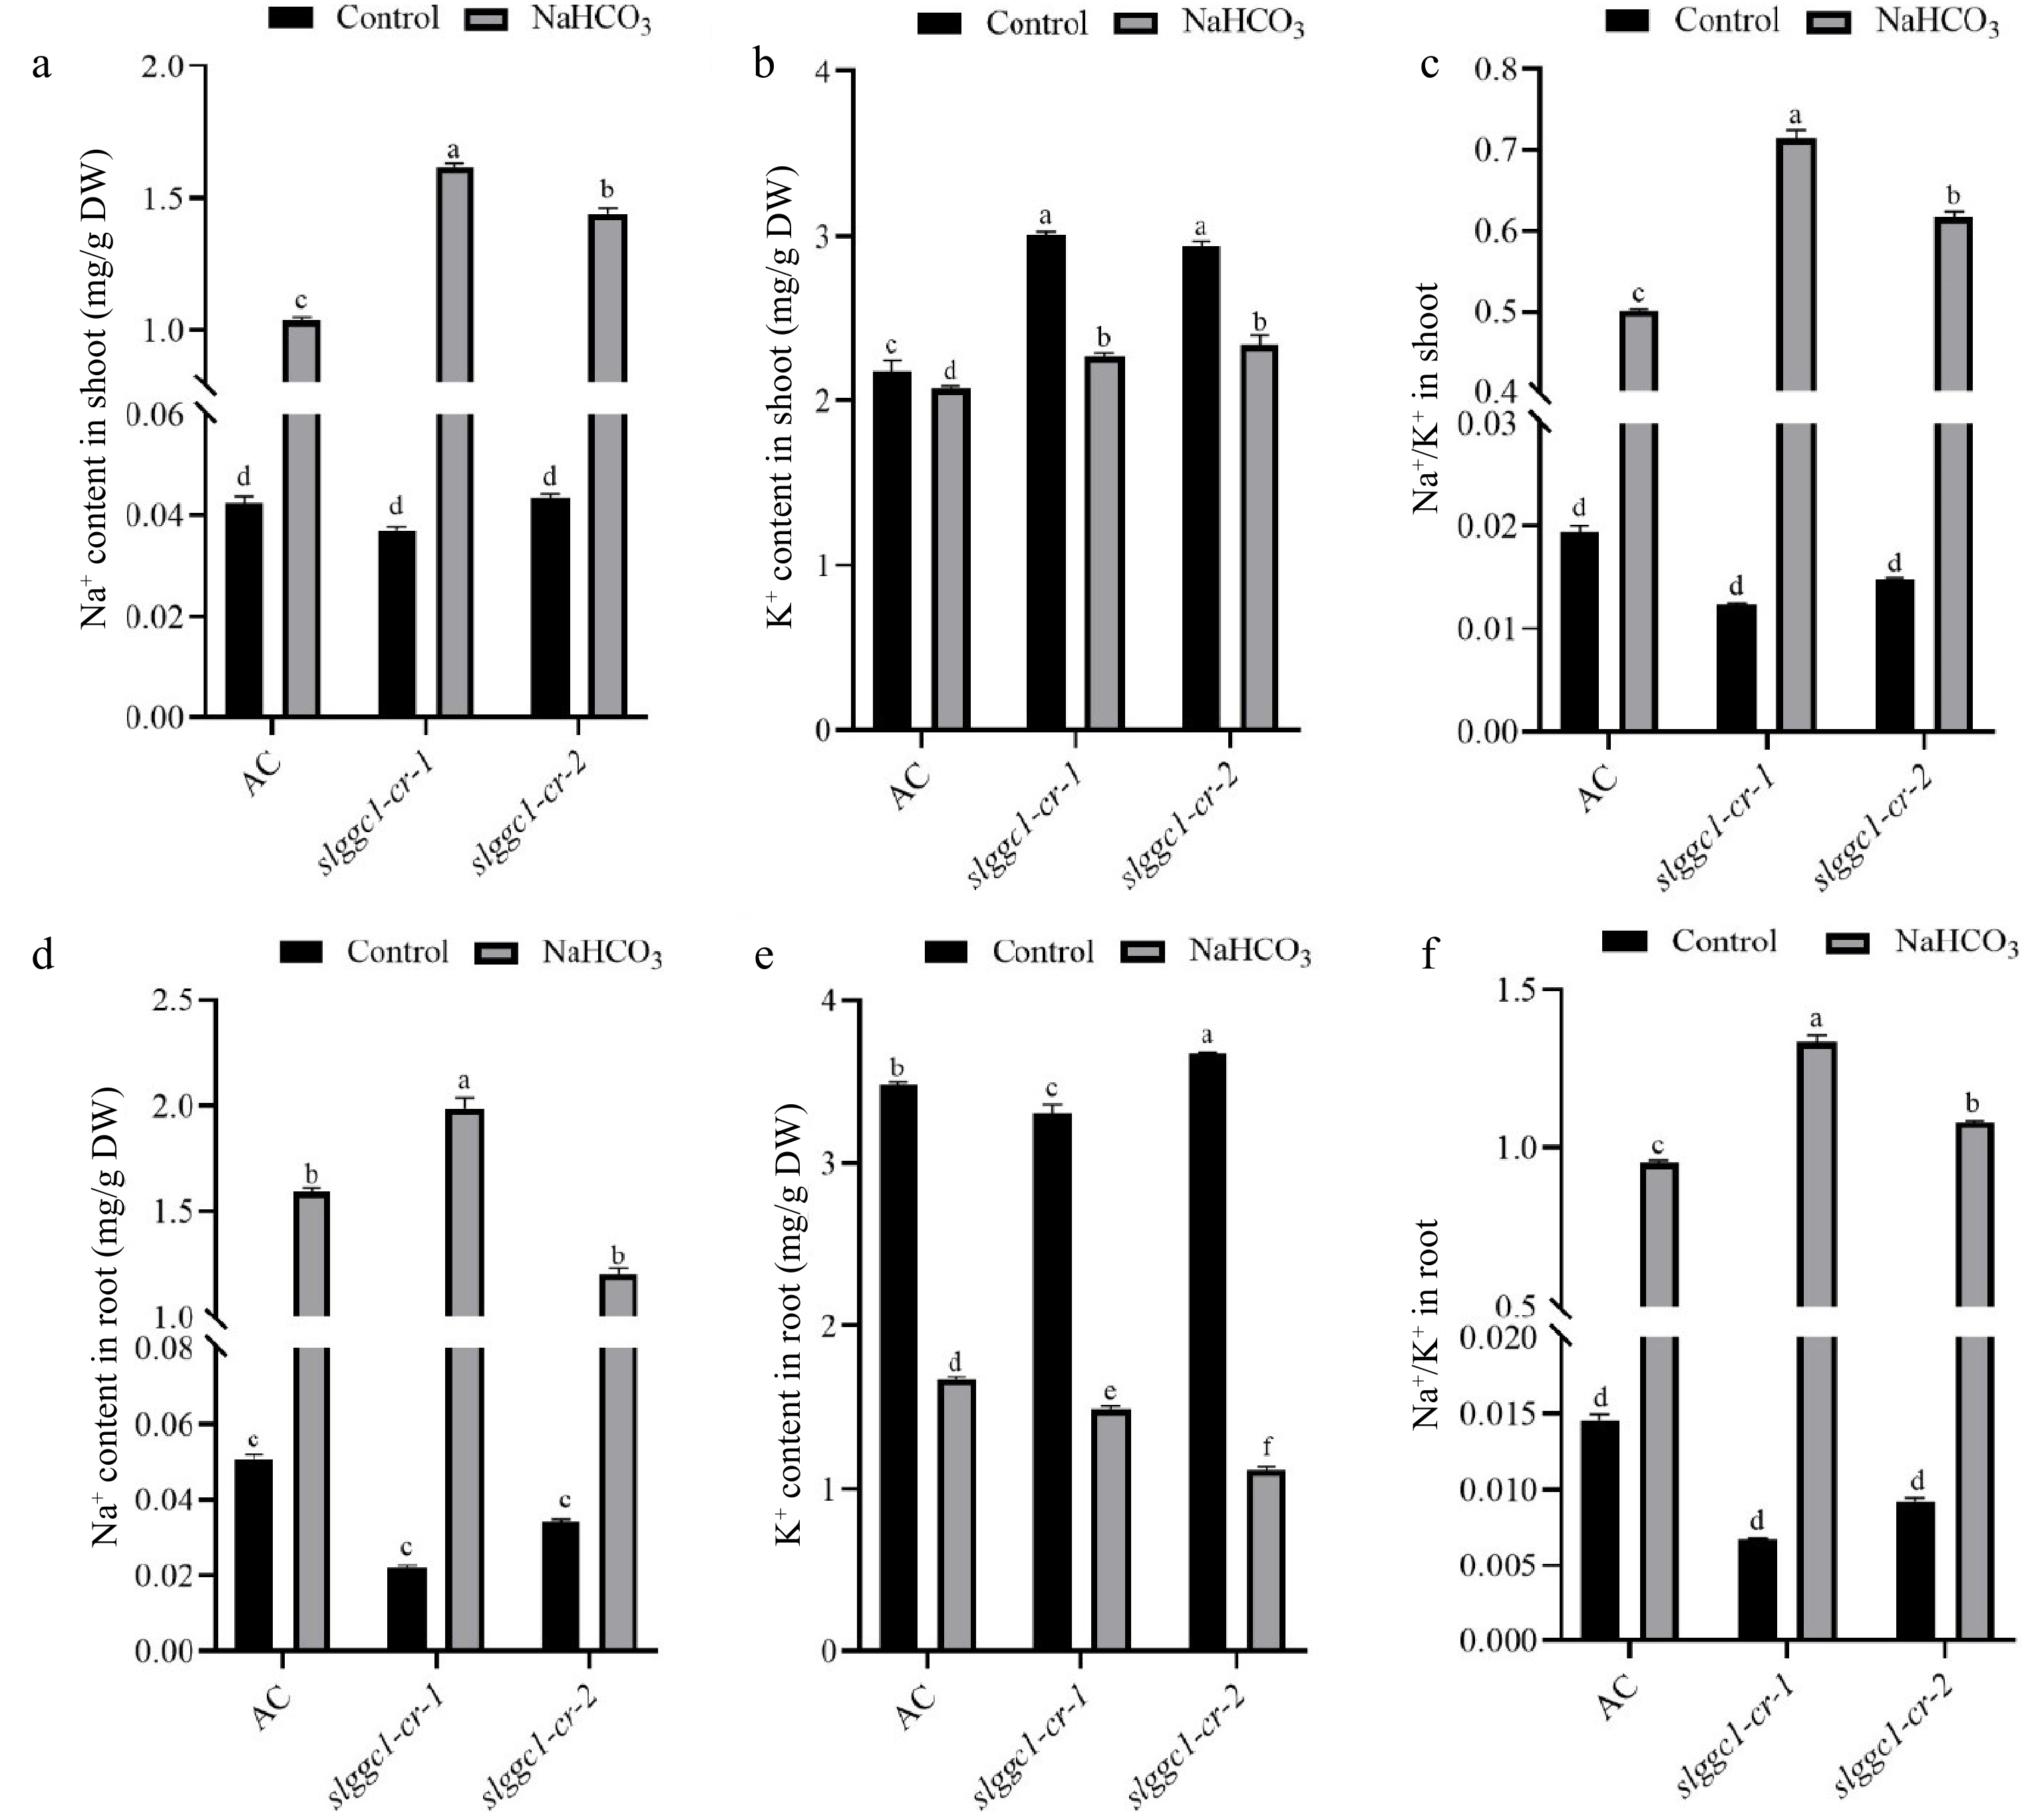
Figure 5.
SlGGC1 regulates Na+ and K+ accumulation under saline-alkali stress. The Na+ and K+ contents in AC and slggc1 grown under control and saline-alkaline (75 mM NaHCO3) conditions. (a) Na+ content, (b) K+ content, and (c) Na+/K+ ratio in the shoots of AC and slggc1 were measured after three weeks of treatment with 75 mM NaHCO3. (d) Na+ content, (e) K+ content, and (f) Na+/K+ ratio in the roots of AC and slggc1 were measured after three weeks of treatment with 75 mM NaHCO3. The Na+ and K+ contents were measured by inductively coupled plasma-mass spectrometry (ICP-MS). The experiments were performed with three biological replicates with similar results. Statistical significance was determined by two-way ANOVA, p < 0.05. Significant differences are indicated by different lowercase letters.
-
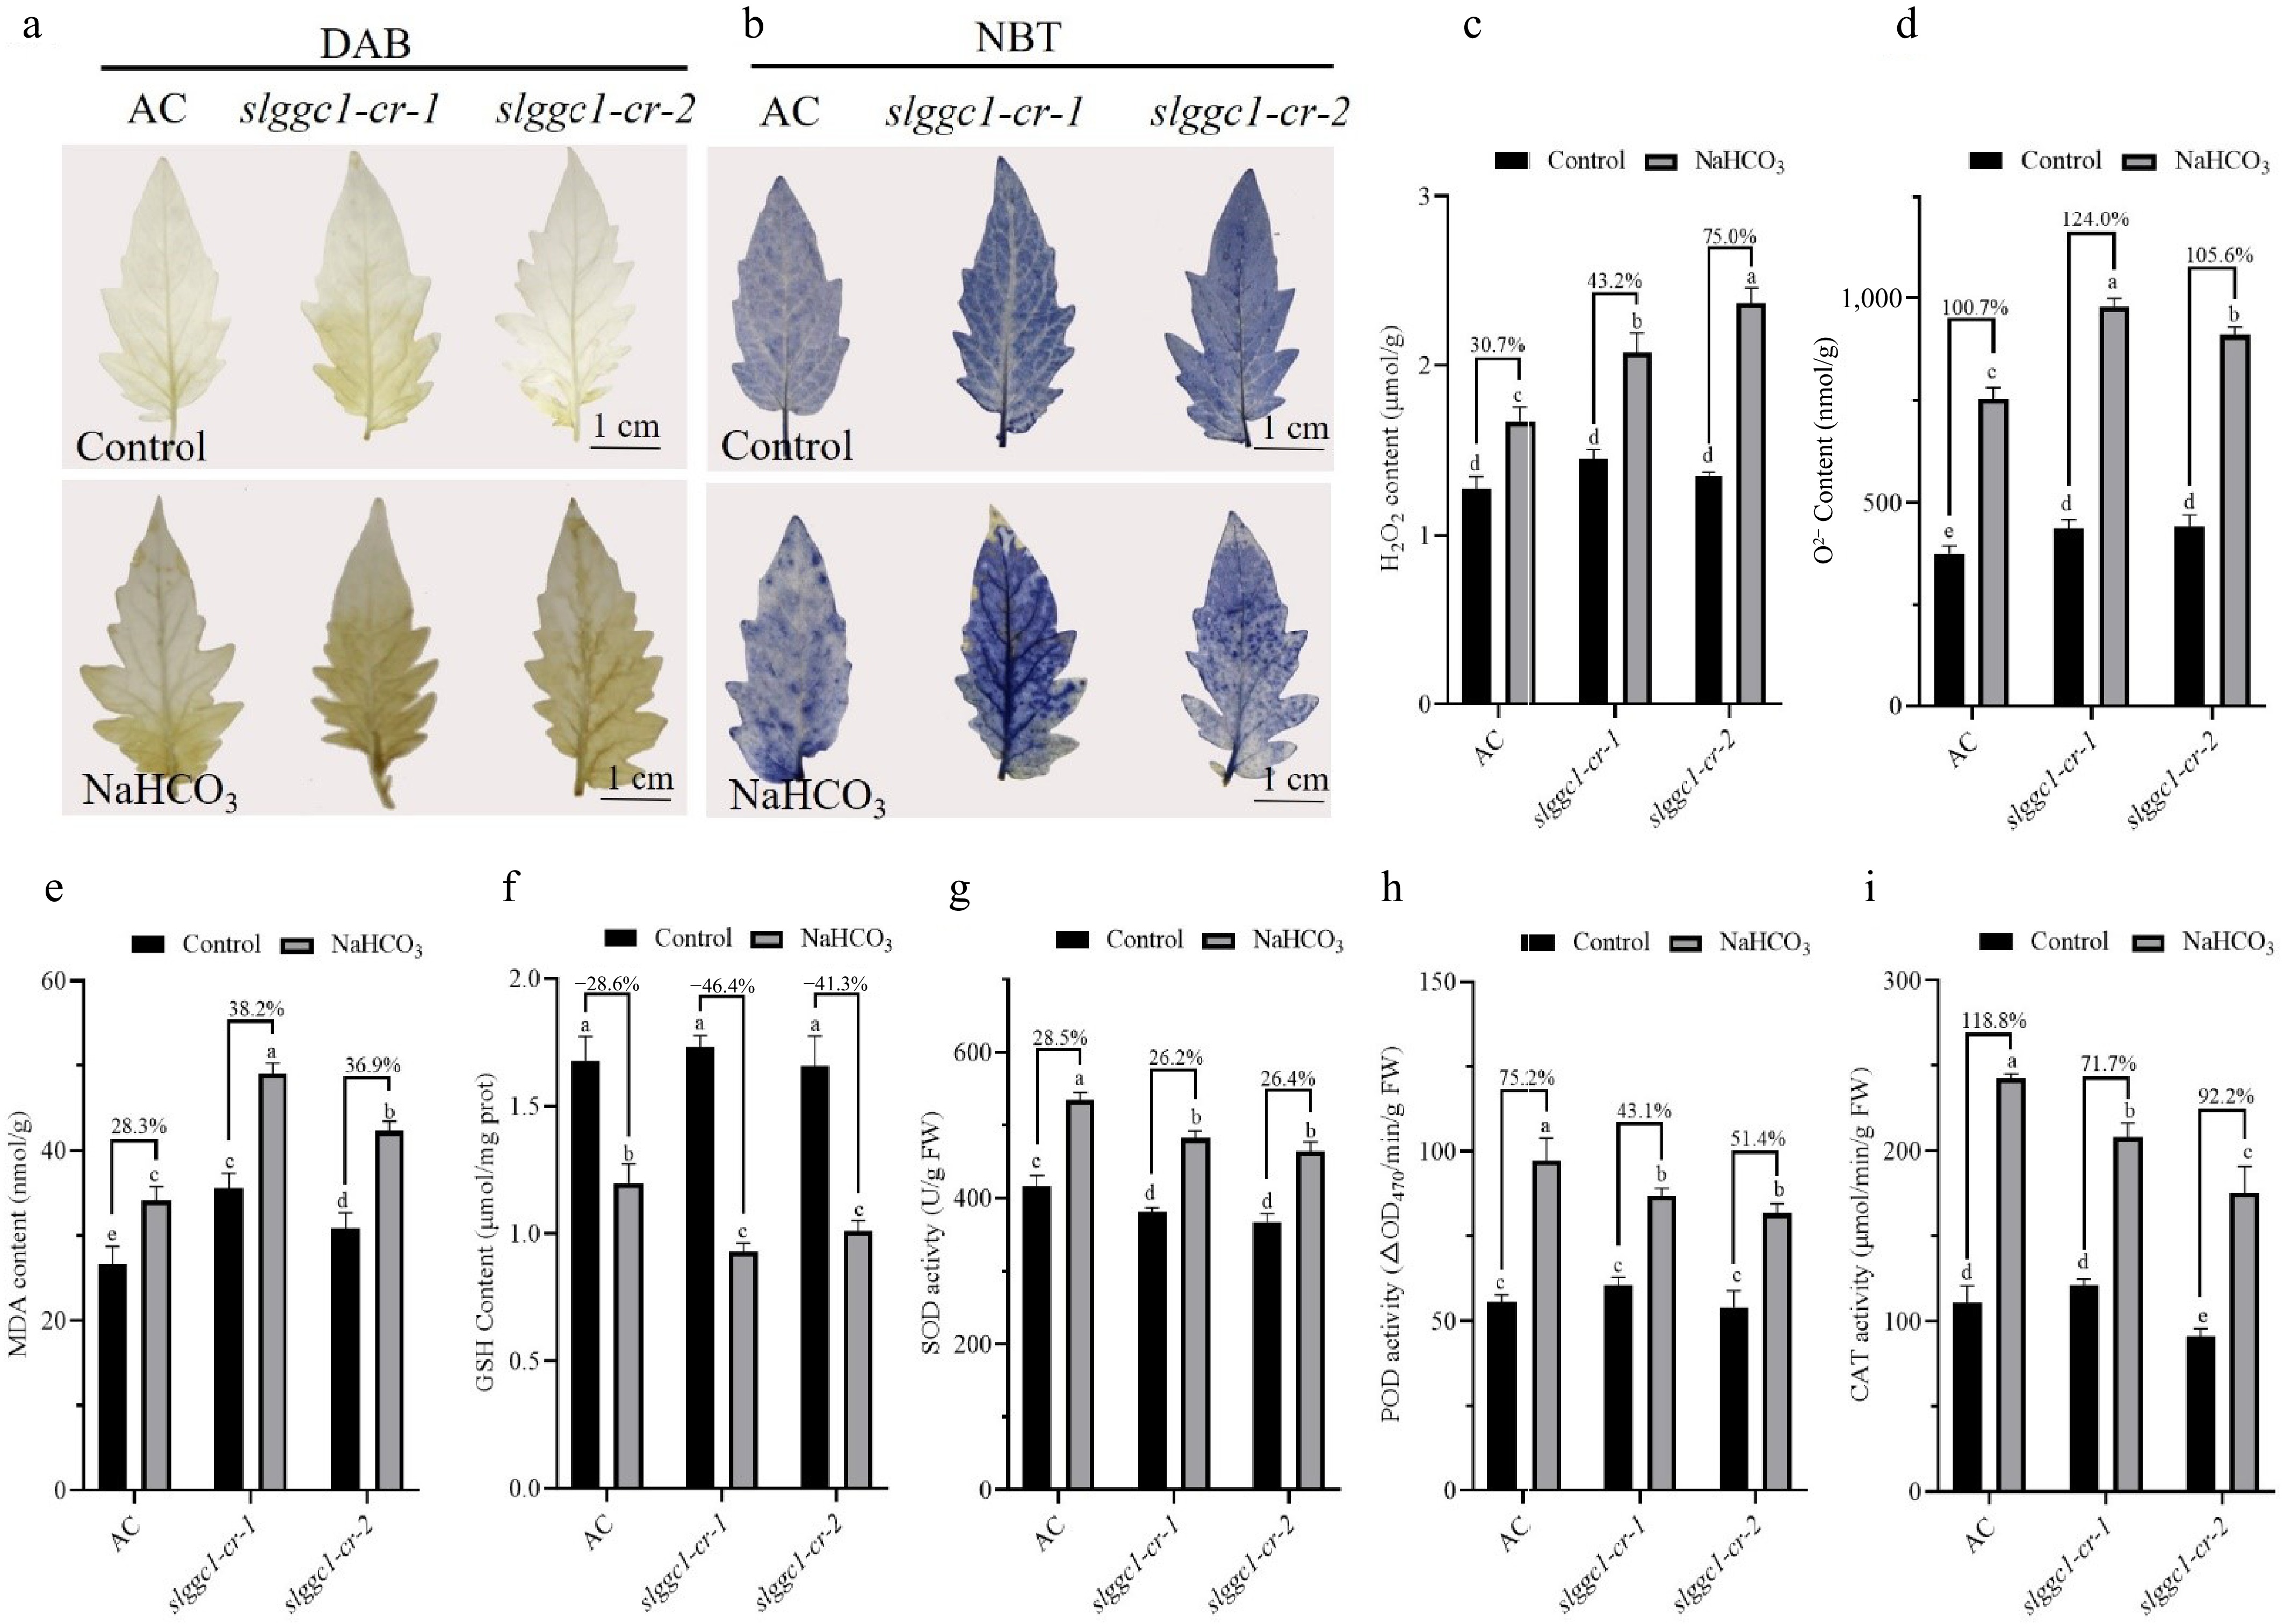
Figure 6.
SlGGC1 regulates ROS homeostasis under saline-alkali stress. (a) 3,3′-Diaminobenzidine (DAB) staining. (b) Nitrotetrazolium chloride blue (NBT) staining. (c) H2O2, and (d) superoxide anion content of 'AC' and slggc1 cultivated in saline-alkaline conditions for 21 d. (e) MDA, (f) GSH content of 'AC' and slggc1 cultivated in saline-alkaline conditions for 21 d. The enzymatic activities of (g) SOD, (h) POD, and (i) CAT in 'AC' and slggc1 were measured after 8 h of saline-alkali treatment. The experiments were performed with three biological replicates with similar results. Statistical significance was determined by two-way ANOVA, p < 0.05. Significant differences are indicated by different lowercase letters.
-
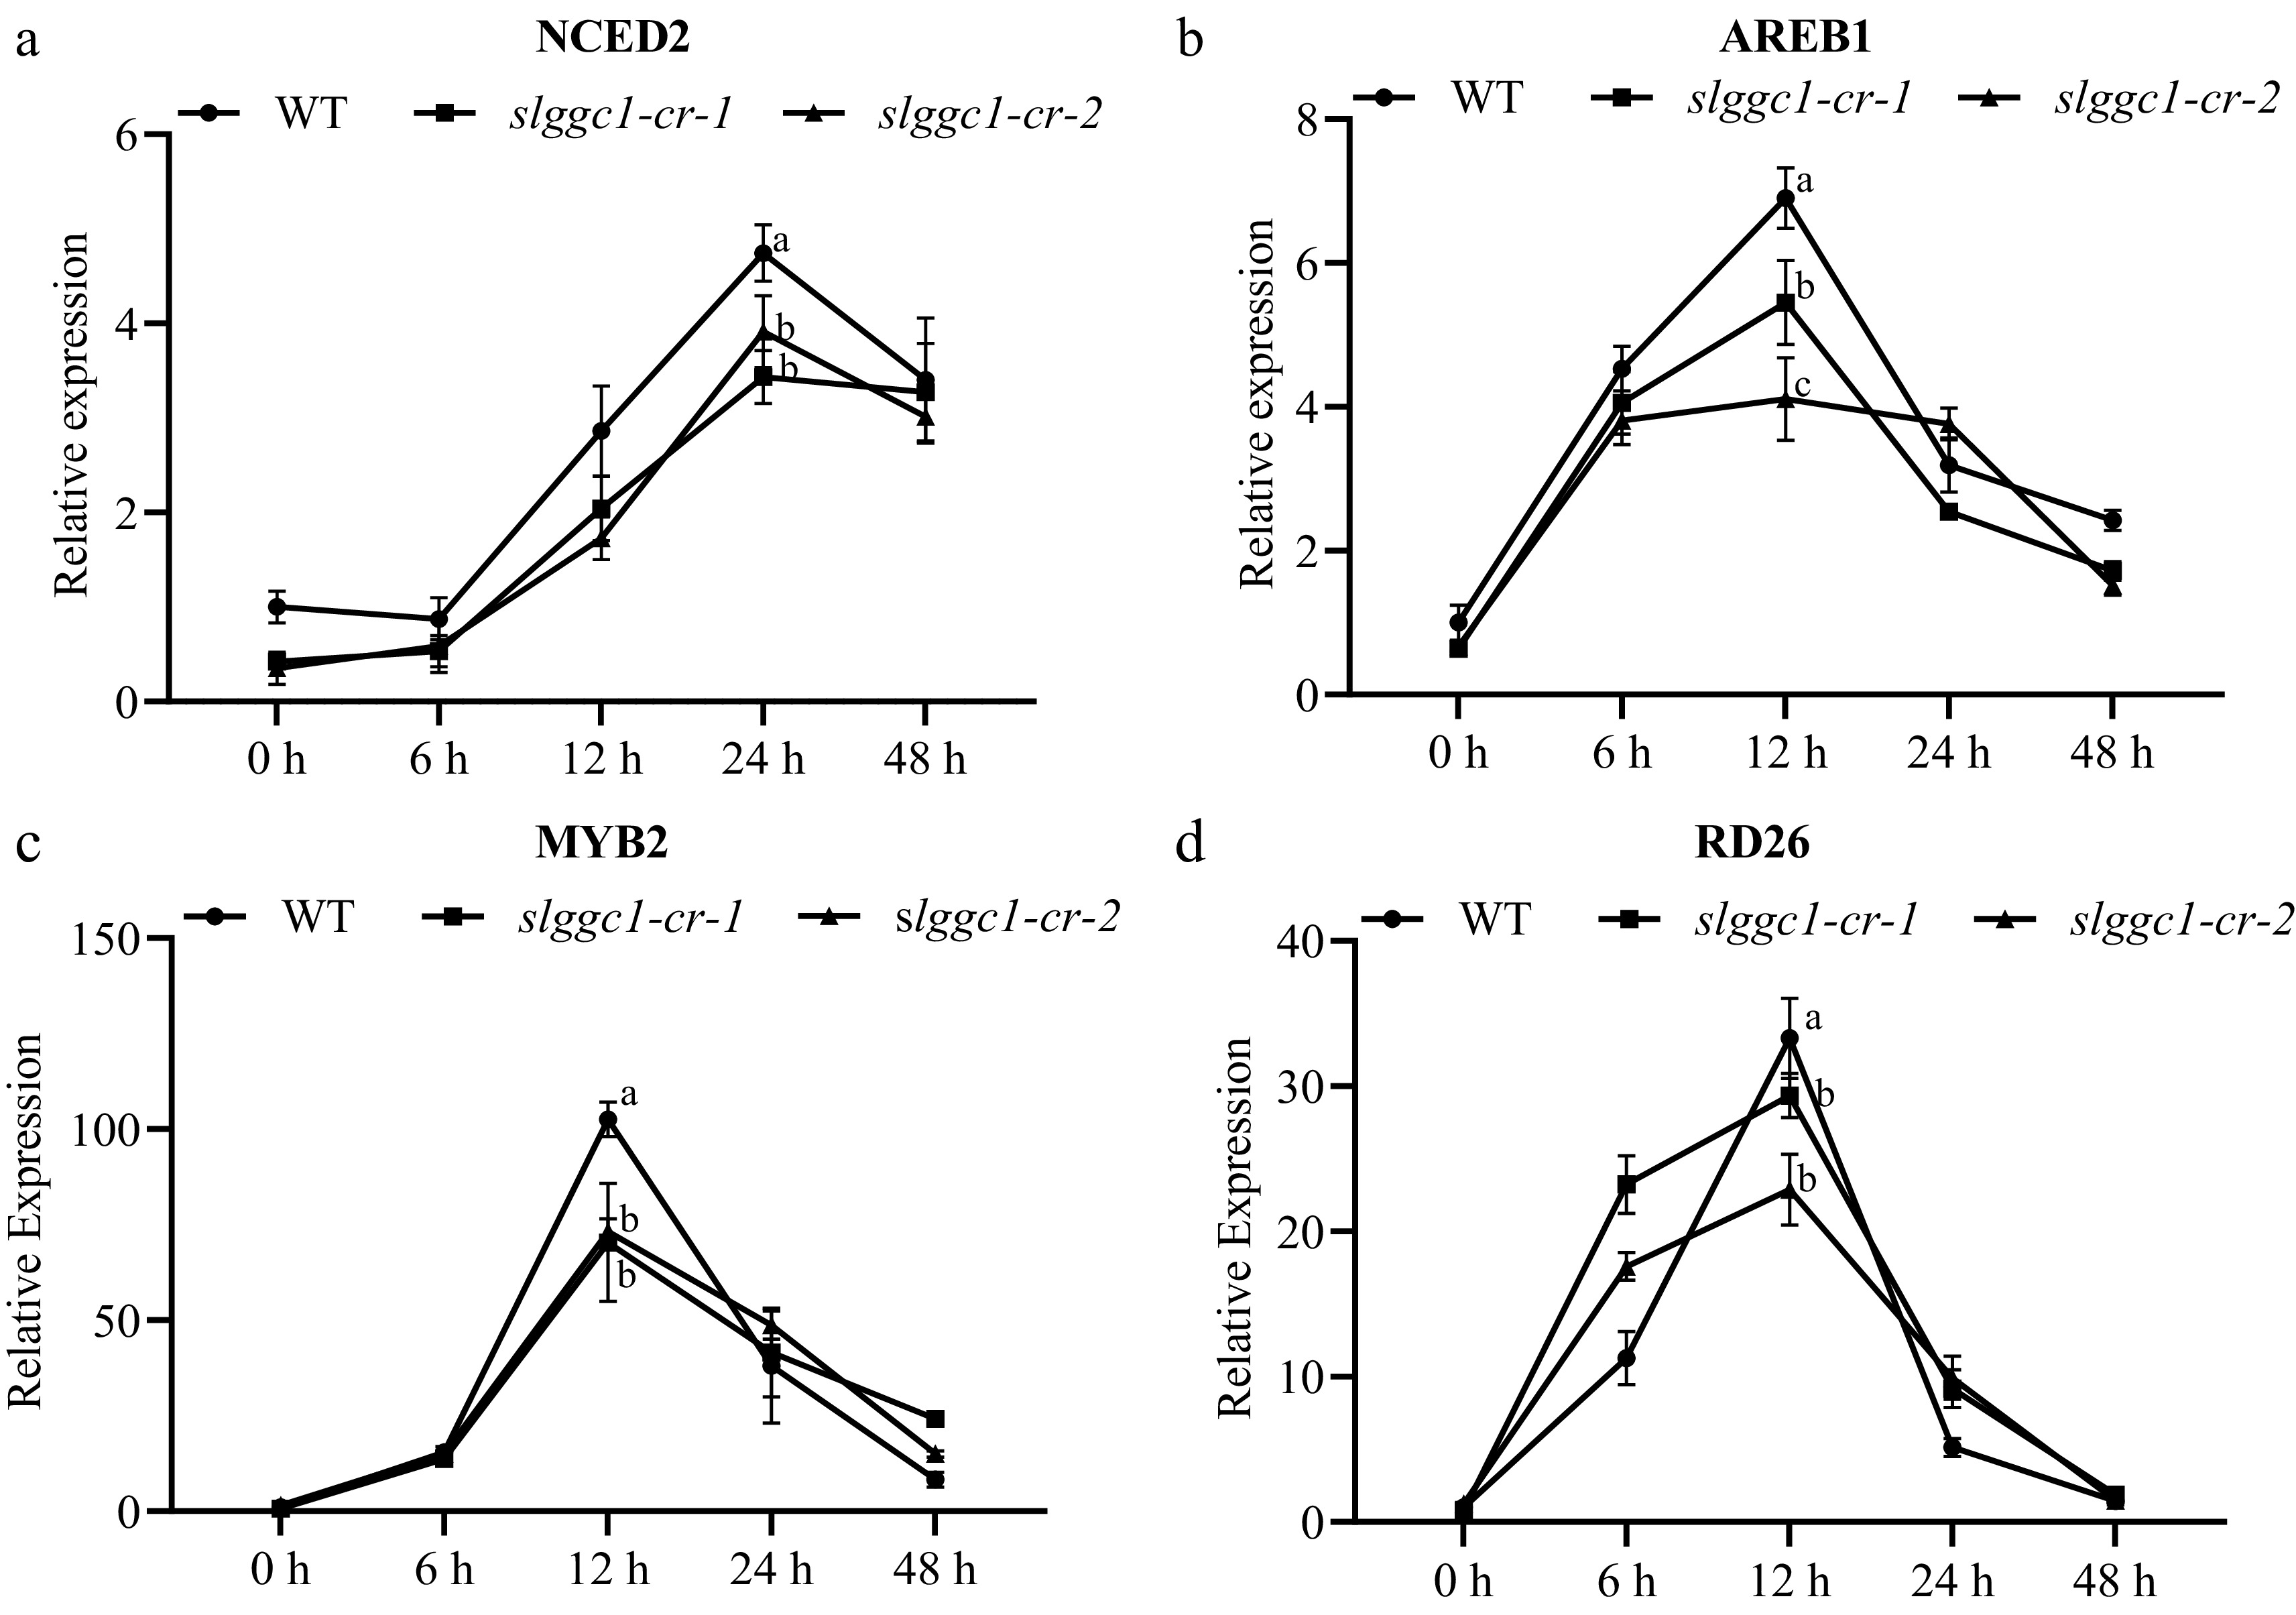
Figure 7.
SlGGC1 affects ABA signaling in response to saline-alkali stress. The expression levels of (a) NCED2, (b) AREB1, (c) MYB2, and (d) RD26 in seedlings of WT and slggc1-cr were assessed at 0, 6, 12, 24, and 48 h following treatment with 10 mM NaHCO3 on MS Petri dishes. The expression level of WT at 0 h was set to 1. The EF1α gene was used as the internal control for qRT-PCR. The experiments were performed with three biological replicates with similar results. Statistical significance was determined by two-way ANOVA, p < 0.05. Significant differences are indicated by different lowercase letters.
Figures
(7)
Tables
(0)