-
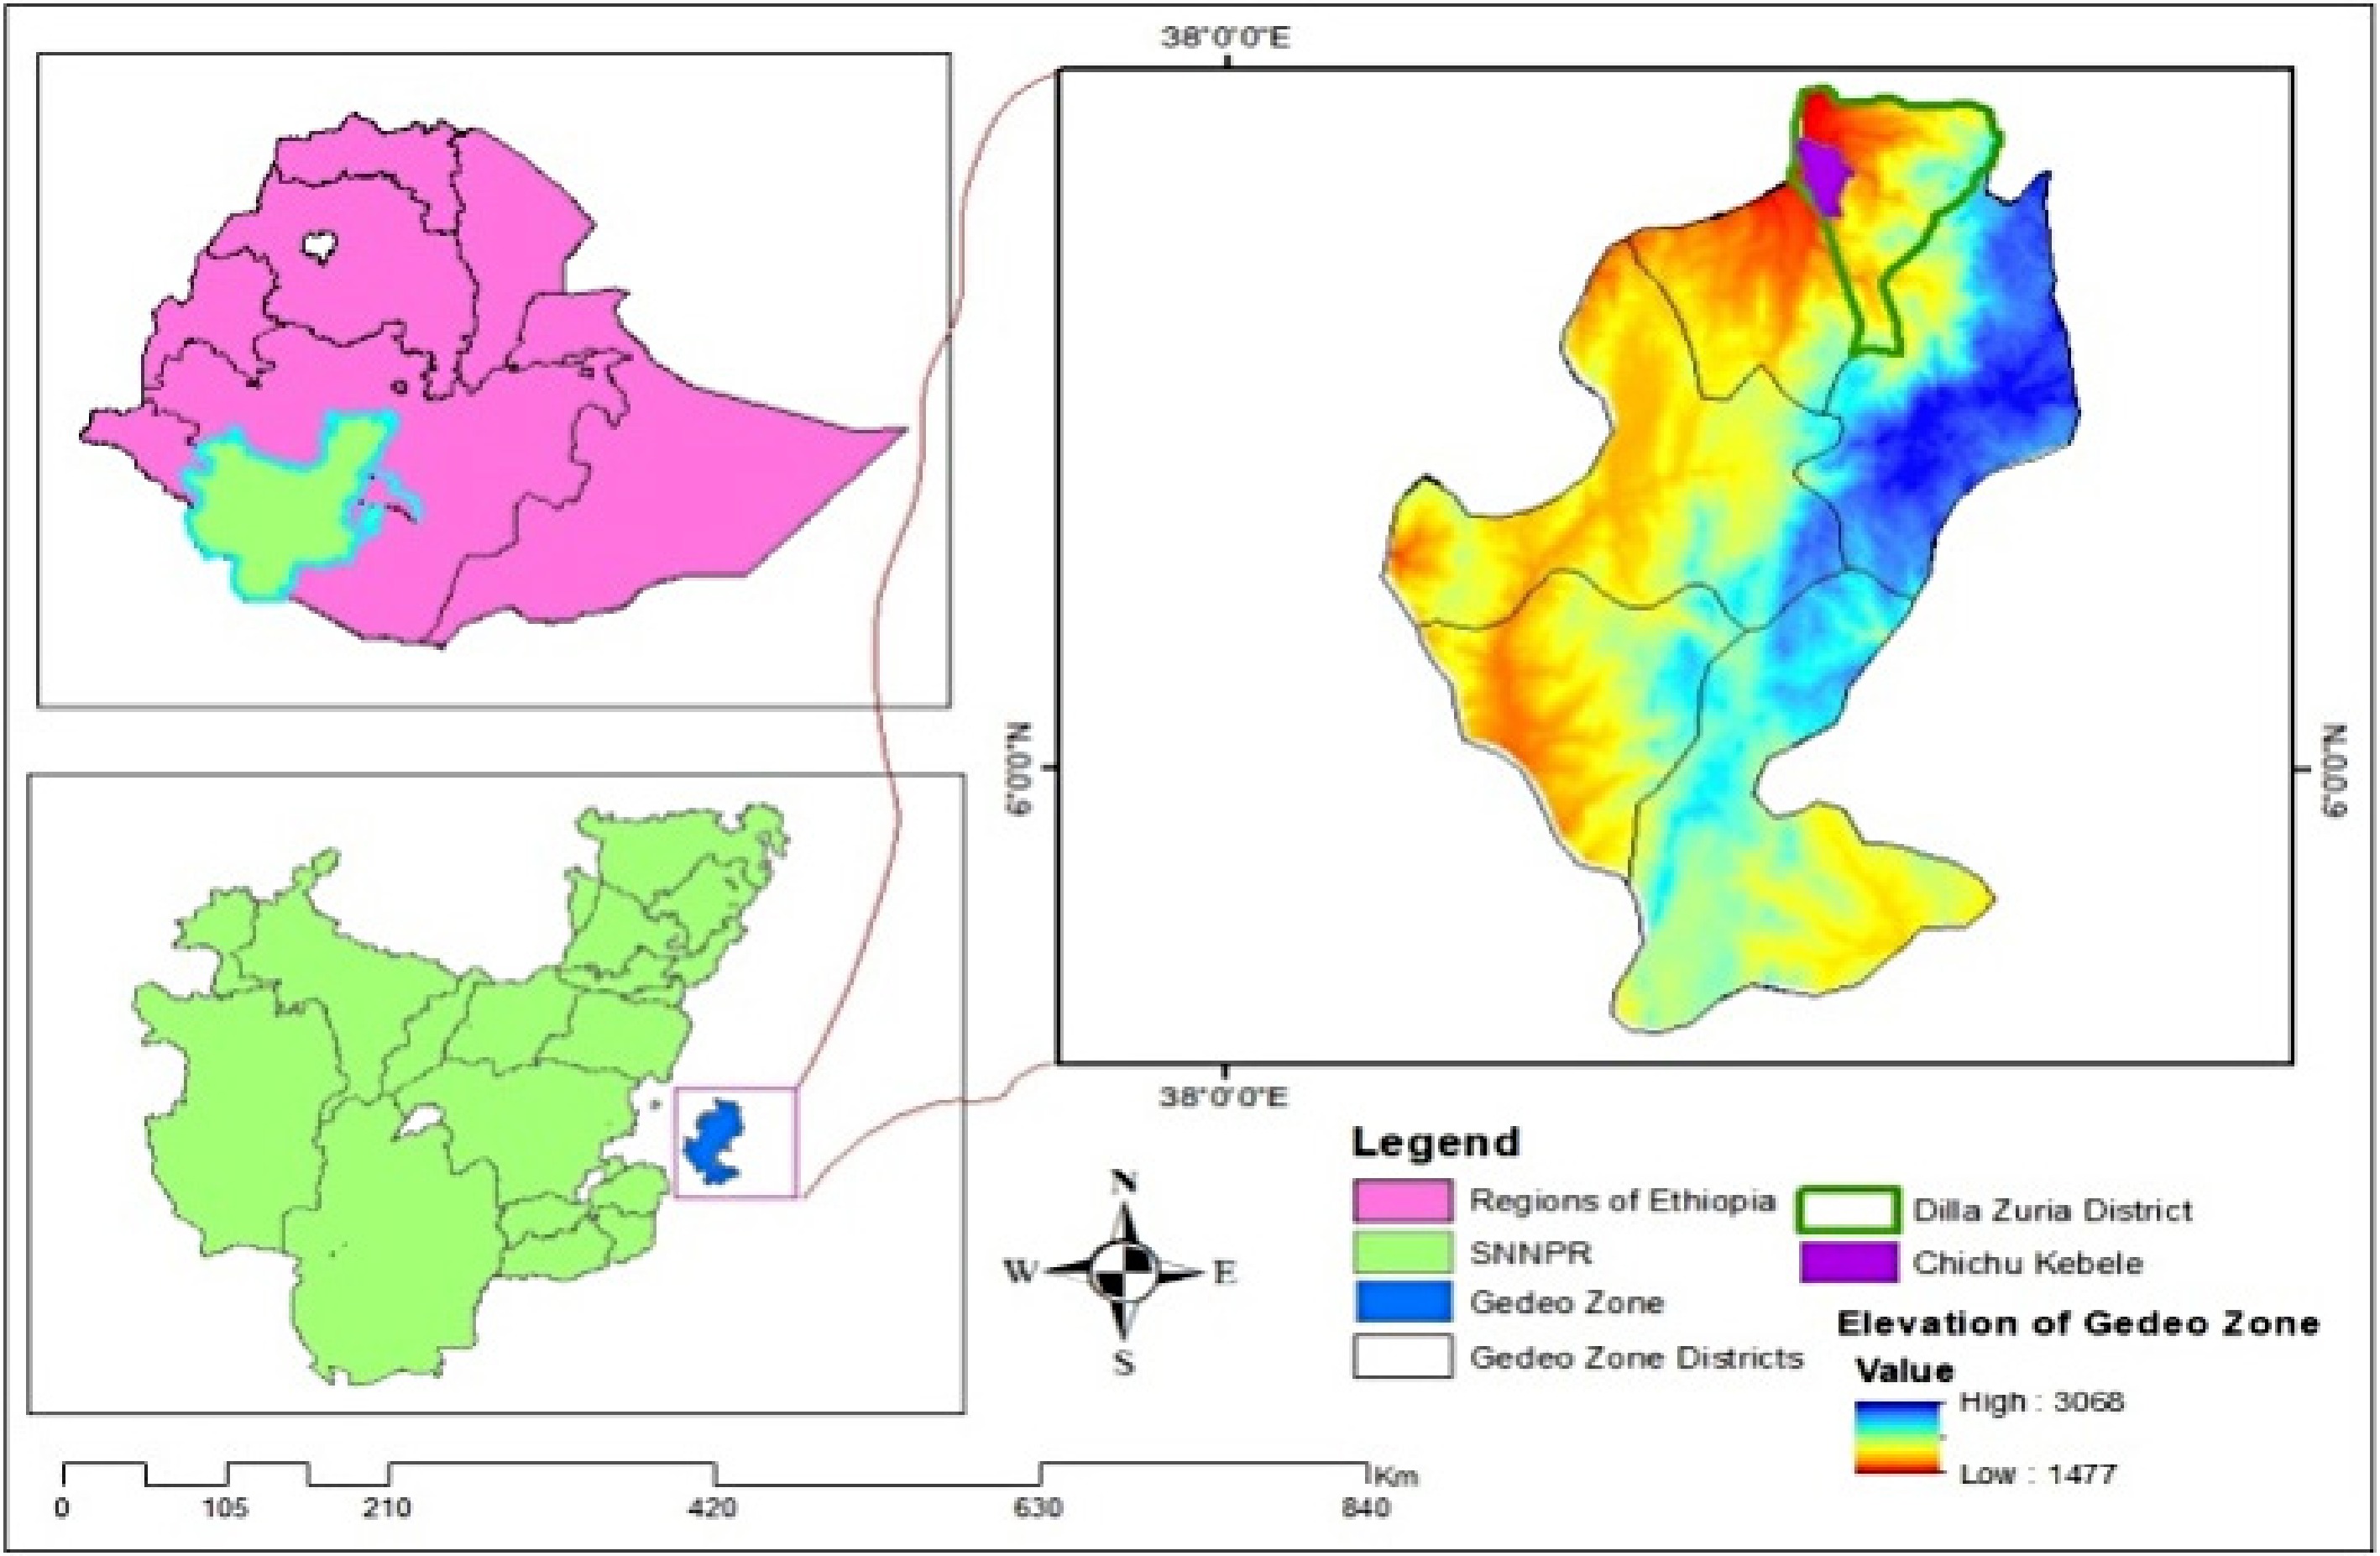
Figure 1.
Map and altitudinal variations of the study area.
-
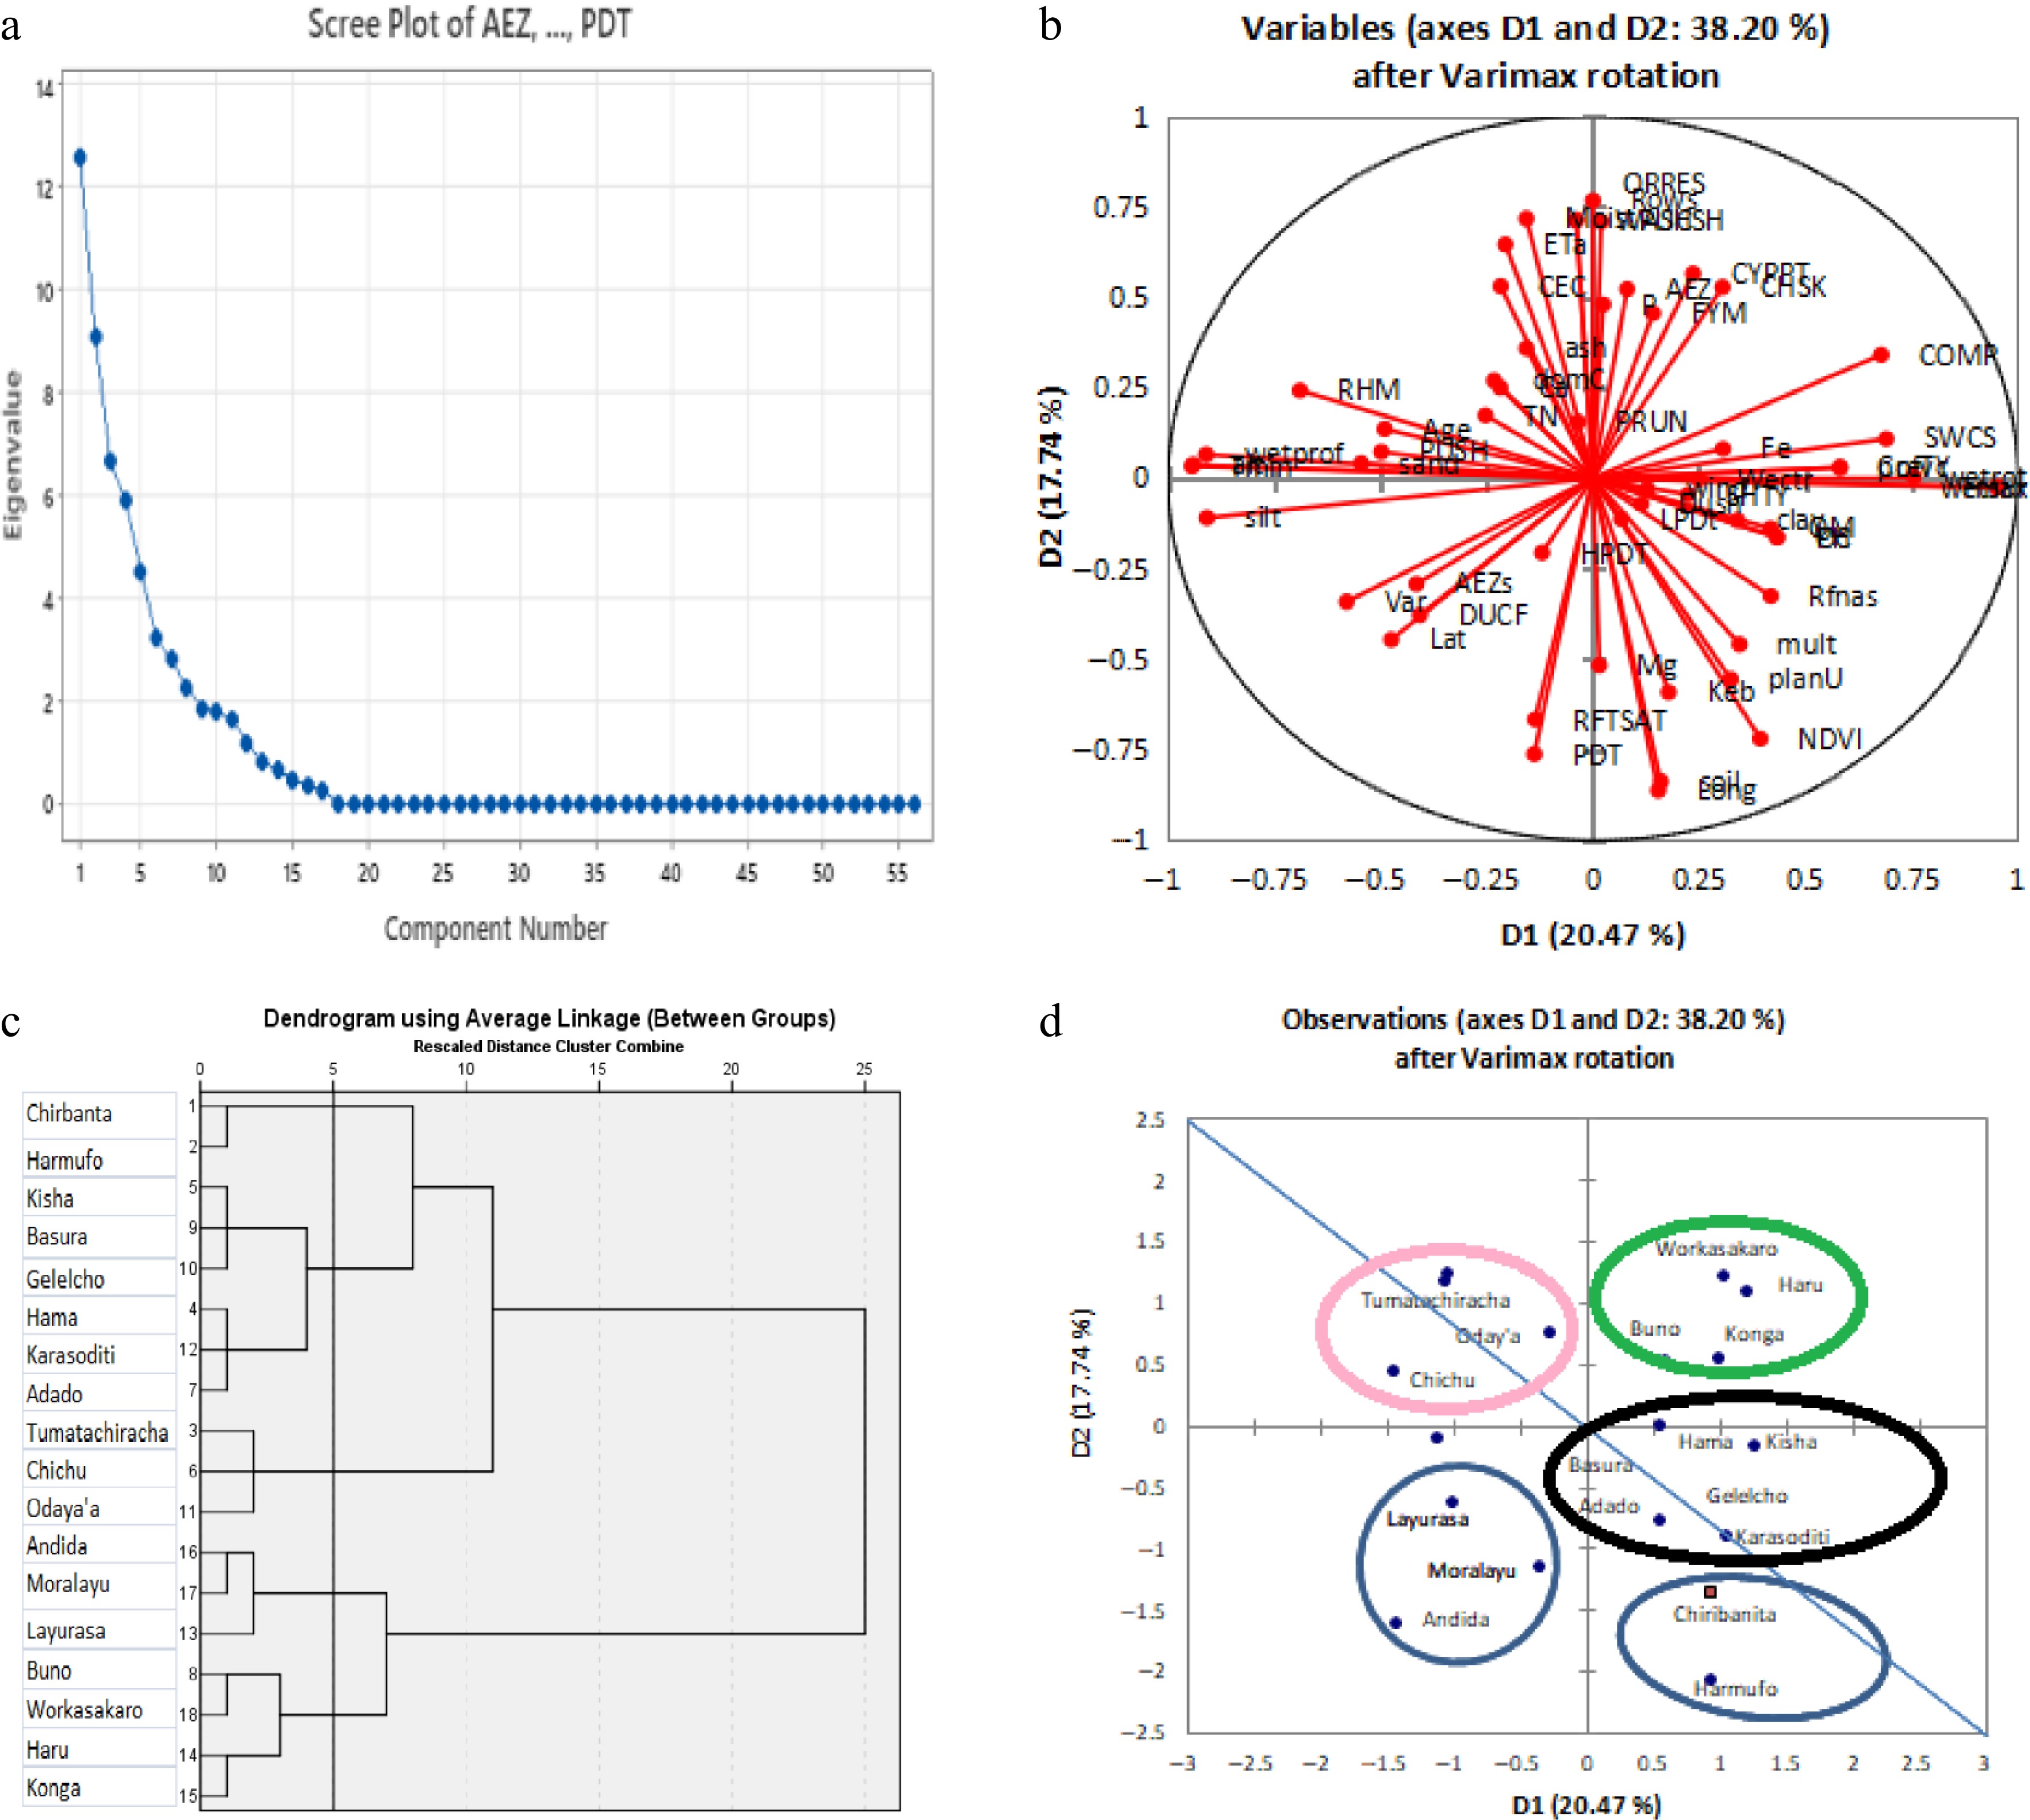
Figure 2.
(a) Scree plot. (b) Loading plot. (c) Dendrogram. (d) Score plot of observations across study areas.
-
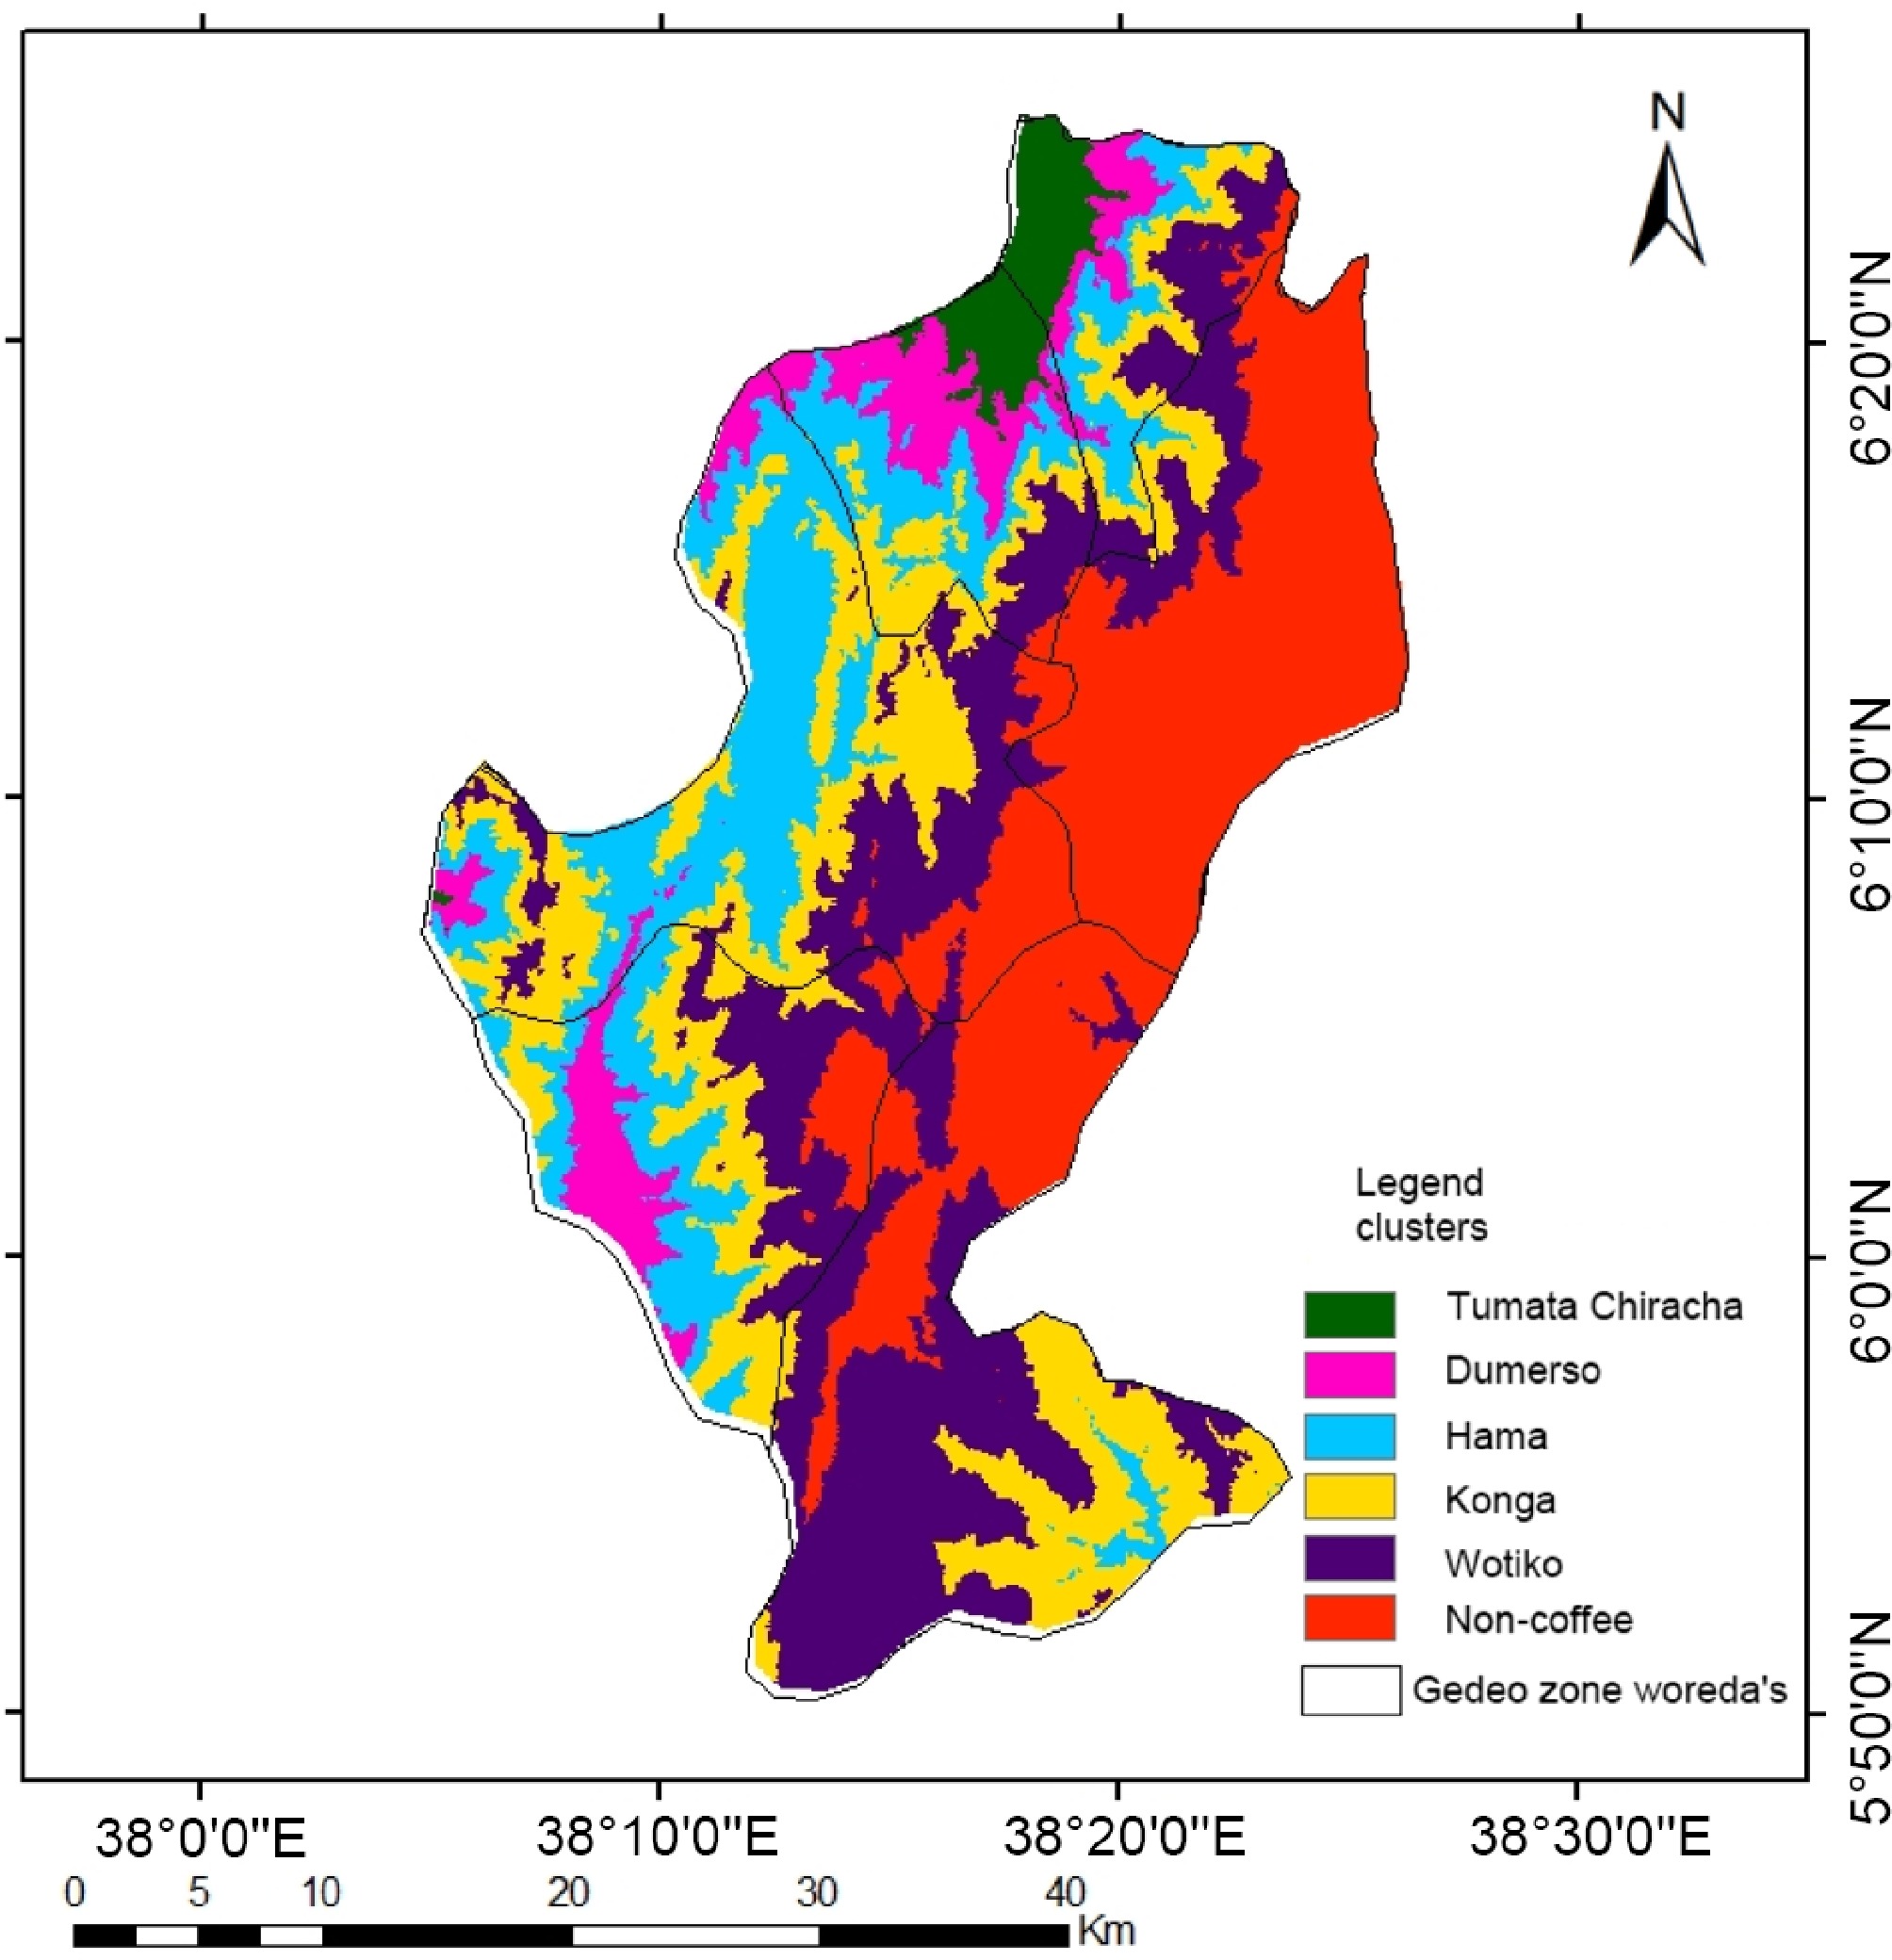
Figure 3.
Maps showing the clusters and those areas outside the coffee production areas.
-
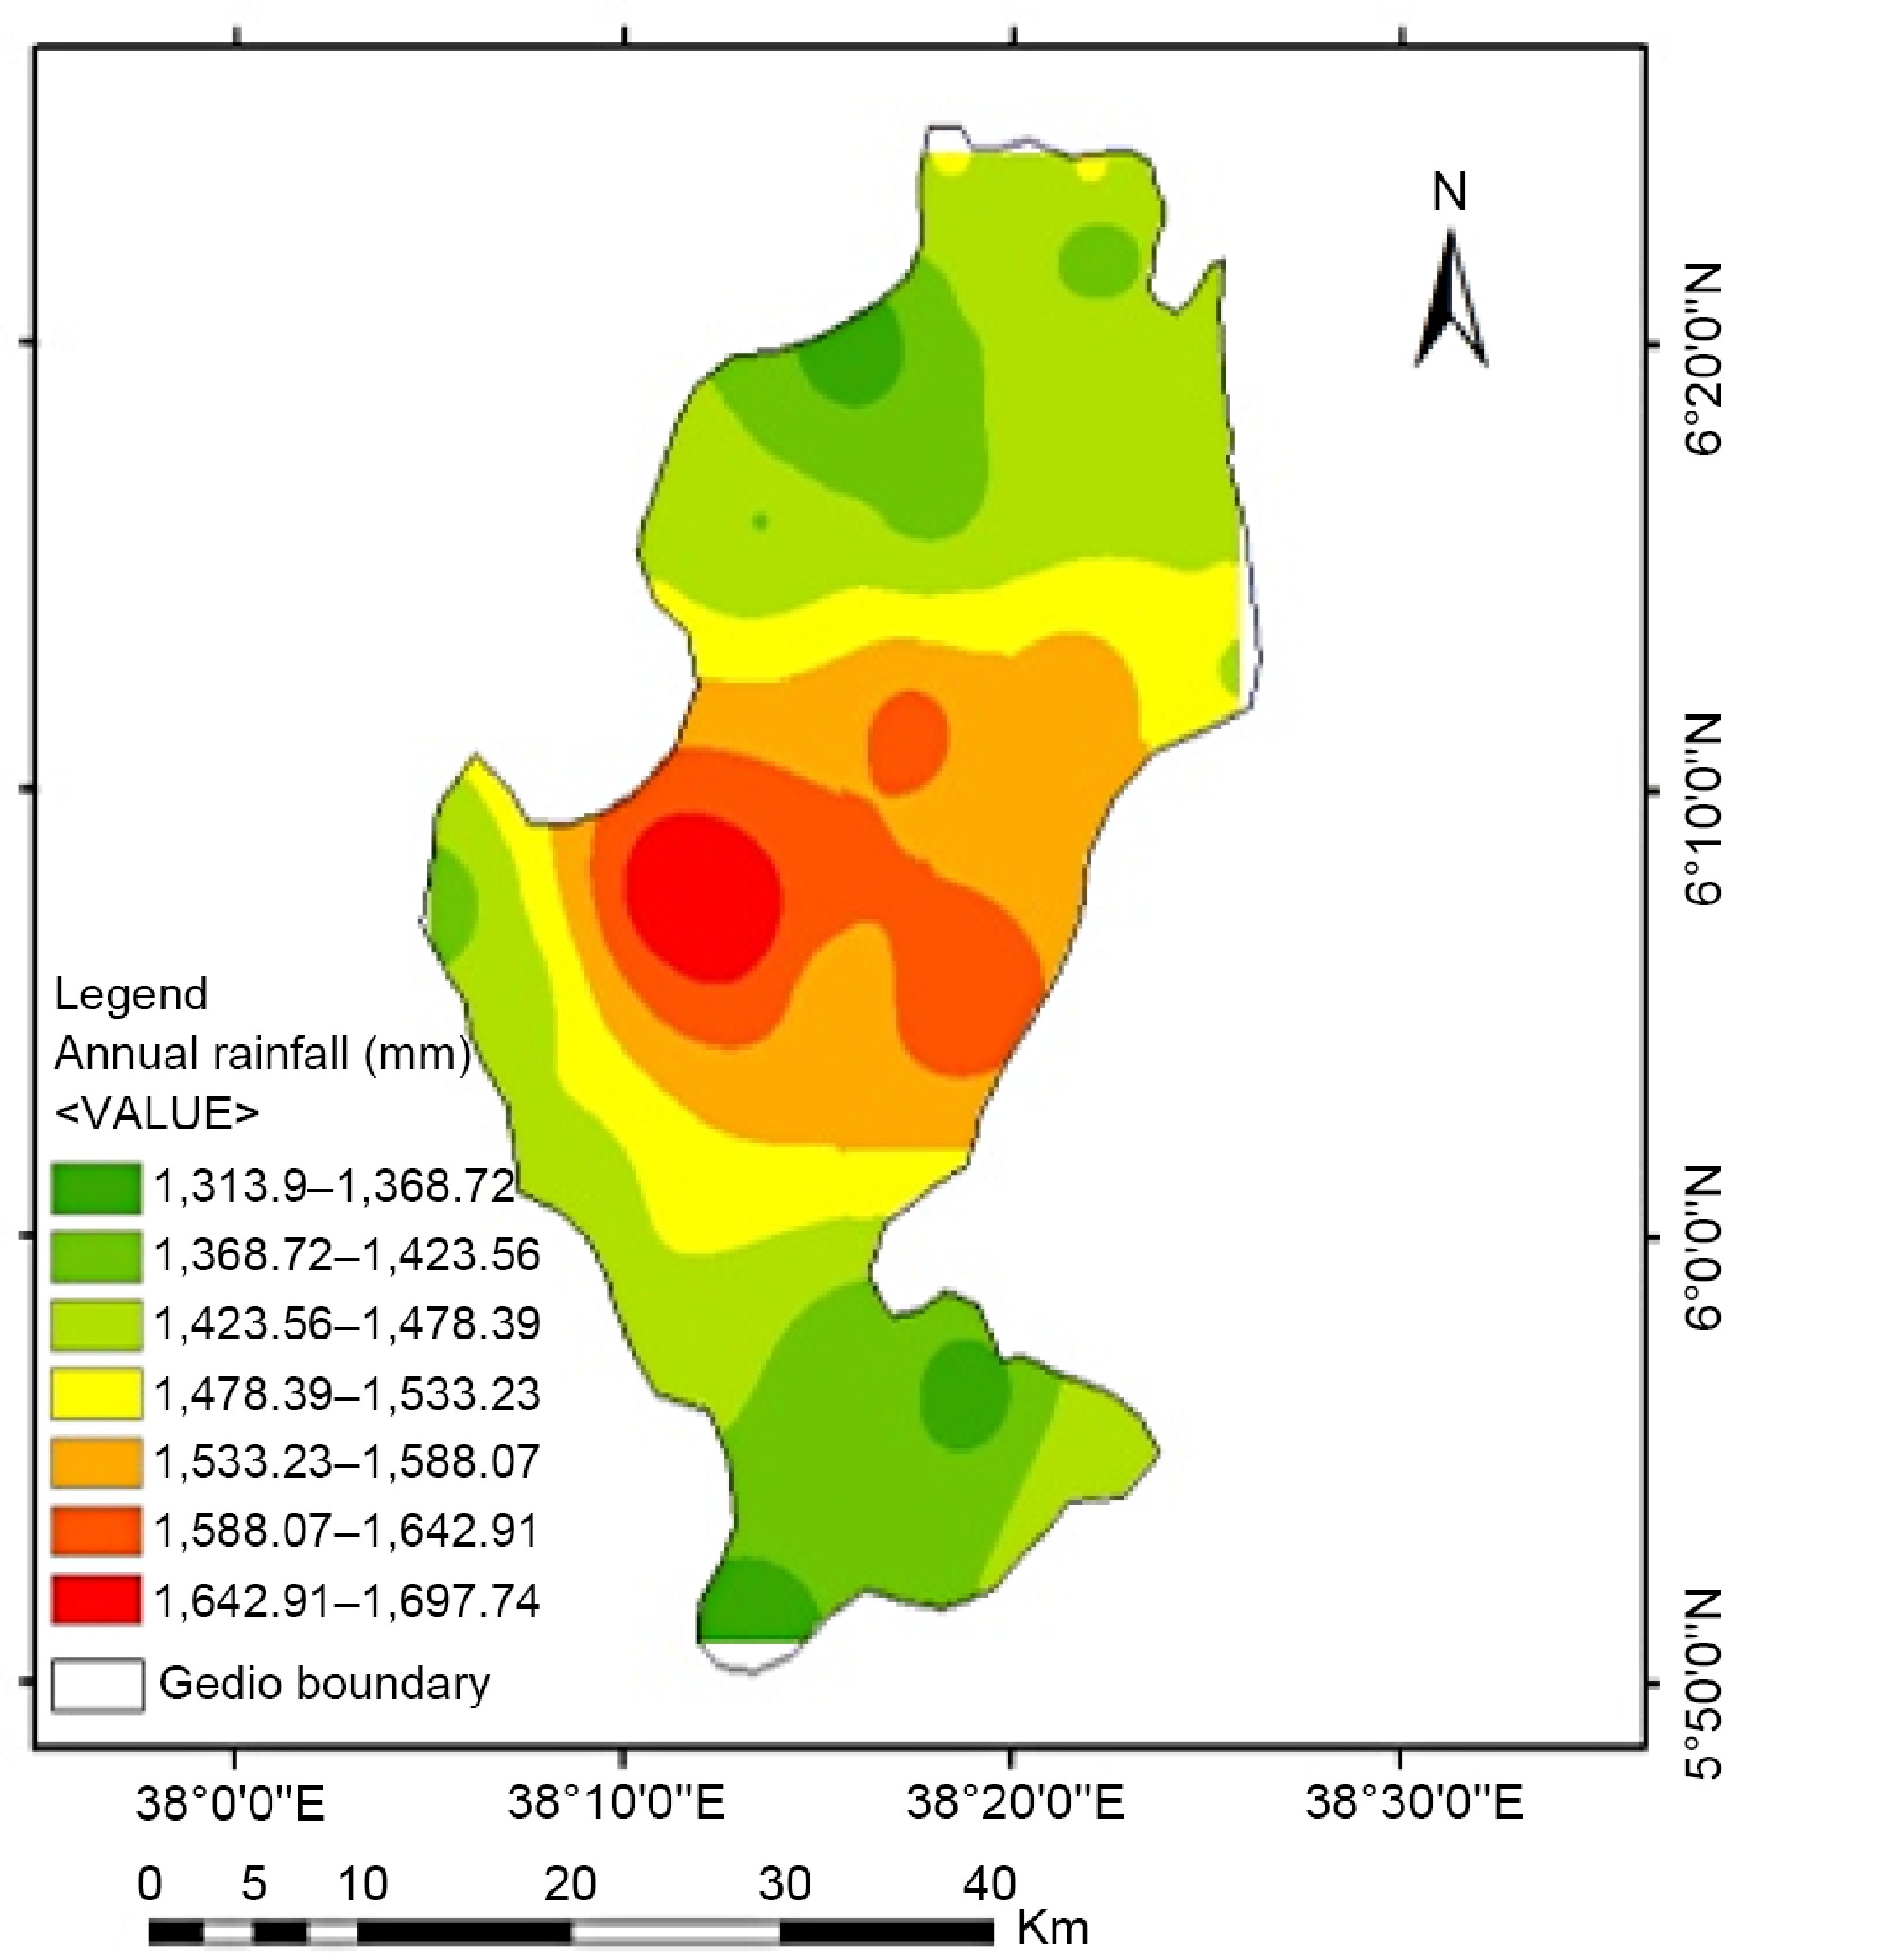
Figure 4.
Spatial distribution of total annual rainfall in the Gedeo Zone of southern Ethiopia.
-
Number District Village Altitude
(m a.s.l.)Latitude
(degrees)Longitude
(degrees)1 Yirgachefe Konga 1,902 6.12 38.21 2 Haru 1,946 6.13 38.19 3 Wonago Tumatachiracha 1,660 6.33 38.27 4 Karasodti 1,942 6.27 38.23 5 Wotiko 2,123 6.28 38.31 6 Dillazuria Odaya'a 1,586 6.35 38.32 7 Chichu 1740 6.36 38.32 8 Andida 2,345 6.28 38.3 9 Gedeb Workasakaro 2,100 5.94 38.31 10 Harmufo 2,192 6.21 38.21 11 Kochore Buno 1,760 6.02 38.14 12 Hama 1,880 6.04 38.17 13 Chorso Moralayu 2,553 6.09 38.31 14 Kisha 2,328 6.08 38.21 15 Raphe Chiribanita 2,322 6.19 38.29 16 Layurasa 2,464 6.21 38.36 17 Bule Adado 2,483 6.34 38.36 18 Basura 2,290 6.33 38.37 Table 1.
Sampling villages representing different agro-ecologies of coffee producing areas within districts of the Gedeo Zone, southern Ethiopia.
-
Measure Statistics Value Kaiser-Meyer-Olkin (KMO) 0.583 Bartlett's Test of Sphericity Approx. chi-square 1,690.1 df 1,596 Sig. 0.05 Table 2.
KMO and Bartlett's test.
-
Variables PC1 PC2 PC3 PC4 PC5 PC6 PC7 PC8 PC9 PC10 PC11 PC12 Soil water conservation 0.11 0.01 −0.37 −0.16 0.31 −0.25 0.38 0.16 0.47 0.30 −0.35 −0.06 NDVI −0.48 −0.17 −0.37 0.52 0.02 −0.06 −0.38 −0.10 0.27 0.29 −0.07 −0.11 Shade trees 0.22 −0.12 0.78 −0.37 −0.12 0.21 −0.17 −0.10 0.09 0.25 −0.12 0.05 Ash −0.31 0.11 0.04 −0.06 −0.47 0.56 0.10 0.55 0.00 0.10 0.08 −0.03 Evapotranspiration −0.09 −0.62 0.11 0.44 0.37 0.35 −0.24 −0.12 0.12 0.07 0.15 −0.11 Organic carbon −0.06 0.11 −0.20 −0.41 −0.10 0.44 −0.36 −0.39 −0.10 0.06 −0.11 0.38 Nitrogen −0.28 0.54 0.20 −0.59 0.35 −0.06 0.06 −0.16 0.08 0.04 0.12 −0.06 Iron −0.05 0.46 0.12 0.58 0.34 −0.16 −0.20 −0.40 0.18 0.02 −0.16 0.03 Altitude 0.16 0.02 −0.45 0.14 0.57 −0.19 −0.30 −0.07 −0.39 −0.06 −0.18 0.18 Variety −0.38 0.10 −0.19 −0.53 0.37 0.16 −0.04 −0.28 0.12 −0.21 −0.33 −0.18 Clay 0.14 0.28 −0.33 −0.18 −0.39 0.20 −0.46 −0.25 0.17 −0.25 0.14 −0.39 Cation exchange capacity −0.52 0.42 0.05 −0.54 0.20 −0.07 0.21 −0.15 0.00 0.18 0.17 0.08 * Values in bold were different from 0 with a significance level alpha = 0.05. Table 3.
Correlation component matrix of coffee fields in the Gedeo Zone of southern Ethiopia.
-
Principal component Initial eigenvalues Extraction sums of
squared loadingsTotal % of Variance Cumulative % Total % of Variance Cumulative % 1 12.58 22.46 22.46 12.58 22.46 22.46 2 9.02 16.11 38.56 9.02 16.11 38.56 3 6.65 11.88 50.44 6.65 11.88 50.44 4 5.89 10.51 60.95 5.89 10.51 60.95 5 4.53 8.09 69.04 4.53 8.09 69.04 6 3.25 5.81 74.85 3.25 5.81 74.85 7 2.82 5.04 79.89 2.82 5.04 79.89 8 2.25 4.02 83.91 2.25 4.02 83.91 9 1.86 3.32 87.23 1.86 3.32 87.23 10 1.79 3.19 90.42 1.79 3.19 90.42 11 1.65 2.94 93.36 1.65 2.94 93.36 12 1.17 2.09 95.44 1.17 2.09 95.44 Table 4.
Total variance explained in the dataset after principal component analysis.
-
Clusters Konga Tumatachiracha Dumerso Hama Wotiko Konga 0 206,177.10 181,089.00 80,932.50 429,054.70 Tumatachiracha 0 0 288,700.40 29,212.50 894,814.60 Dumerso 0 0 0 191,136.90 187,526.10 Hama 0 0 0 0 659,241.40 Wotiko 0 0 0 0 0 Table 5.
Euclidean distance showing proximity matrix among clusters.
-
Konga Information (proportion %) Tmin (°C) Tmax (°C) RHM (%) Wind (m/s) ETa (mm/month) Rainfall (mm) NDVI (%) Konga 1.23 (22%) 13.70 25.30 68.80 1.40 29.40 1,407.10 0.71 Tumatachiracha 0.95 (17%) 15.80 27.10 66.20 1.60 30.60 1,340.70 0.77 Wotiko 0.95 (17%) 15.10 26.50 67.20 1.50 26.30 1,307.20 0.67 Hama 1.48 (33%) 14.80 26.20 67.50 1.60 28.00 1,302.30 0.69 Dumerso 0.62 (11%) 14.30 25.30 69.00 1.40 26.30 1,468.90 0.69 Mean 5.60(100%) 14.70 26.10 67.70 1.50 28.10 1,365.20 0.71 Table 6.
Mean of NDVI, ETa, and climatic variables across clusters.
-
Coffee clusters Total N (%) Rating Total C (%) Rating pH Rating Fe (mg/kg) Rating Tumata Chiracha 0.18−0.29 Low 1.77−3.91 Medium 6.00−7.00 Neutral 3.5−4.50 Deficient Hama > 0.40 High 3.93−5.7 Medium 7.10−7.70 Neutral < 3.50 Deficient Dumerso 0 < 0.18 Very low < 1.77 Low > 8.00 Strongly alkaline 4.6−7.40 Marginal Konga 0.30−0.35 Optimum 1.77−4.52 Medium 5.40−6.40 Moderate acidic 7.5−9.90 Marginal Wotiko 0.30−0.40 Optimum 5.17−5.26 Medium < 5.40 Strongly acidic > 10.0 Sufficient I Clusters P (mg/kg soil) Rating CEC (mg/kg soil) Rating Ca (mg/kg soil) Rating Mg (meq/100 g) Rating Tumata Chiracha 14.0−16.0 Low 25.10−30.0 Optimum 15.0−17.0 High 4.6−7.30 High Hama 12.0−14.0 Very low 30.10−35.0 Optimum 17.0−19.0 High > 7.40 Very high Dumerso 10.1−12.0 Very low > 35.0 High > 19.10 Very high 4.6−7.3 High Konga 8.0−10.0 Very low 20.10−25.0 Minimum 11.0−15.0 High 4.6−7.3 High Wotiko < 8.00 Very low < 20.00 Minimum < 11.0 Moderate < 4.50 Moderate Table 7.
Means for the soil parameters from the five coffee clusters of Gedeo, southern Ethiopia.
-
Clusters P:N C:N Rating Mg:Ca Range Mean Range Mean Range Mean Tumata Chiracha 55.20−77.80 64.60 9.8 0−13.80 11.80 Above critical 0.31−0.43 0.37 Hama 30.0−35.0 32.30 9.80−14.30 12.0 Above critical 0.39−0.44 0.41 Dumerso 56.10−66.70 60.90 9.80 9.80 Below critical 0.24−0.38 0.31 Konga 26.7−28.60 27.60 5.90−12.9 9.40 Below critical 0.42−0.49 0.45 Wotiko 20.0−26.70 22.90 13.20−17.20 15.20 Above critical 0.42 0.41 Table 8.
Nutrient ratios of P:N, C:N, and Mg:Ca in the coffee fields.
-
Clusters Area (ha) Area (%) Tumata Chiracha 4,057.41 3.00 Dumerso 9,467.29 7.00 Konga 22,992.0 17.00 Wotiko 30,106.80 22.26 Hama 32,106.80 23.74 Non-coffee cluster 36,516.70 27.00 Total cover 135,247 100.00 Table 9.
The areal proportion of coffee and non-coffee clusters in the Gedeo Zone of southern Ethiopia.
-
Variables Konga Tumata chiracha Dumerso Hama Wotiko Clay (%) 24.70−42.60 42.0−60.0 18.00−43.0 24.00−42.00 26.00−44.0 ETa (mm/month) 27.30−31.40 28.60−32.70 24.30−28.40 25.90−30.10 23.60−27.70 NDVI 0.66−0.75 0.73−0.82 0.65−0.73 0.65−0.73 0.61−0.70 Dominant crop Coffee Enset Enset Coffee Enset Previous land use Coffee Grassland Grassland Enset Enset Shade trees Cordia spp., Ficus spp., Milletia spp. Avocado,
Milletia spp.Cordia spp. Ficus spp. Avocado, Eucalyptus Erythrina spp. Croton spp. Cordia spp. Milltia spp. Milltia spp. Croton sp., Erythrina spp. Avocado Variety Improved, local Improved Improved Improved, local Improved, local Number of coffee plants under shade tree 3.90−6.20 2.90–5.20 2.40–4.70 1.90–4.20 1.00–3.20 Number of plants under coffee shade 10.90–15.60 8.90−13.60 2.90–7.60 6.90–10.60 2.80–7.60 Intercrops Enset, taro Enset, potato, Sweet potato, common bean, cassava Taro, enset, spices, sugarcane Enset, sugarcane Enset, cabbage, taro Wood ash (kg/plant) 2.90–5.40 3.90–6.40 1.10−3.40 1.00−3.30 1.20−3.50 Number of multistory 2.90−4.80 2.90–4.80 1.90–3.80 3.90–5.80 1.90–3.80 SWC (%) 58.9–67.10 38.90–47.10 48.90–57.10 48.90–57.20 48.90–57.10 Coffee yield (kg/plant) 0.81−1.23 0.43−0.73 0.71−1.11 0.56−0.84 0.64−0.92 Overall quality ratings* 5 3 4 4 4 * 5 = best, 4 = very good, 3 = good, 2 = poor, 1 = very poor. Table 10.
Cluster mean of coffee management practices recorded after farmers' interview (n = 54).
Figures
(4)
Tables
(10)