-
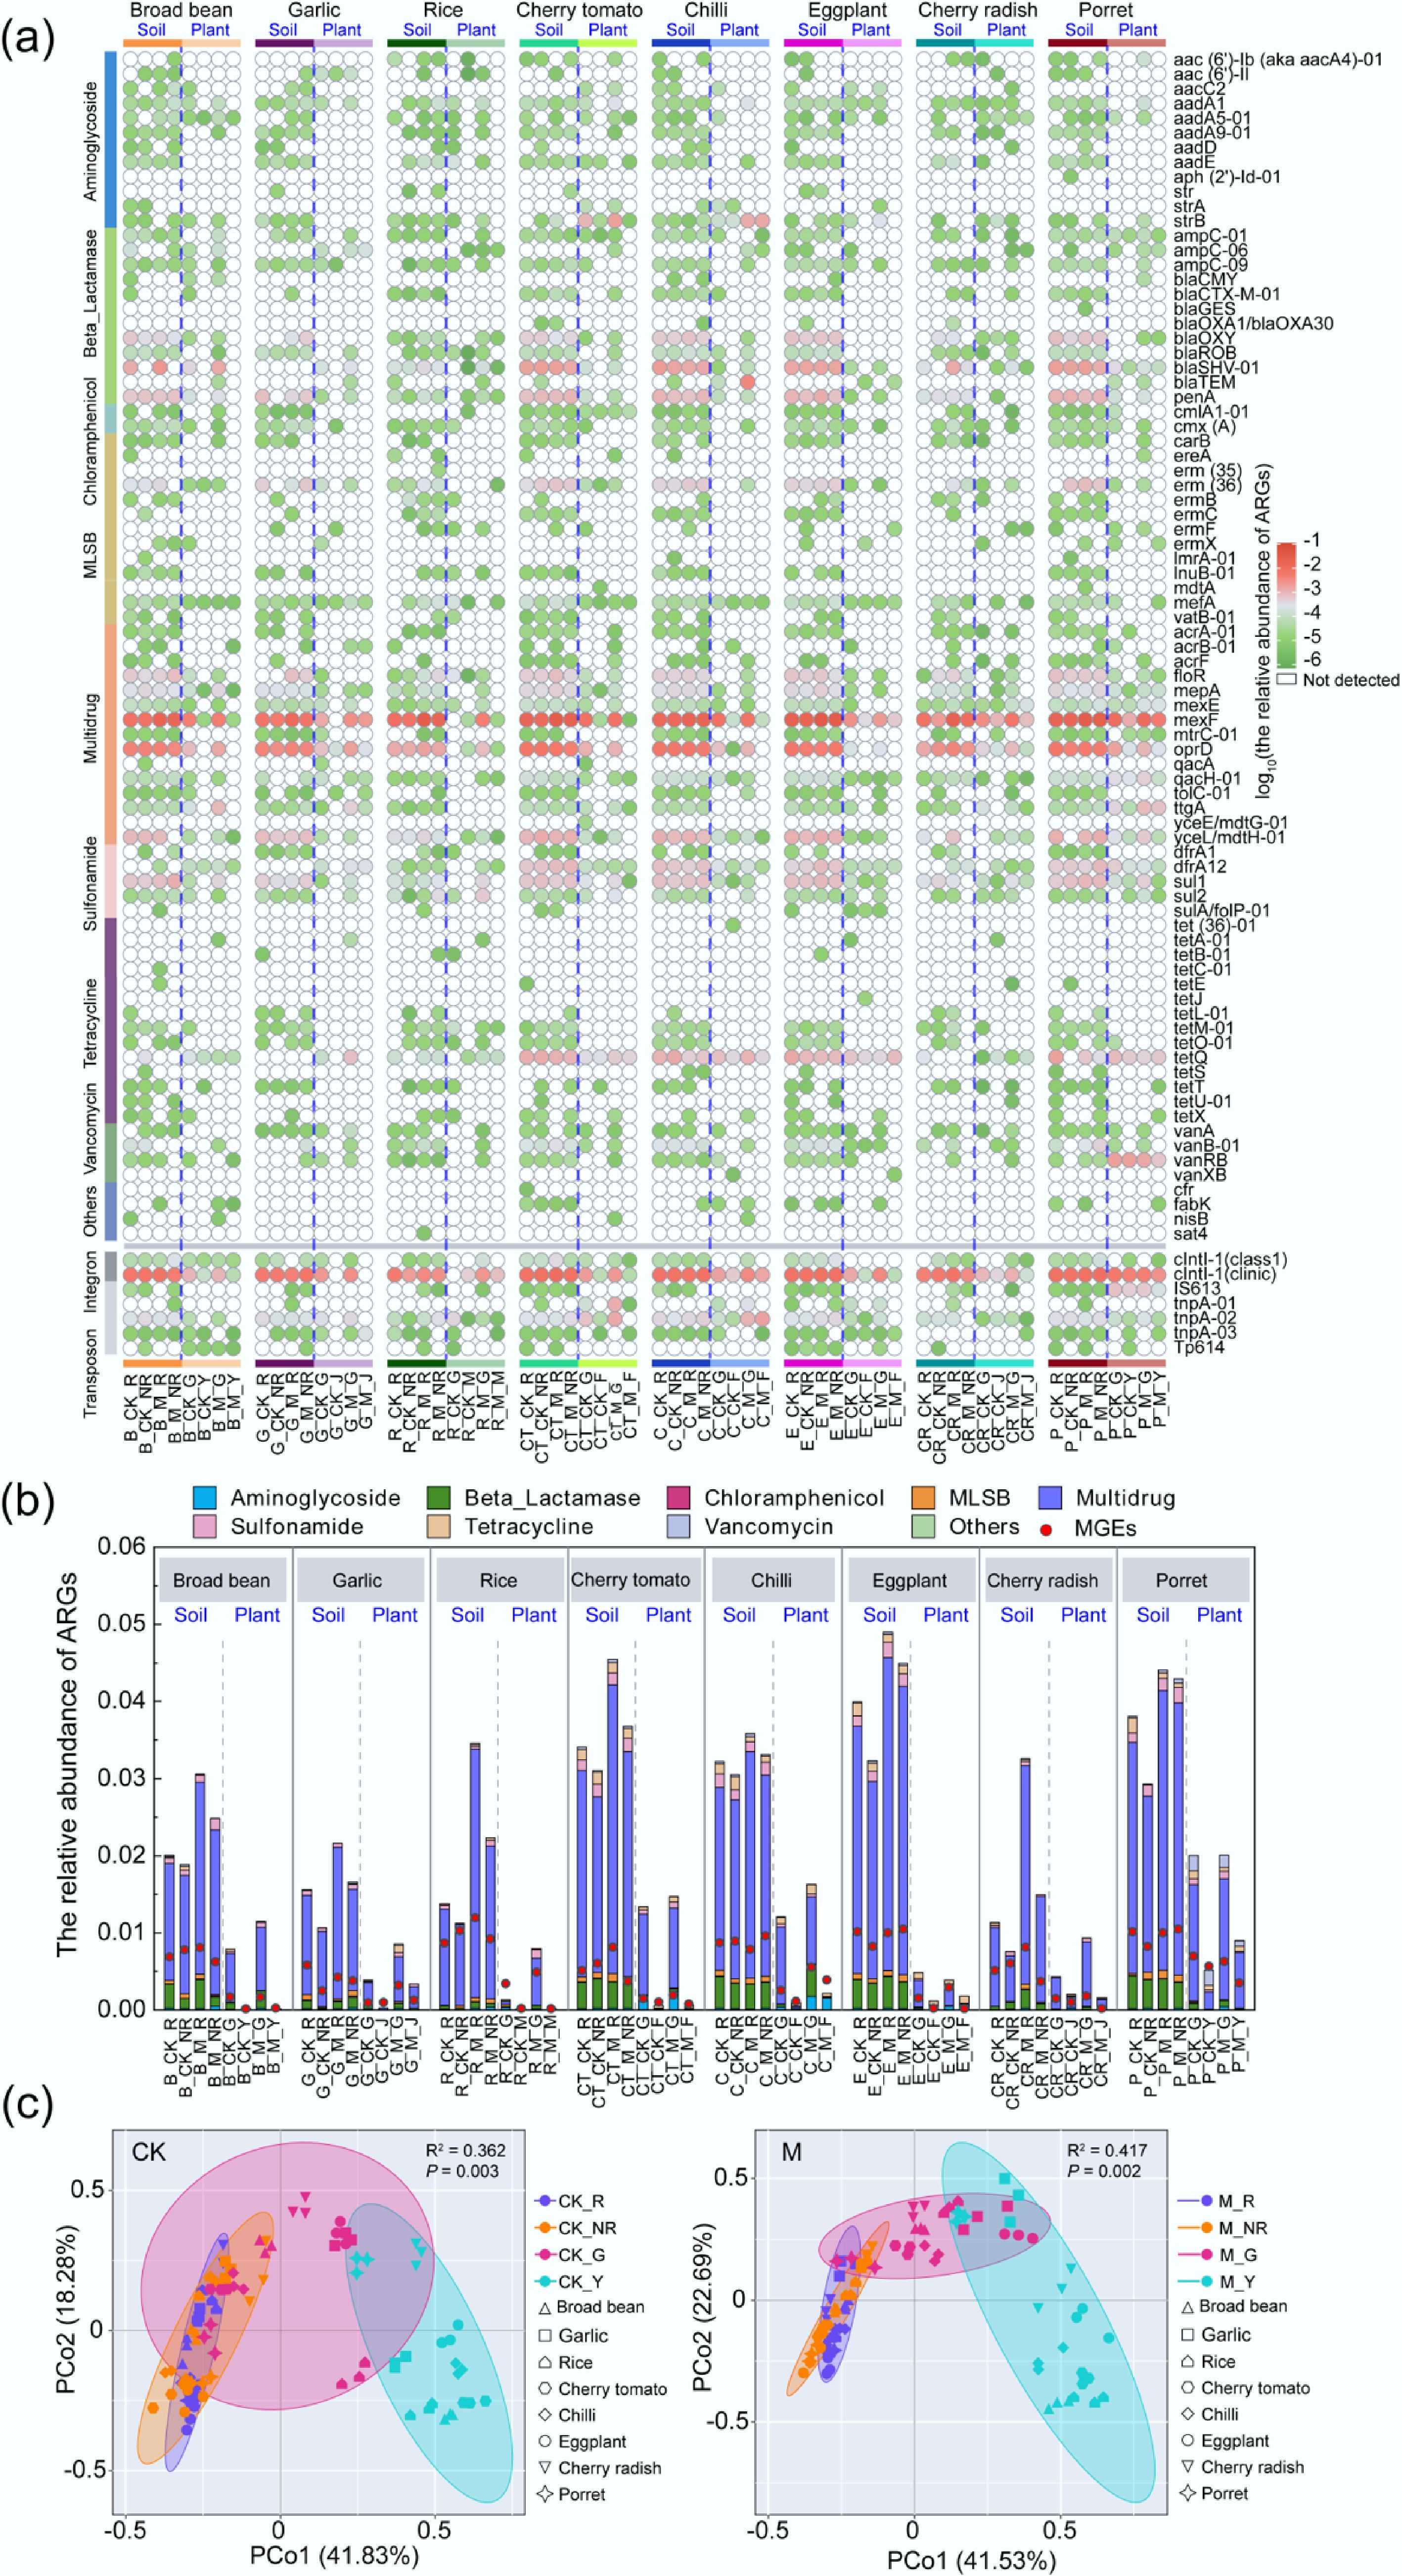
Figure 1.
Distribution of ARGs in the soil-plant system of different plants. (a) Detection of ARGs in all samples. (b) Relative abundance of ARGs in all samples. (c) Distribution of ARGs in all samples. (B, broad bean; G, garlic; R, rice; CT, cherry tomato; C, chilli; E, eggplant; CR, cherry radish; P, porret; CK, treatments without fertilizer; M, application of manure treatments; R, rhizosphere soils; NR, non-rhizosphere soils; G, plant roots; Y or J or F or M, edible parts of plants).
-

Figure 2.
Detected number and abundance of shared ARGs in rhizosphere, non-rhizosphere soil, plant roots, and edible part samples of different crops. The columns represent the number of detected ARGs, and the data in the heatmap represent the abundance of ARGs. (a) Broad bean, (b) garlic, (c) rice, (d) cherry tomato, (e) chilli, (f) eggplant, (g) cherry radish, (h) porret. Refer to Fig. 1 for abbreviations.
-

Figure 3.
(a) ARG spread through the roots and edible parts of the plant, and the migration rate from the roots to the edible parts. (b) Distribution of ARGs in non-rhizosphere soil, plant roots, and aboveground part samples. (c) Distribution of MGEs in non-rhizosphere soil, plant roots, and aboveground part samples. (d) Regression analysis of cIntI-1(clinic) and ARGs (n = 32), with a 95% confidence interval. Refer to Fig. 1 for abbreviations.
-
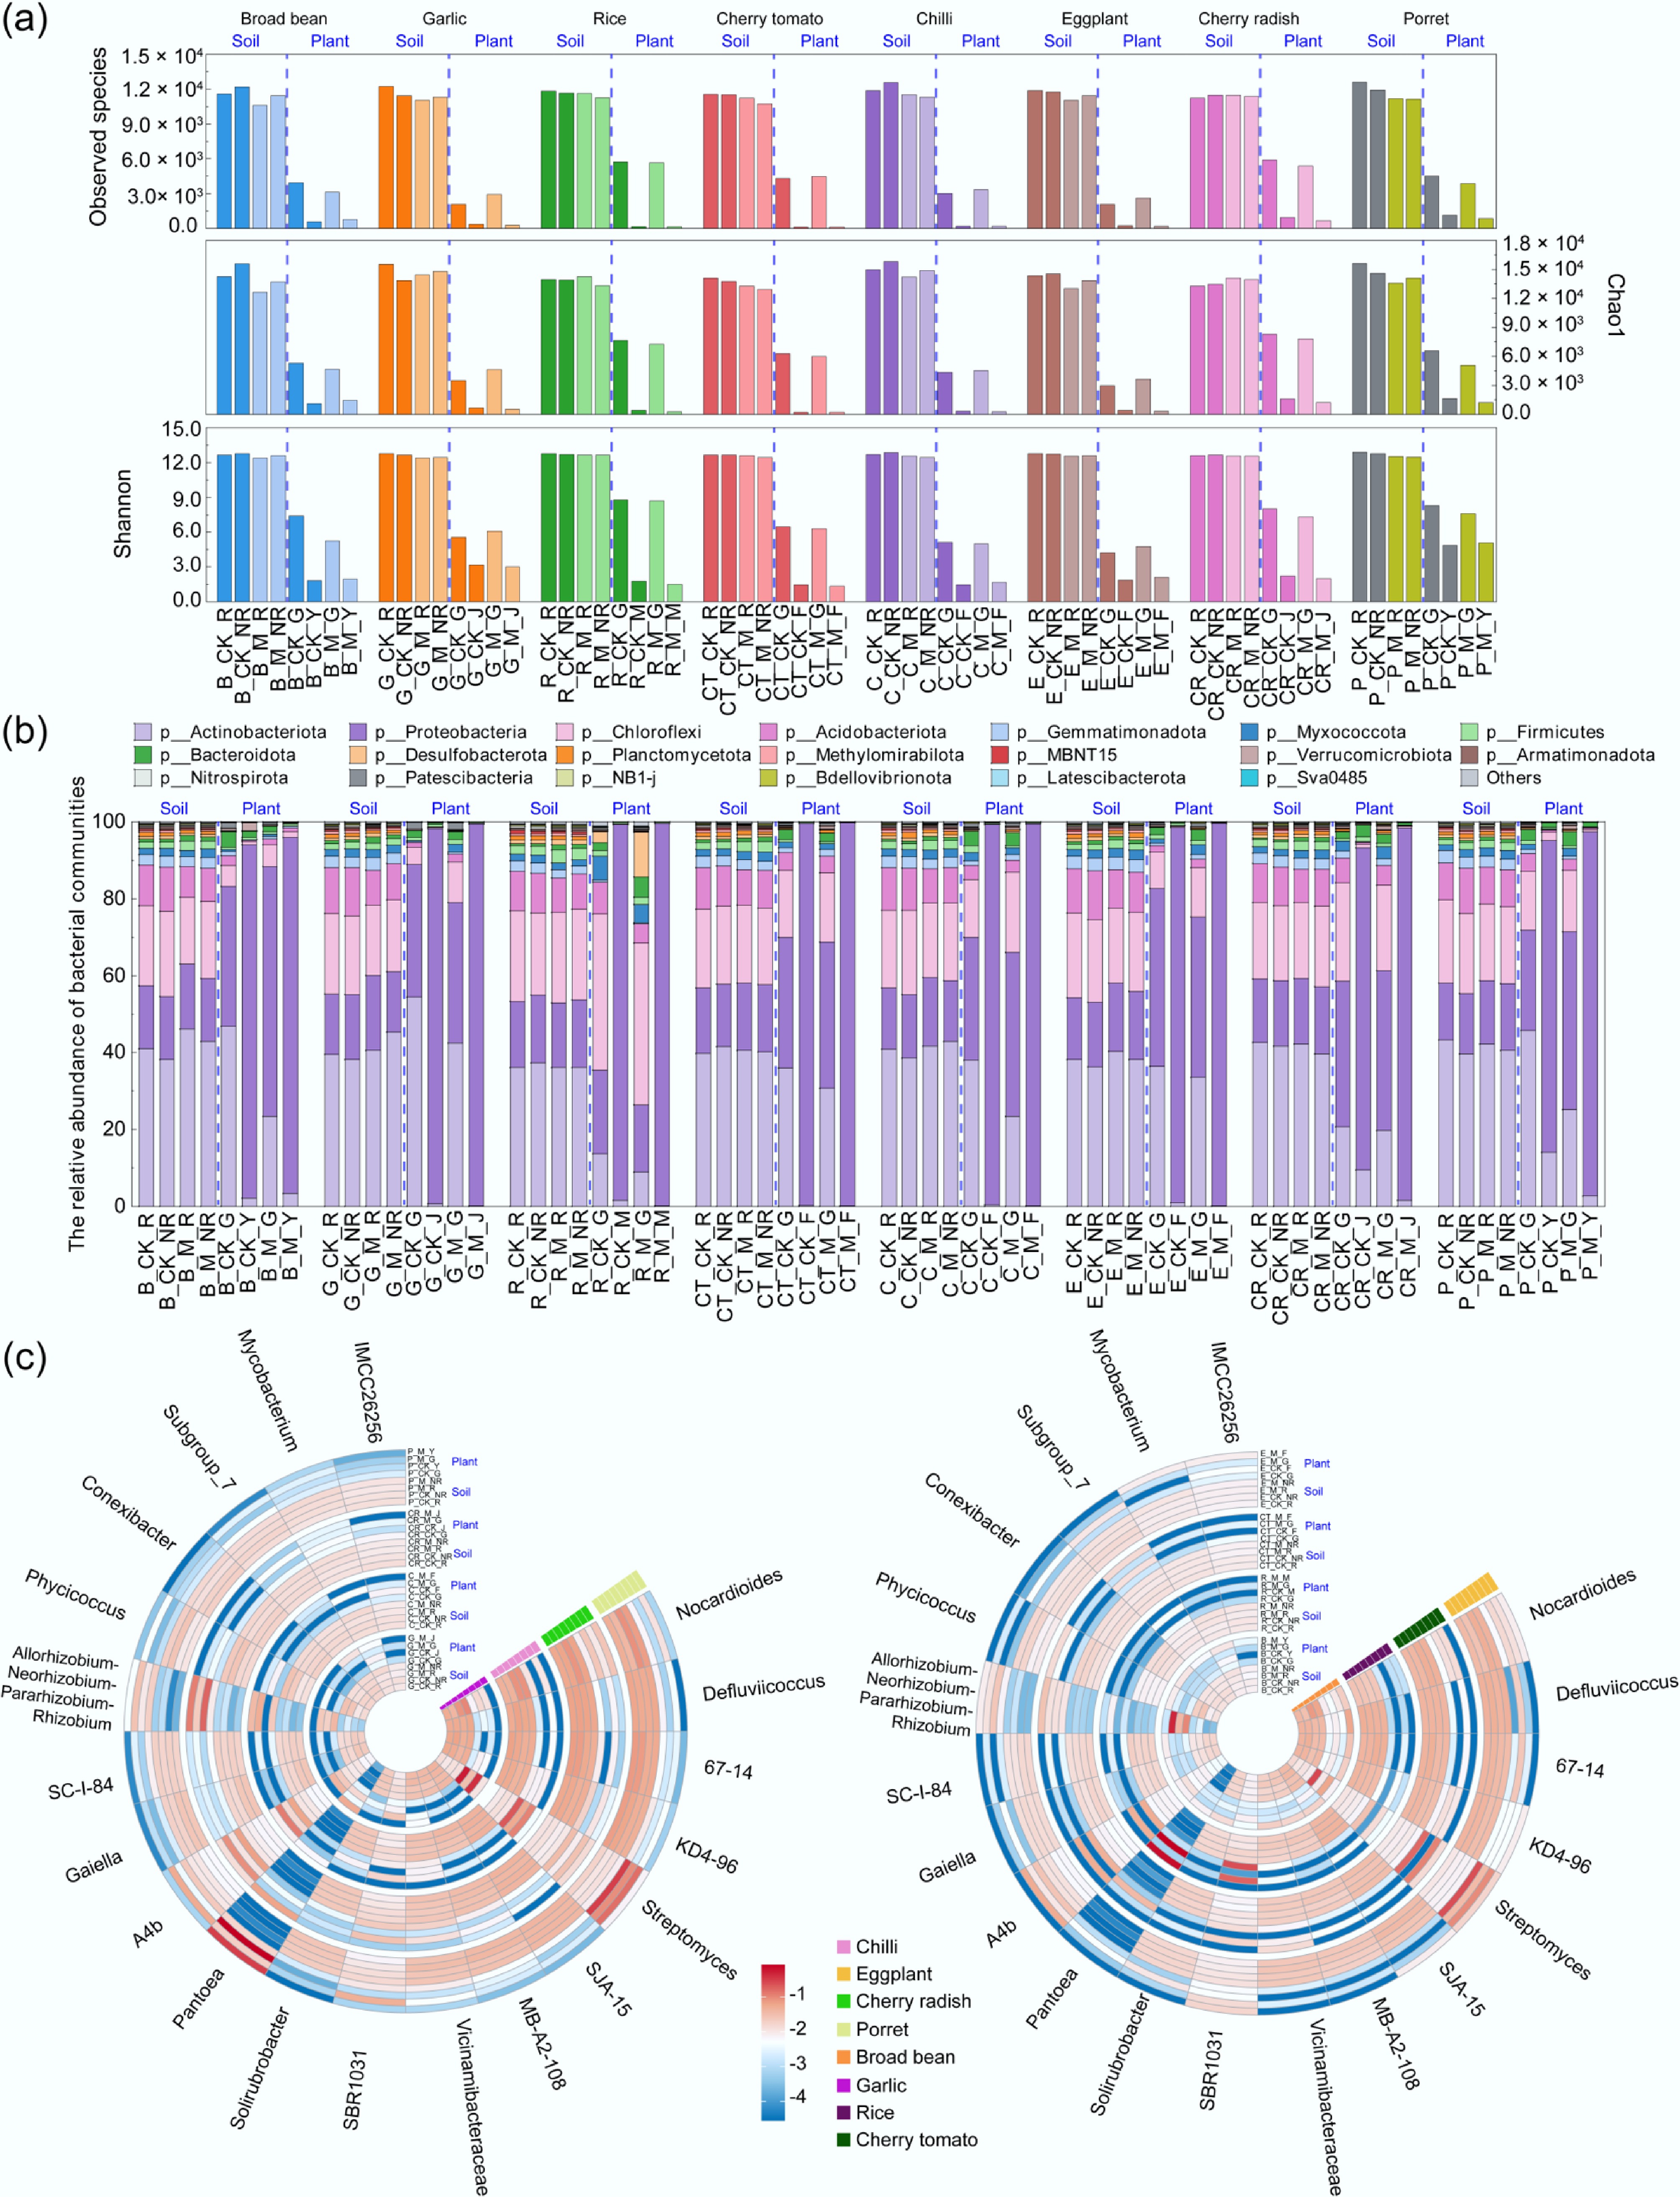
Figure 4.
Relative abundance of the dominant bacterial taxa at the phylum and genus levels (top 20). (a) Alpha diversity of bacterial communities in samples. (b) Proportion of bacterial communities at the phylum level. (c) Heatmap of bacterial communities at the genus level. Refer to Fig. 1 for abbreviations.
-
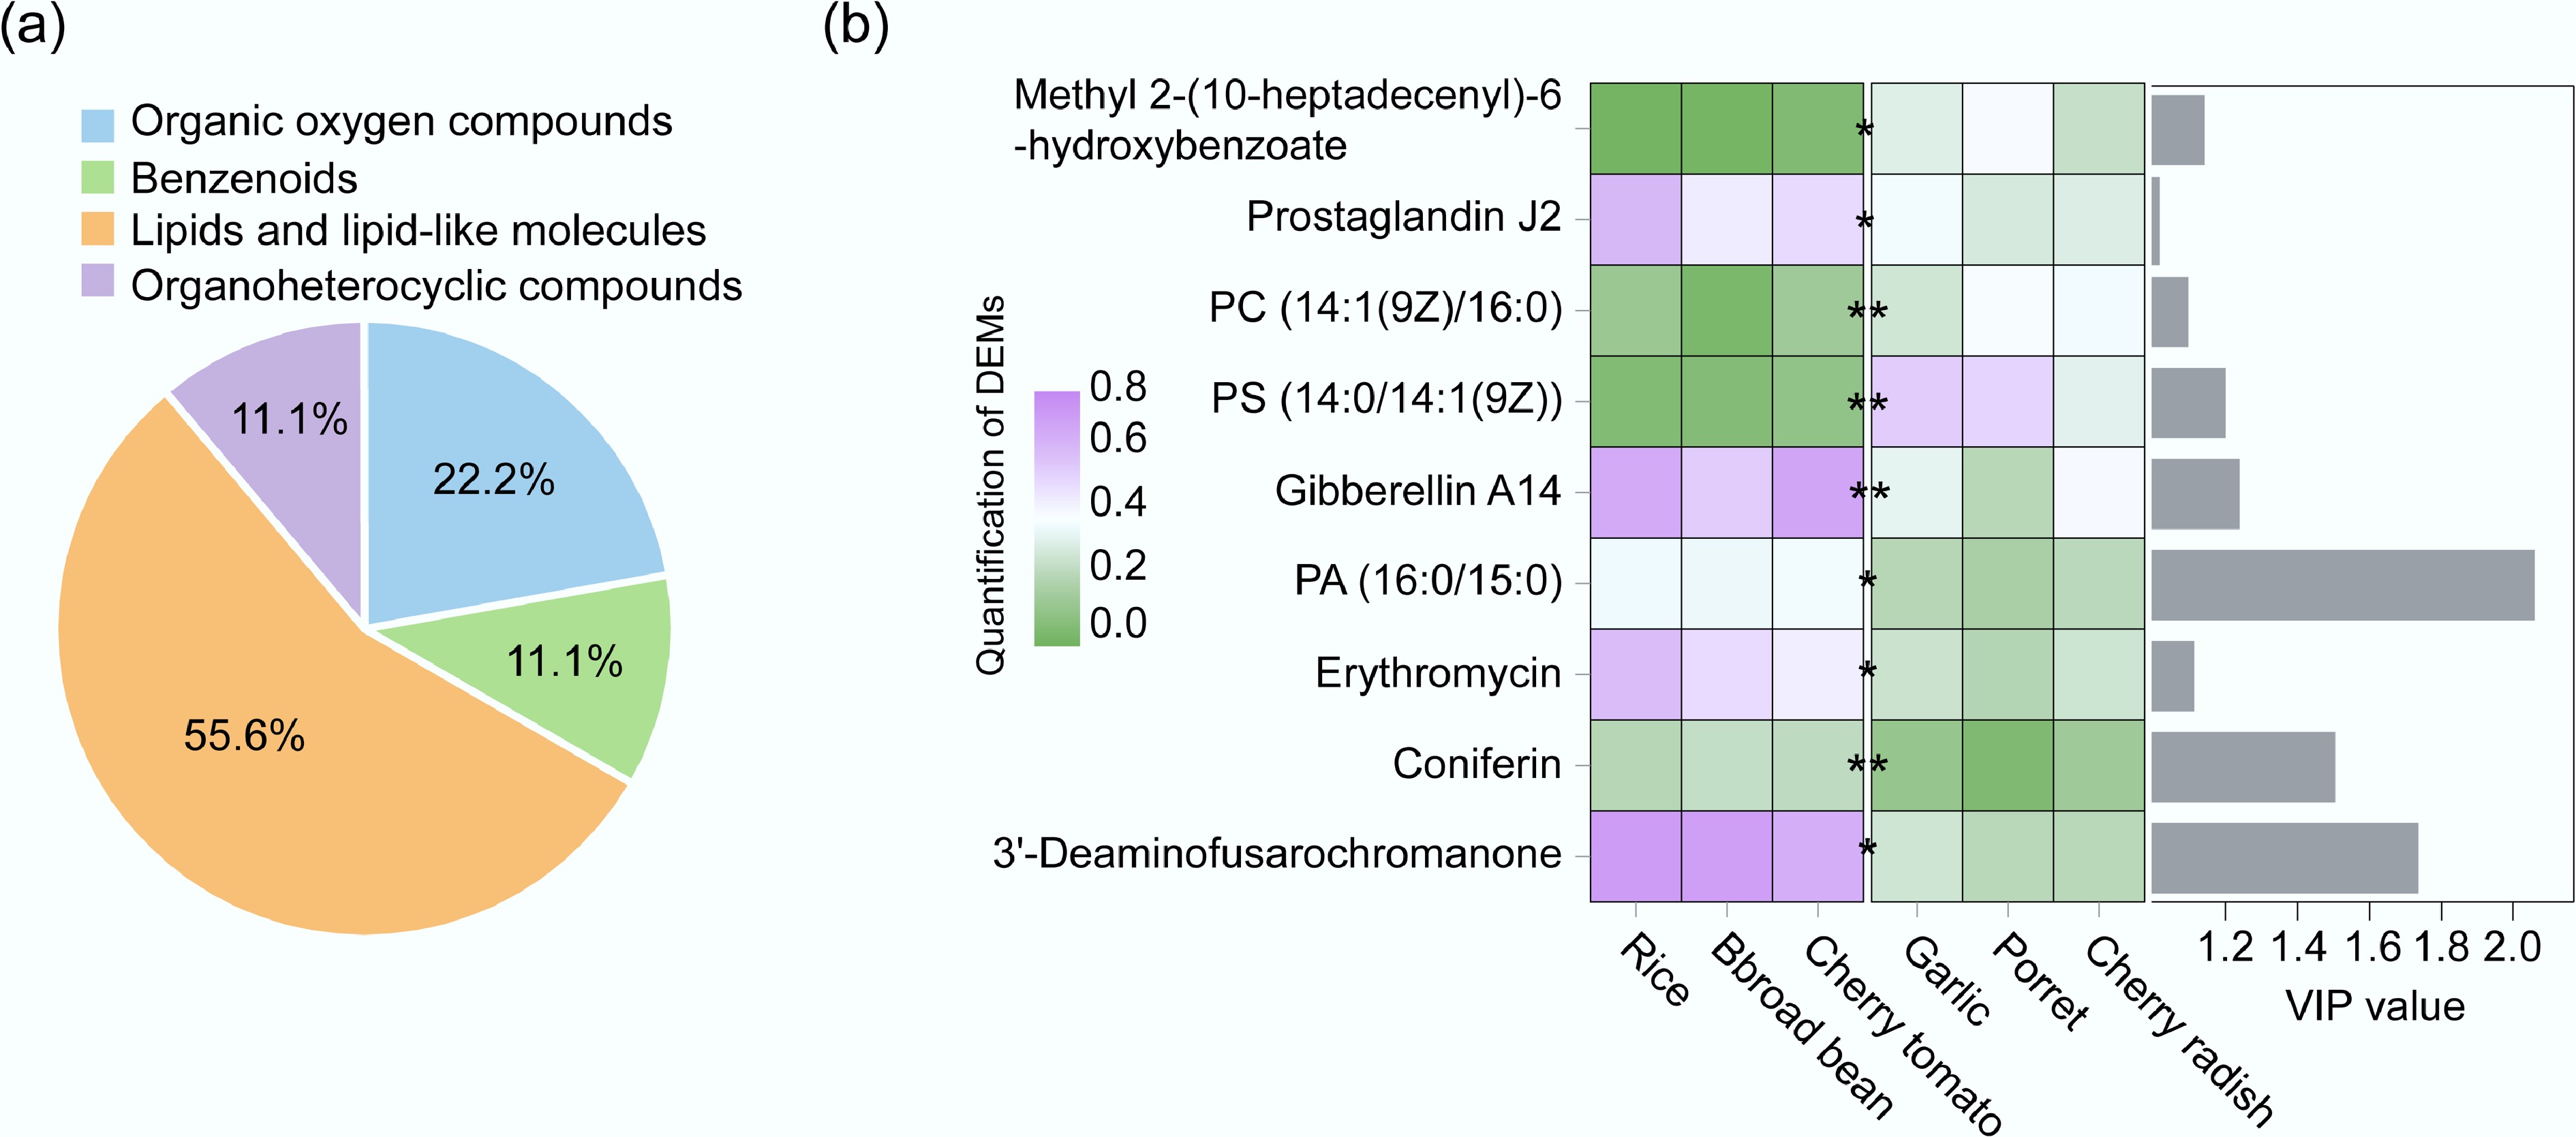
Figure 5.
(a) Percentage of DEMs in the high abundance crop group and the low abundance group in ARGs. (b) Content and VIP values of DEMs in the ARGs high-abundance crop group and low-abundance crop group.
-
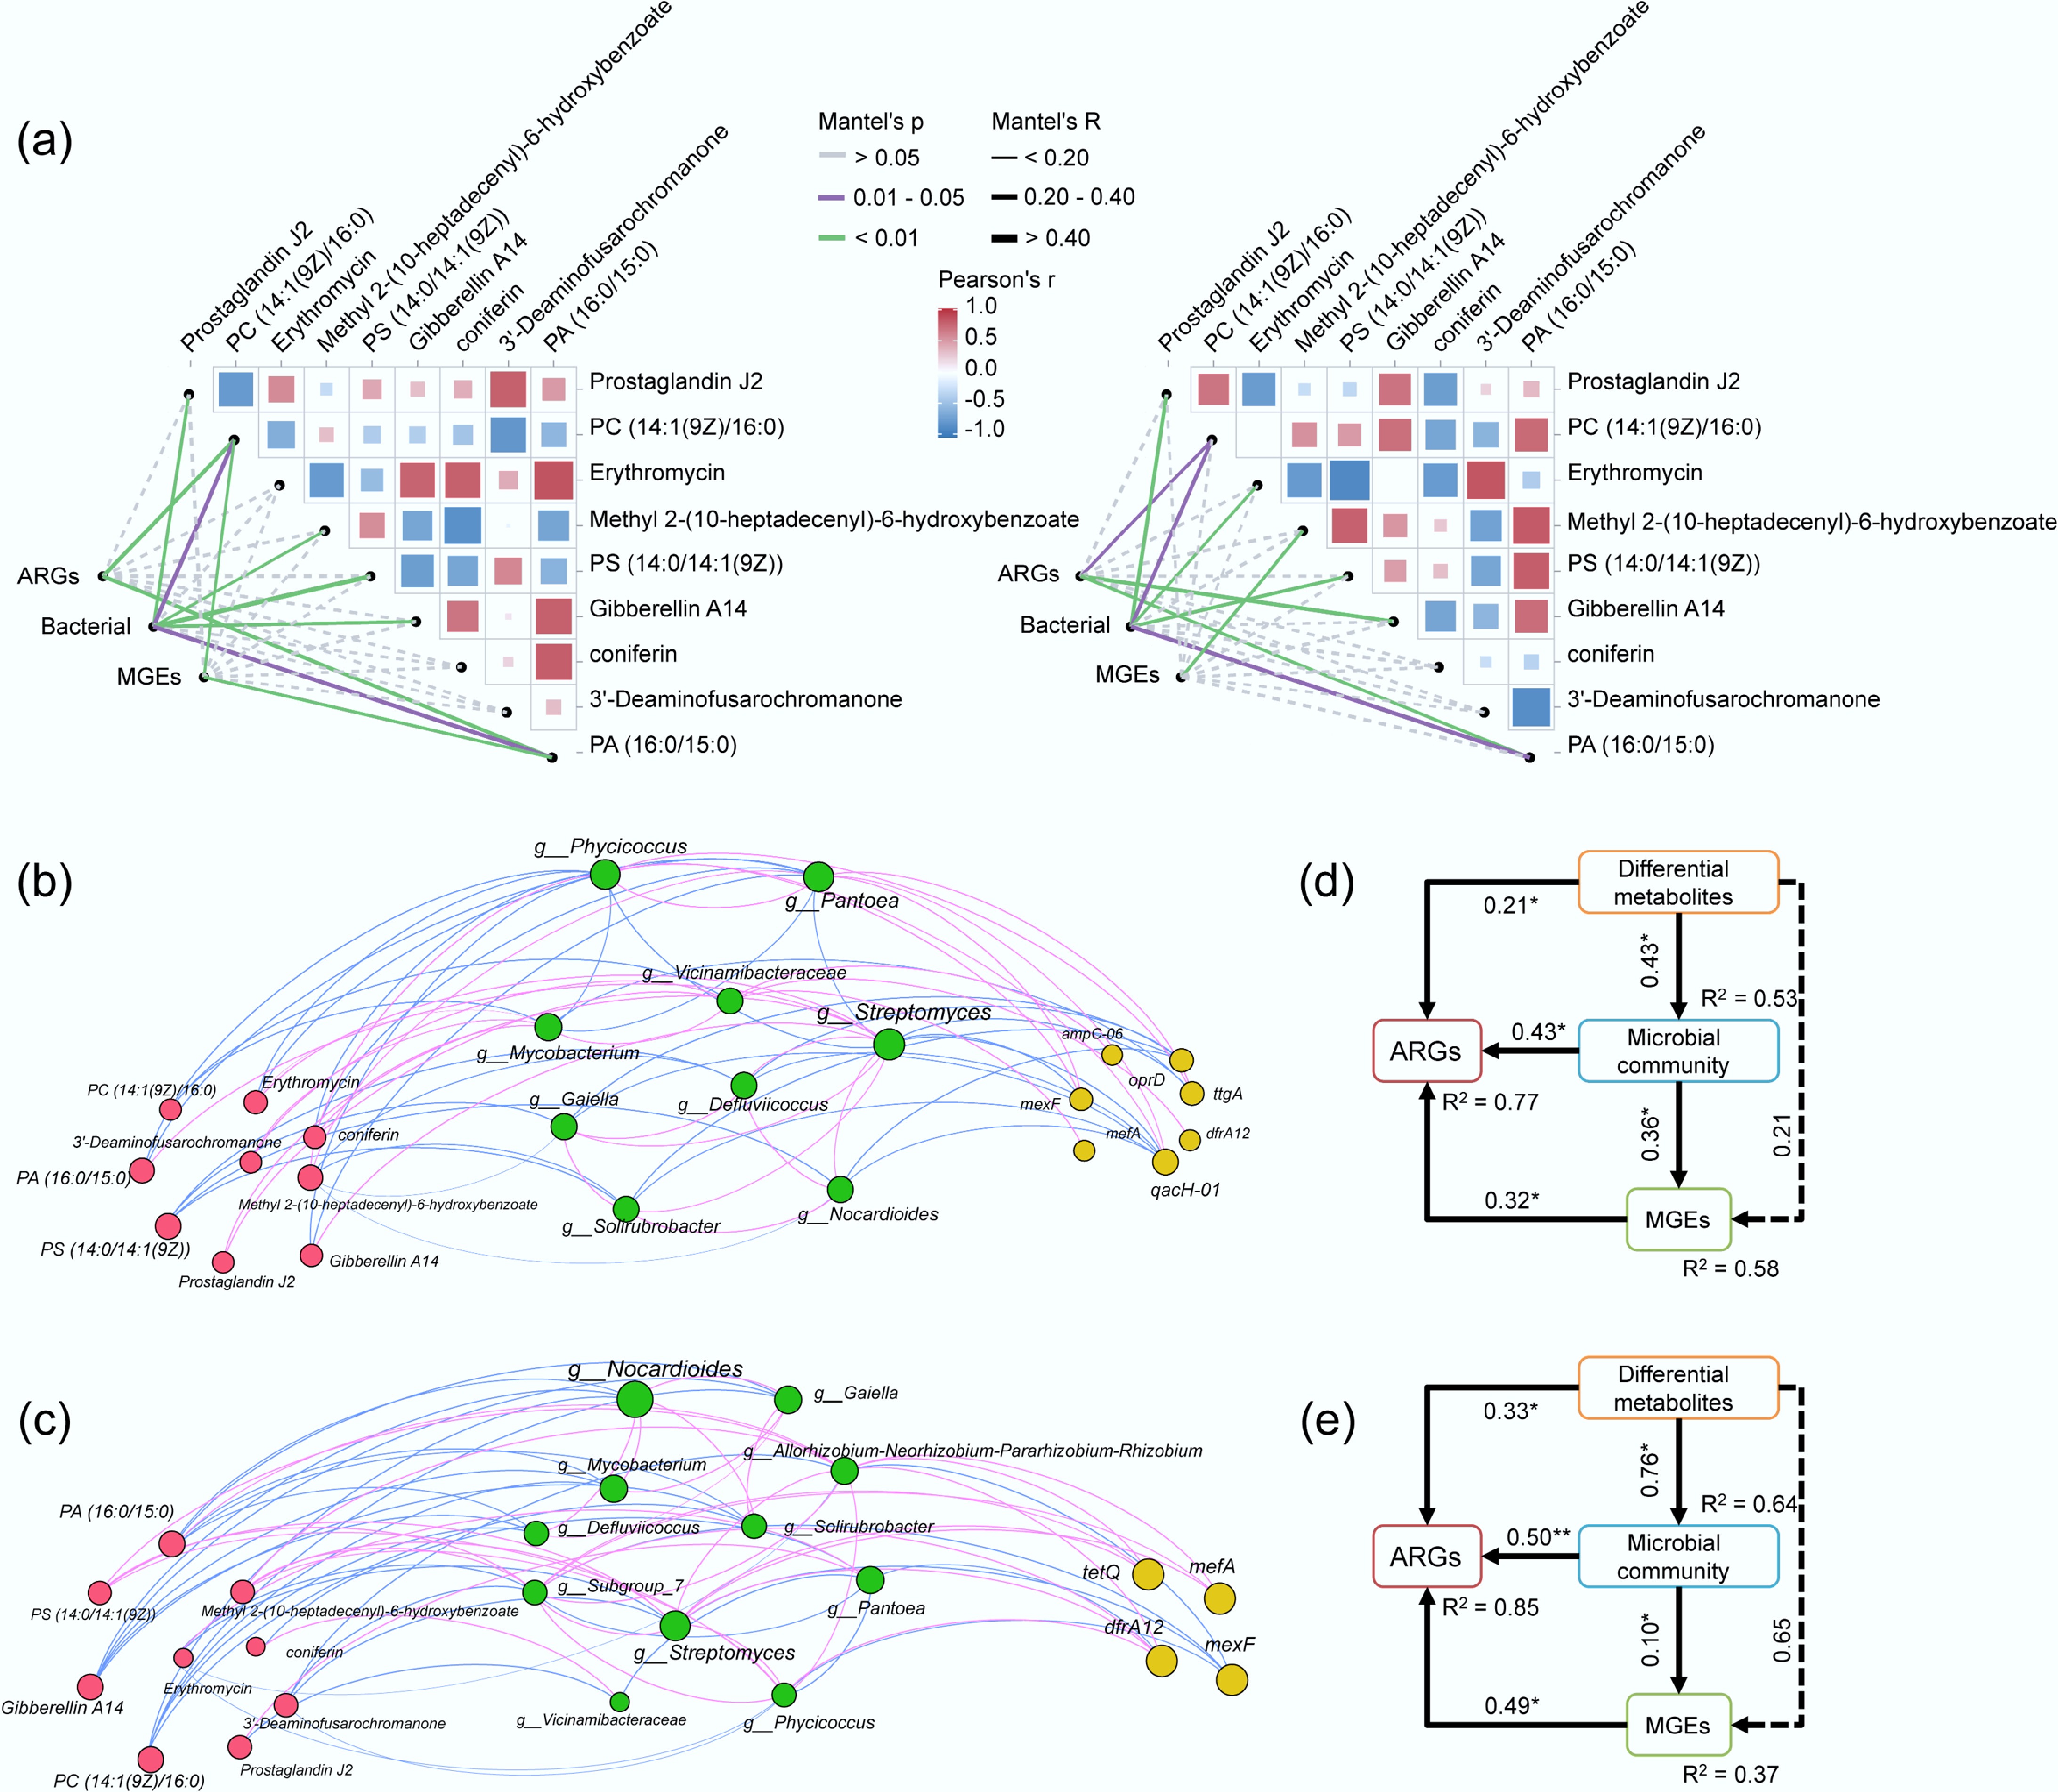
Figure 6.
Mantel test results showing the correlation between DEMs, MGEs, ARGs, and bacterial community in the (a)-left high-abundance crop group, and (a)-right the low-abundance crop group. (b) Co-occurrence networks based on Spearman's rank correlation coefficients in the high-abundance crop group, and (c) the low-abundance crop group. Nodes signify the abundance of individual ARGs, DEMs, or bacterial taxa. Positive and negative relationships are represented by pink and blue arrows, respectively. The SEMs in (d) and (e) depict the effects of MGEs, bacterial communities, and DEMs on ARGs for the high- and low-abundance crop groups, respectively.
Figures
(6)
Tables
(0)