-
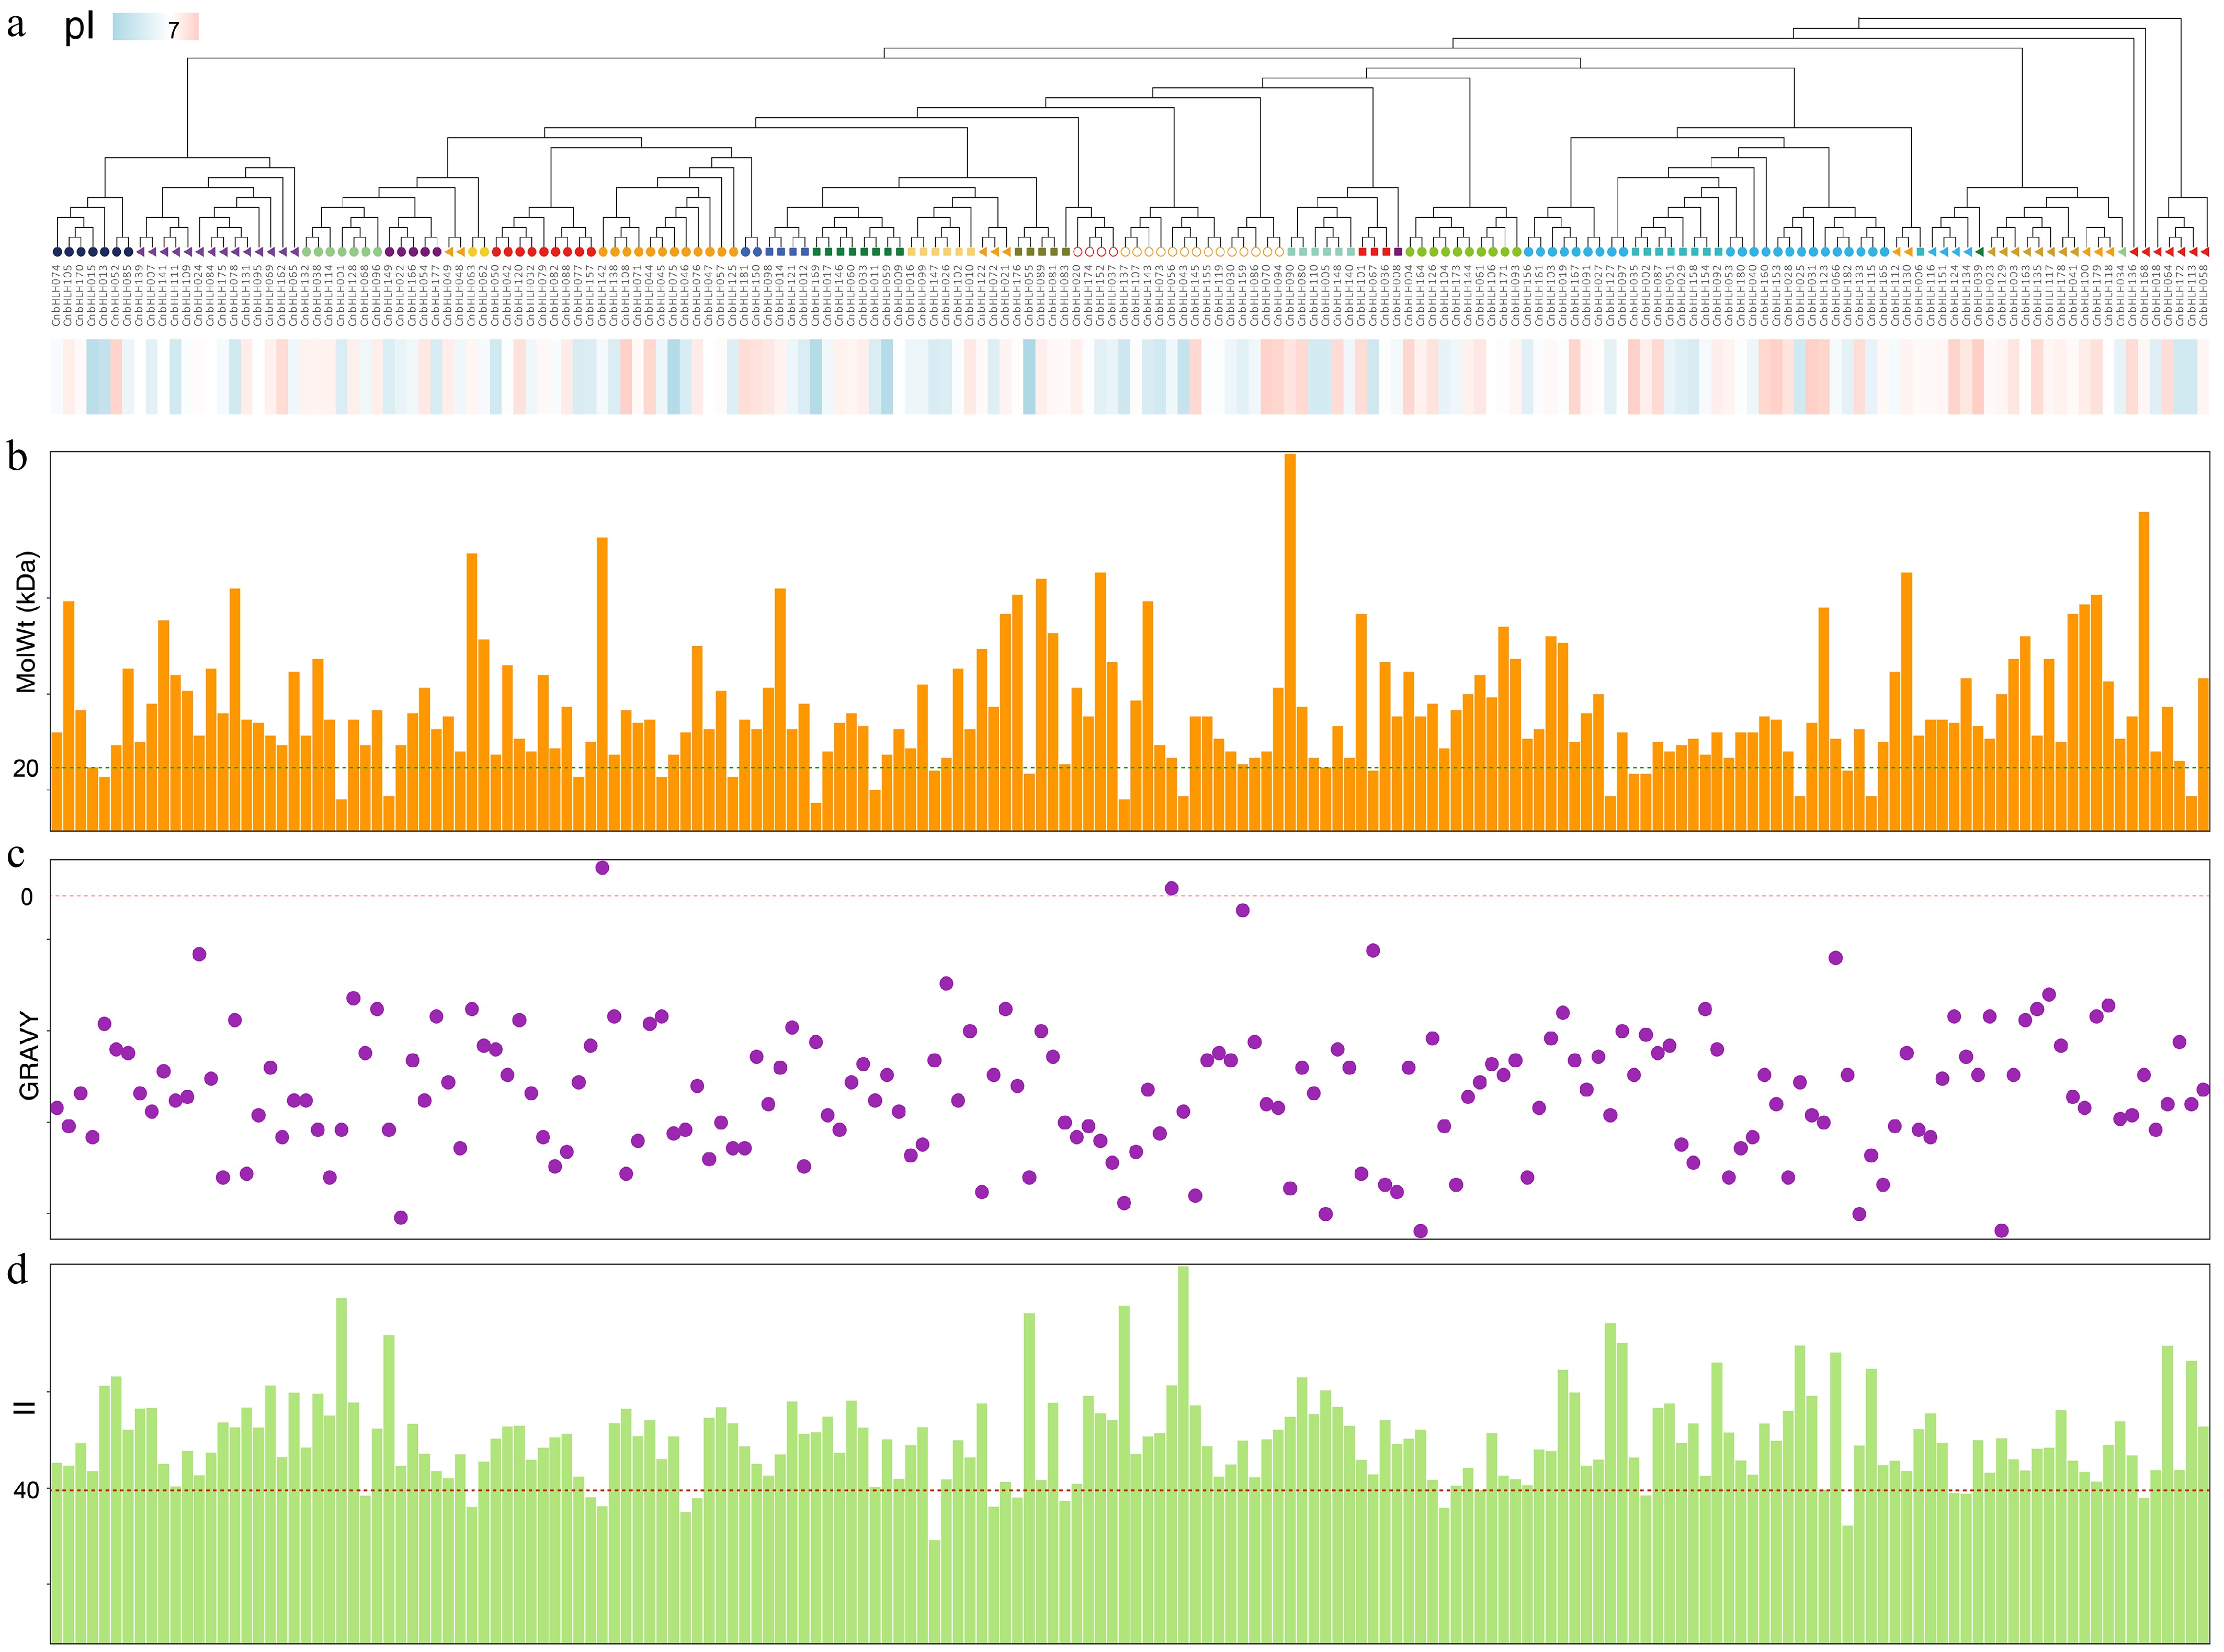
Figure 1.
Physicochemical properties of CnbHLHs. (a) Phylogenetic tree of the CnbHLHs constructed based on full-length amino acid sequences, with subfamily clades color-coded. The bar below indicates the isoelectric point (pI) values of each protein, ranging from acidic (blue) to basic (red). (b) Bar plot showing the molecular weight (MolWt) distribution of CnbHLHs in kilodaltons (kDa). (c) GRAVY (Grand Average of Hydropathy) index of each CnbHLH. Most proteins exhibited negative GRAVY values, indicating hydrophilicity. (d) Bar chart of instability index (II) values. The dashed line at II = 40 denotes the threshold above which proteins are considered potentially unstable.
-
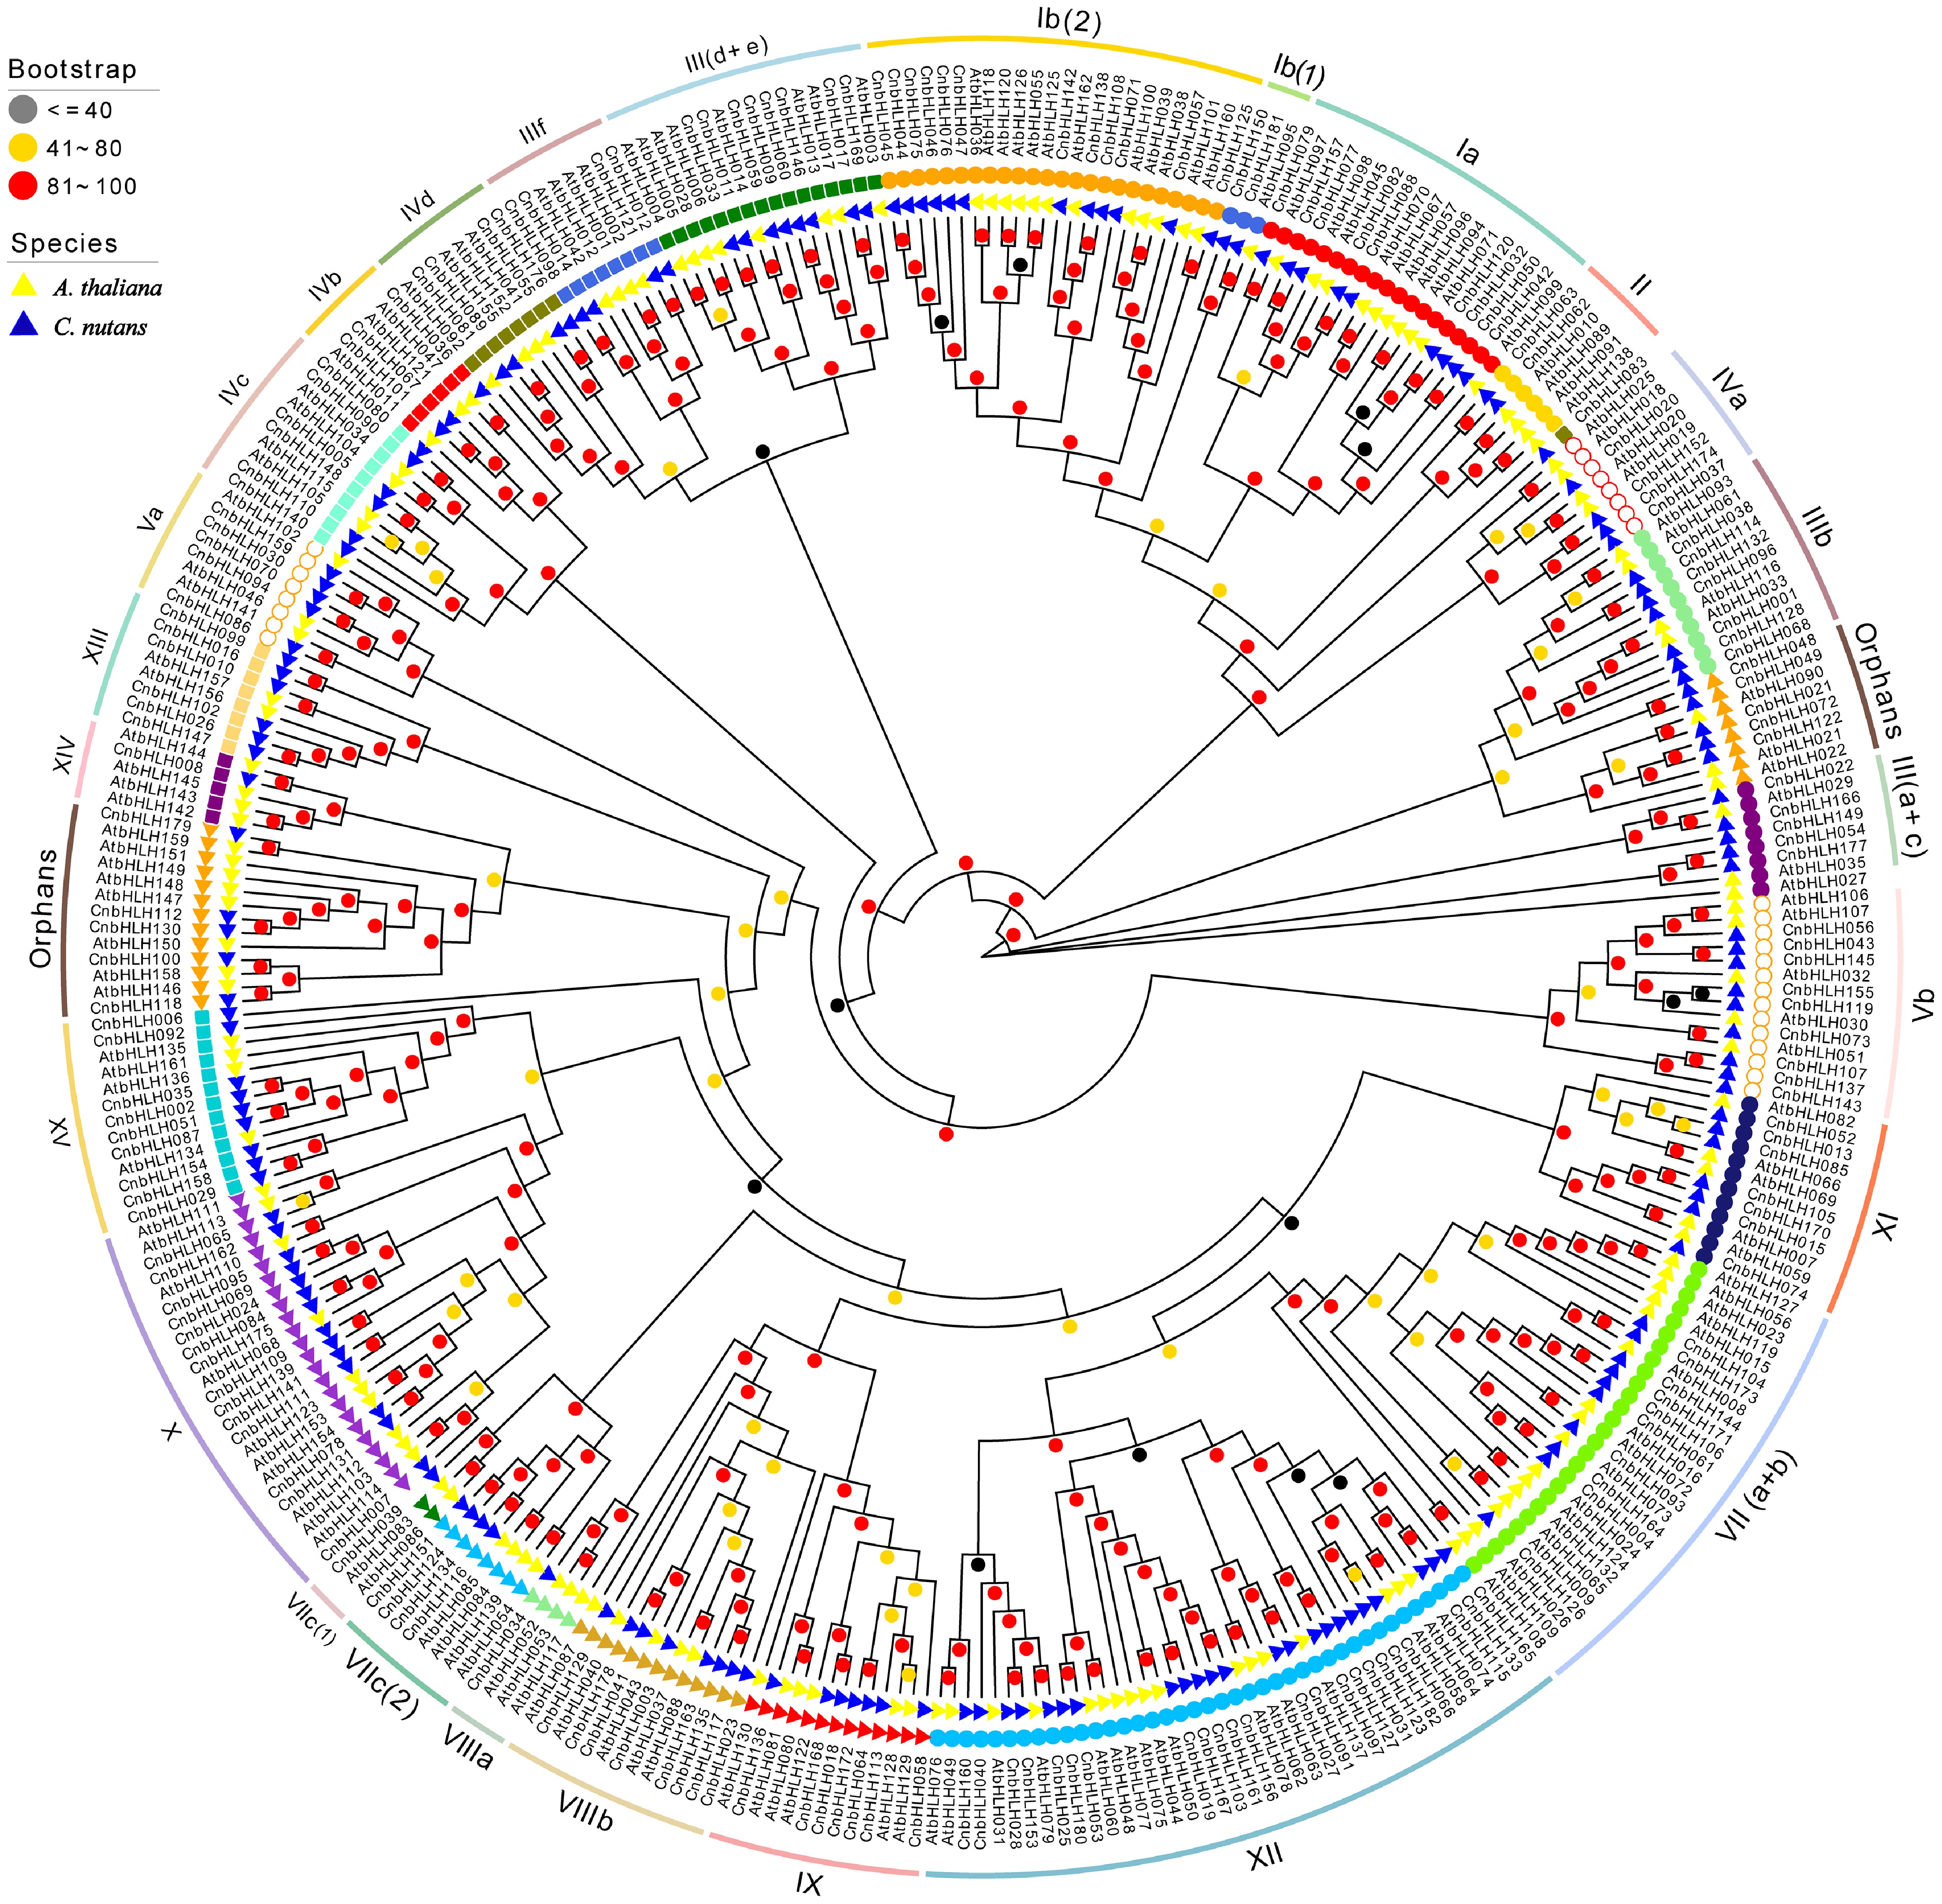
Figure 2.
Phylogenetic relationship of bHLHs between C. nutans and A. thaliana. The unrooted evolutionary tree was constructed using IQTree with the maximum likelihood (ML) method. The 182 CnbHLHs are classified into 26 subfamilies and one Orphan group, following the classification method used of AtbHLHs, represented by different colored subgroups within the tree. The bootstrap value is displayed a circle on each branch, with each color corresponding to a specific bootstrap value range.
-
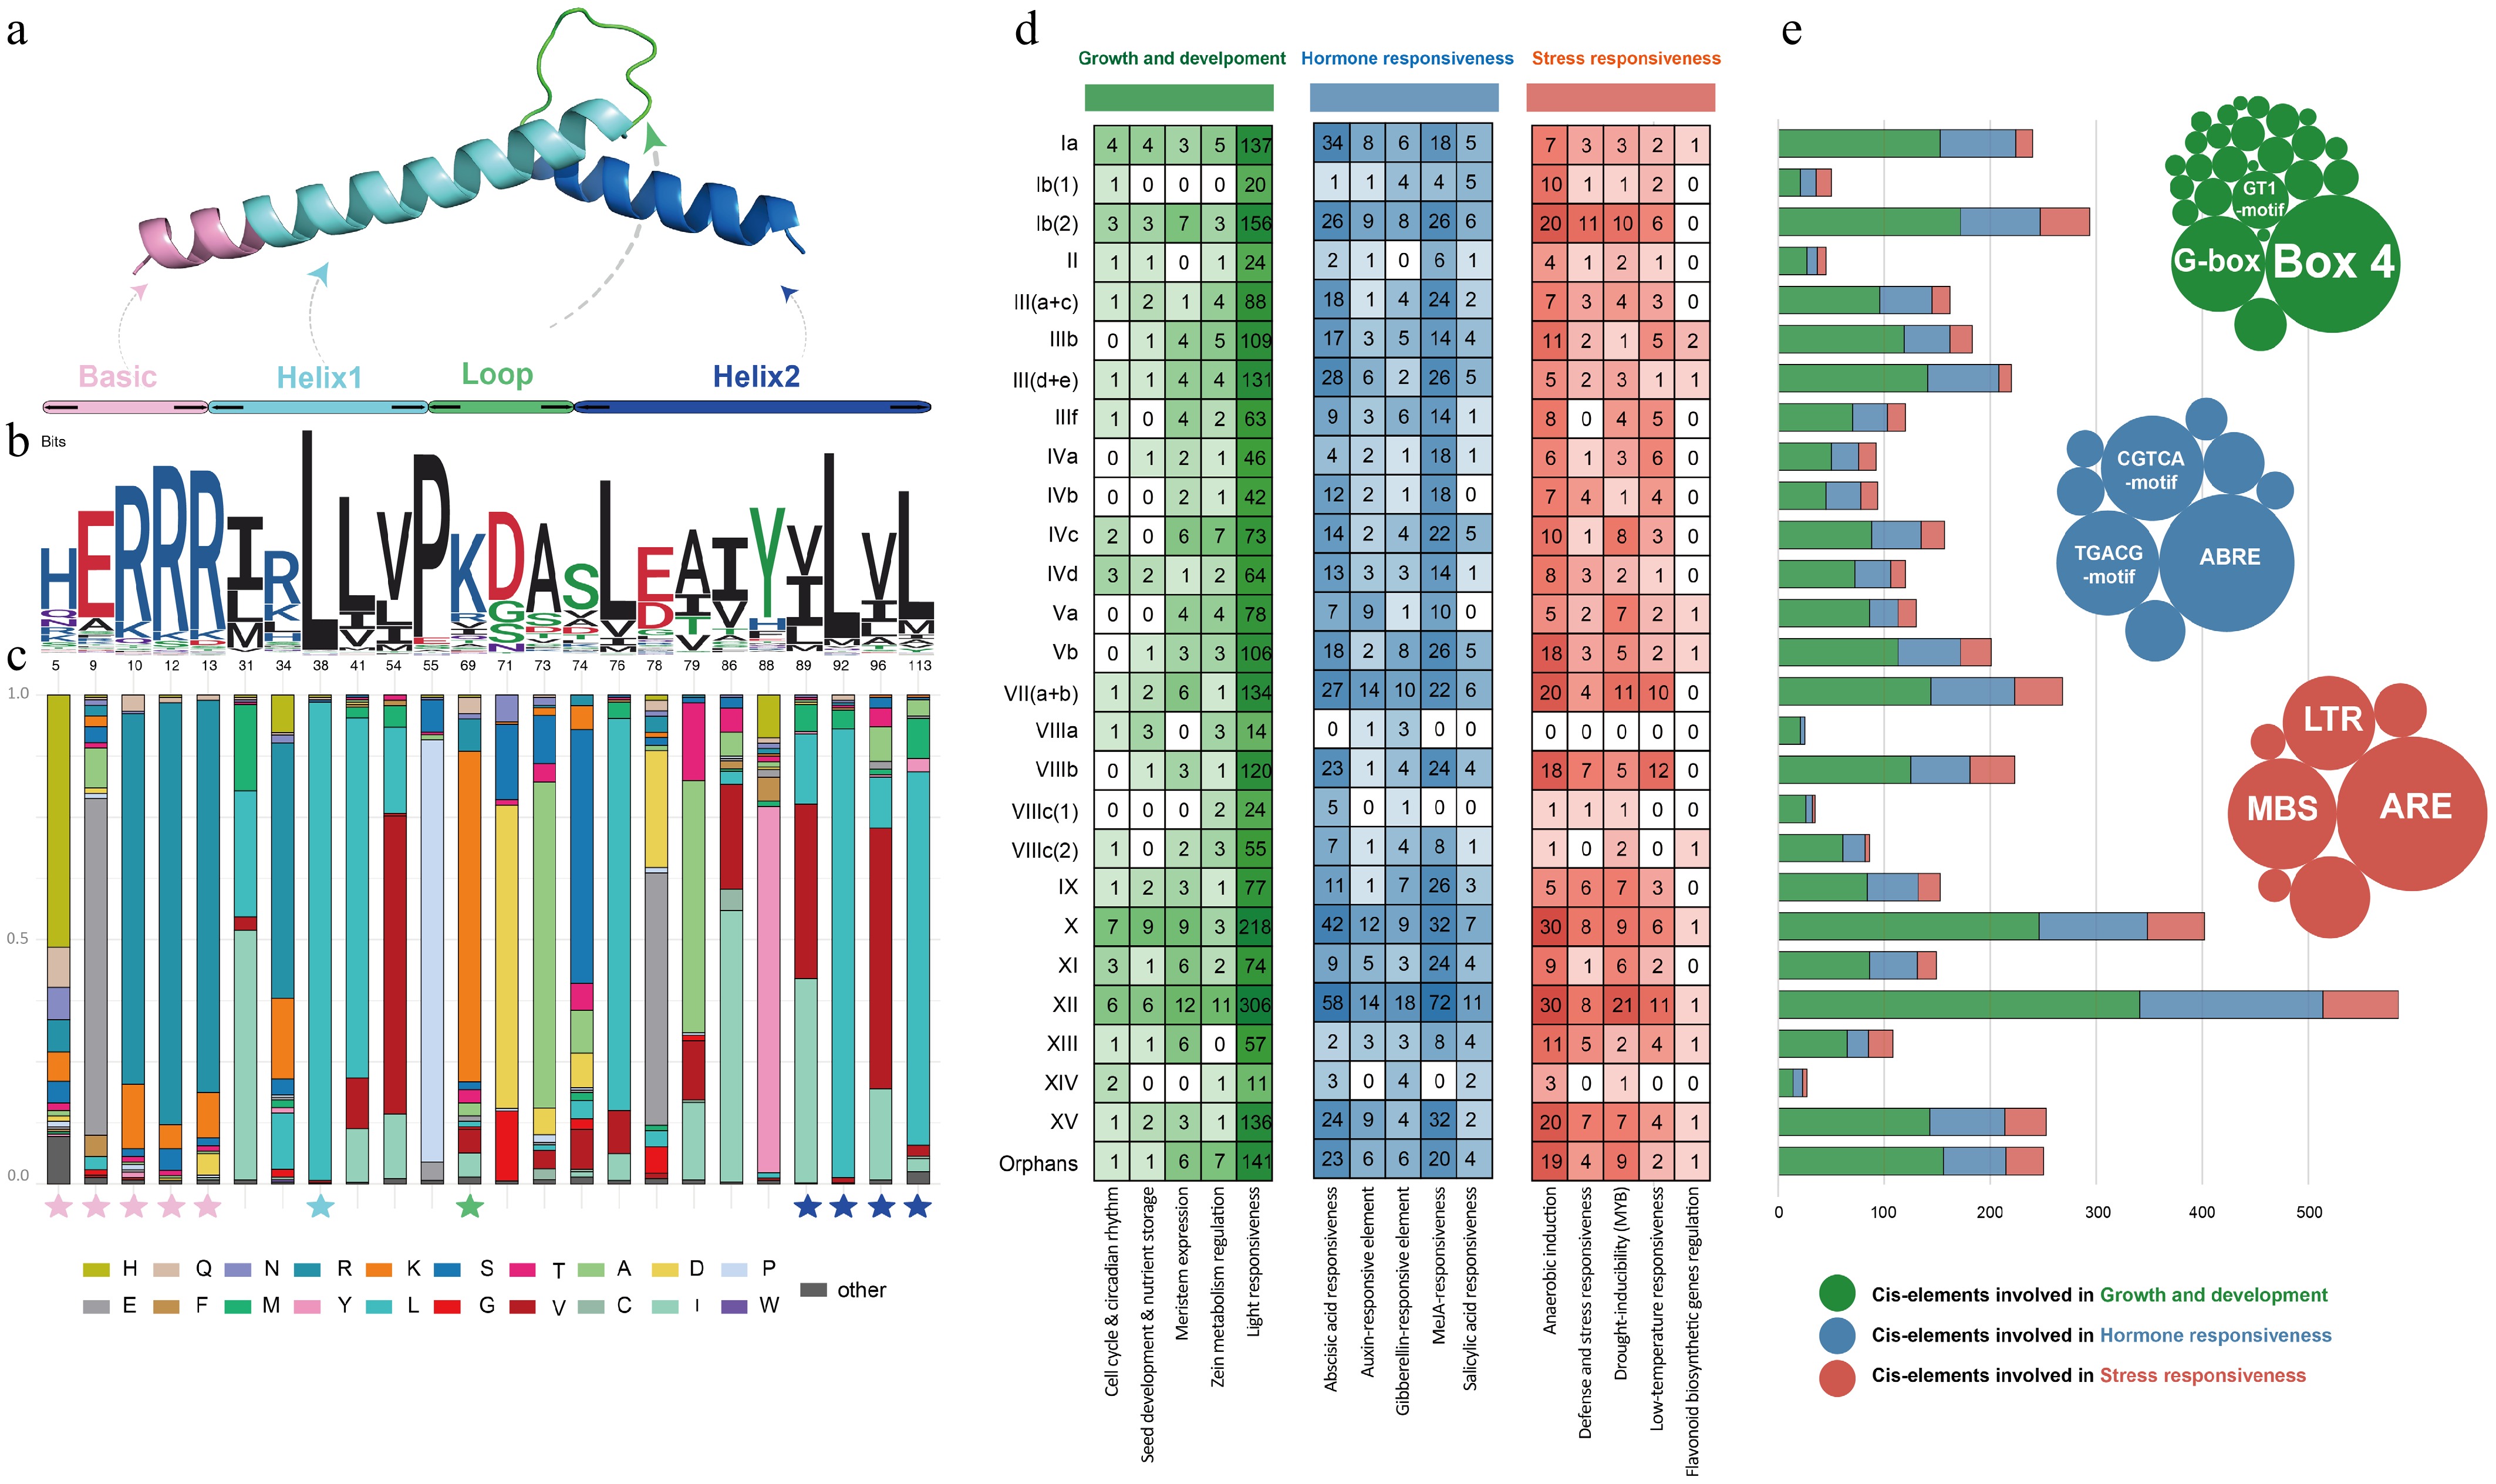
Figure 3.
Structural characteristics and CRE feature of CnbHLHs. (a) Three-dimensional protein structure of the bHLH domain. (b) Sequence logo of the CnbHLHs domain. The numbers at the bottom represent the positions of residues in the alignment. (c) Distribution of amino acids in the CnbHLHs conserved sites. The pentagrams below the bar chart indicate the positions of highly conserved residues. (d) The identified CREs were grouped into three functional categories, shown in green, blue, and red shades. The numbers show the quantity of corresponding CREs in the promoter regions of each subfamily of CnbHLHs. (e) Statistics for the total number of CREs. The bubble chart displays the number of all elements under each functional category, with the top three most abundant elements labeled.
-
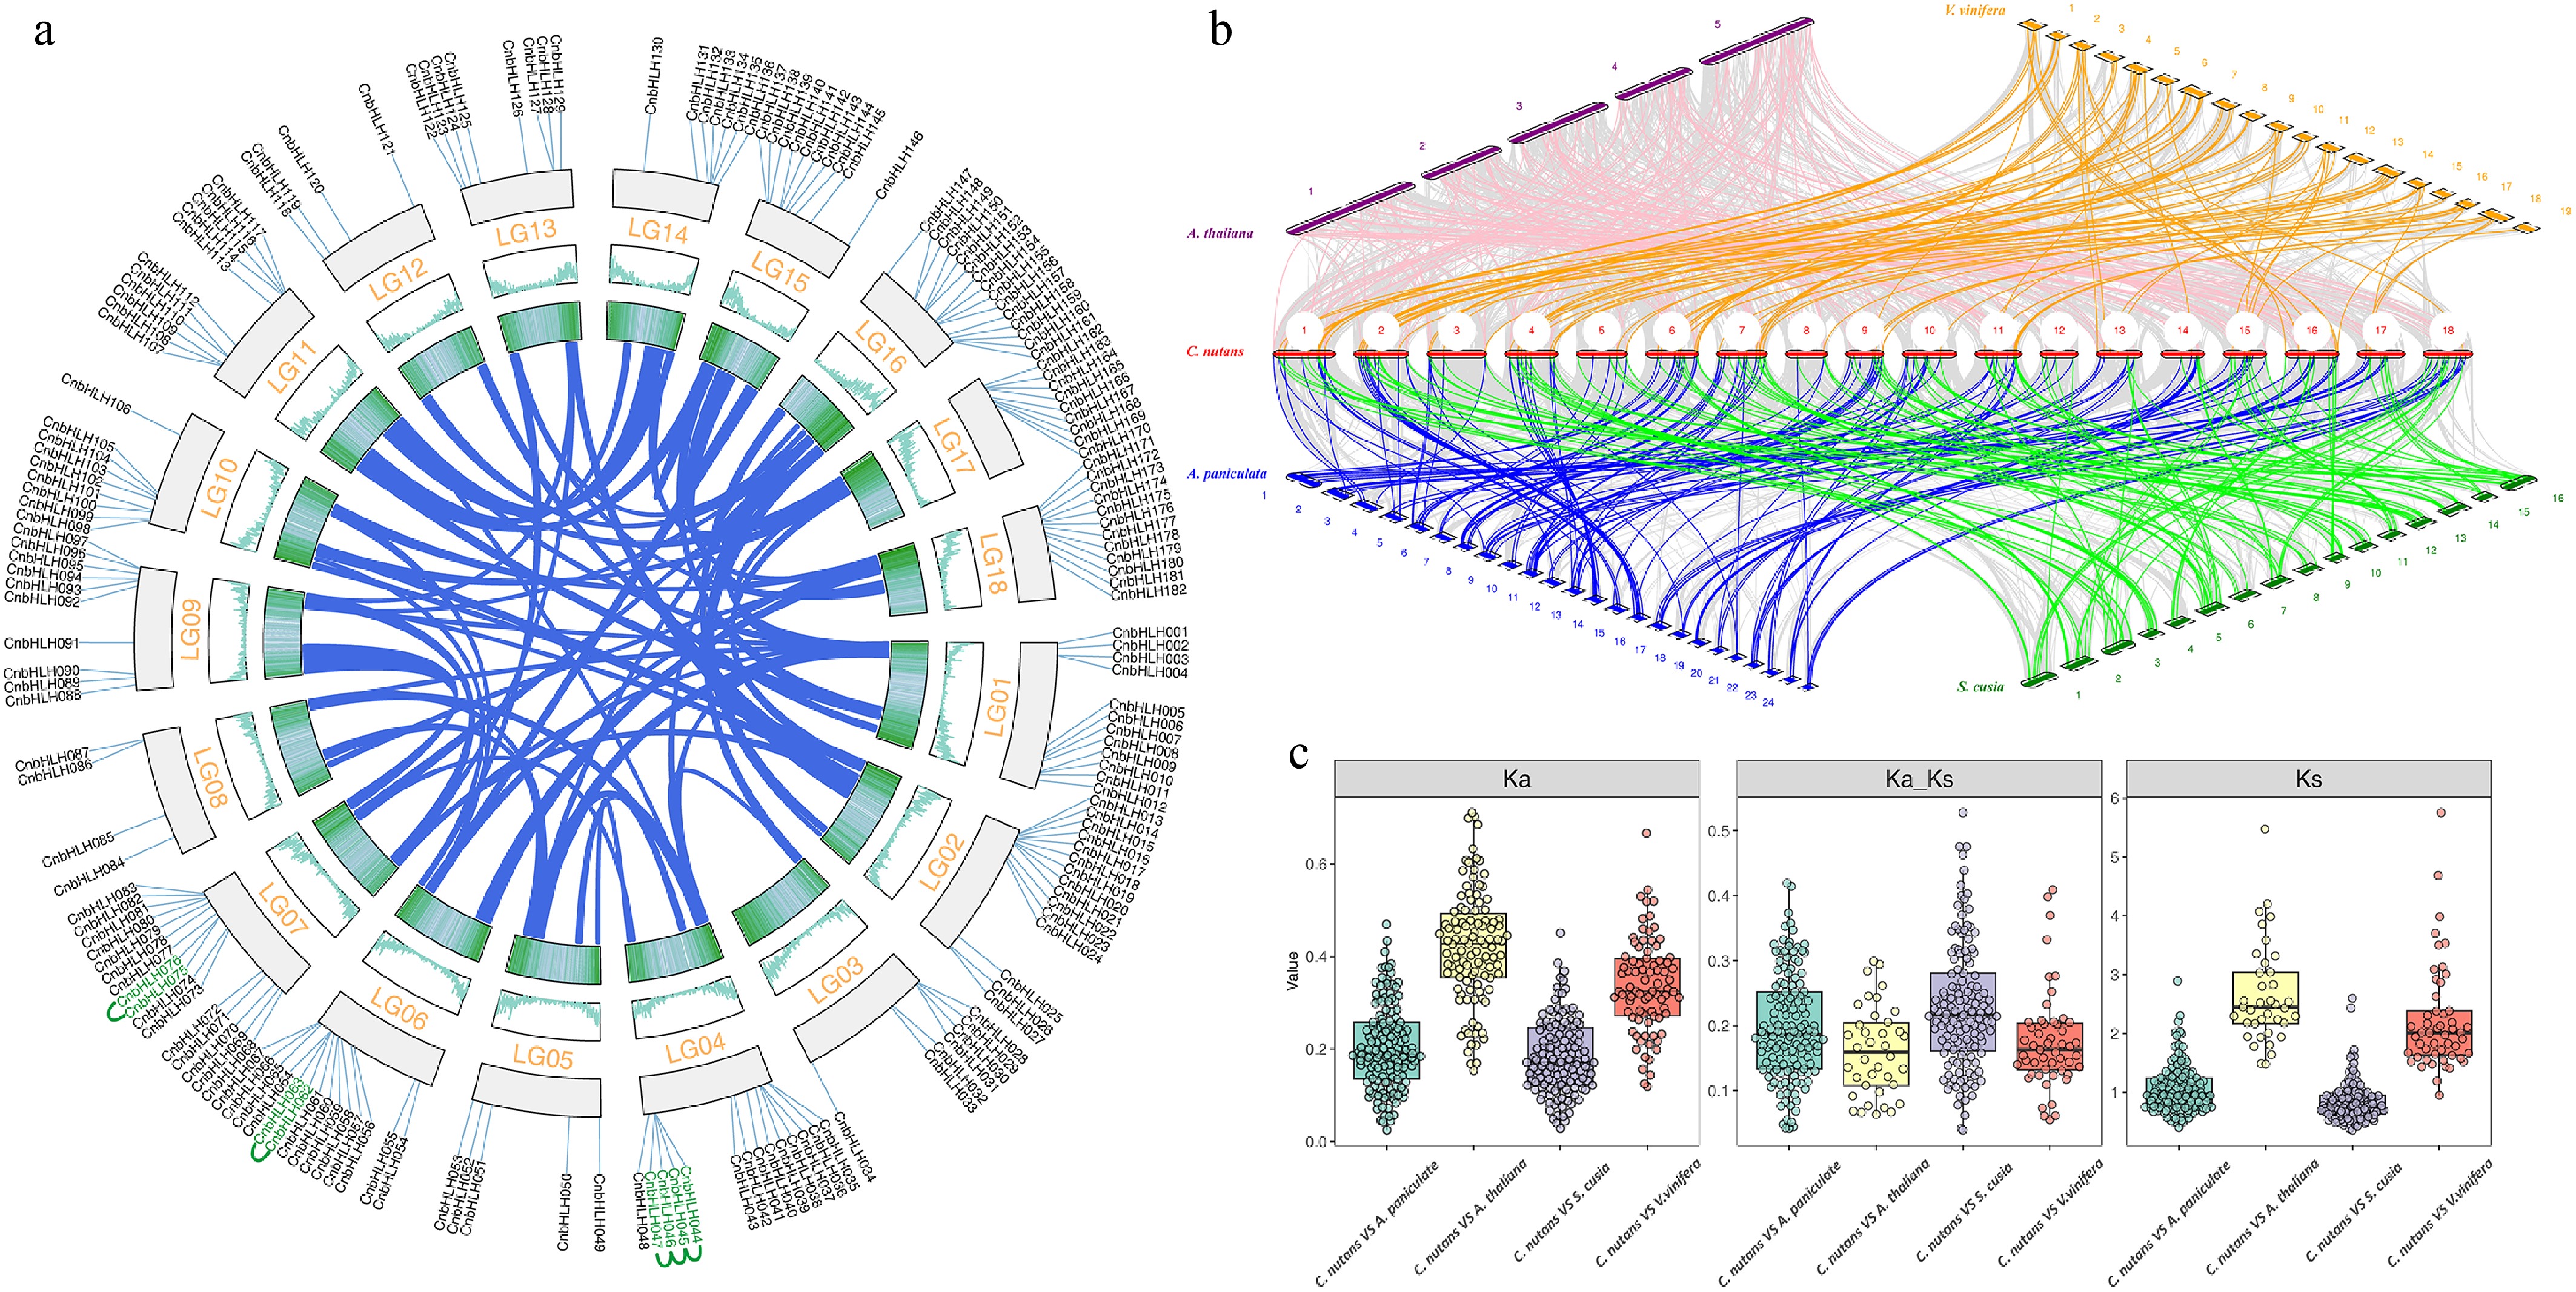
Figure 4.
Evolutionary analysis of the bHLH gene family between C. nutans and other species. (a) Collinearity analysis of CbHLHs. (b) bHLHs collinearity between C. nutans and other species (A. thaliana, V. vinifera, A. paniculata, S. cusia) genomes. (c) Ka/Ks analysis of bHLHs between C. nutans and closely related species (A. paniculata, S. cusia).
-
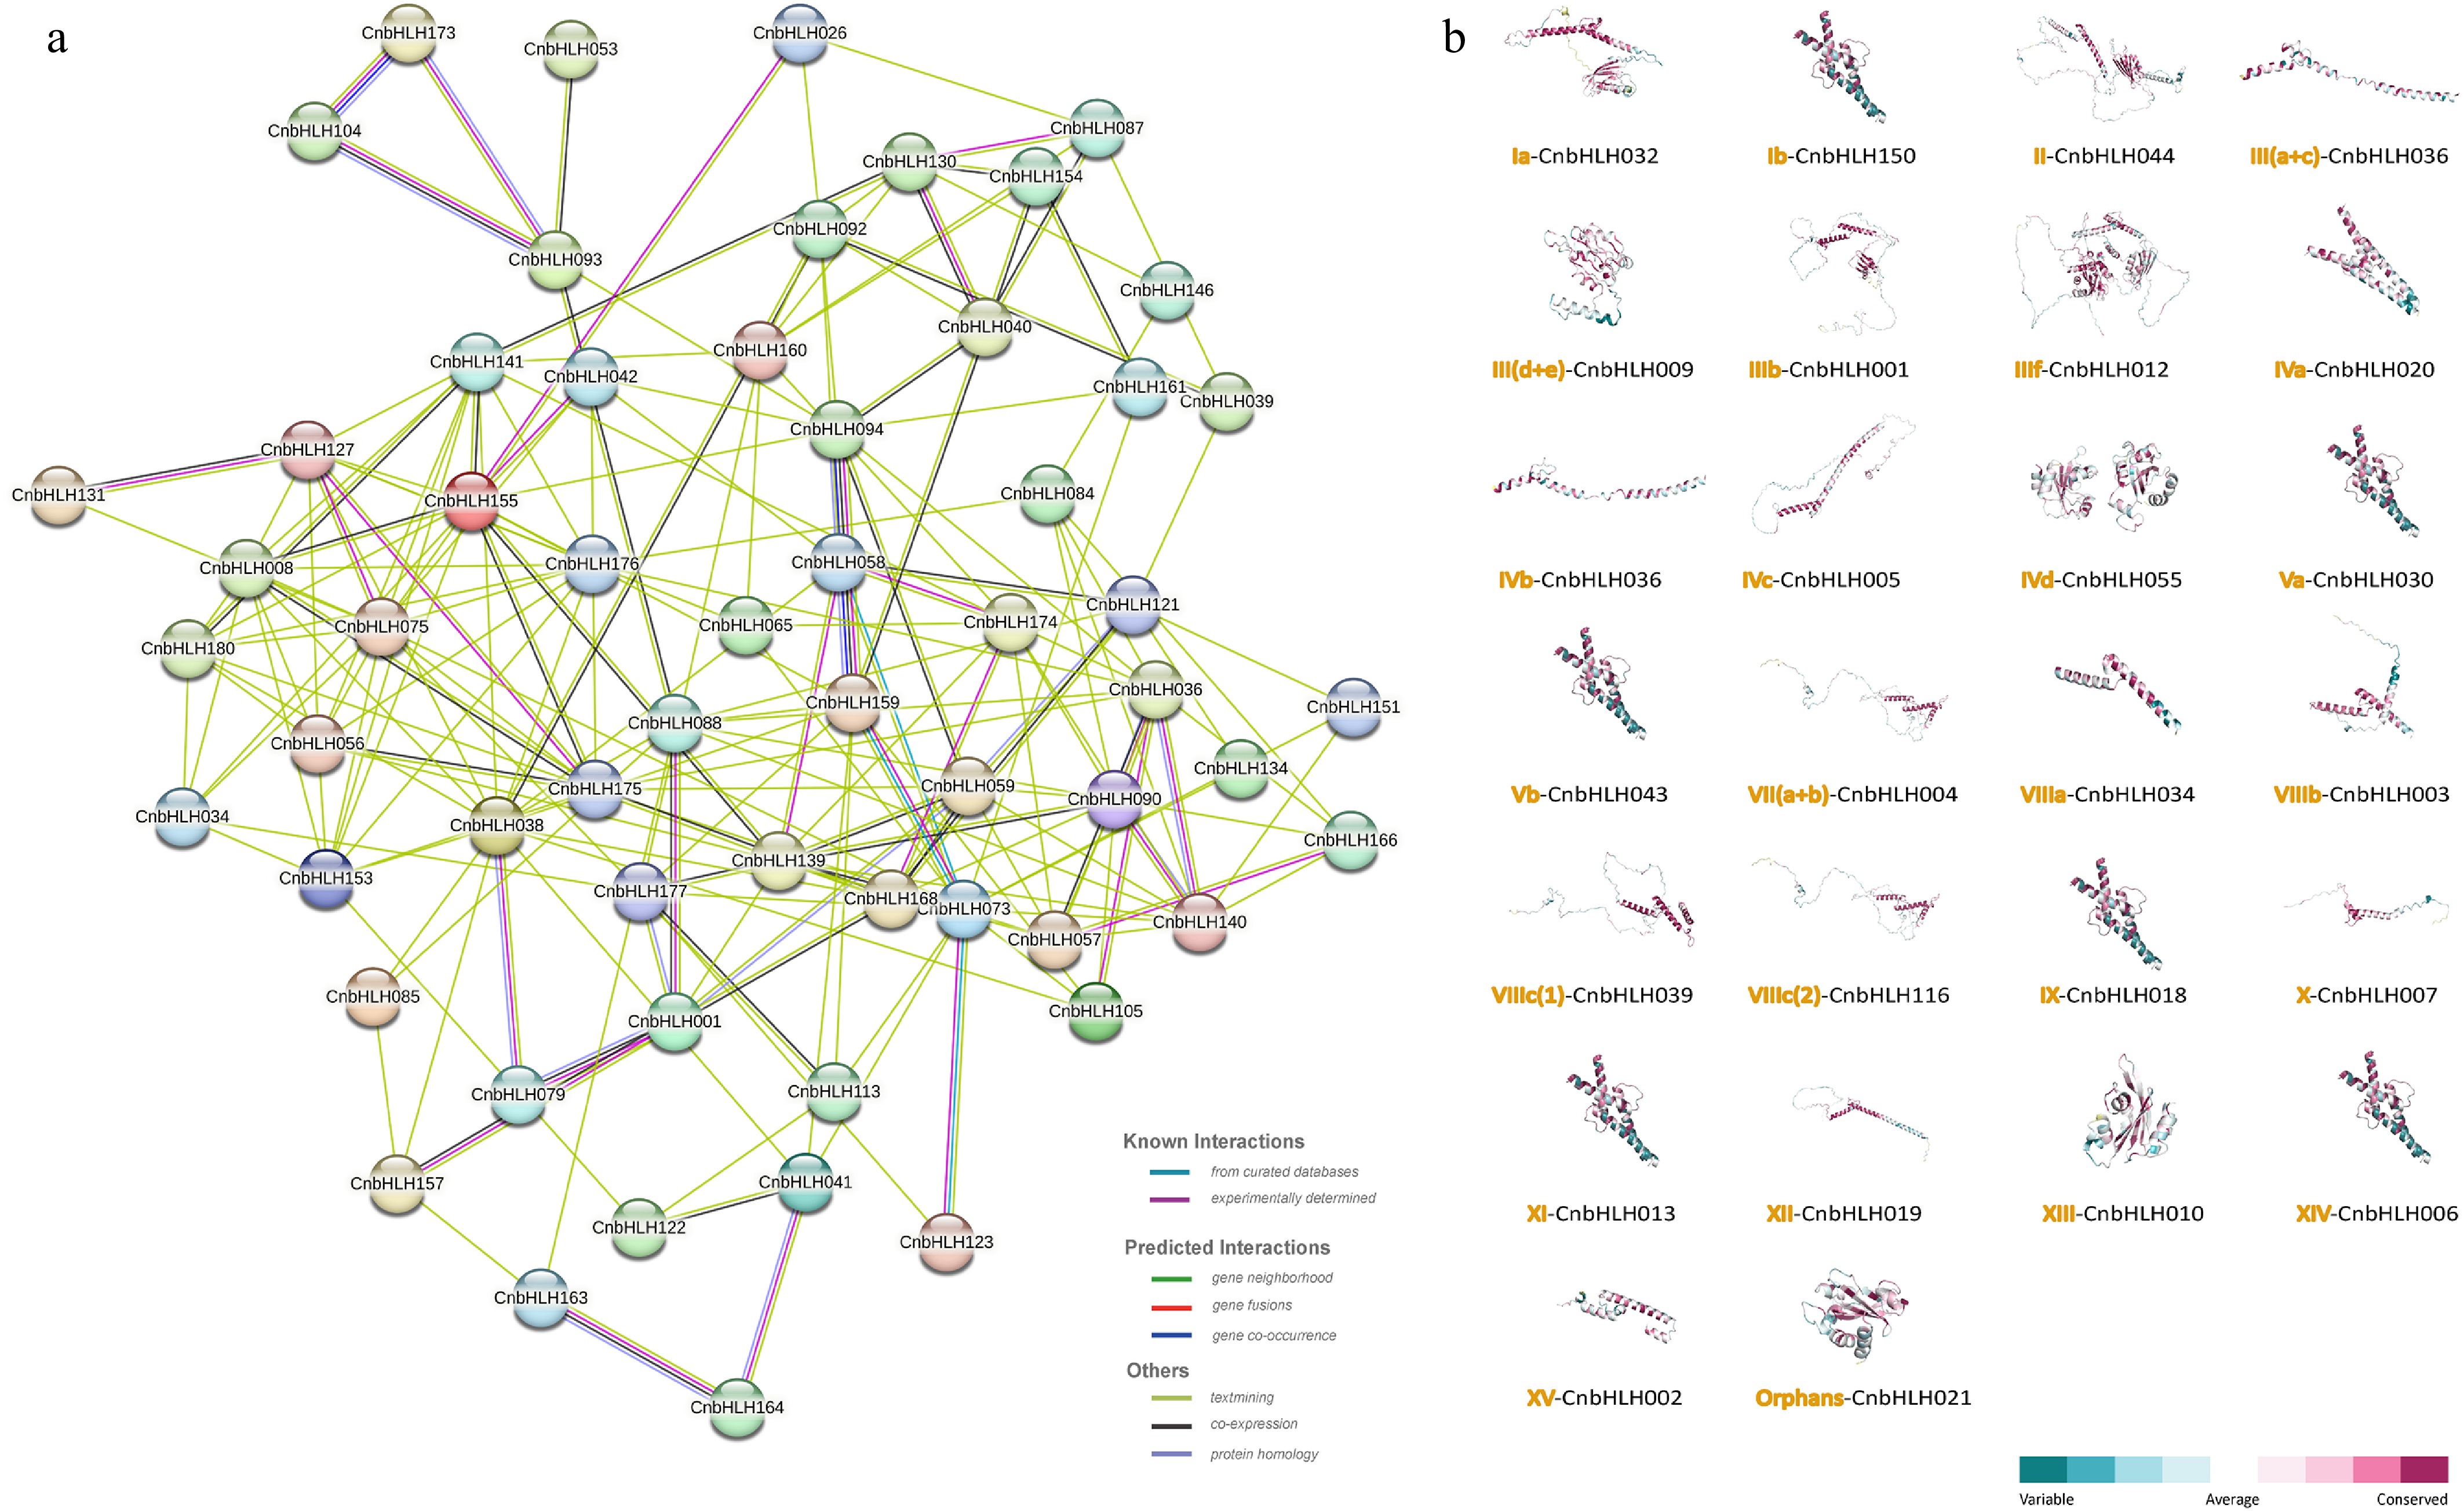
Figure 5.
Protein interaction network and predicted 3D structure of CnbHLHs. (a) Protein–protein interaction network of CnbHLHs based on homologous proteins in A. thaliana. (b) Predicted 3D structures of CnbHLHs, showing only the member with the highest GMQE value from each subfamily.
-
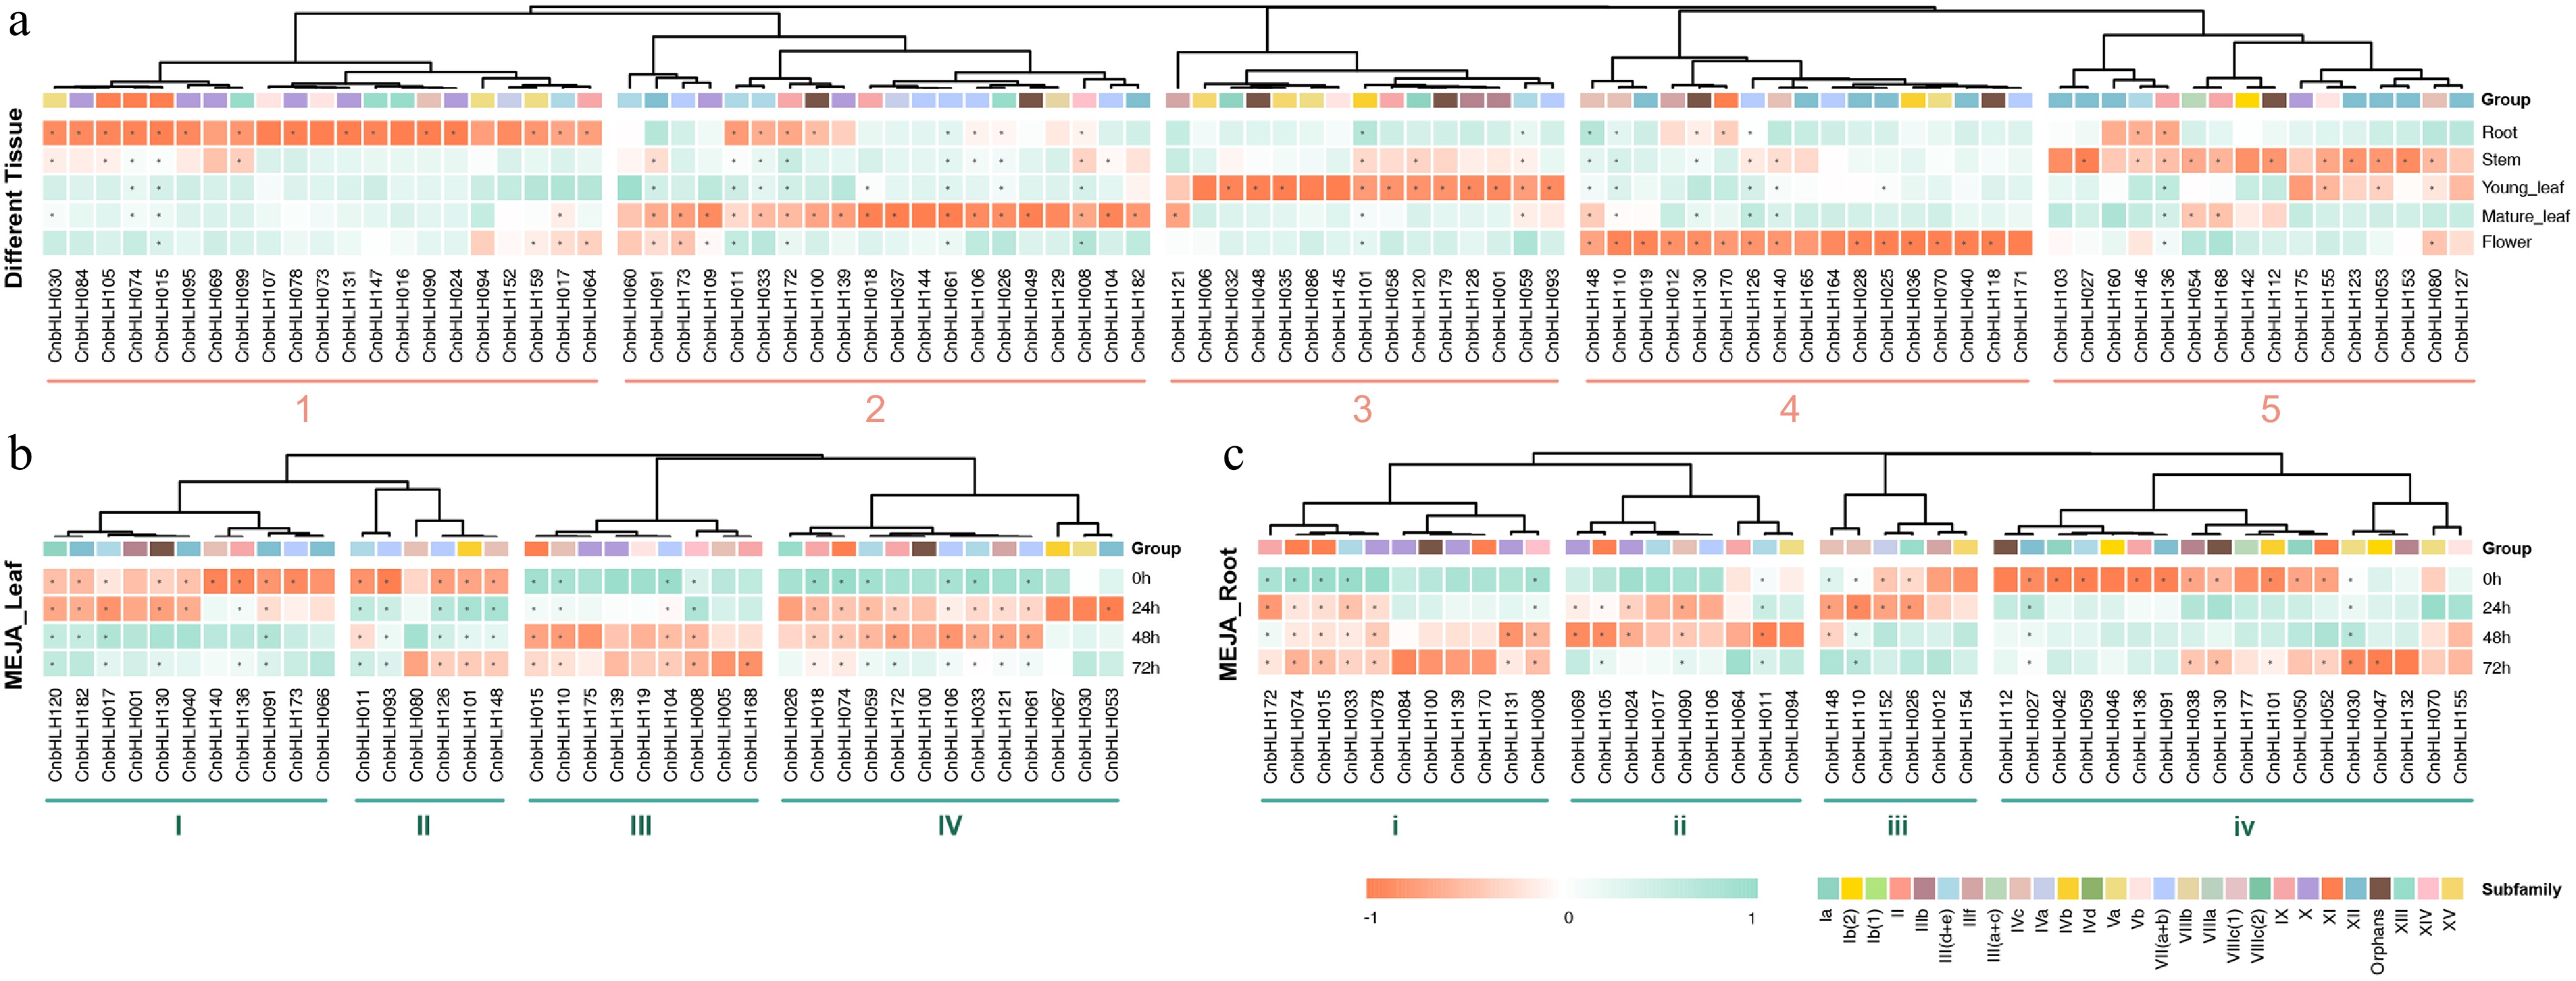
Figure 6.
The heat maps of gene expression of CnbHLHs in different tissues and the MeJA treatment. (a) The heat map of CnbHLHs expressionin different tissues. (b) The heat map of CnbHLHs expression in leaves after MeJA treatment. (c) The heat map of CnbHLHs expression in roots after MeJA treatment.
-
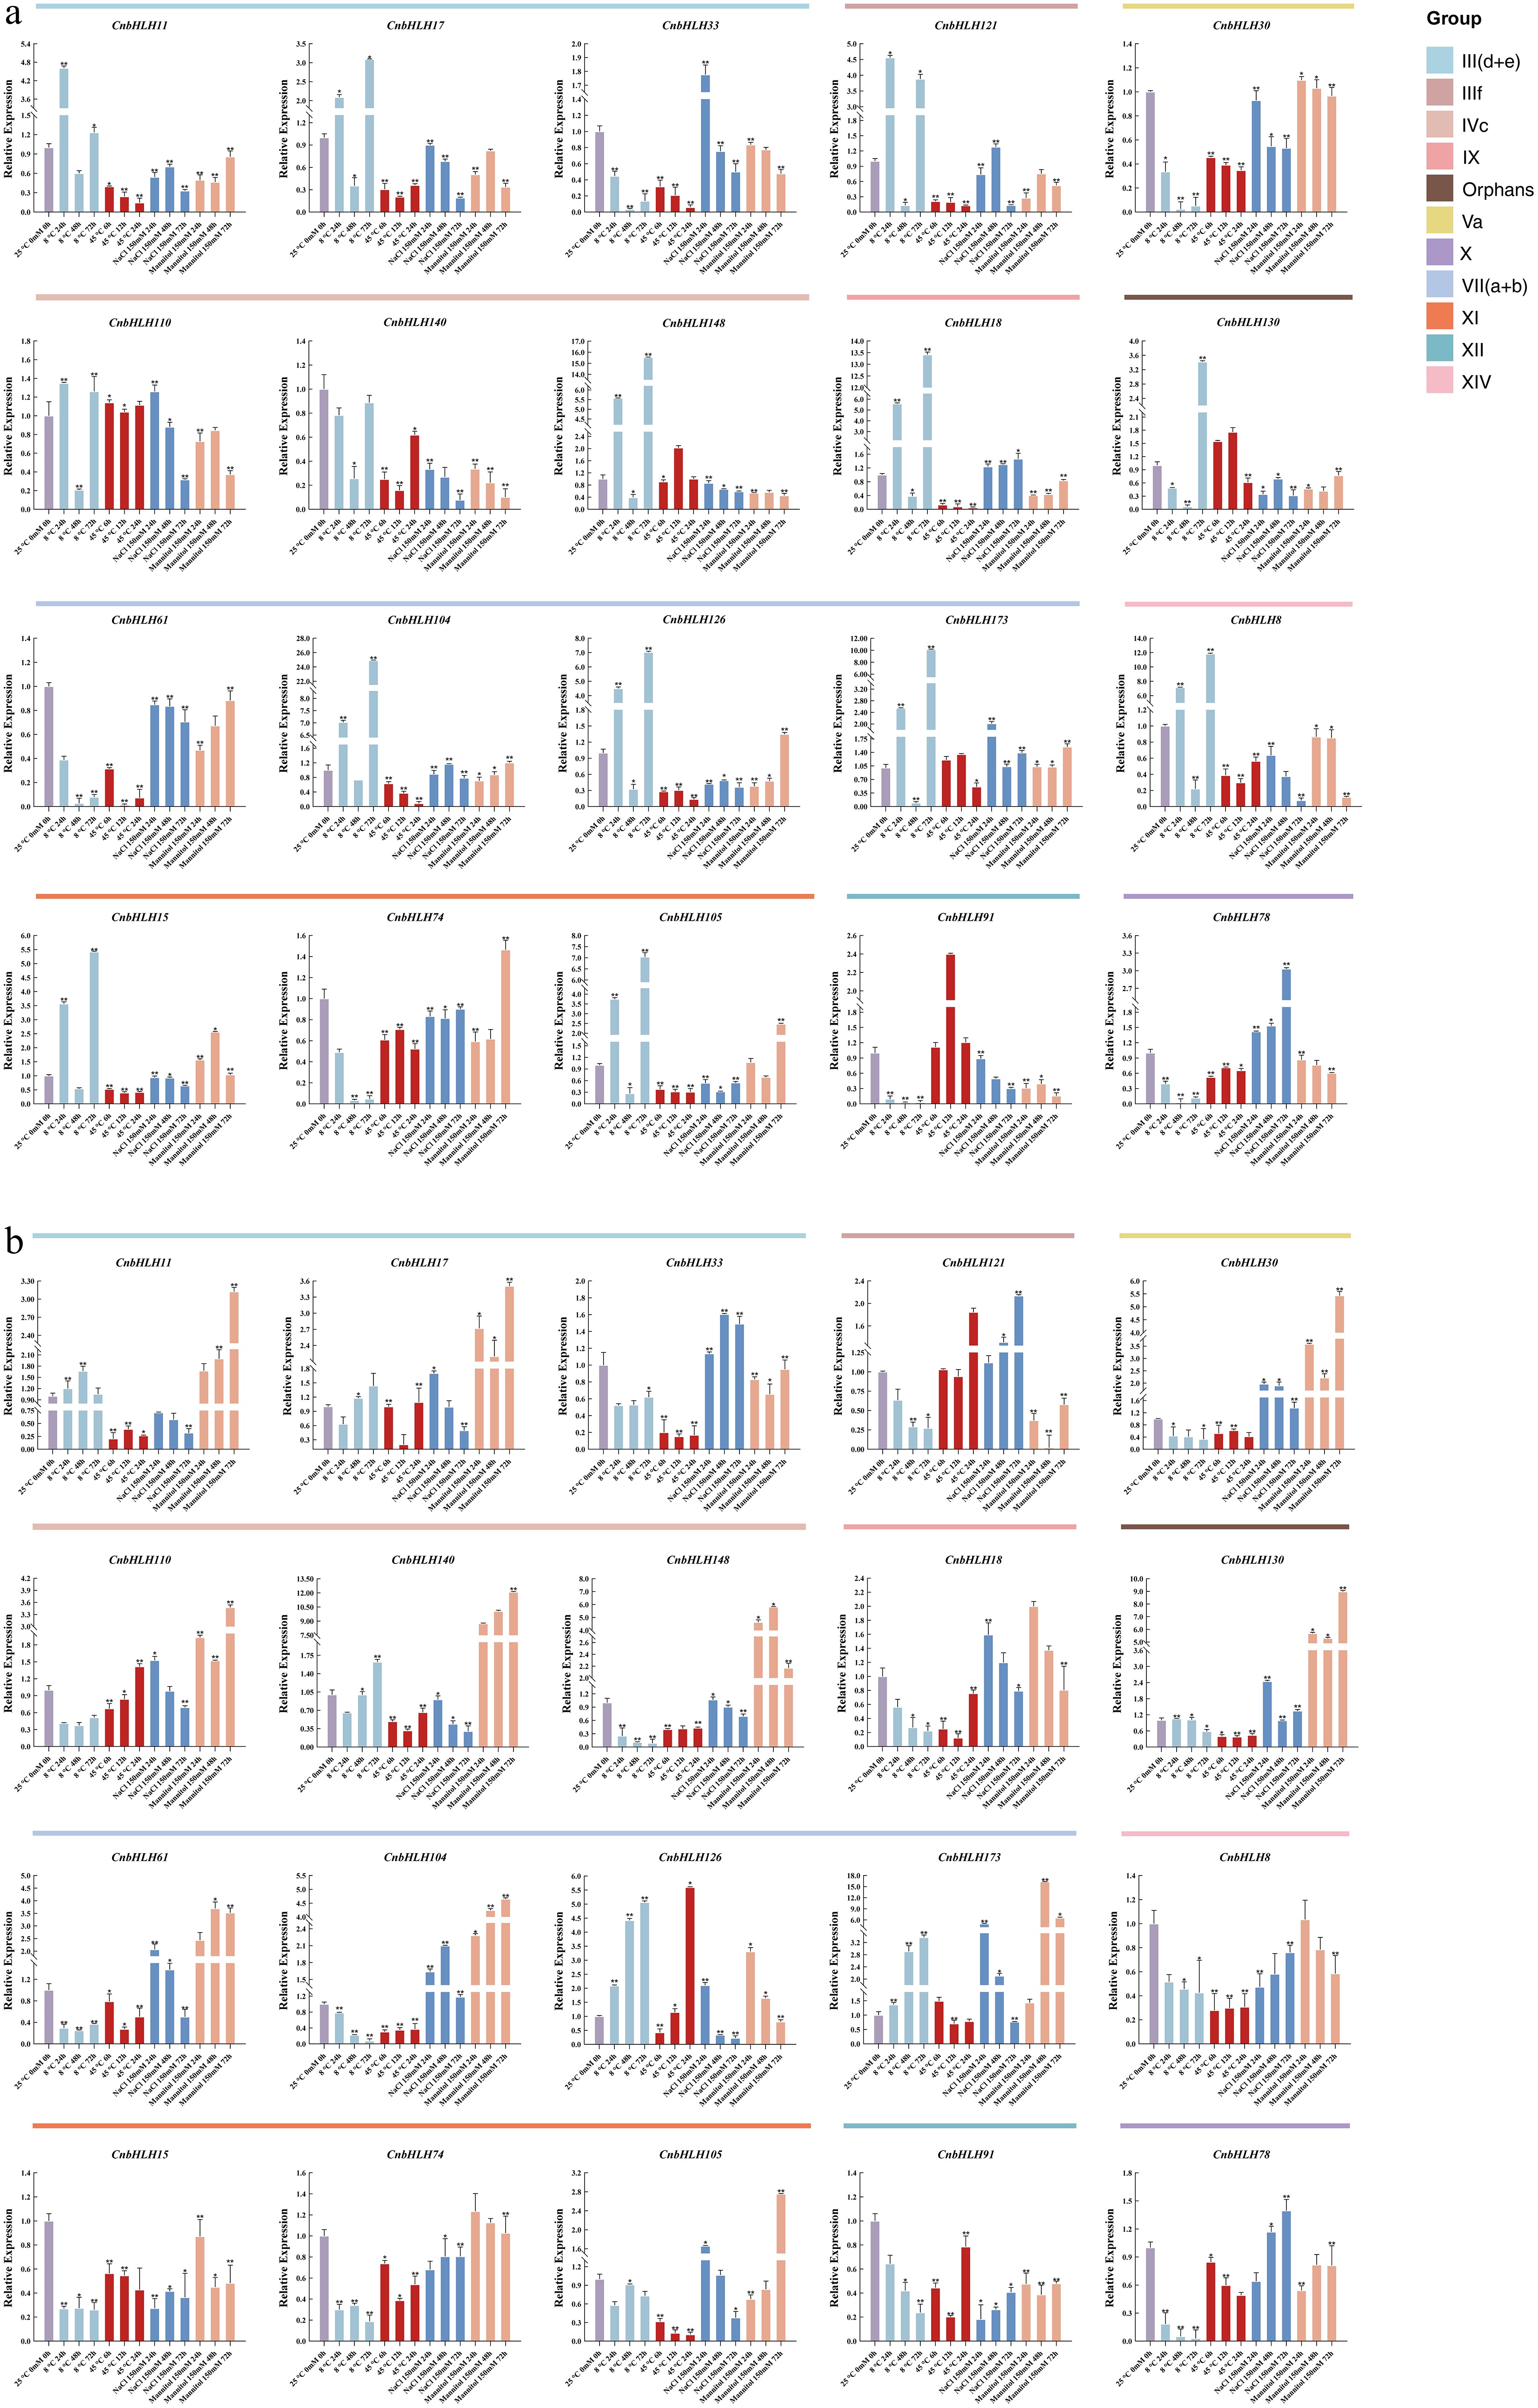
Figure 7.
qRT-PCR analysis of 20 CnbHLHs under various stress conditions, including cold (4 °C), heat (45 °C), NaCl (150 mM), and drought (mannitol 150 mM). All experiments were conducted independently three times. Error bars denote the standard deviation of triplicate samples. Asterisks denote statistically significant differences in transcript levels when compared with the blank control (25 °C, 0 h, 0 mM). (* p < 0.05, ** p < 0.01, *** p < 0.001). (a) Relative expression levels of selected CnbHLHs in leaf tissues. (b) Relative expression levels of selected CnbHLHs in root tissues.
-
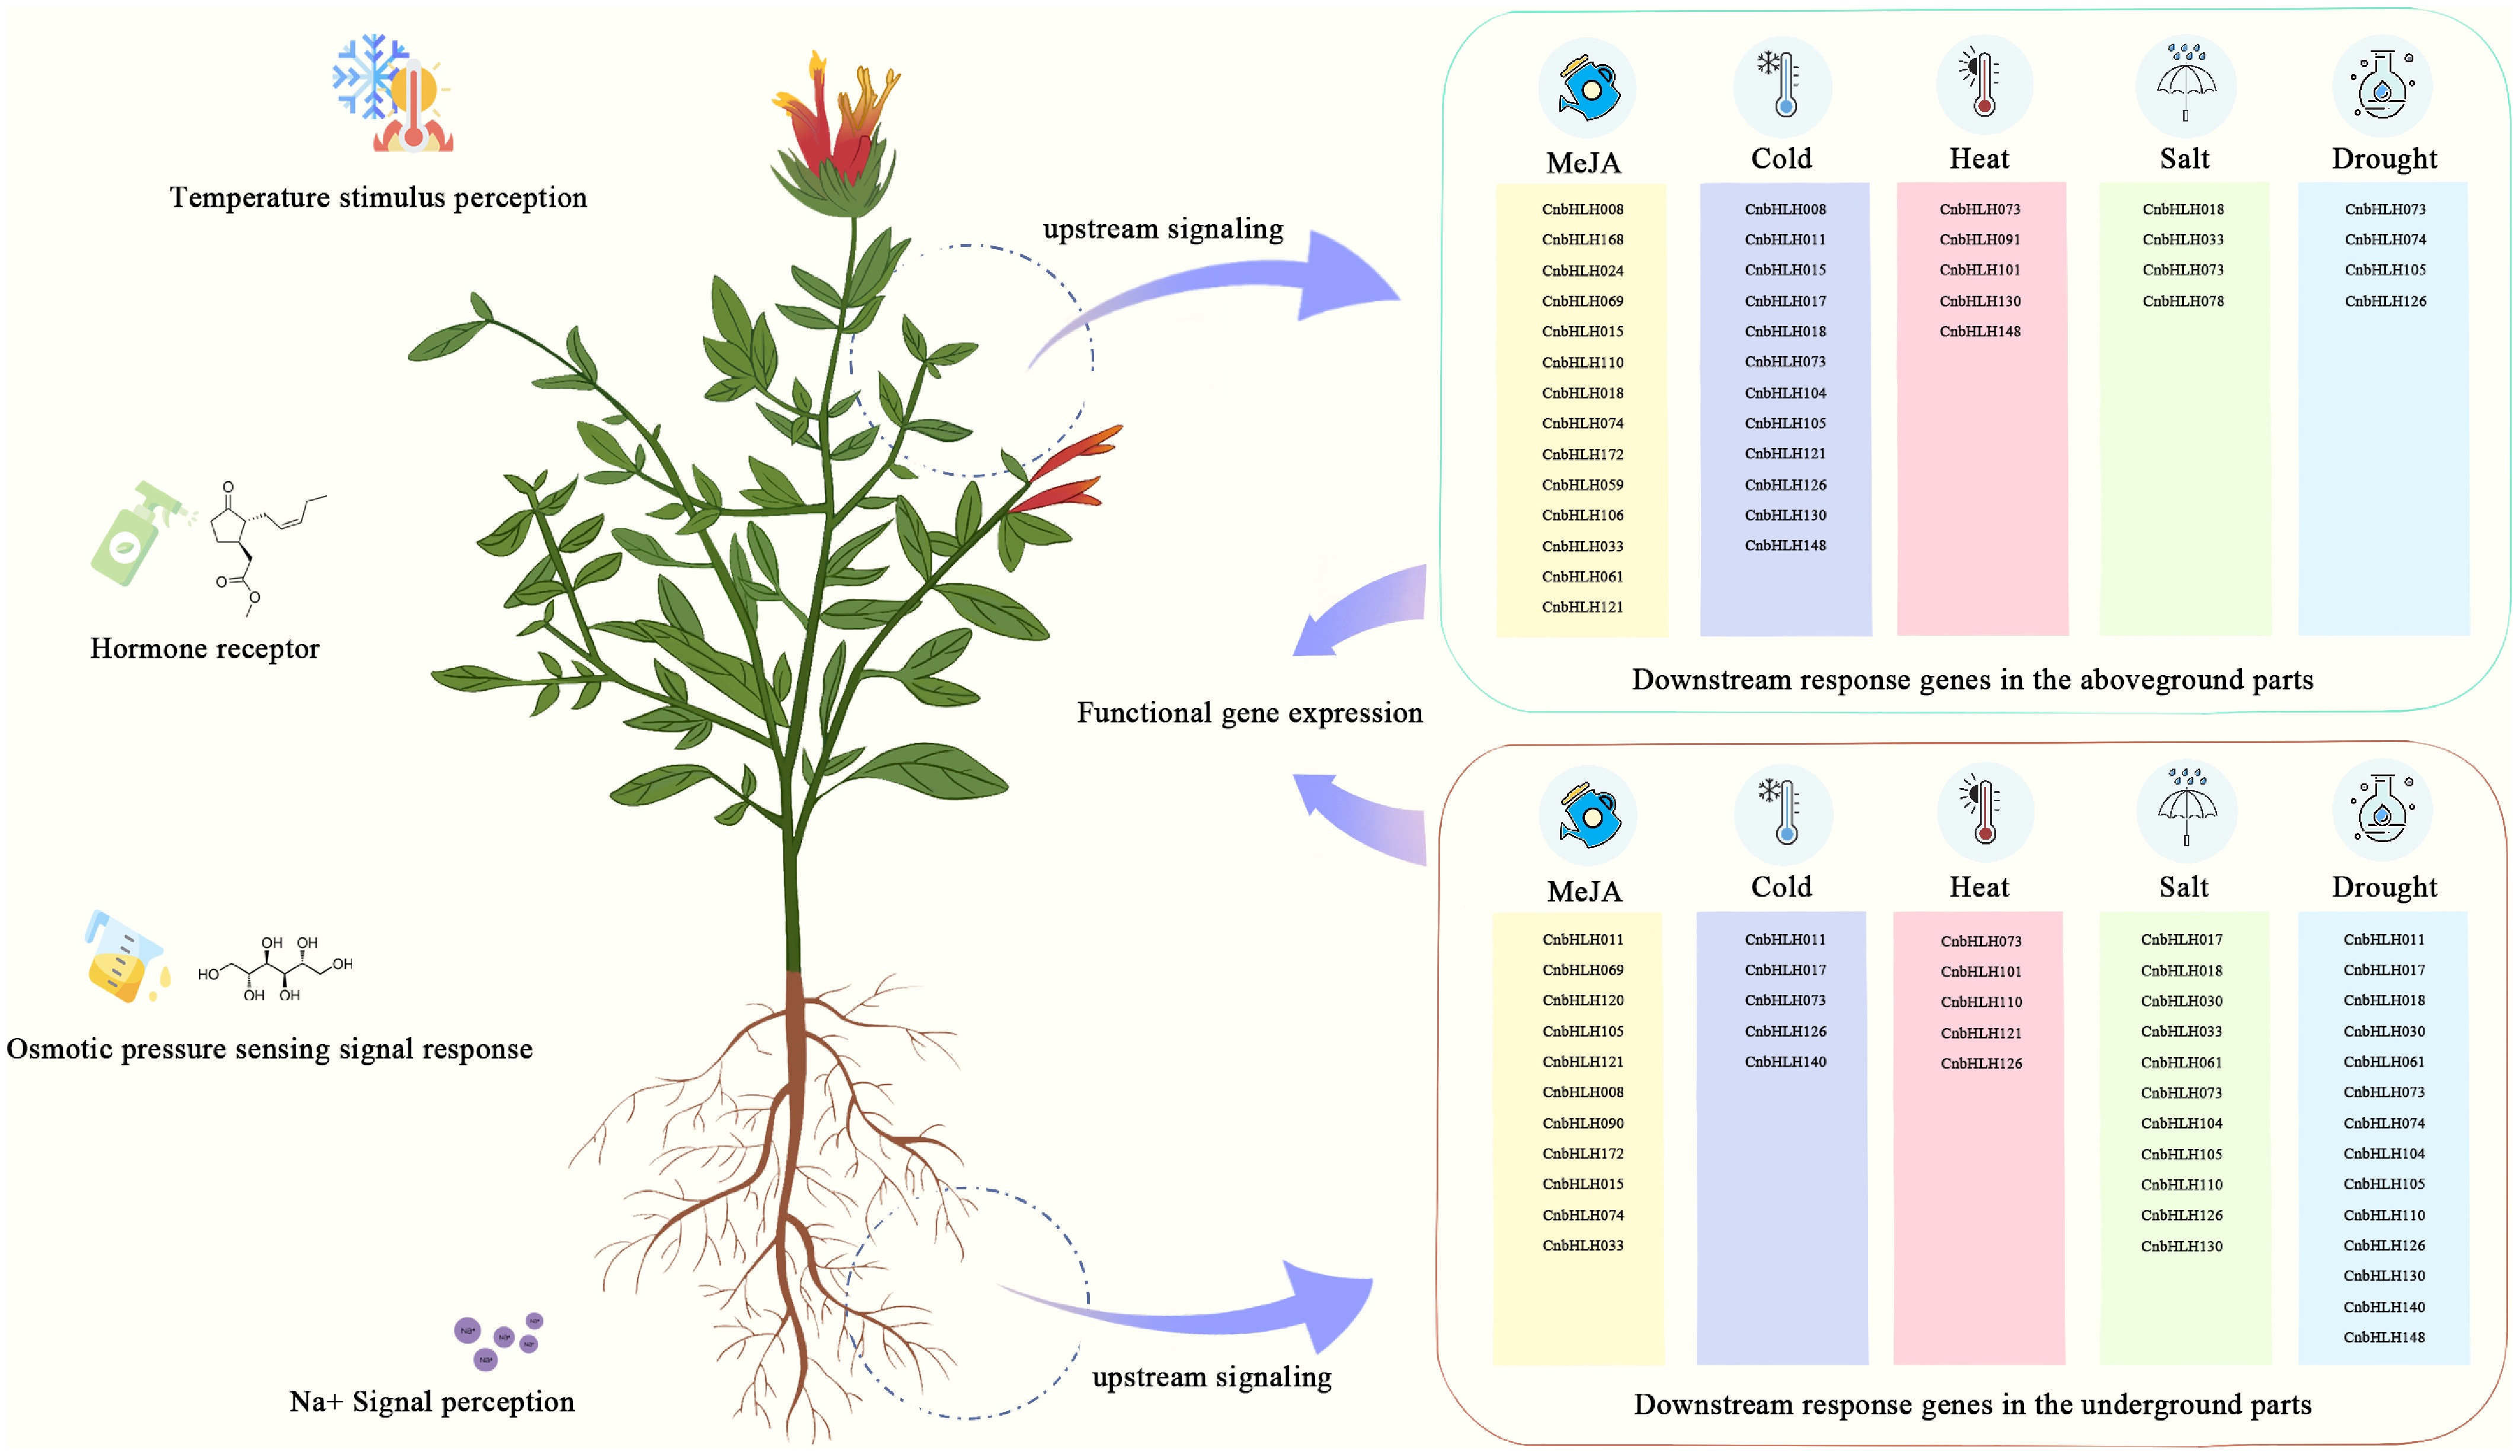
Figure 8.
Diagram showing the response pathways to different abiotic stresses mediated by various bHLHs in C. nutans.
Figures
(8)
Tables
(0)