-
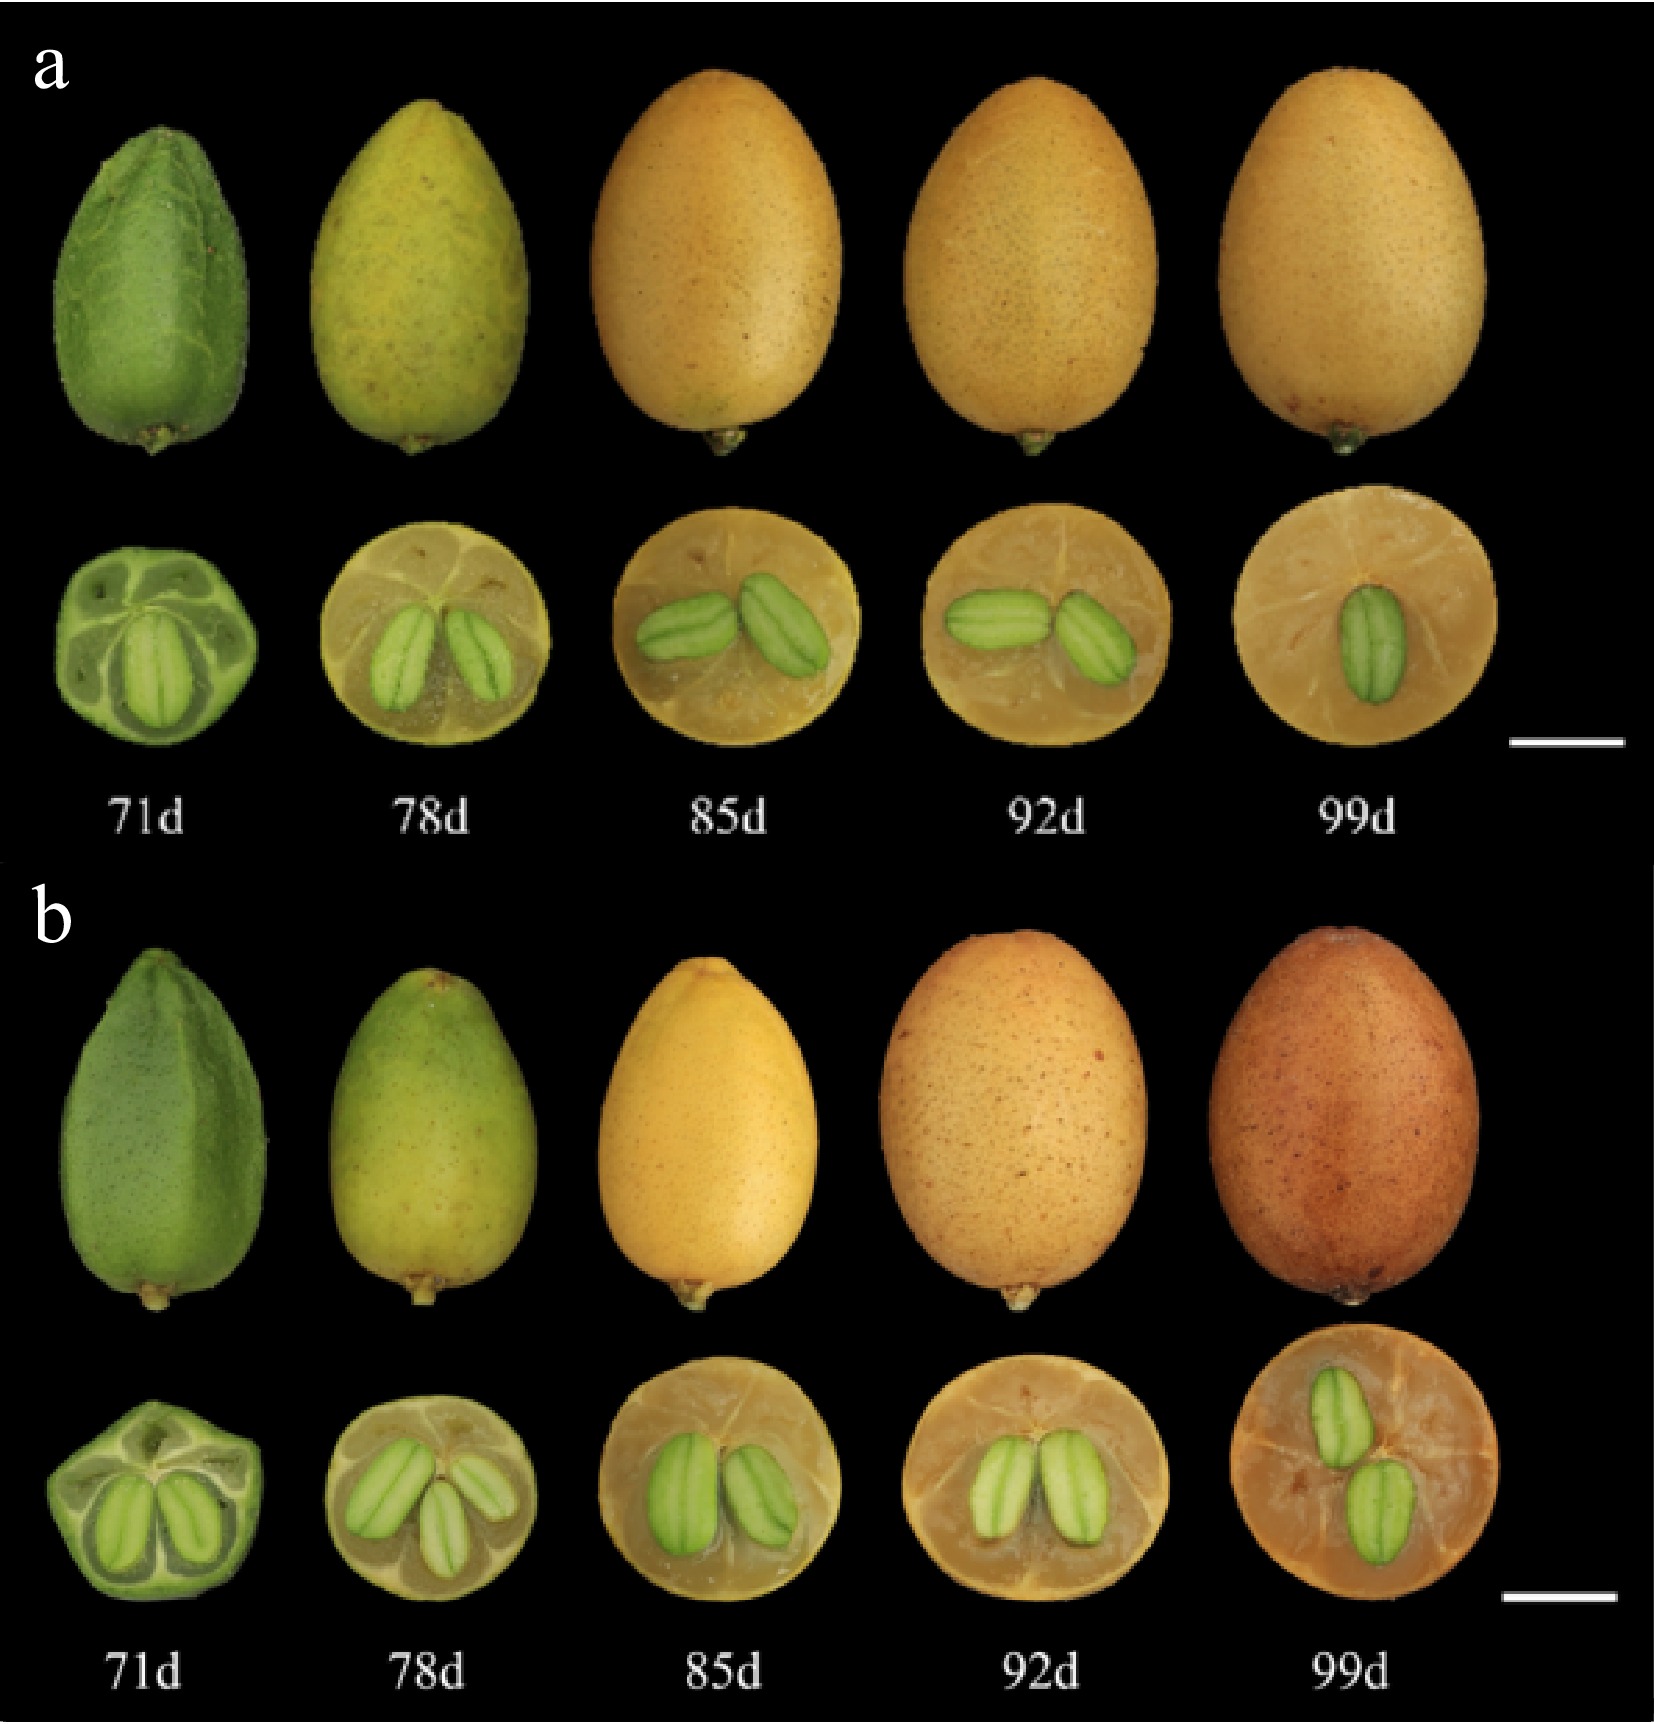
Figure 1.
Wampee fruits at different developmental stages and cross-sectional view of fruits. (a) 'Huami' wampee. (b) 'Jinjixin' wampee. d stands for days after bloom. Bar = 1 cm.
-
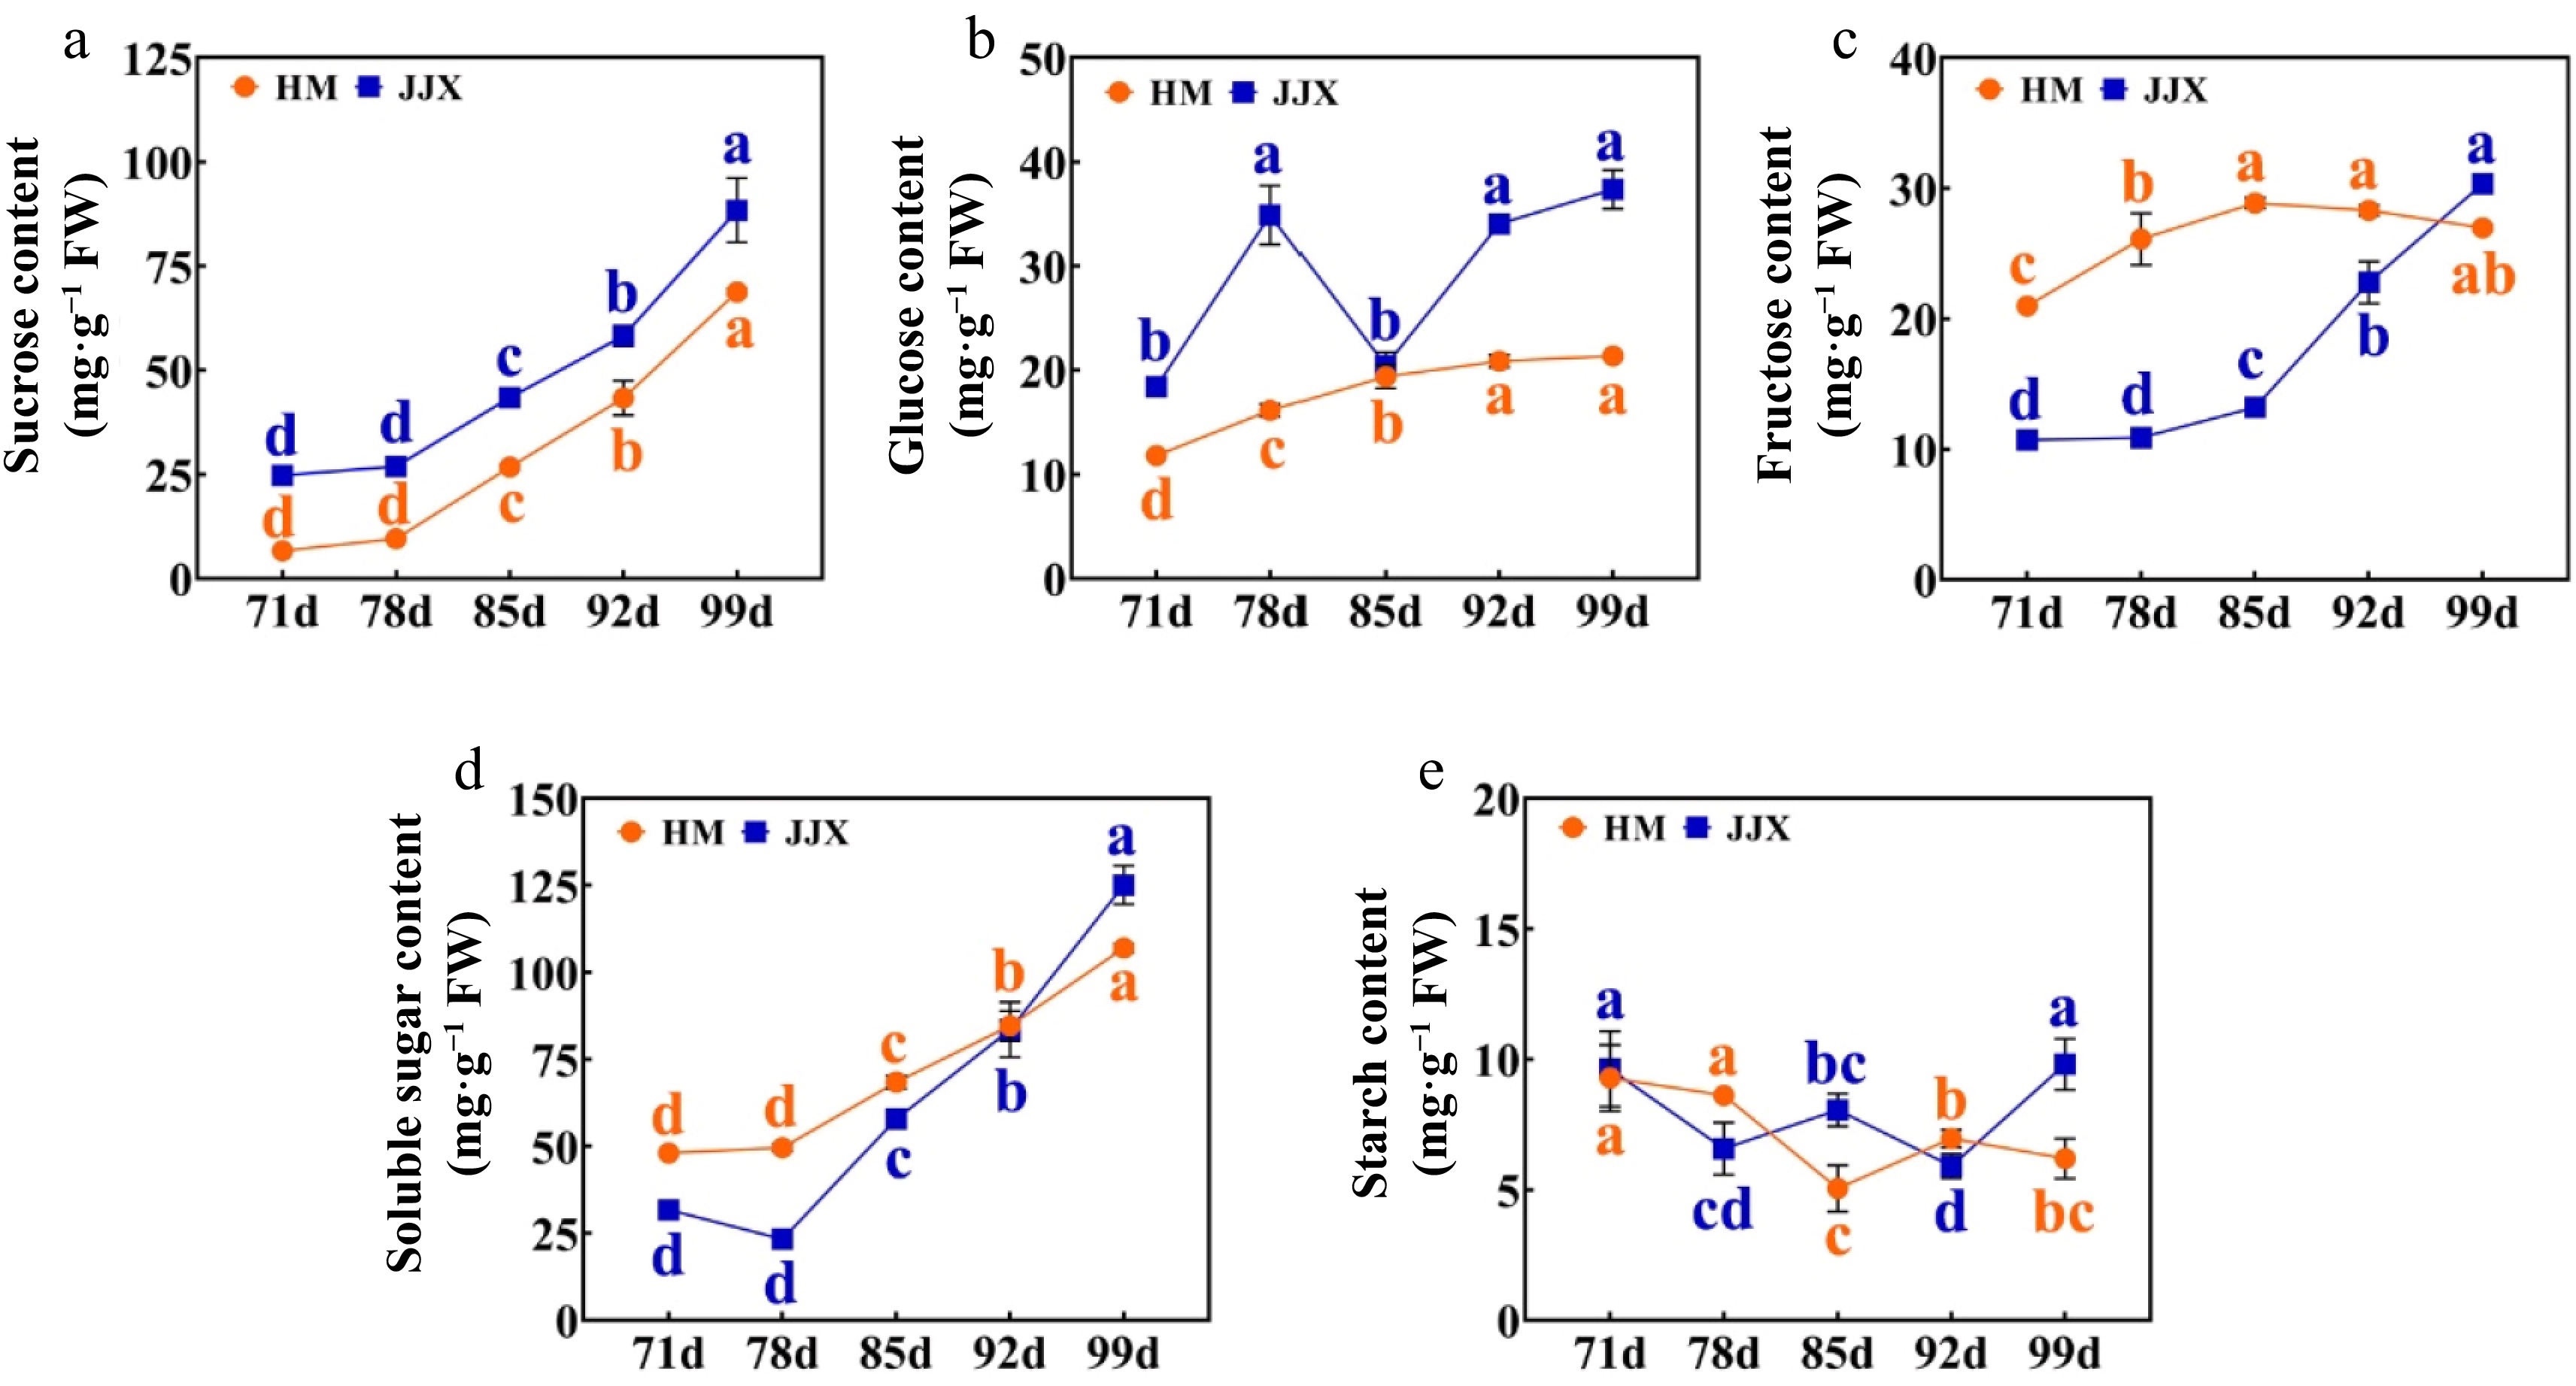
Figure 2.
Changes in sugar content of fruit during the development of wampee fruits. (a) Sucrose content. (b) Glucose content. (c) Fructose content. (d) Soluble sugar. (e) Starch content. HM stands for 'Huami' wampee; JJX stands for 'Jinjixin' wampee. d stands for days after bloom. Error bars represent the standard deviation of three biological replicates. Different lowercase letters represent the level of significance at p < 0.05 (one-way ANOVA with Waller-Duncan). Comparison was conducted at different stages of each cultivar.
-
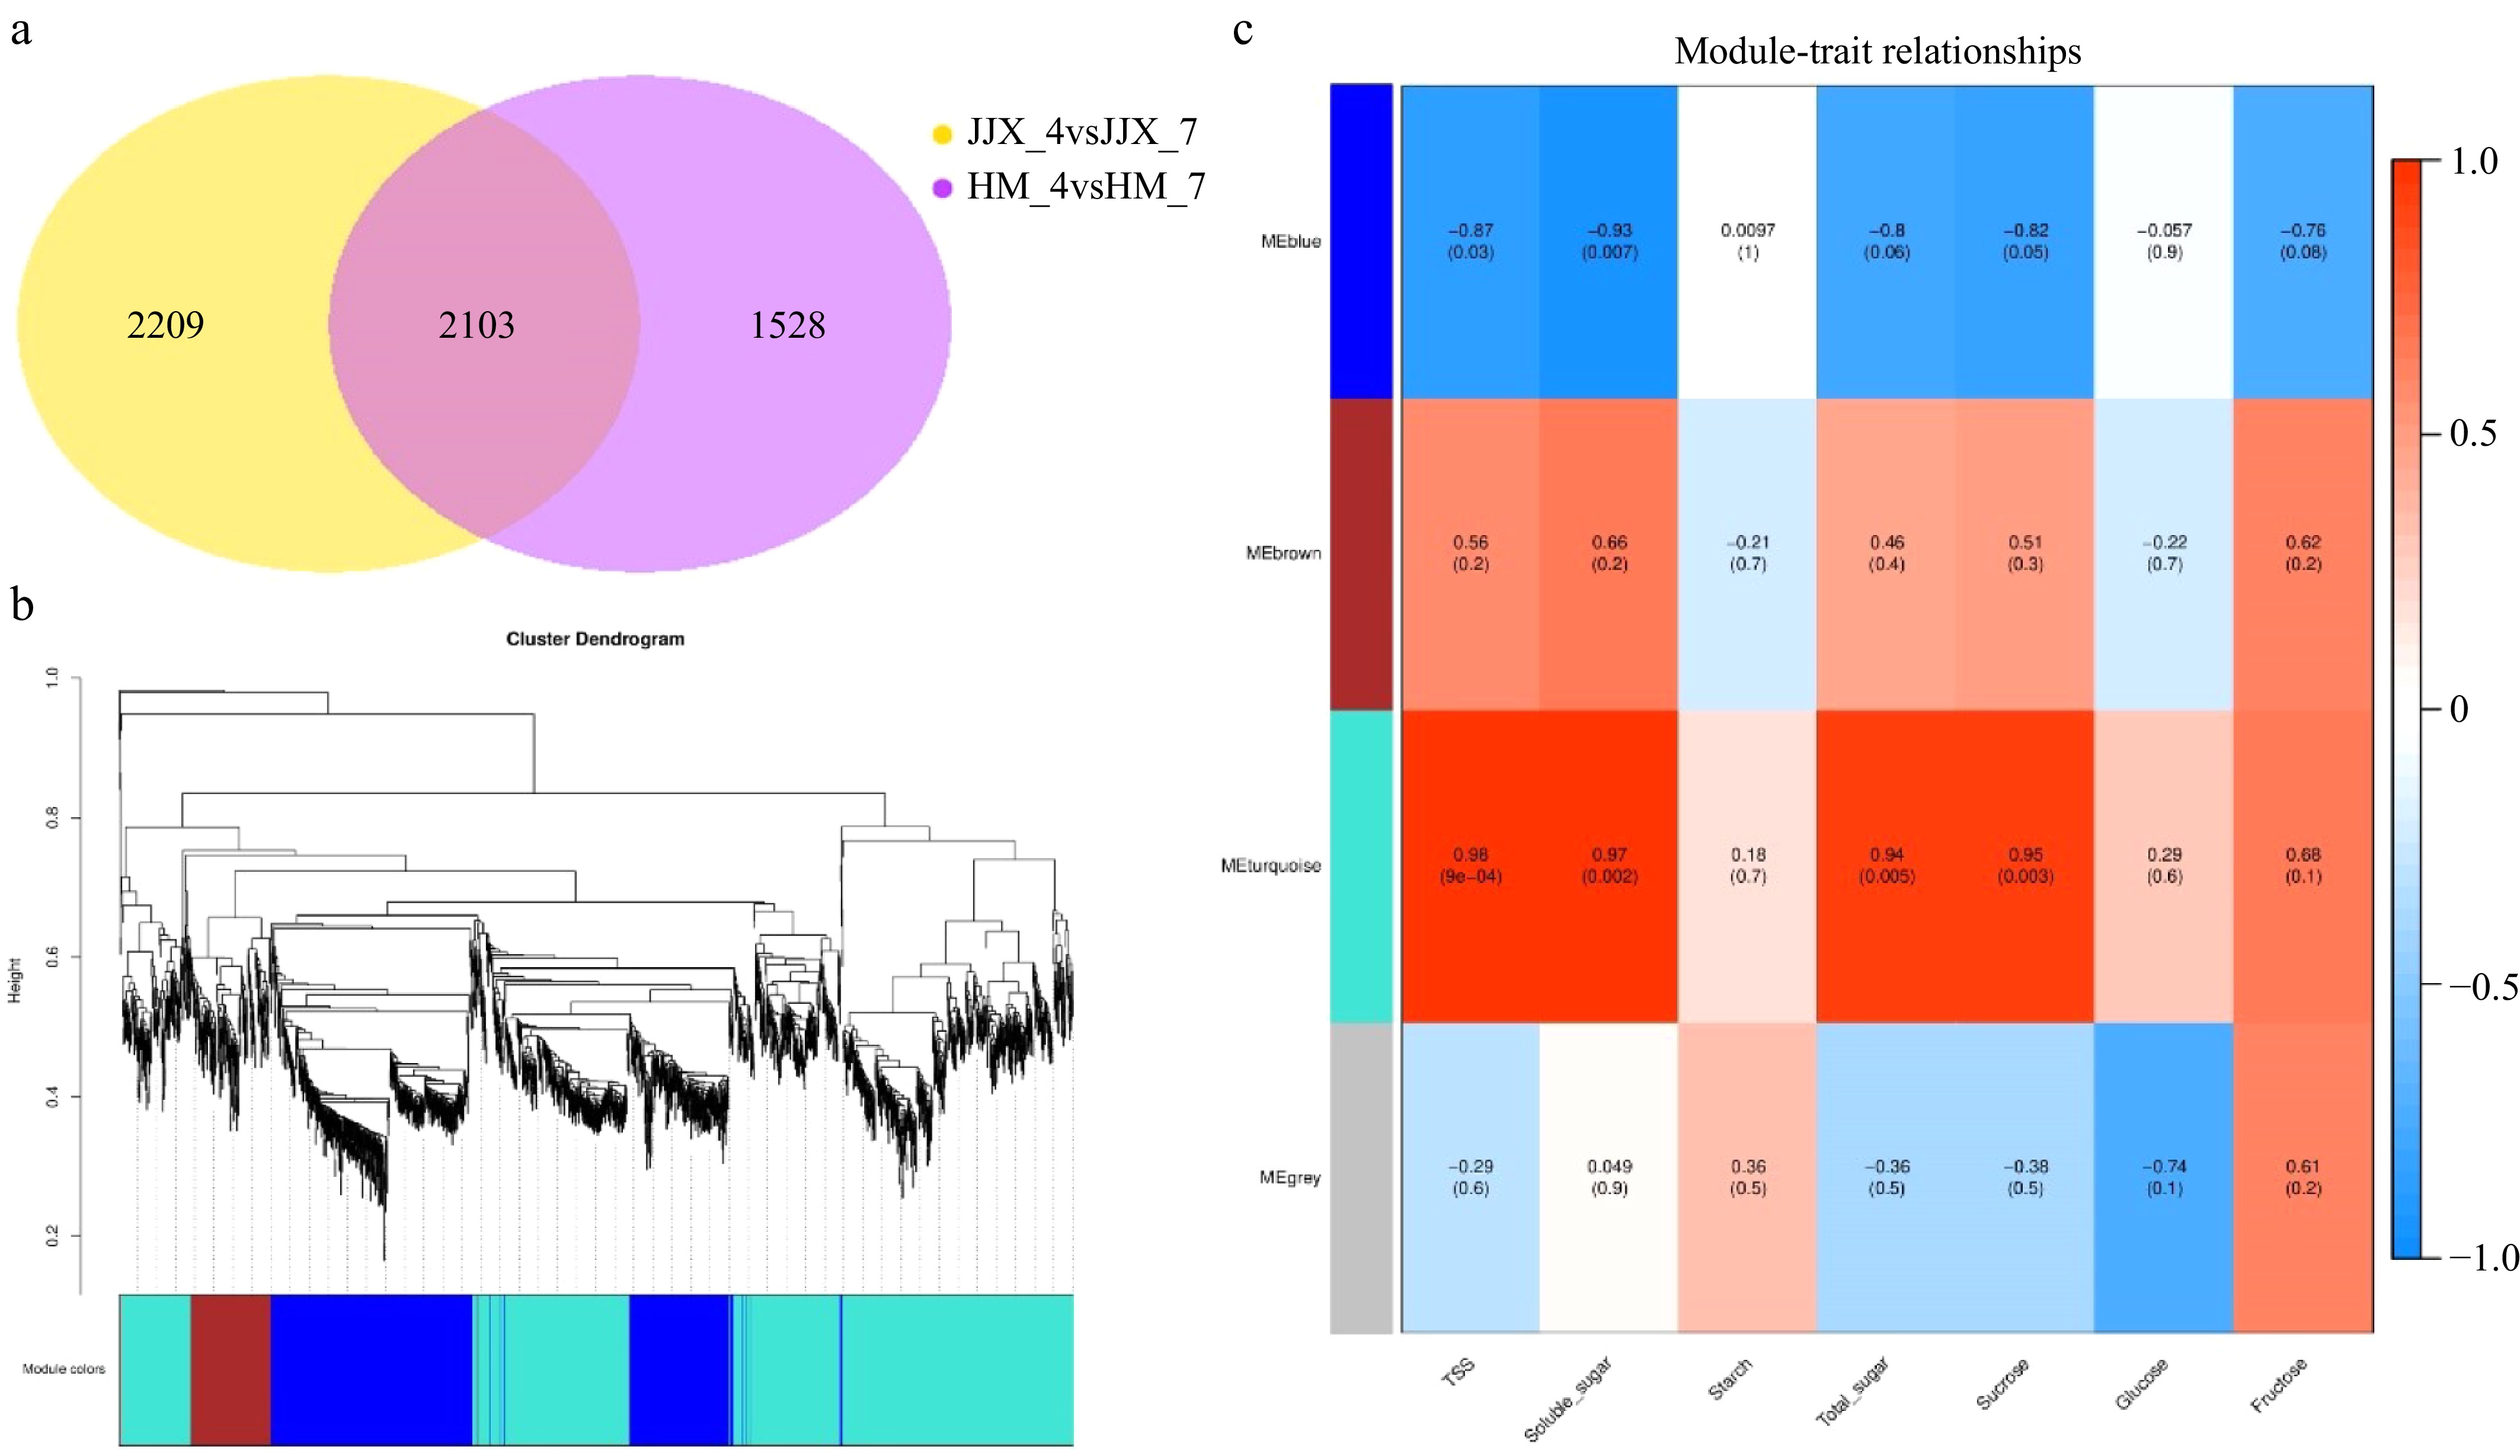
Figure 3.
Weighted gene co-expression network analysis (WGCNA) of differentially expressed genes in wampee fruits at 78 DAB and 99 DAB. (a) Venn diagram of differentially expressed genes. (b) Modular hierarchical clustering tree. (c) Module-trait correlation results plot (the upper number in the module represents the correlation coefficient r2 and the lower number represents the significance p. The color blue to red represents r2 from −1 to 1). HM_4 and HM_7 represent the 78 and 99 DAB 'Huami' wampee fruits, respectively; JJX_4, JJX_7 represent the 78 and 99 DAB 'Jinjixin' wampee fruits, respectively.
-
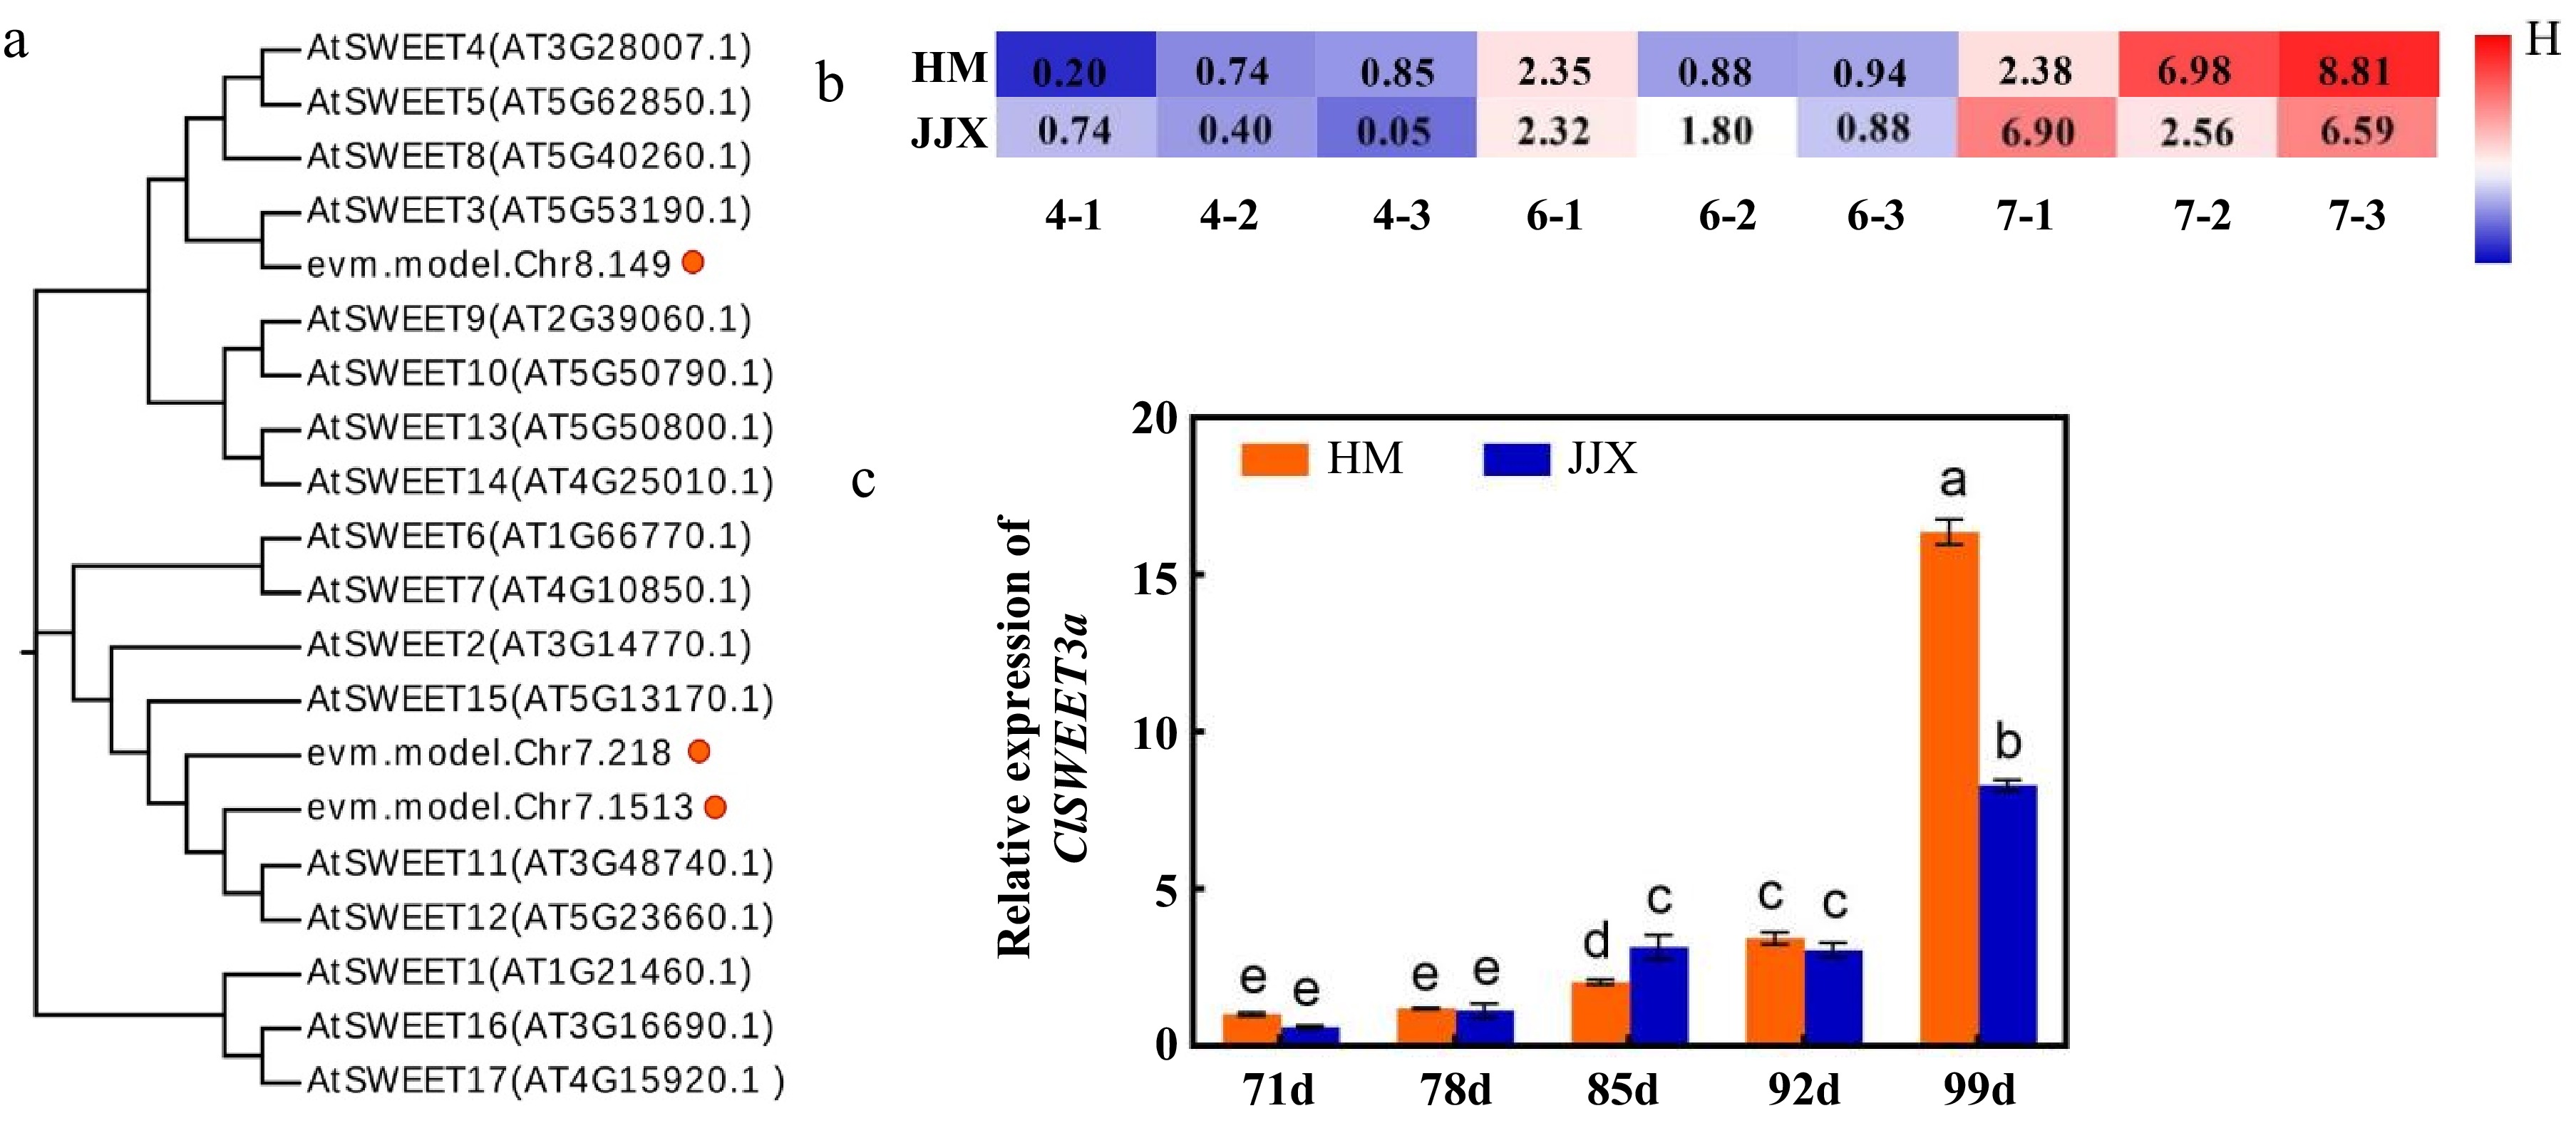
Figure 4.
Phylogenetic tree analysis of ClSWEET3a and expression patterns during fruit development. (a) ClSWEET3a gene and phylogenetic tree analysis of the SWEET family in Arabidopsis. (b) Expression levels of screened ClSWEET3a at different developmental stages of 'Huami' and 'Jinjixin' wampee. 4, 6, 7 represent wampee fruits at 78, 92, and 99 DAB, respectively. 1−3 means three replicates. (c) Expression pattern of ClSWEET3a during the development of wampee fruits. Comparison of the same varieties at different stages. Different lowercase letters represent significance levels at p < 0.05 (one-way ANOVA with Waller-Duncan). HM stands for 'Huami' wampee; JJX stands for 'Jinjixin' wampee. d stands for days after blooming. Error bars represent the standard deviation of three biological replicates.
-
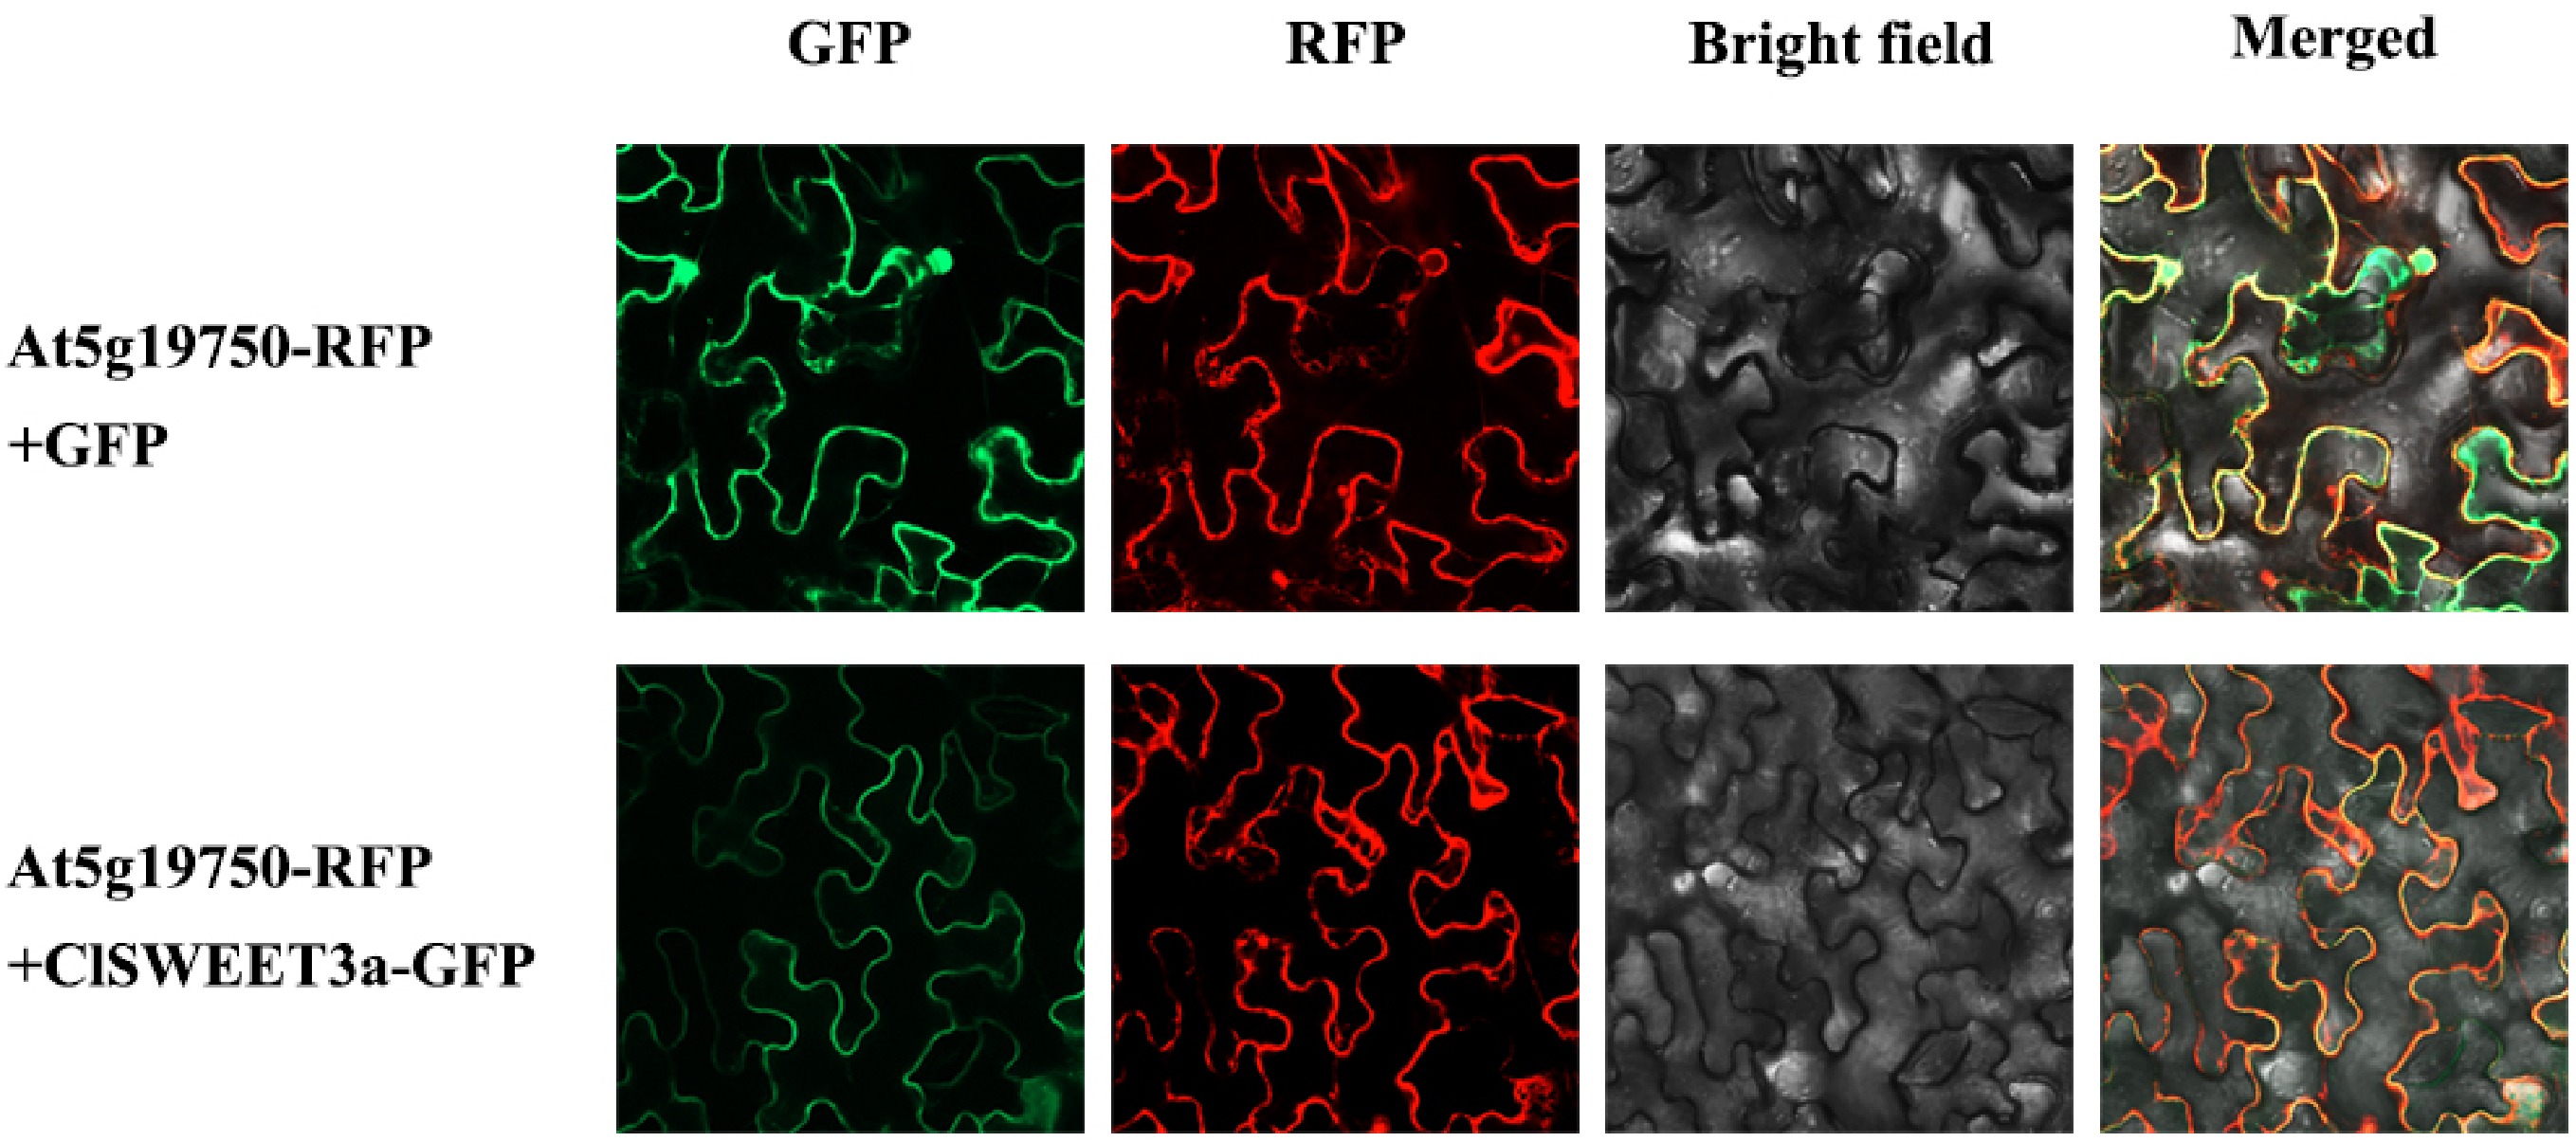
Figure 5.
Subcellular localization of ClSWEET3a in Nicotiana benthamiana. At5g19750-RFP, cytoplasmic 345 membrane marker; At5g19750-RFP + GFP, fusion of At5g19750-RFP and pC18-GFP; At5g19750-346 RFP + ClSWEET3a-GFP, fusion of At5g19750-RFP and ClSWEET3a-GFP. Bar = 20 μm.
-
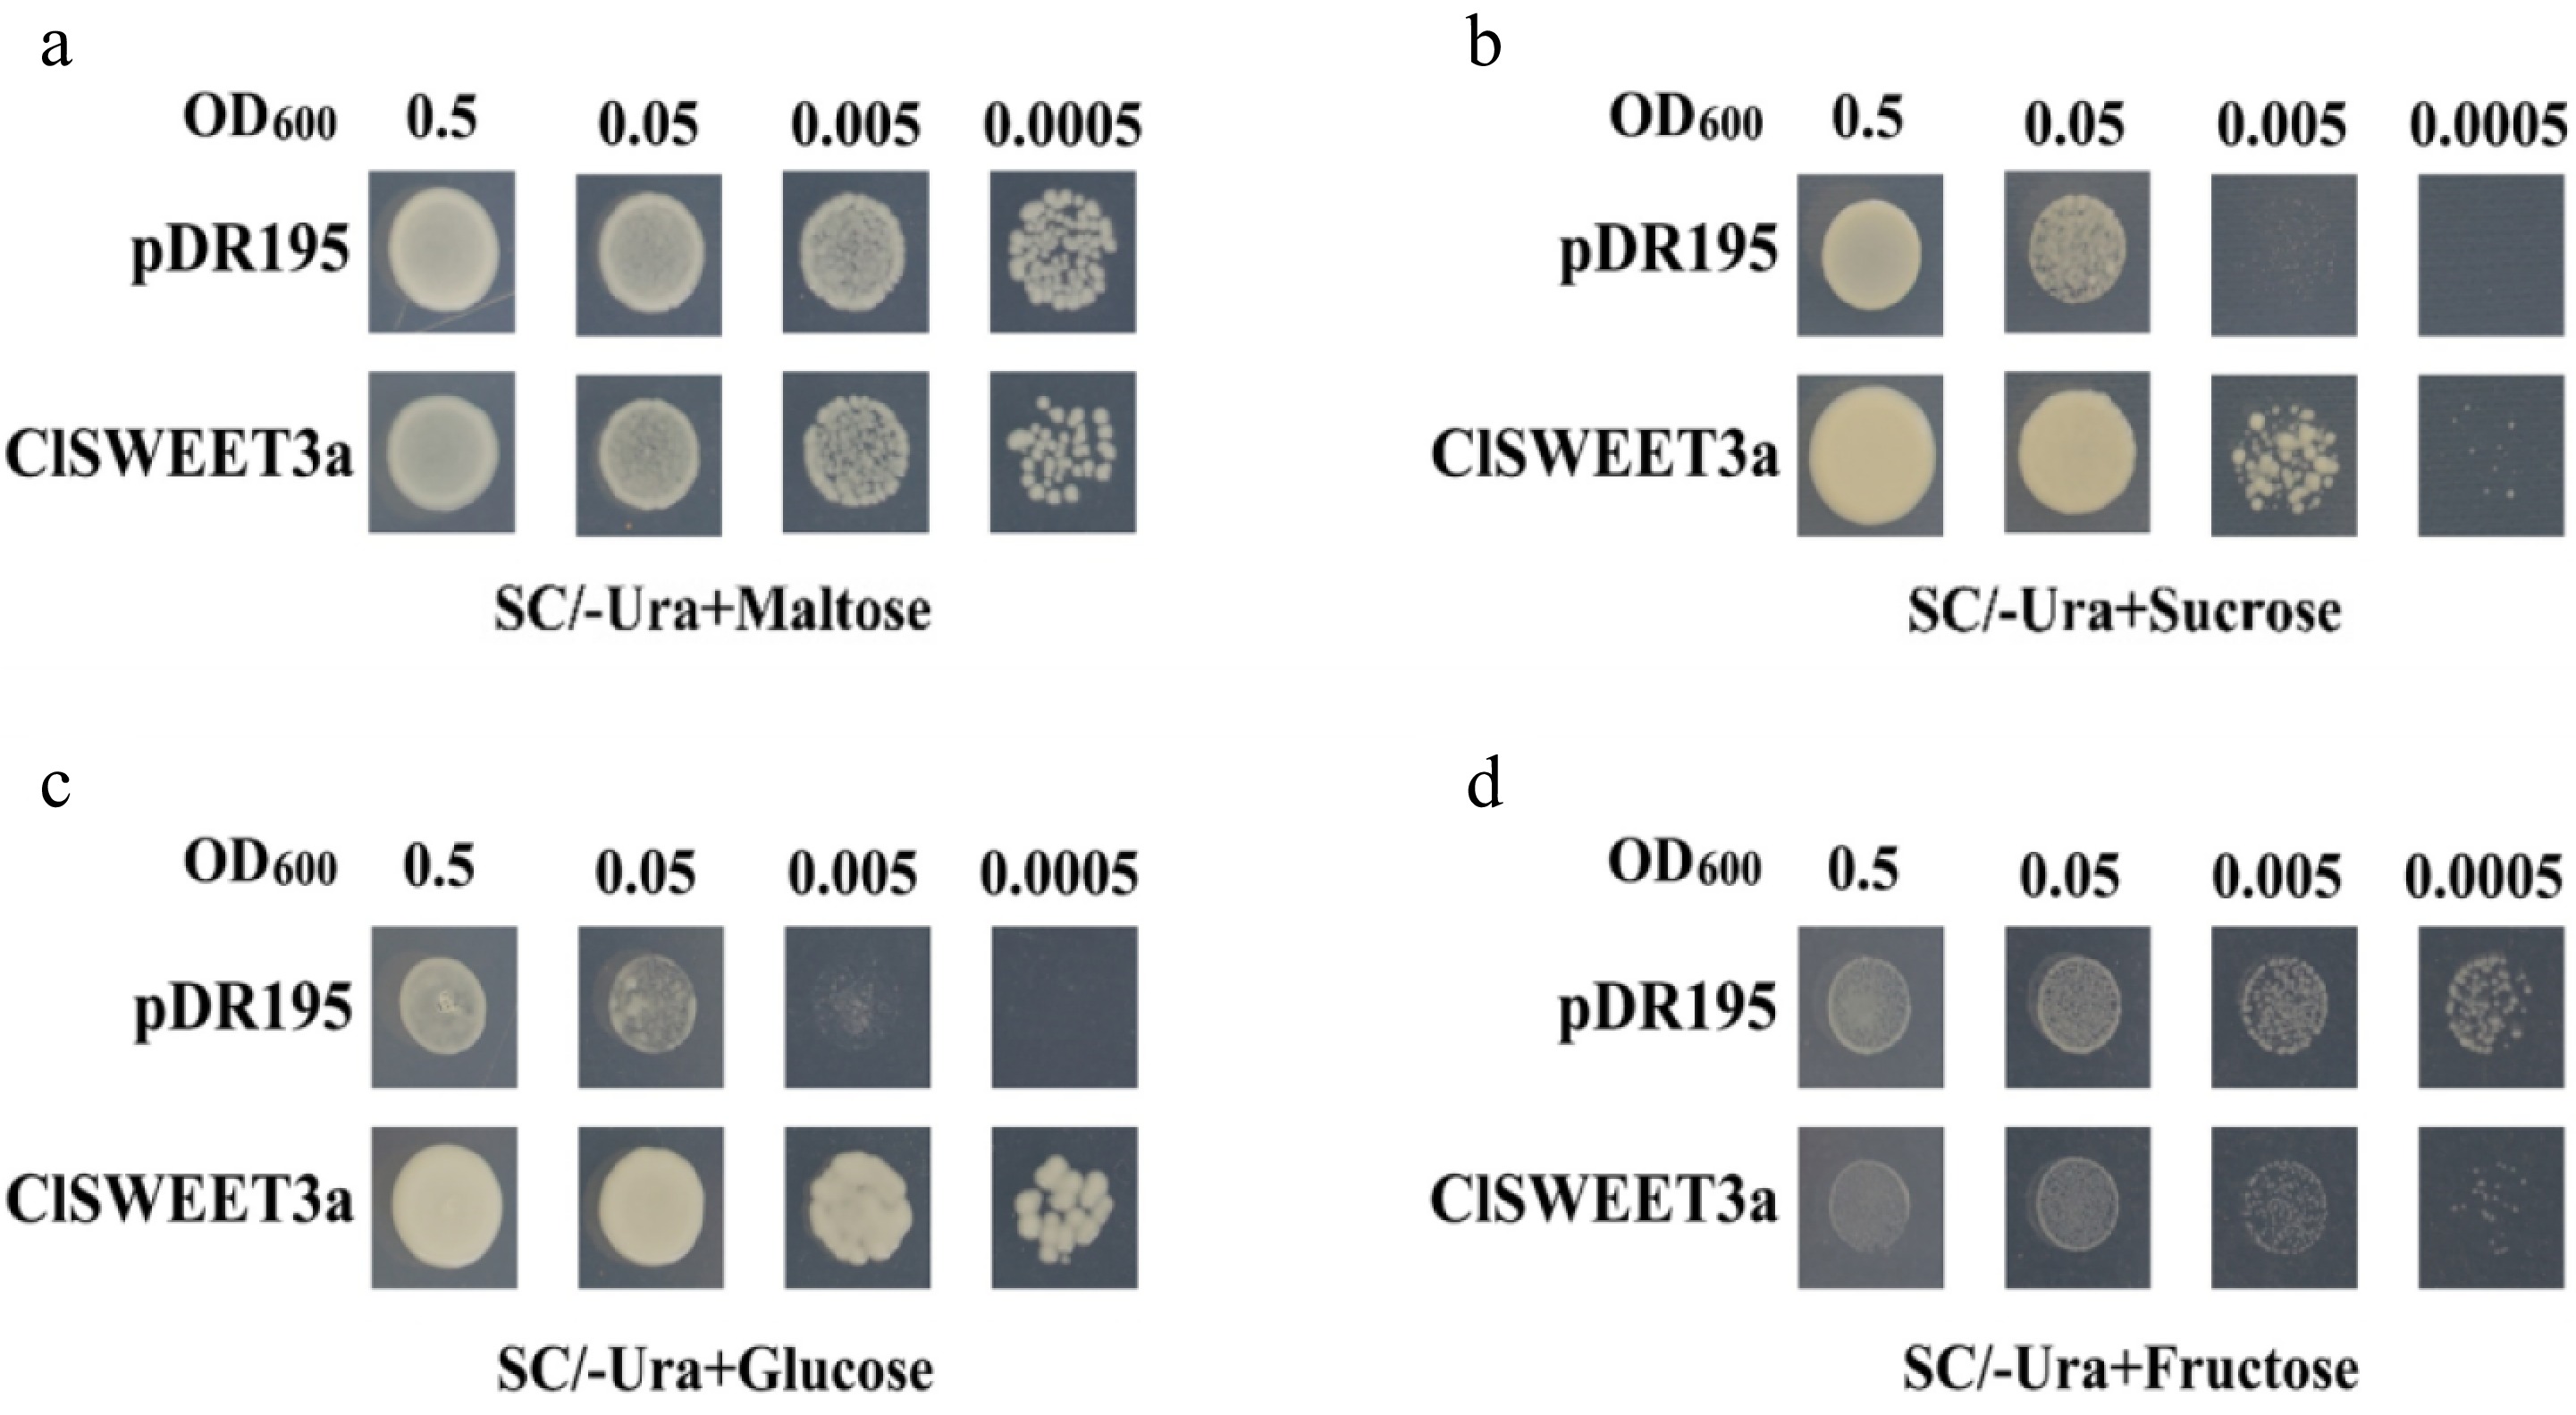
Figure 6.
Transport properties of ClSWEET3a in the yeast EBY.VW4000. (a) The growth of EBY.VW4000 on selection medium with 2% maltose as the sole carbon source. (b) The growth of EBY.VW4000 on selection medium with 2% sucrose as the sole carbon source. (c) The growth of EBY.VW4000 on selection medium with 2% glucose as the sole carbon source. (d) The growth of EBY.VW4000 on selection medium with 2% fructose as the sole carbon source. pDR195 as a negative control. OD600 indicates the absorbance value of the bacterial fluids at 600 nm.
-
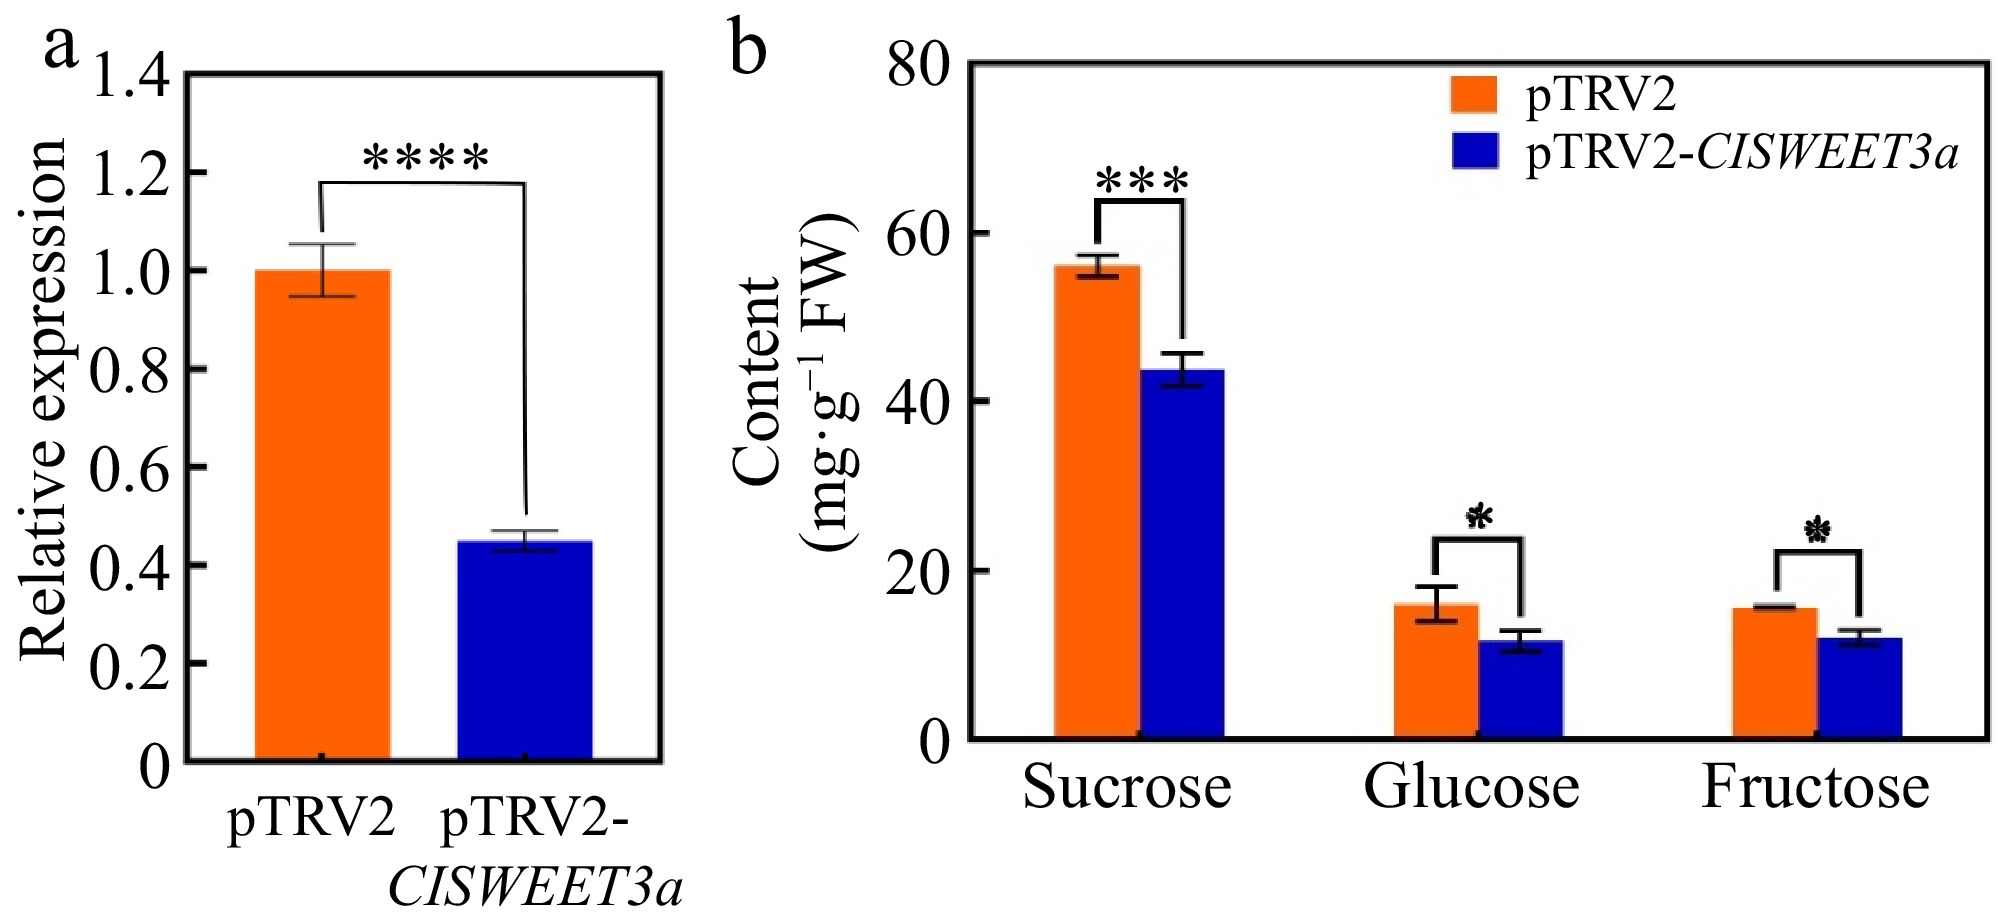
Figure 7.
Transient silencing of ClSWEET3a expression in wampee fruits. (a) Relative expression of ClSWEET3a in wampee fruits after transient silencing of ClSWEET3a. (b) Sucrose, glucose, and sucrose contents of wampee fruits after transient silencing of ClSWEET3a. * p < 0.05; ** p < 0.01; *** p < 0.001; **** p < 0.0001; t-test.
-
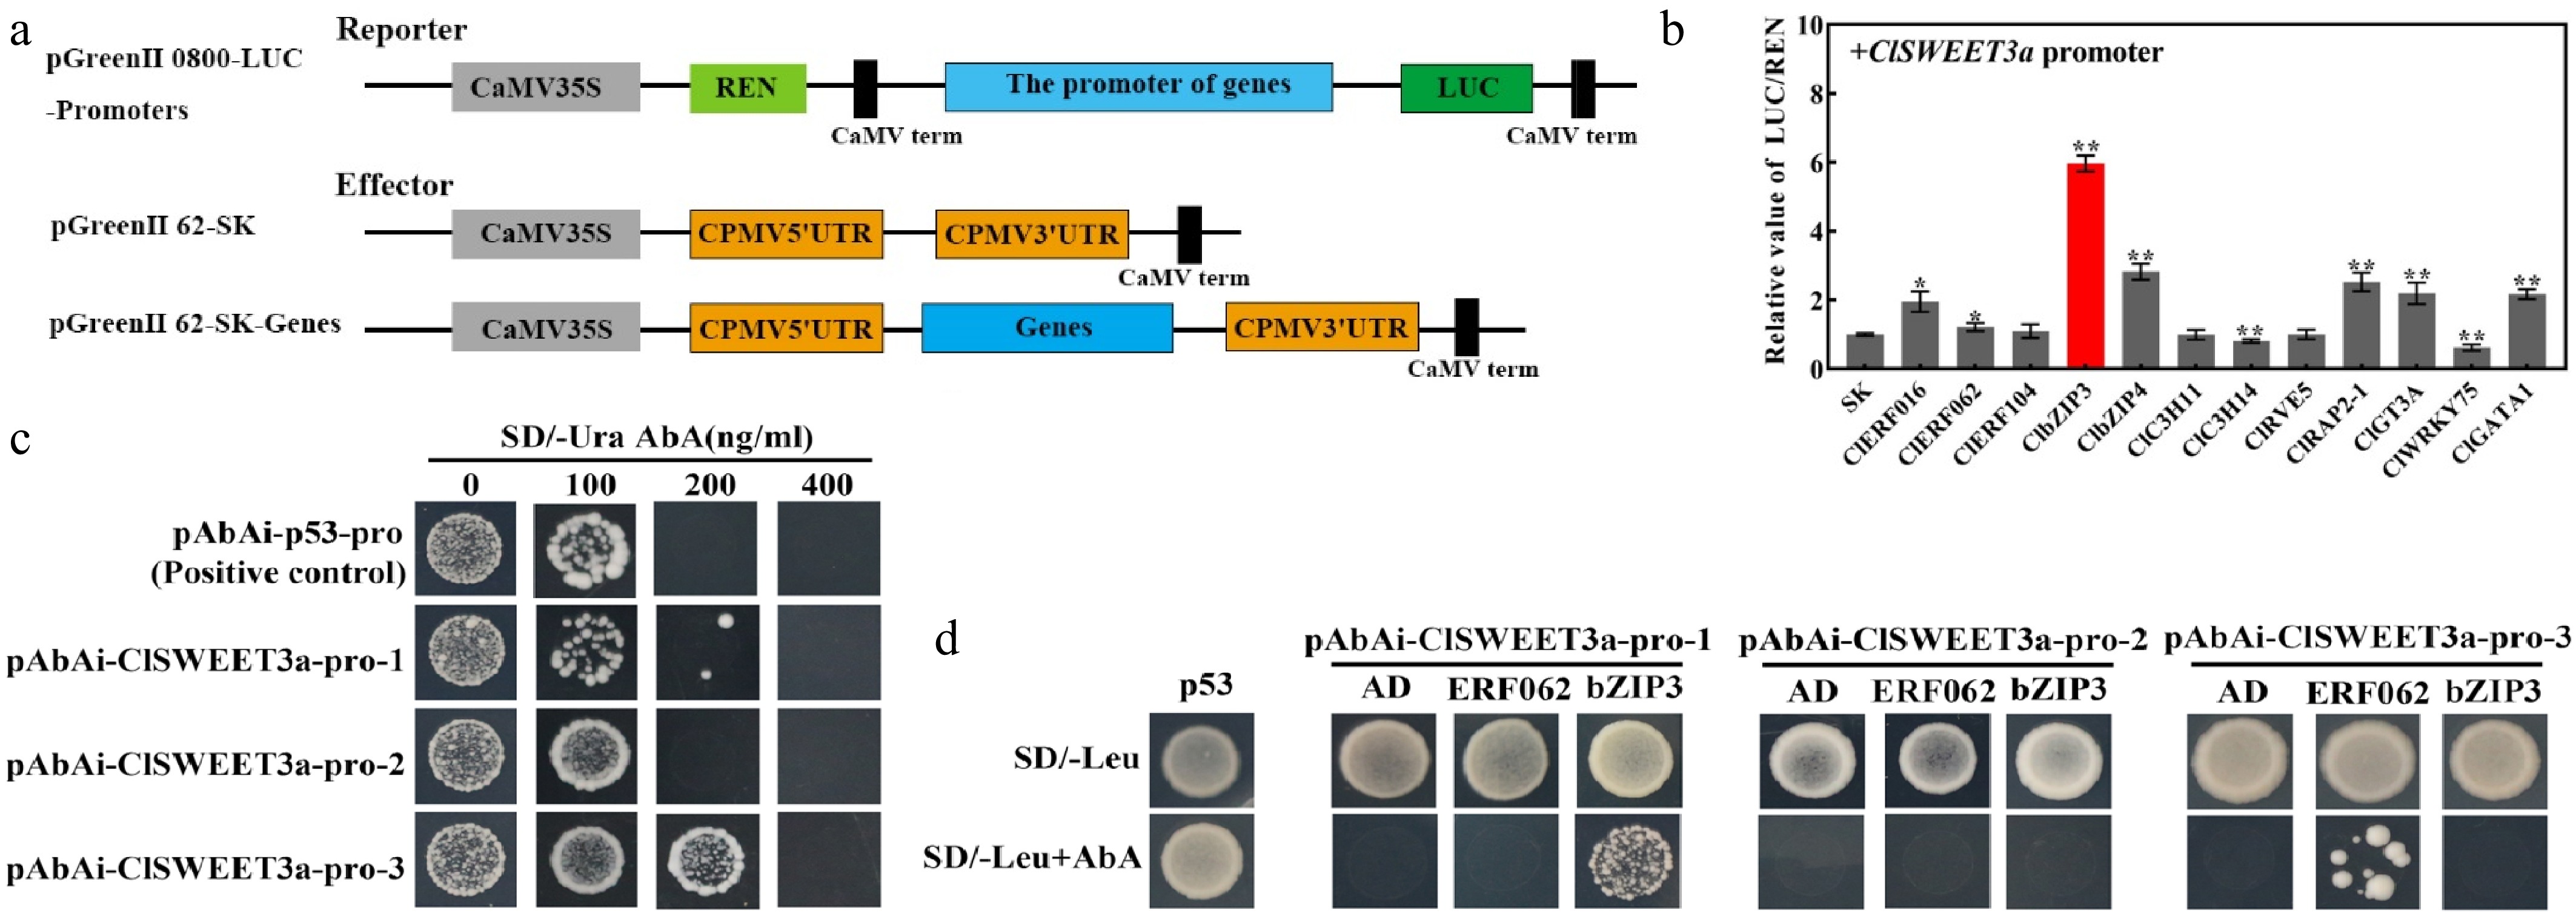
Figure 8.
Transcriptional regulation of ClSWEET3a by transcription factors and analysis of promoter interactions between transcription factor (ClbZIP3 and ClERF062) and ClSWEET3a. (a) Vector diagrams of Reporter and Effector. (b) Transcriptional regulation of the ClSWEET3a promoter by 12 transcription factors. The red bar represents the combination with the largest LUC/REN ratio. The LUC/REN ratio of the empty p62-SK vector was used as a control (set as 1). (c) Bait yeast AbAr expression level assay. (d) ClbZIP3 and ClERF062 binding to the promoter of ClSWEET3a. p53 was used as a positive control. AD was used as a negative control. Significance was analyzed by t-test. Error bars represent the standard deviation of three biological replicates. * p < 0.05; ** p < 0.01; one-way ANOVA with Waller-Duncan.
-
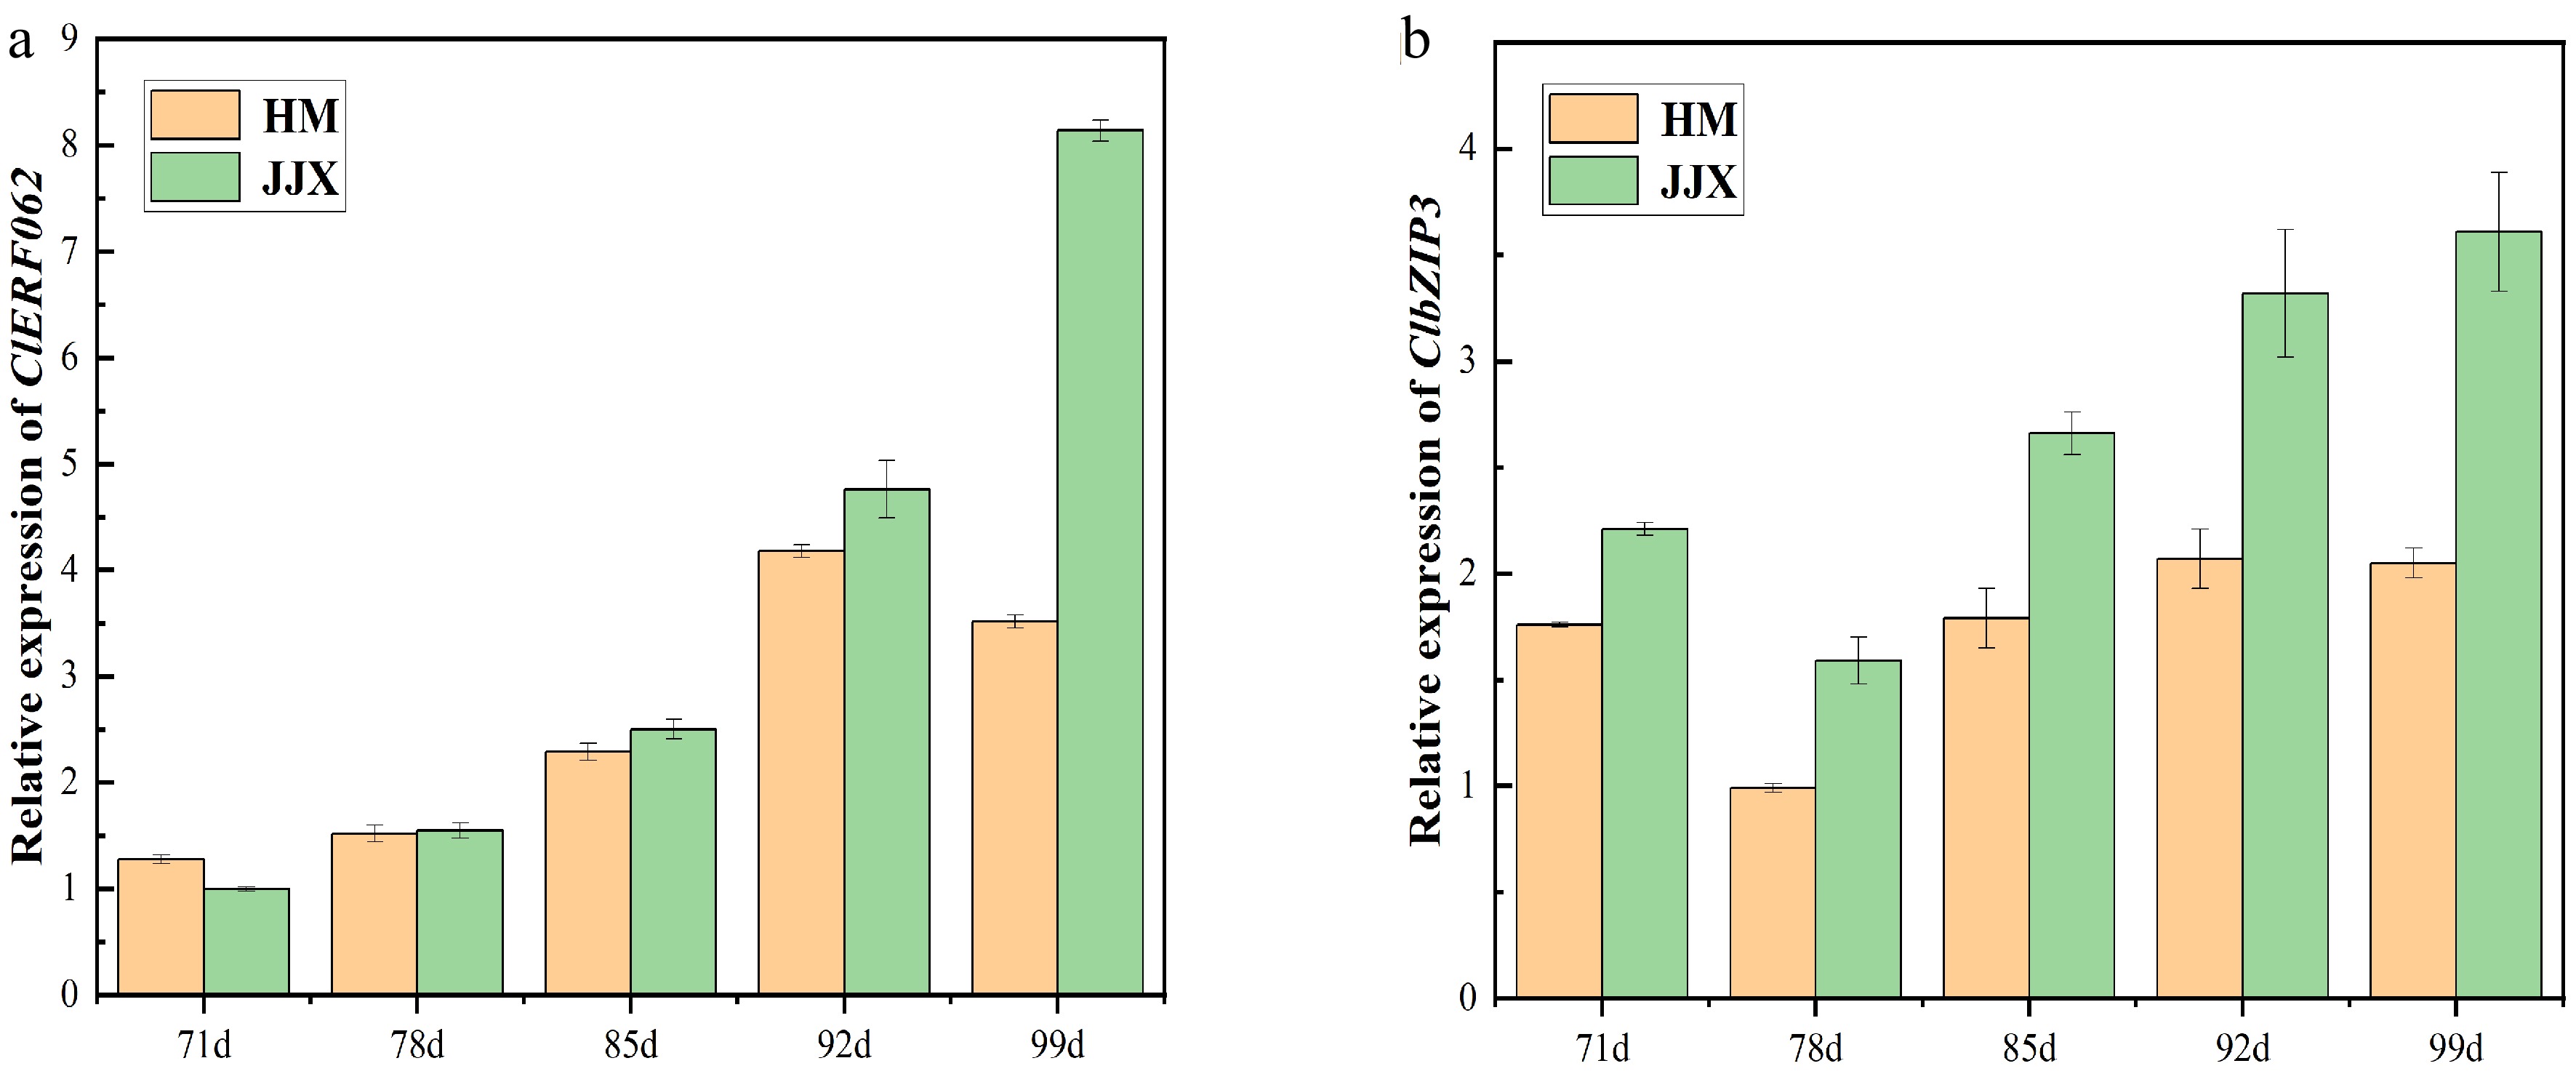
Figure 9.
The expression level of ClbZIP3 and ClERF062 during fruit development by qRT-PCR. (a)Expression of ClERF062; (b) expression of ClbZIP3. HM stands for 'Huami' wampee. JJX stands for 'Jinjixin' wampee. d stands for days after bloom.
-
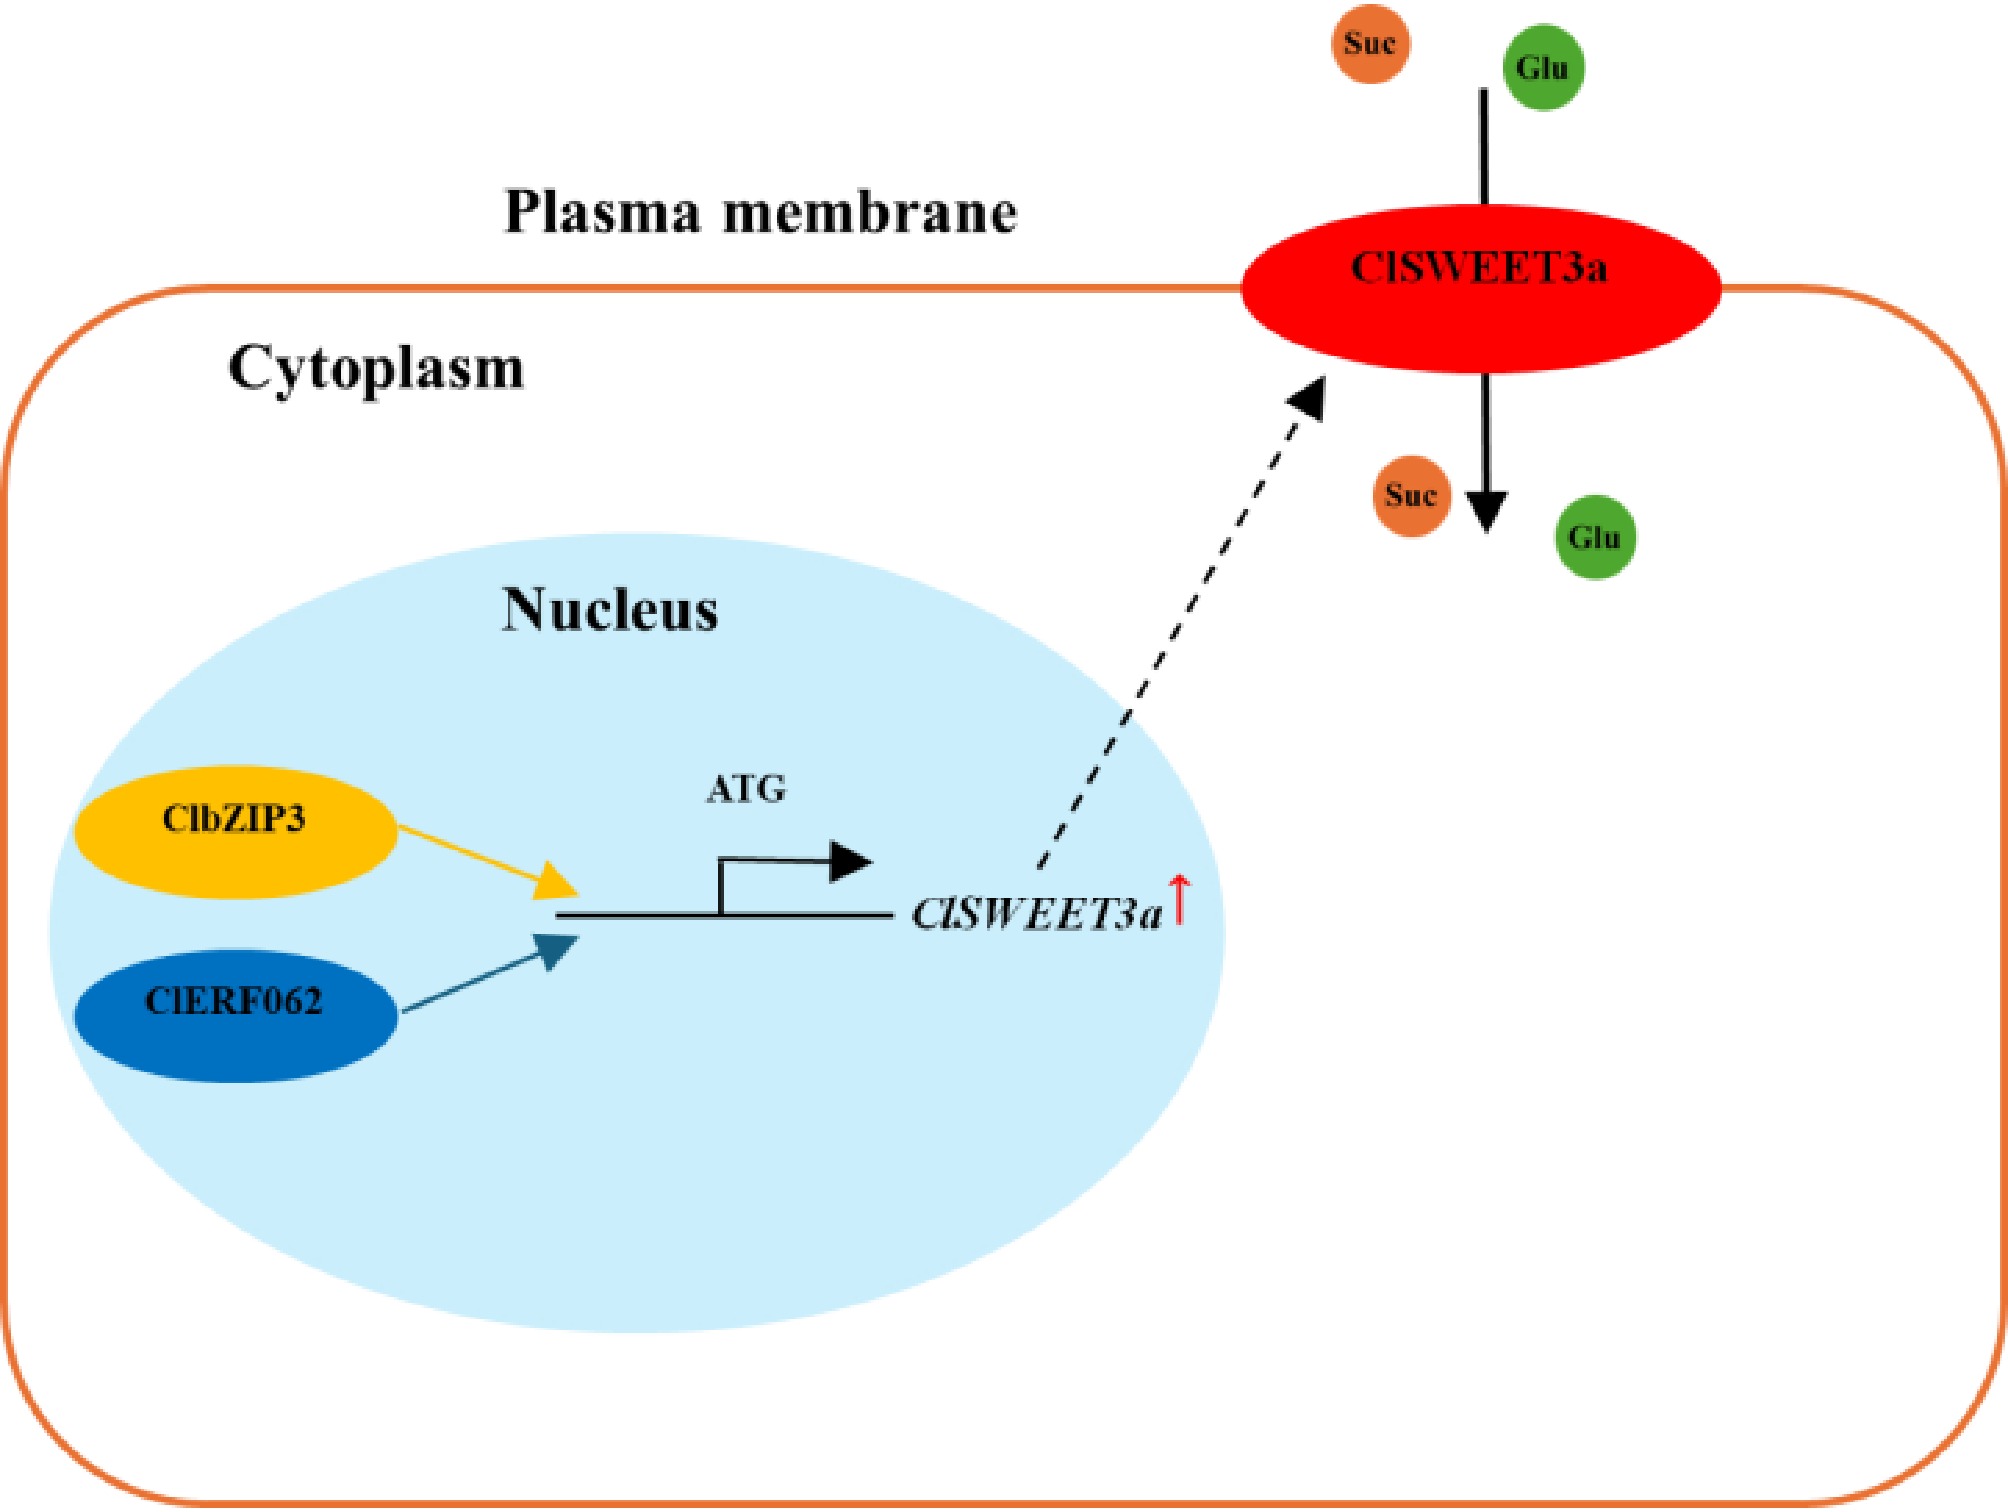
Figure 10.
Proposed model of ClbZIP3 and ClERF062 regulation of ClSWEET3a-mediated sugar accumulation in wampee fruits.
-
Varieties Categories Soluble sugar Sucrose Glucose Fructose HM Soluble sugar 1 0.999** 0.857* 0.549 Sucrose 0.999** 1 0.849* 0.535 Glucose 0.857* 0.849* 1 0.898* Fructose 0.549 0.535 0.898* 1 JJX Soluble sugar 1 0.993** 0.520 0.977** Sucrose 0.993** 1 0.592 0.979** Glucose 0.520 0.592 1 0.661 Fructose 0.977** 0.979** 0.661 1 HM stands for 'Huami' wampee; JJX stands for 'Jinjixin' wampee. * significant difference (p < 0.05); ** extremely significant difference (p < 0.01); t-test. Table 1.
Correlation analysis of total soluble sugars with sugar component content in HM and JJX.
-
Gene ID Correlation coefficient r2 Annotation evm.model.Chr8.149 0.855* Bidirectional sugar transporter SWEET3 OS = Arabidopsis thaliana OX = 3702 GN = SWEET3 PE = 1 SV = 1 * Significant difference (p < 0.05); t-test. Table 2.
Correlation between genes and soluble total sugar content and their annotations in the reference genome.
-
Varieties Gene Total soluble sugar Sucrose Glucose Fructose HM ClSWEET3a 0.876 0.894* 0.591 0.229 JJX ClSWEET3a 0.947* 0.969** 0.534 0.911* HM stands for 'Huami' wampee. JJX stands for 'Jinjixin' wampee. * Significant difference (p < 0.05); ** extremely significant difference (p < 0.01); t-test. Table 3.
Correlation analysis of ClSWEET3a expression level with total soluble sugar and sugar component content.
Figures
(10)
Tables
(3)