-
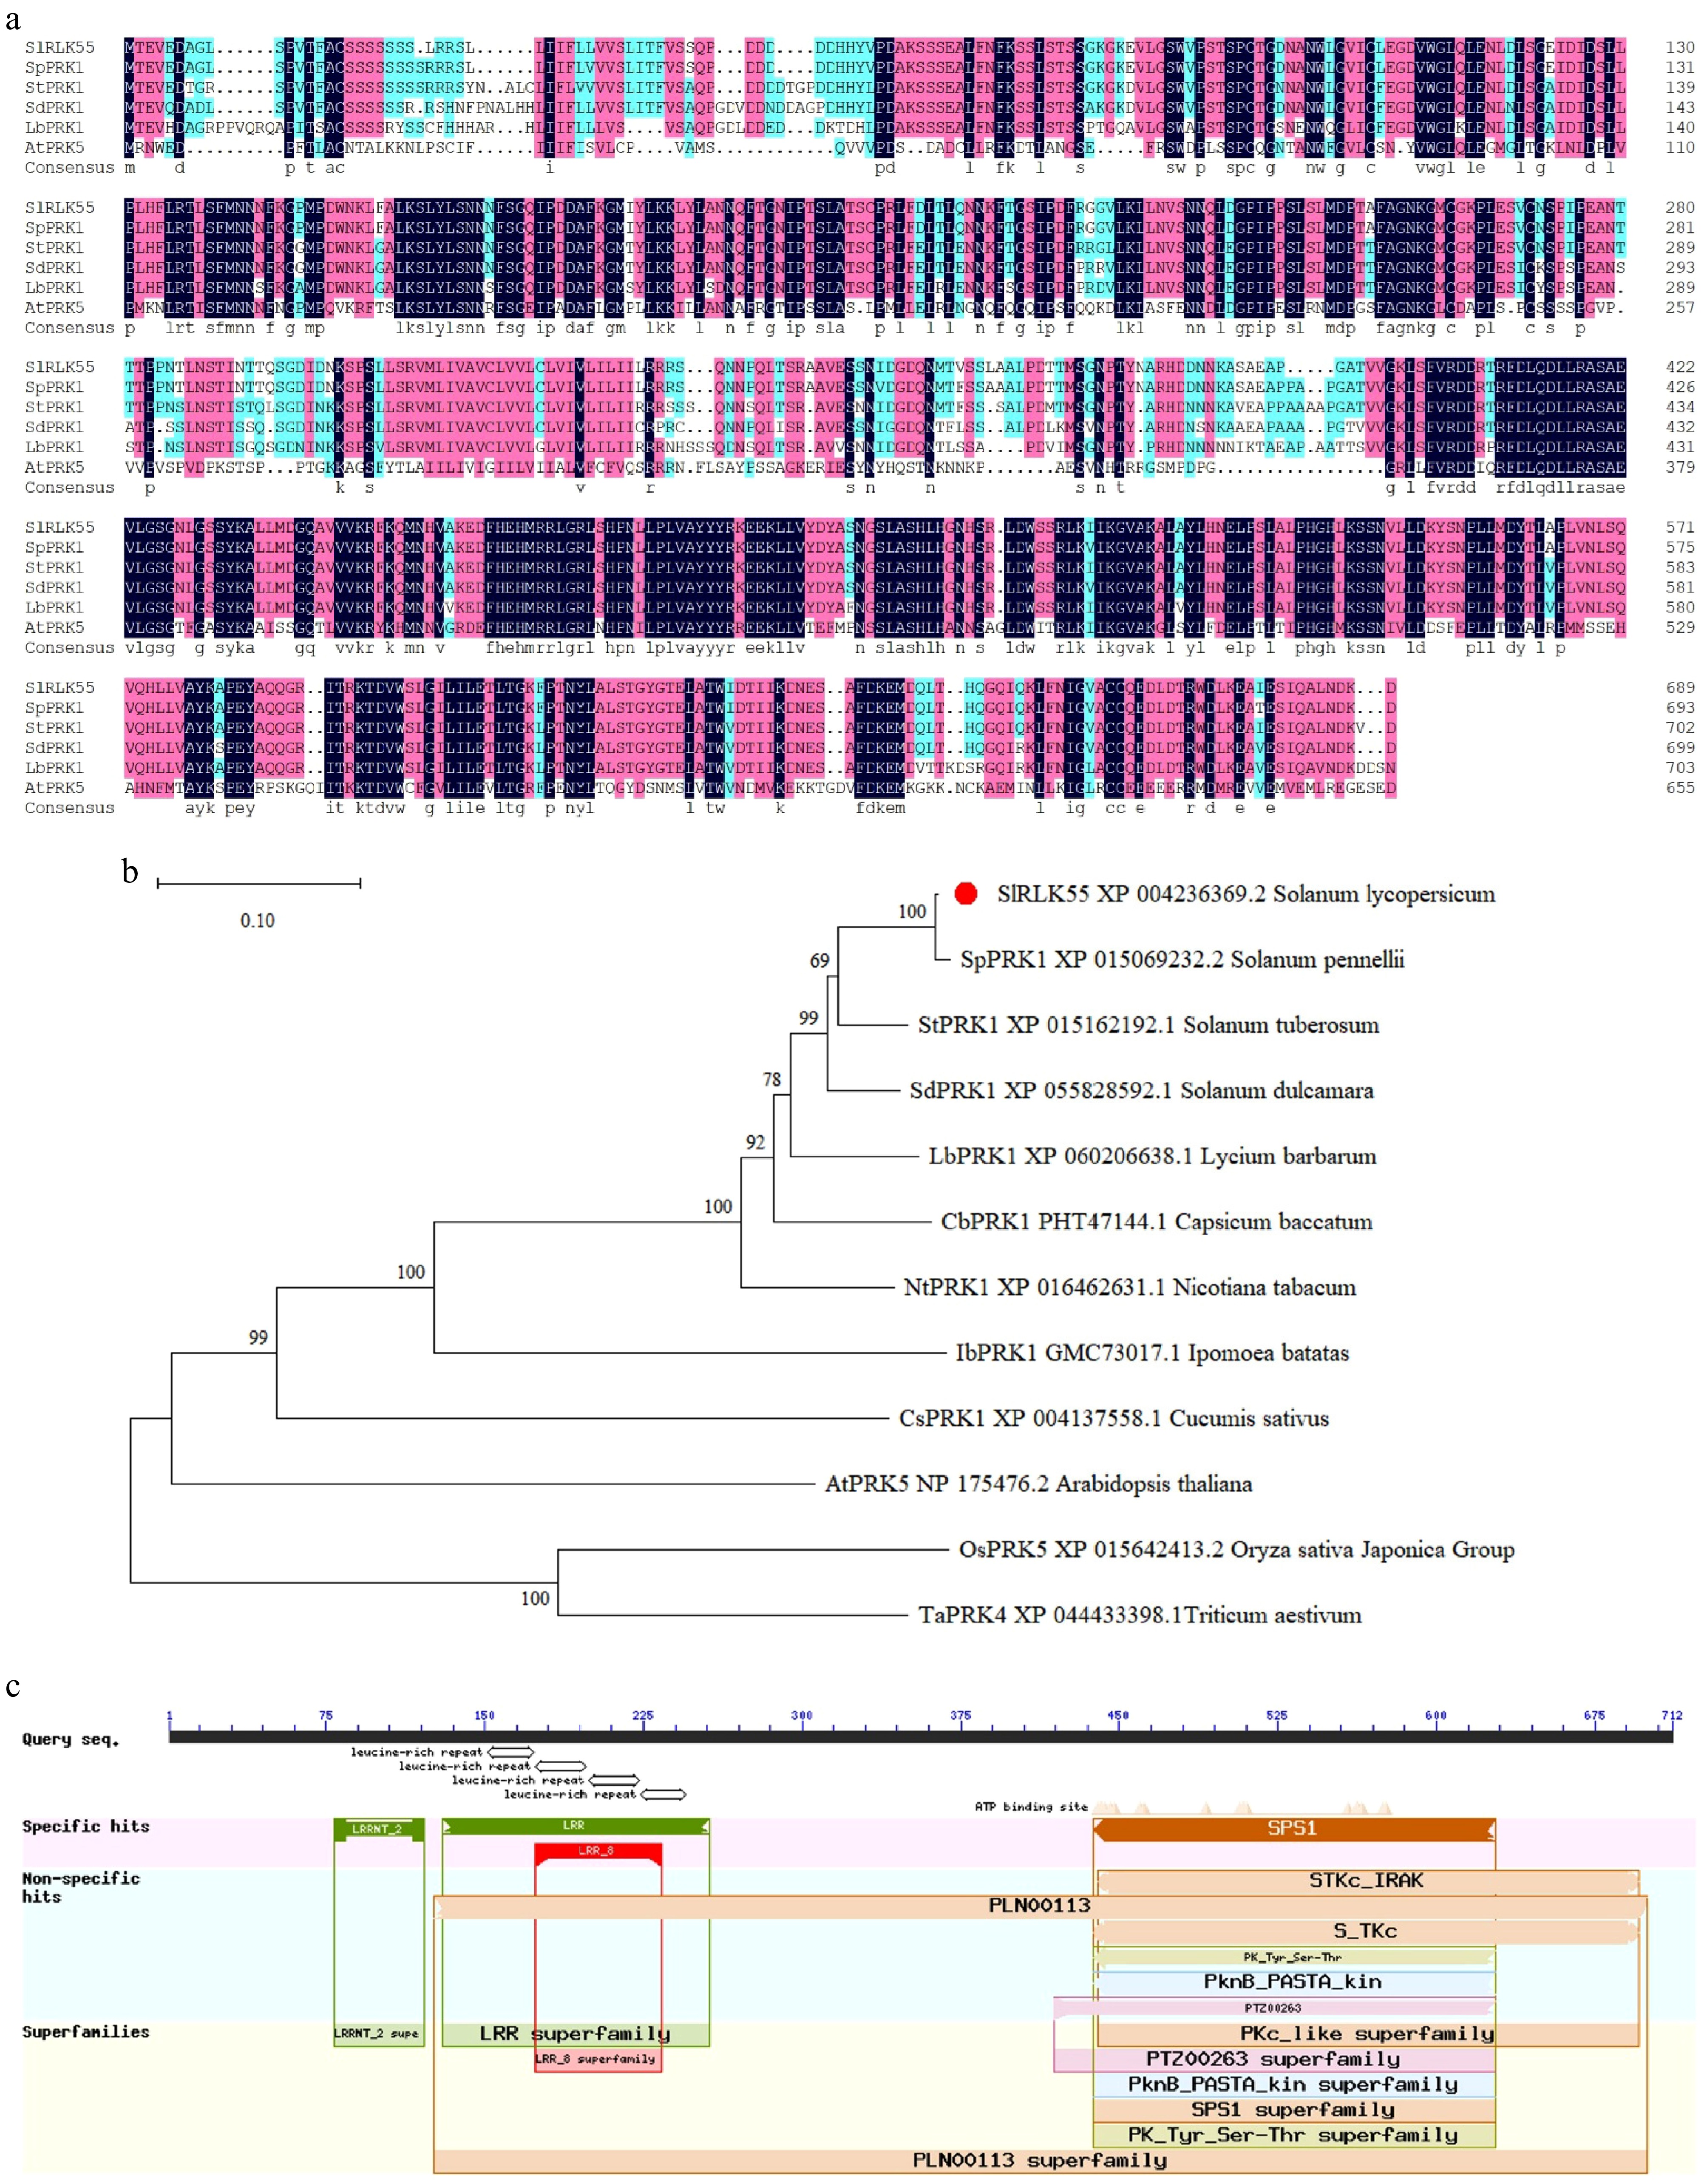
Figure 1.
SlRLK55 sequence analysis. (a) Amino acid sequences comparison of SlRLK55 with potato, bittersweet nightshade, pepper, wolfberry, tobacco, and Arabidopsis. (b) Phylogenetic relationship between SlRLK55 protein and PRK proteins from other plant species. MEGA 11 was used for phylogenetic tree construction with protein sequences from NCBI as follows: Solanum lycopersicum (XP_004236369.2); Solanum pennellii (XP_015069232.2); Solanum tuberosum (XP_015162192.1); Solanum dulcamara (XP_055828592.1); Lycium barbarum (XP_0060206638.1); Capsicum baccatum (PHT47144.1); Nicotiana tabacum (XP_016480124.1); Ipomoea batatas (GMC73017.1); Cucumis sativus (XP_004137558.1); Arabidopsis thaliana (NP_175476.2); Oryza sativa Japonica Group (XP_015642413.2); Triticum aestivum (XP_044433398.1). Scales represent branch lengths, and each node represents bootstrap values from 1,000 replicates. (c) Predicted conserved structural domains of SlRLK55.
-
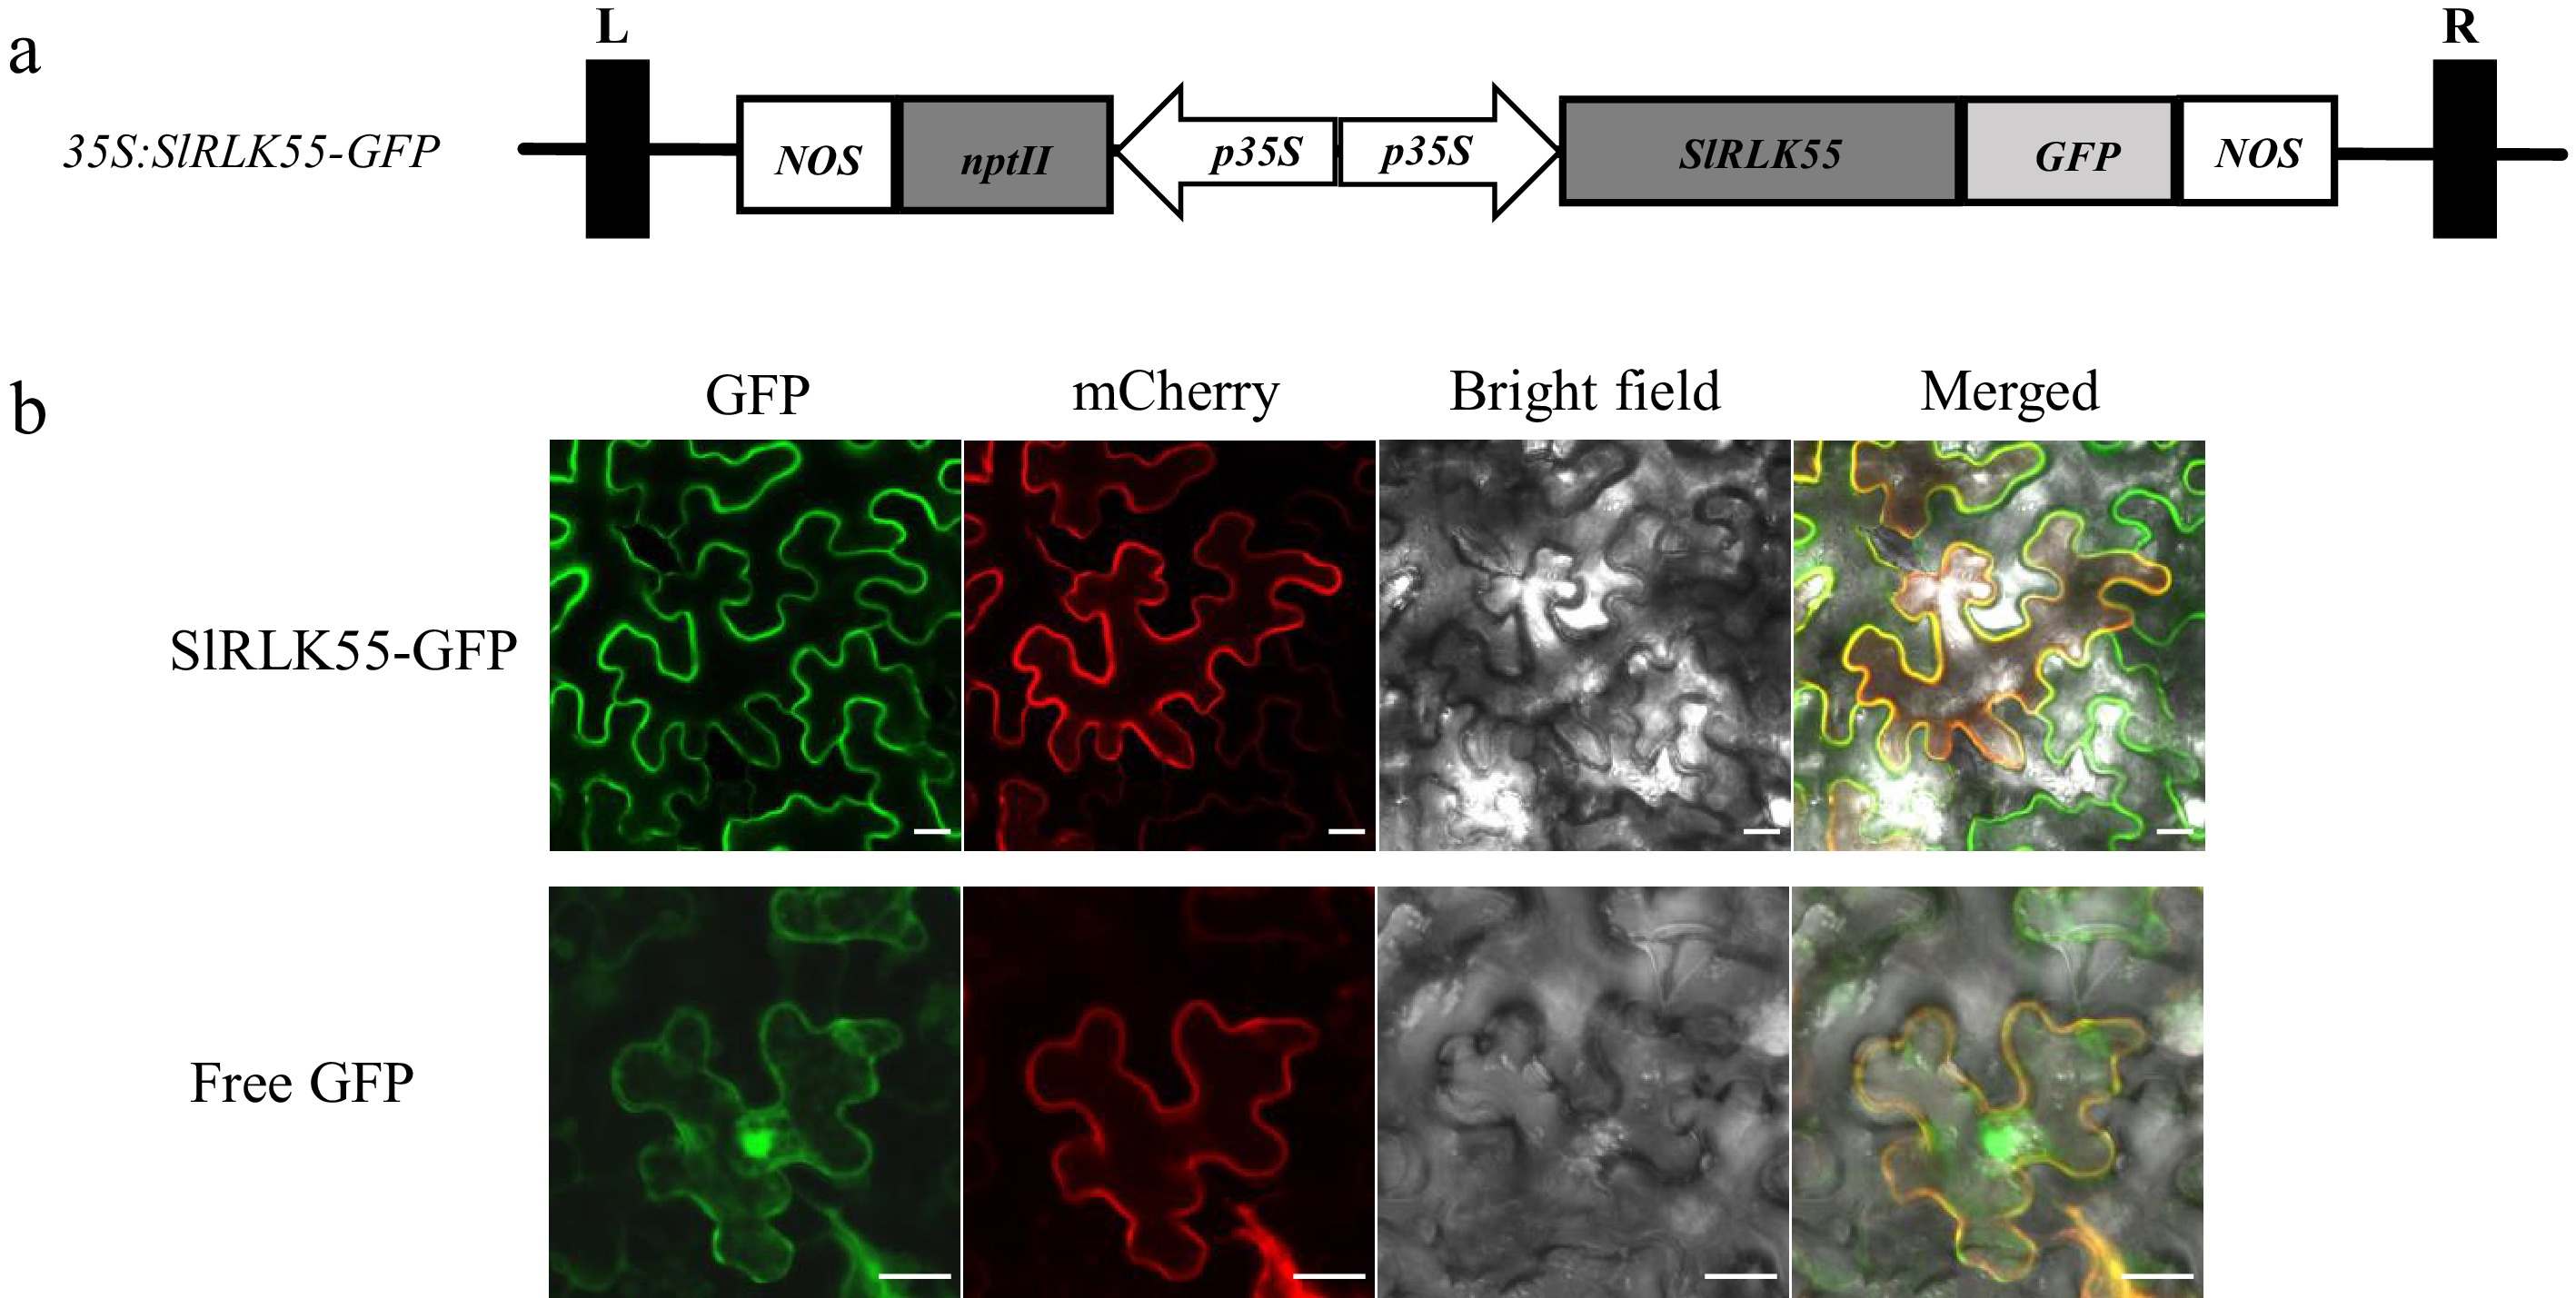
Figure 2.
The subcellular localization of SlRLK55. (a) The 35S:SlRLK55-GFP plasmid structure. (b) 35S:SlRLK55-GFP and a mCherry-labeled plasma membrane marker (pm-rk) were co-transformed into N. benthamiana leaves by transient expression assay. 35S:GFP (Free GFP) was used as a control. Green indicates GFP signal. Red indicates the plasma membrane marker (pm-rk) signal. Scale bars = 20 μm.
-
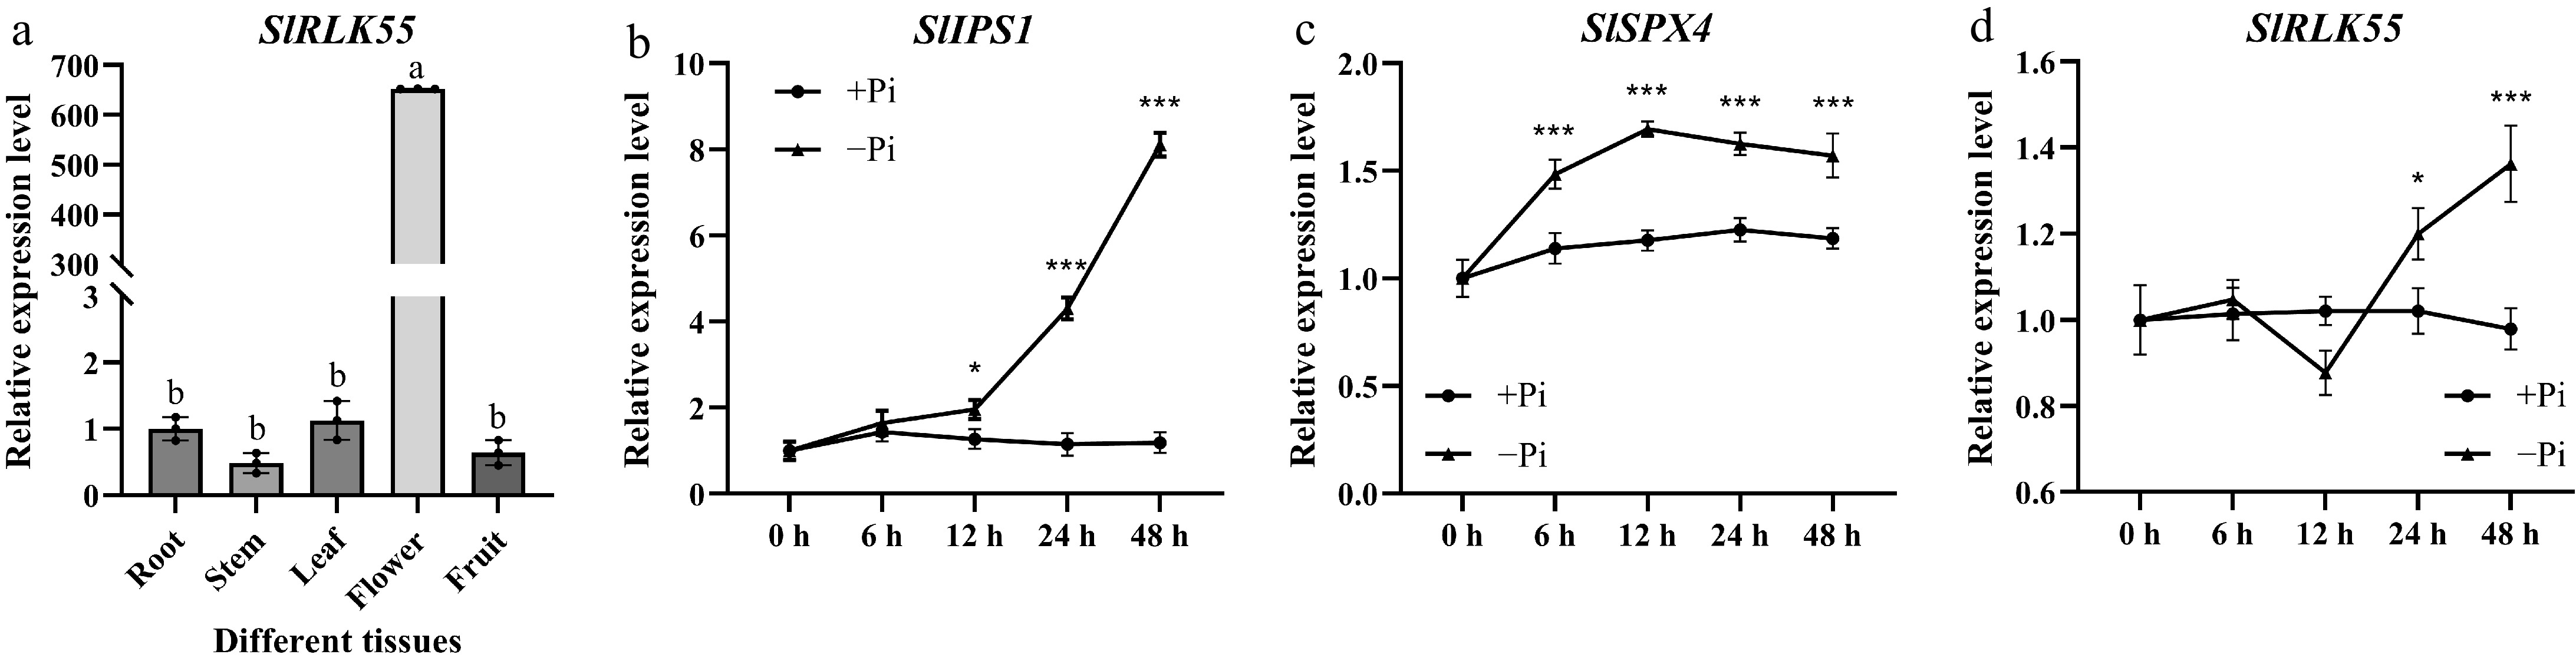
Figure 3.
Assessment of SlRLK55 expression in M82. (a) Expression of SlRLK55 was evaluated in roots, stems, leaves, flowers, and fruits of M82. Statistical significance was determined by one-way ANOVA. Significant differences are indicated by different lowercase letters. (b)–(d) Expression of SlIPS1, SlSPX4, and SlRLK55 genes in seedlings of M82 treated with Pi deprivation conditions for 0, 6, 12, 24, and 48 h. Three biological replicates of the experiment were performed with similar results. Asterisks denote Student's t test significance compared with untreated plants: * p < 0.05 and *** p < 0.001.
-
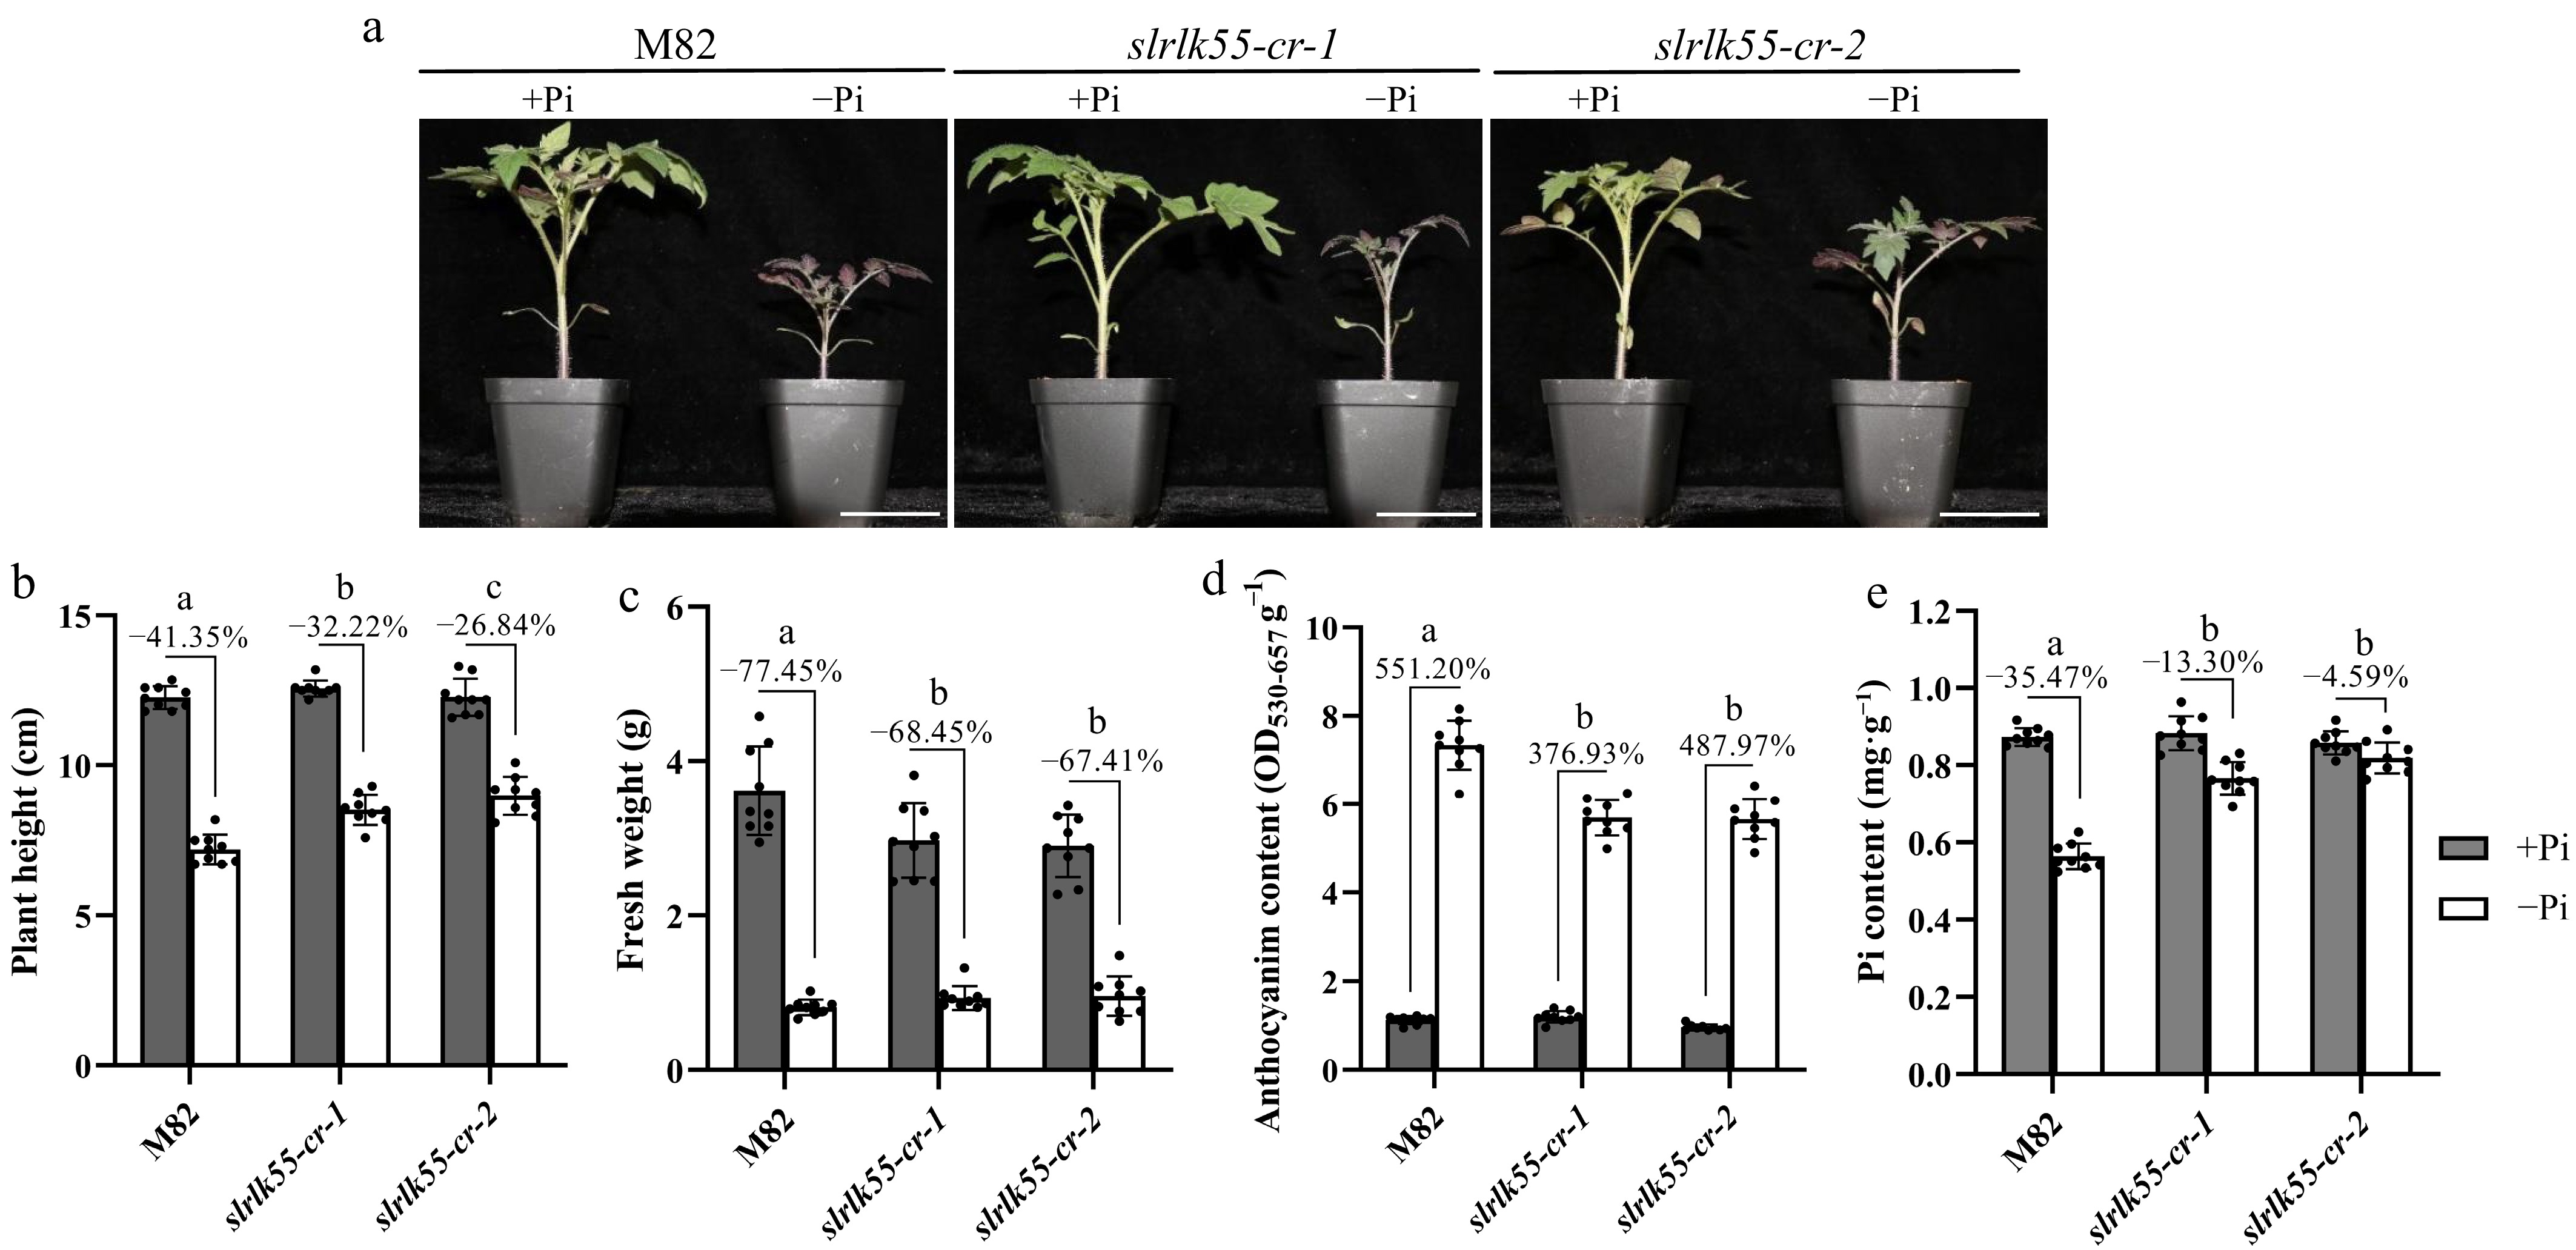
Figure 4.
SlRLK55 is a negative regulator of PSR. (a) Phenotypes of 21-day-old M82 (wild type) and slrlk55-cr grown under control (+Pi), and Pi deprivation conditions (−Pi). Seedlings were grown at 28 °C for 16 h of light, 22 °C for 8 h of darkness, and 40% relative humidity. (b) Plant height, (c) fresh weight, (d) anthocyanin content, and (e) Pi content of M82 and slrlk55-cr grown in Pi deprivation conditions for 3 weeks. Data are mean ± SD, n = 3 repeats. Significant differences are indicated by different lowercase letters. Scale bars = 5 cm.
-
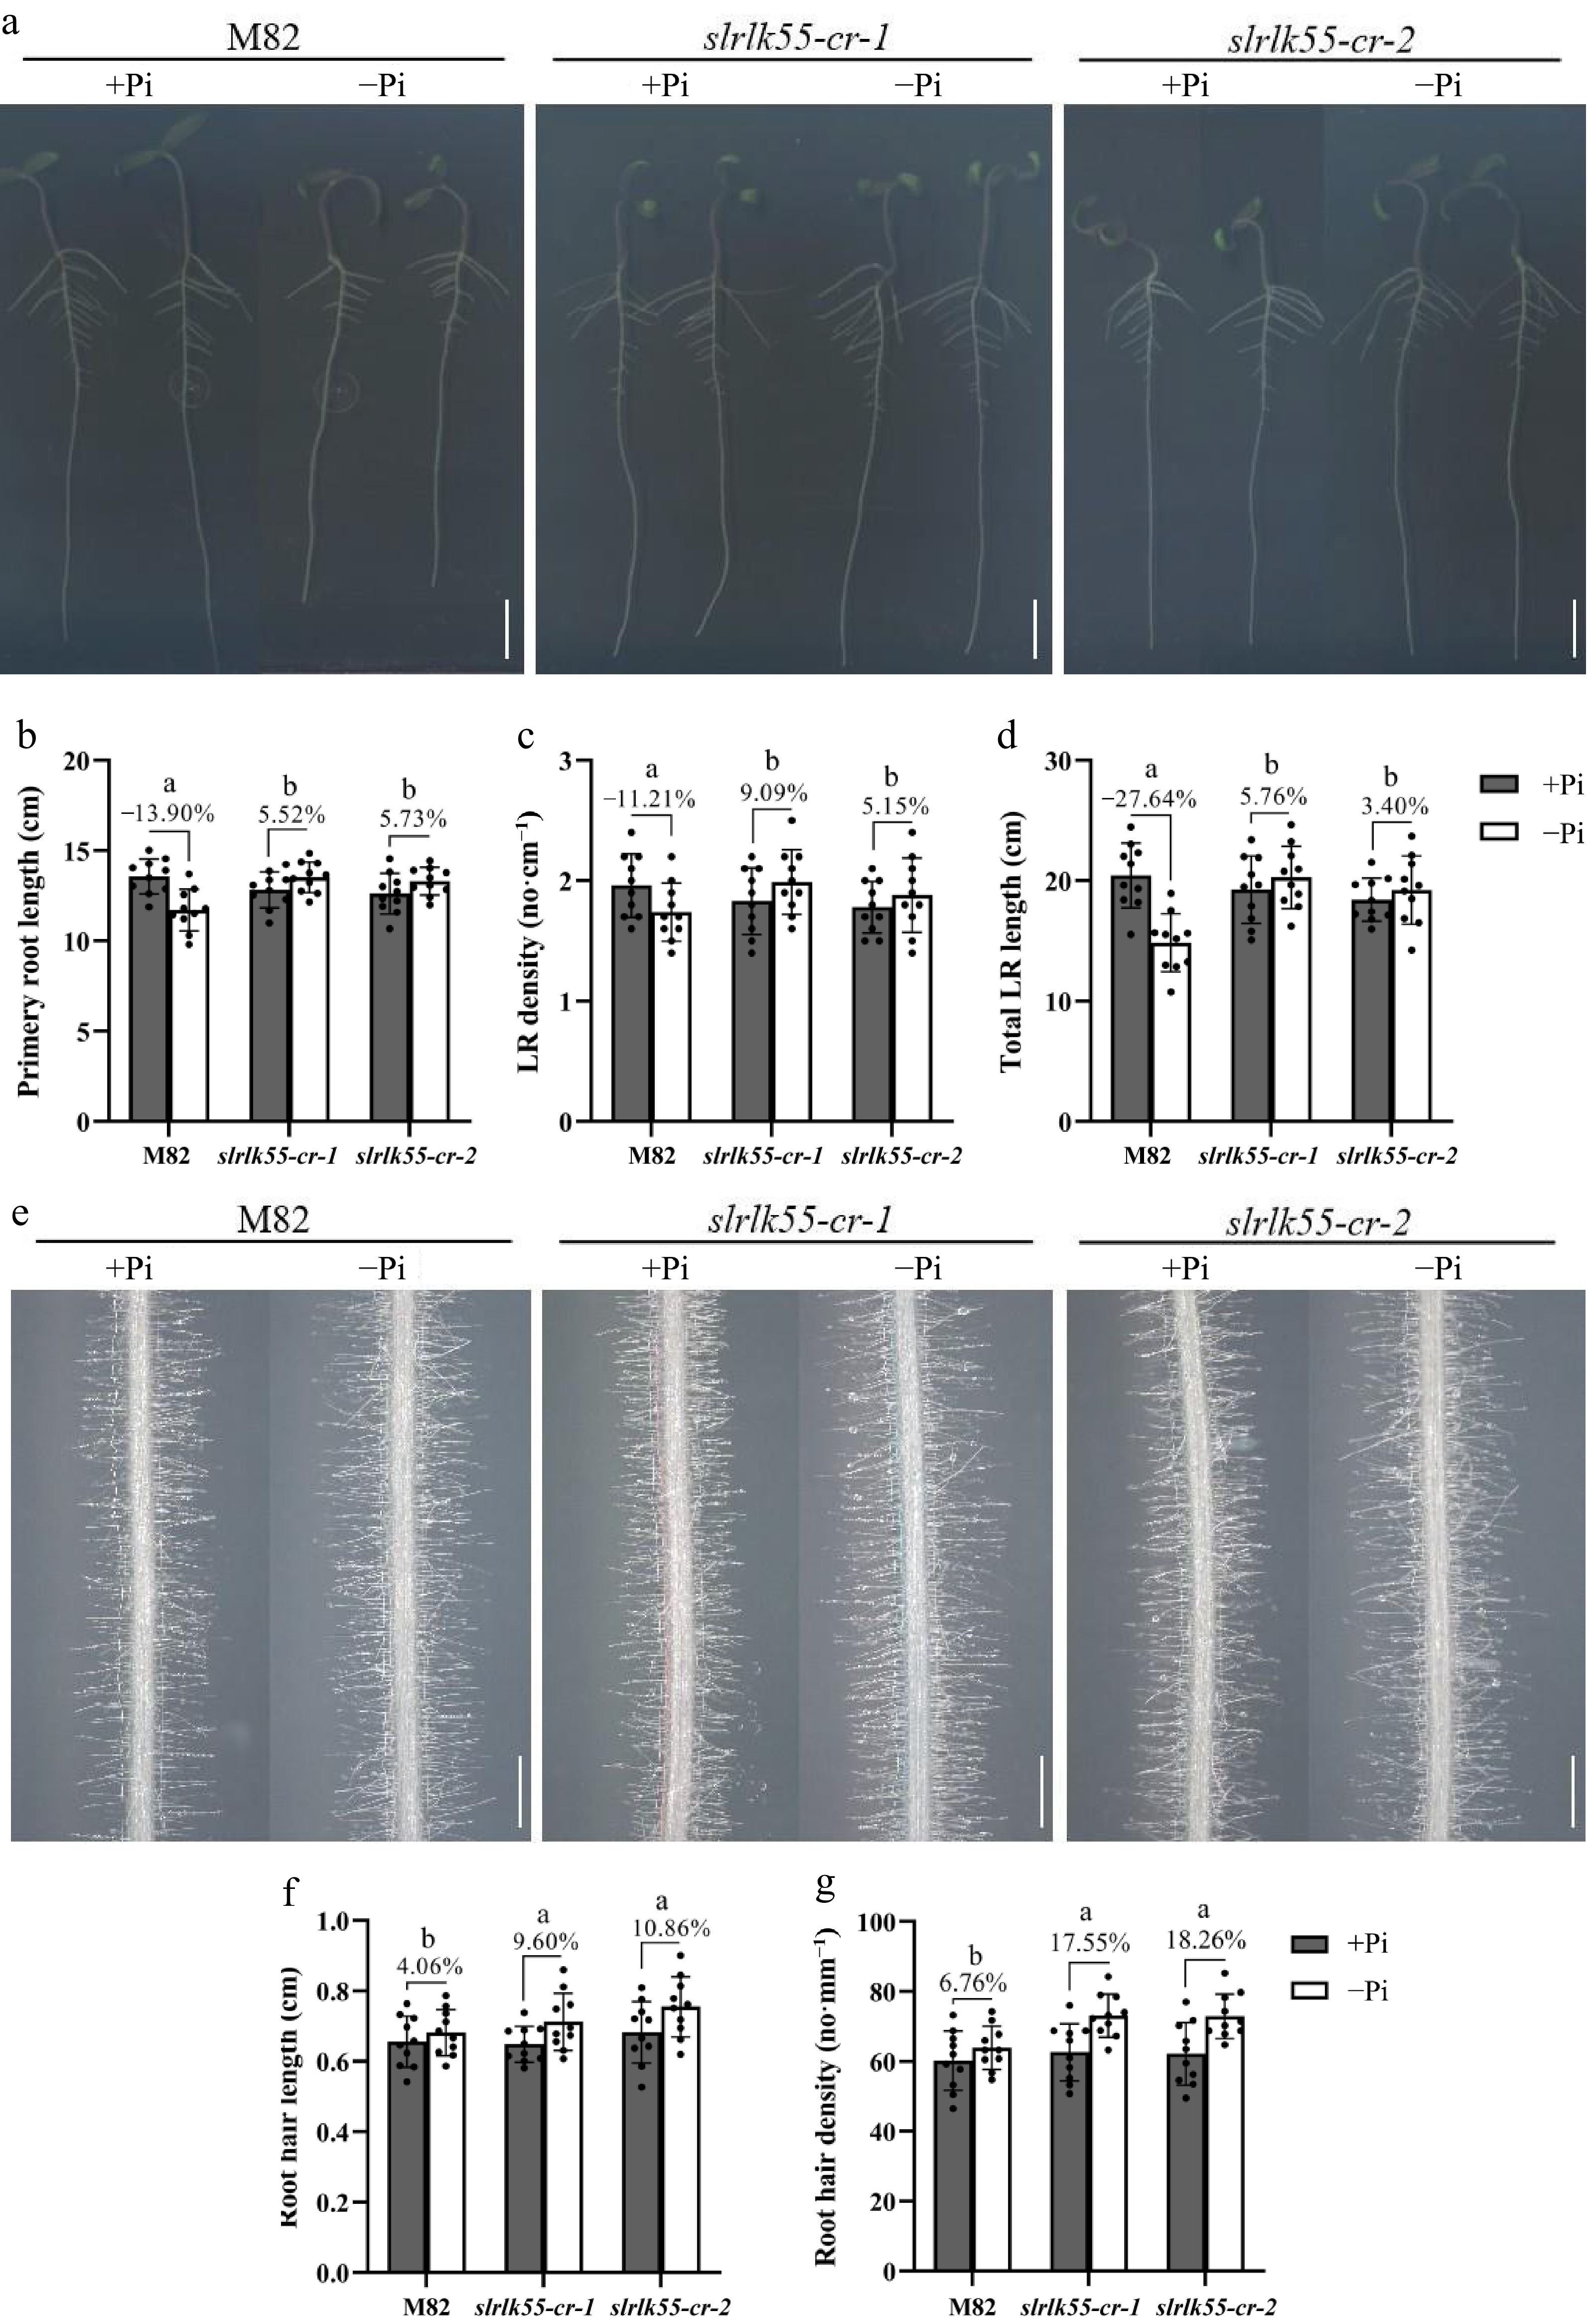
Figure 5.
SlRLK55 negatively affects root architecture under Pi deprivation. (a) Phenotypes of primary root and lateral root (LR) of 7-day-old M82 and slrlk55-cr seedlings grown under control (+Pi) and Pi deprivation conditions (–Pi). Bars = 2 cm. (b) Primary root length, (c) lateral root (LR) density, and (d) total LR length of plants shown in (a). (e) Phenotypes of root hairs of 7-day-old M82 and slrlk55-cr seedlings grown under control (+Pi) and Pi deprivation conditions (–Pi). Bars = 1 mm. (f) Root hair length, and (g) root hair density of plants shown in (e). Seedlings were germinated on 1/2 MS medium for 2 d and then transferred to 1/2 MS medium with Pi deprivation (–Pi) for another 5 d. Data are mean ± SD, n = 3 repeats. Significant differences are indicated by different lowercase letters.
-
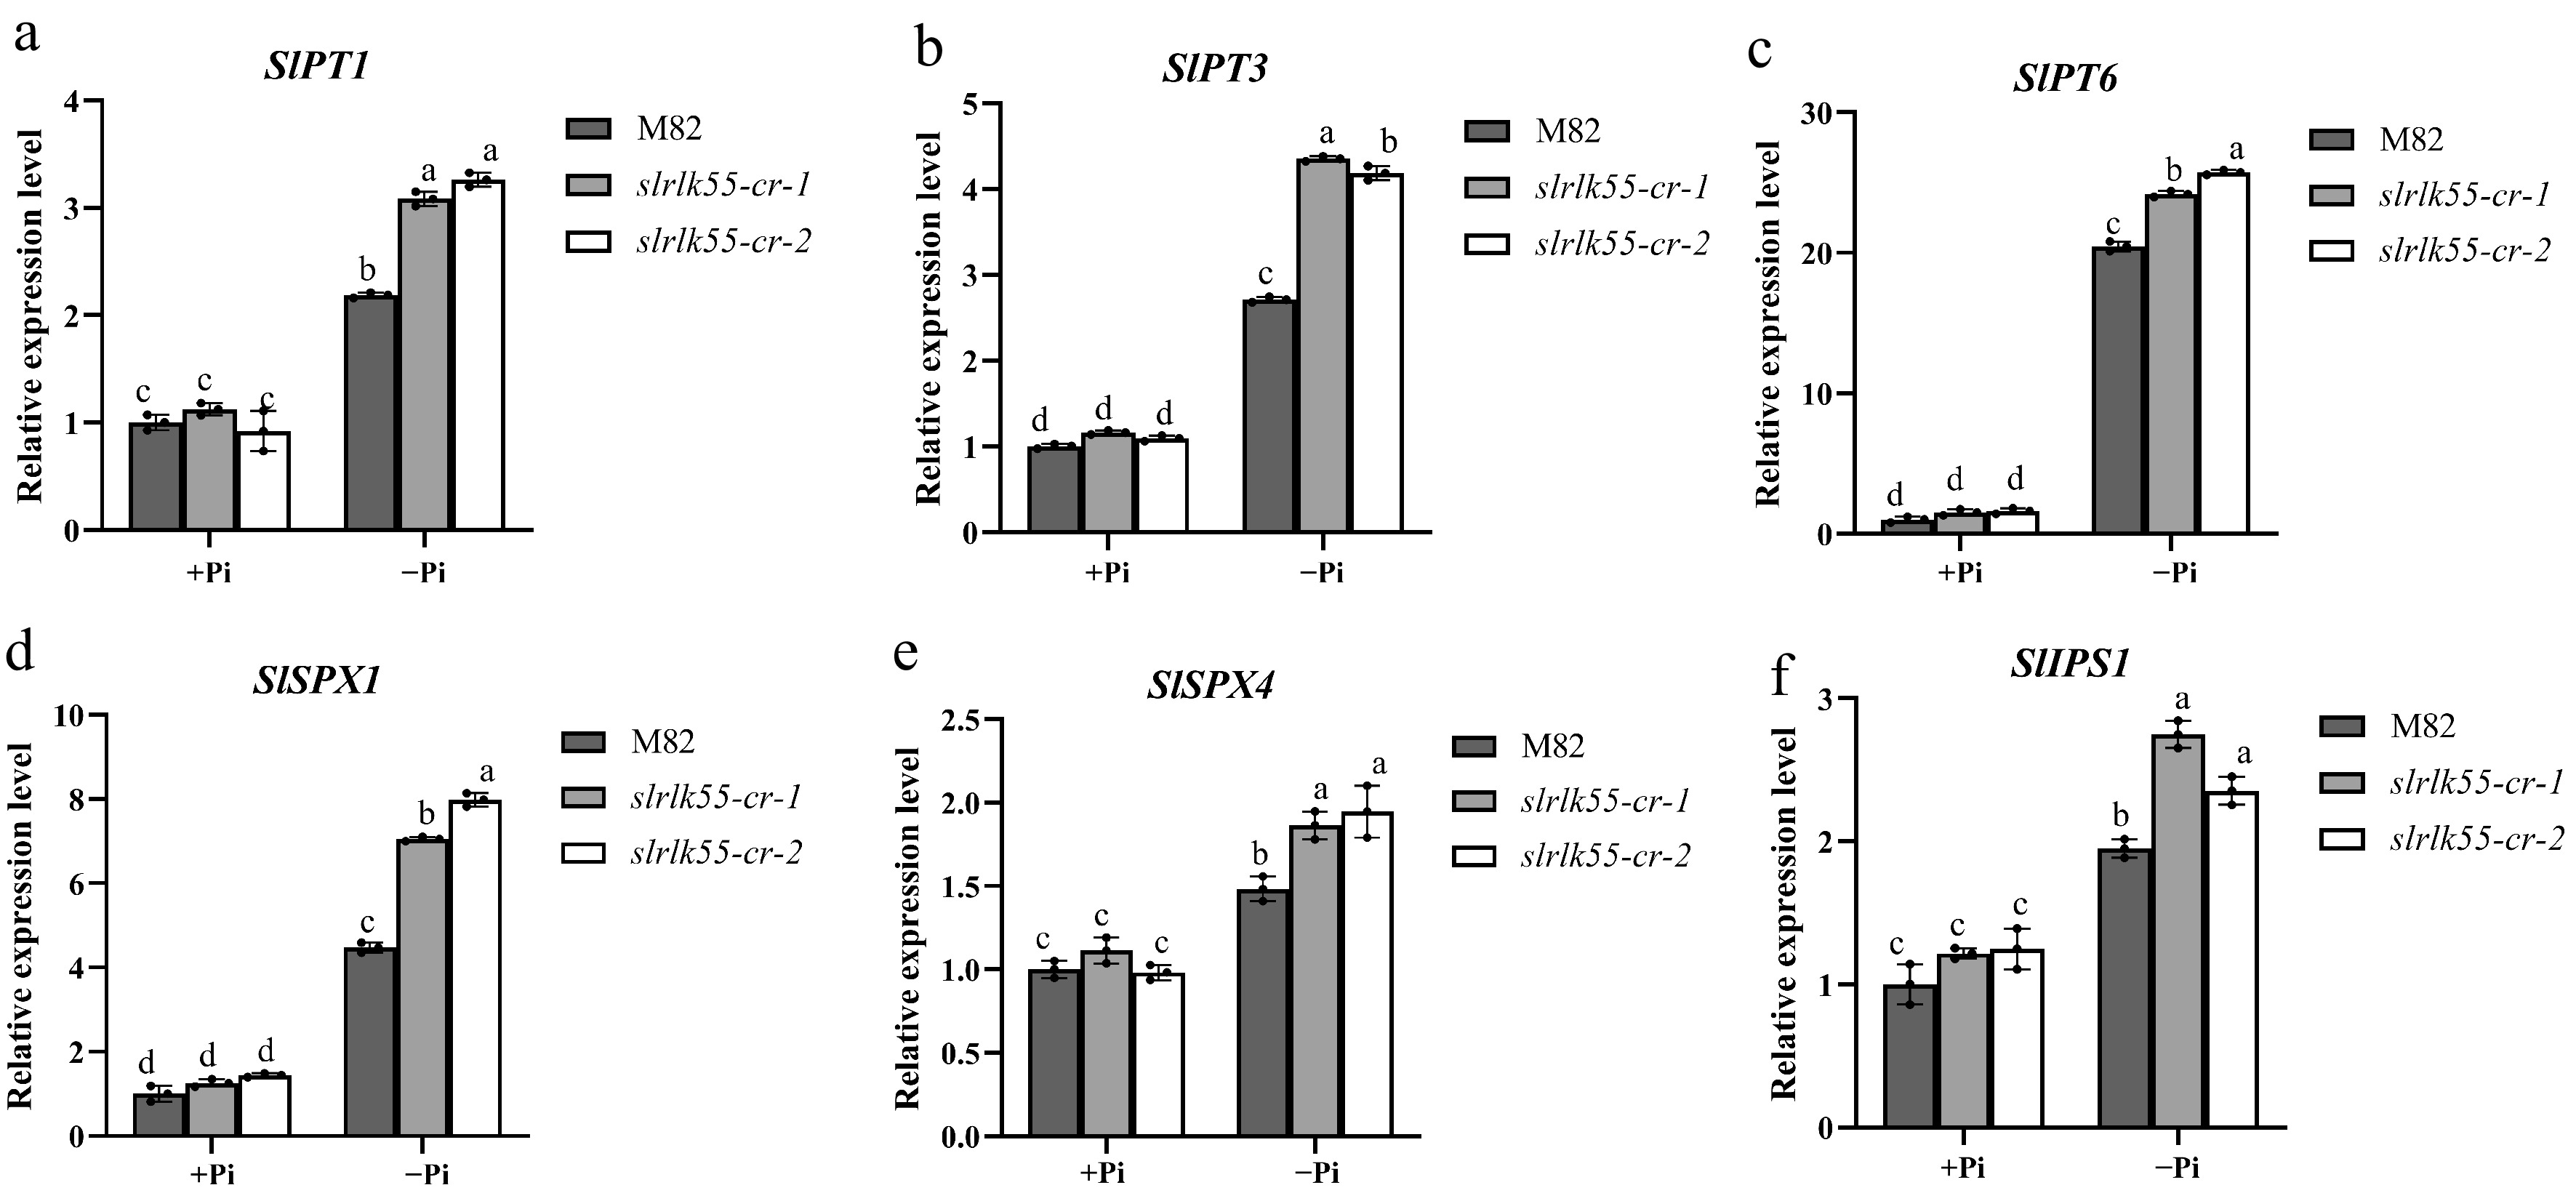
Figure 6.
SlRLK55 exerts a negative effect on the expression of PSR genes. (a)–(f) Expression of PSR genes in seedlings of M82 and slrlk55-cr with Pi deprivation treatment (–Pi) for 0 and 48 h. Transcription was analyzed by RT-qPCR with SlACTIN as the internal reference. Data are mean ± SD, n = 3 repeats. Significant differences are indicated by different lowercase letters.
-
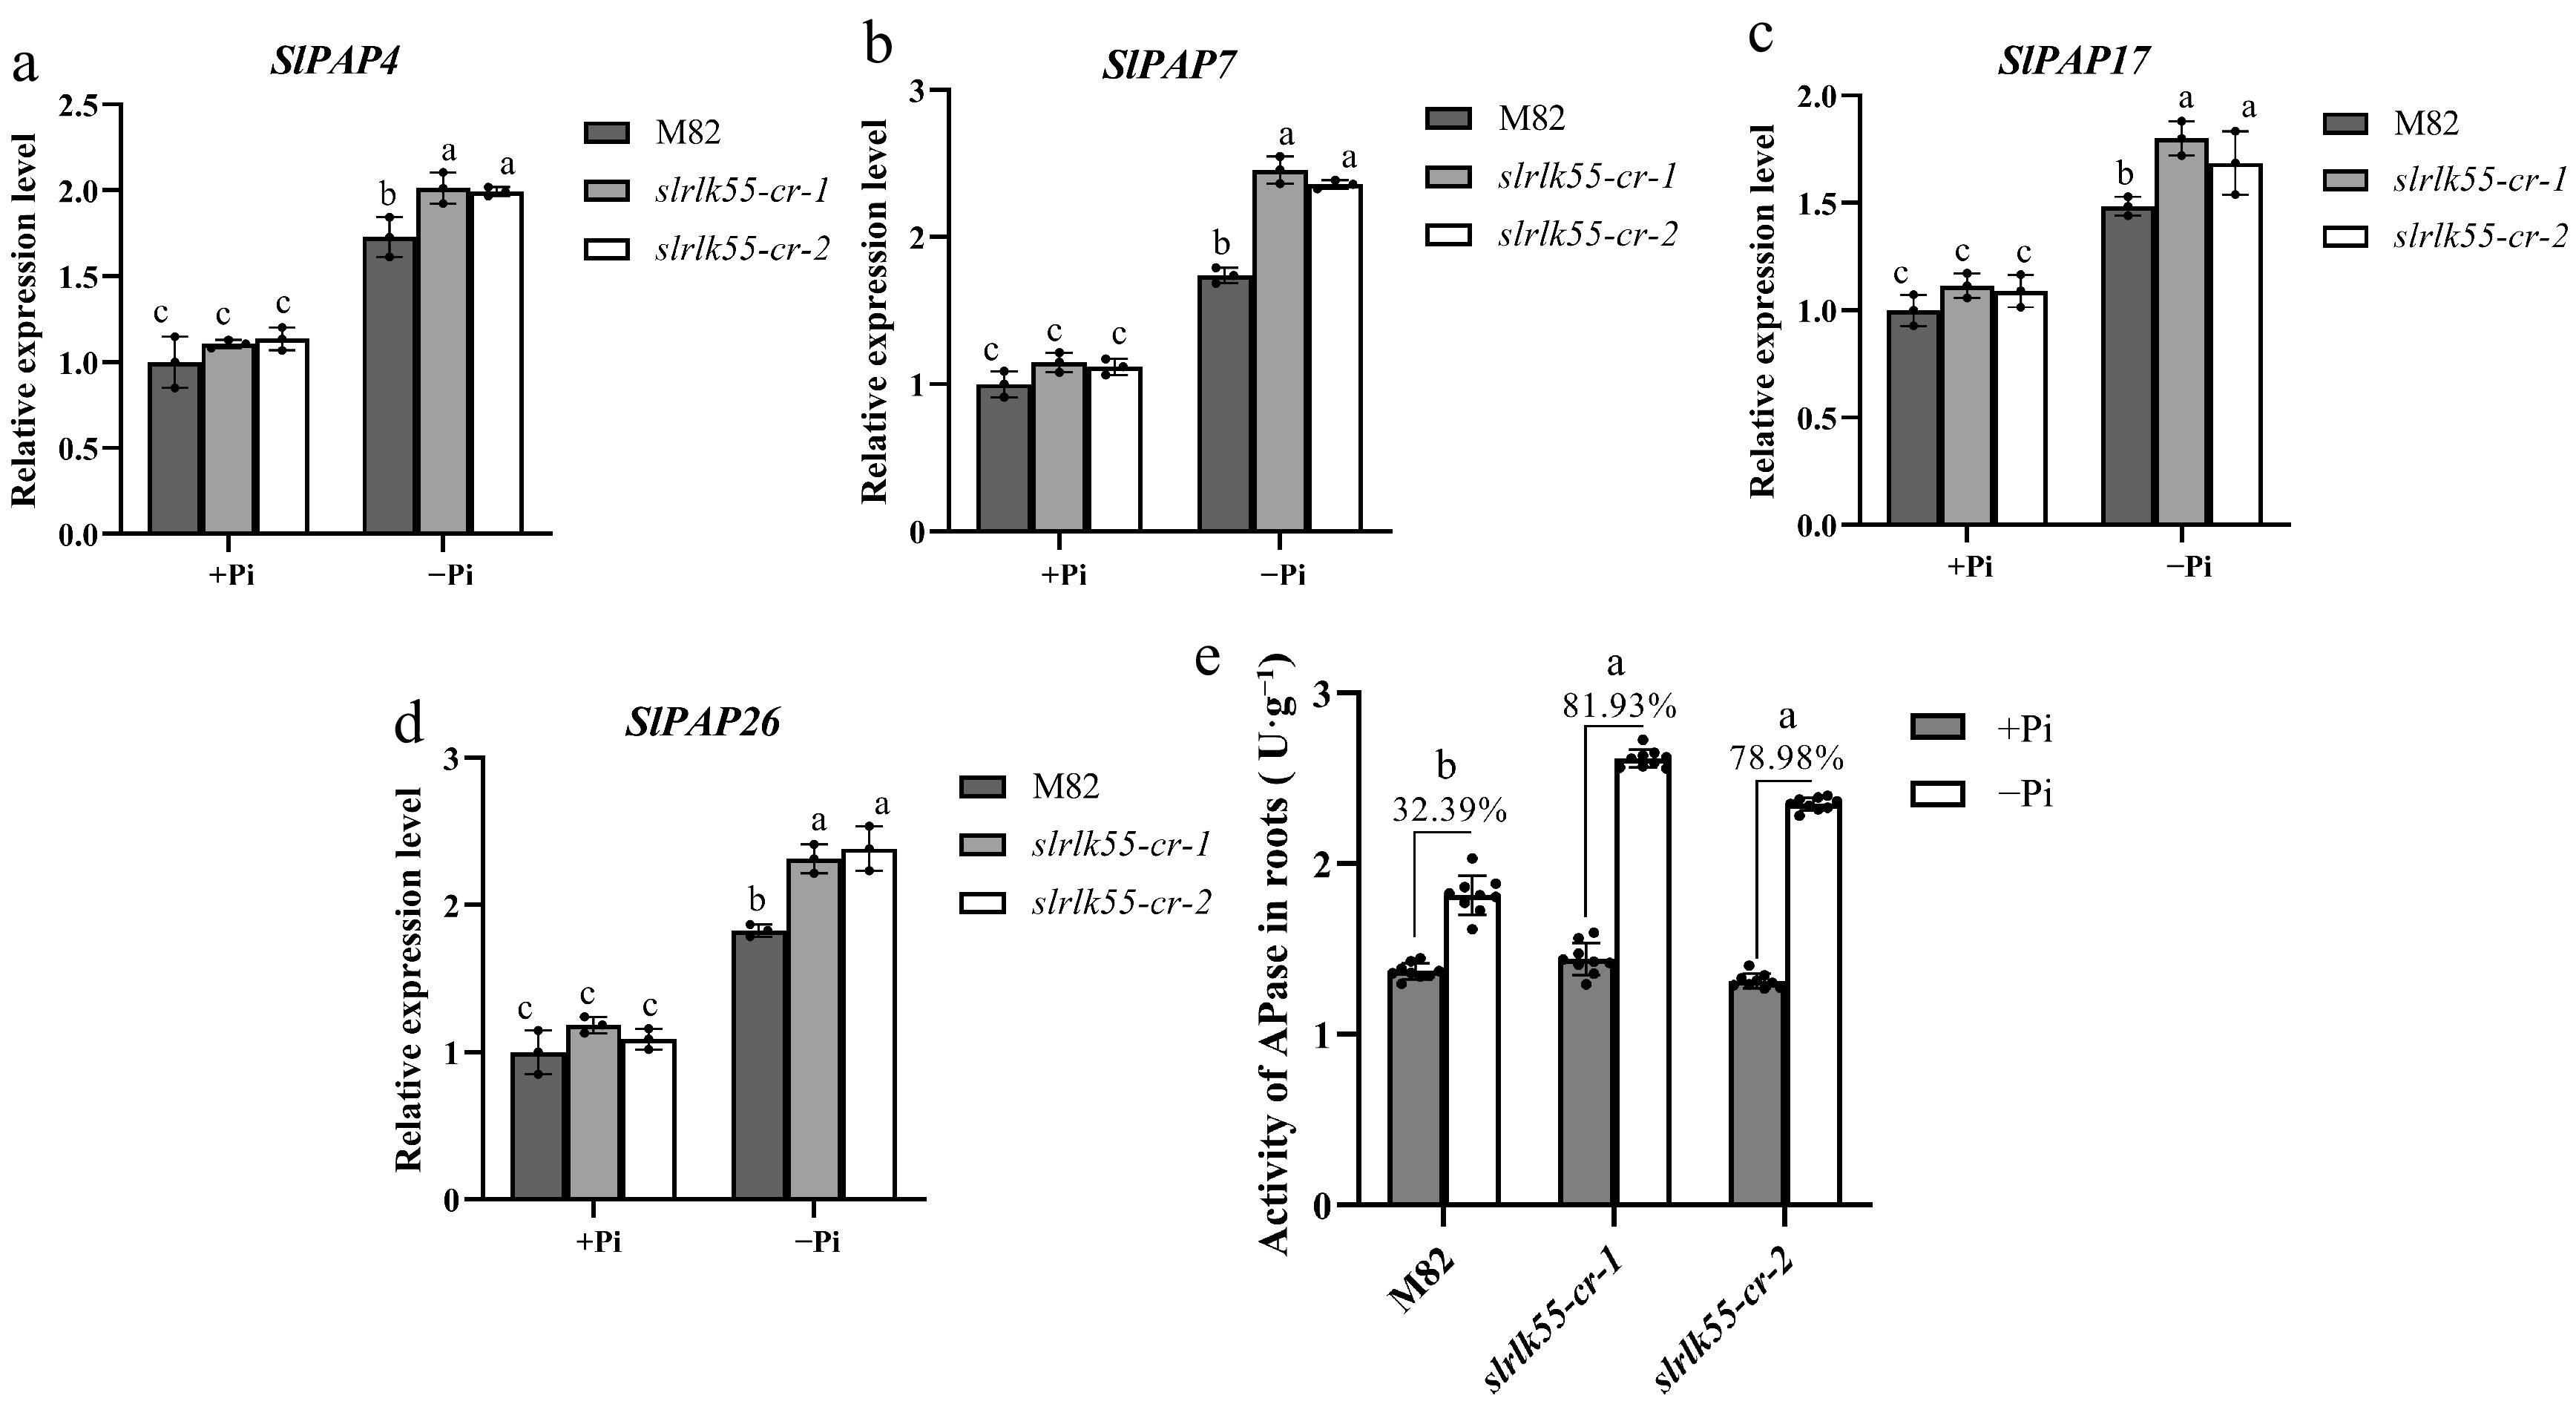
Figure 7.
Transcription and enzyme activity of phosphatase were repressed by SlRLK55. (a)–(d) Expression of acid phosphatase genes in seedlings of M82 and slrlk55-cr with Pi deprivation treatment for 0 and 48 h. Transcript levels were analyzed by RT-qPCR with SlACTIN as the internal reference gene. (e) Acid phosphatase activity of M82 and slrlk55-cr: Two-day-old seedlings grown under control (+Pi) were treated with +Pi and –Pi for another 5 d. Data are mean ± SD, n = 3 repeats. Significant differences are indicated by different lowercase letters. (a)–(d) The black bars represent the wild-type M82, while the gray and white bars represent the slrlk55 mutants. (e) The black and white bars represent +Pi and –Pi respectively.
-
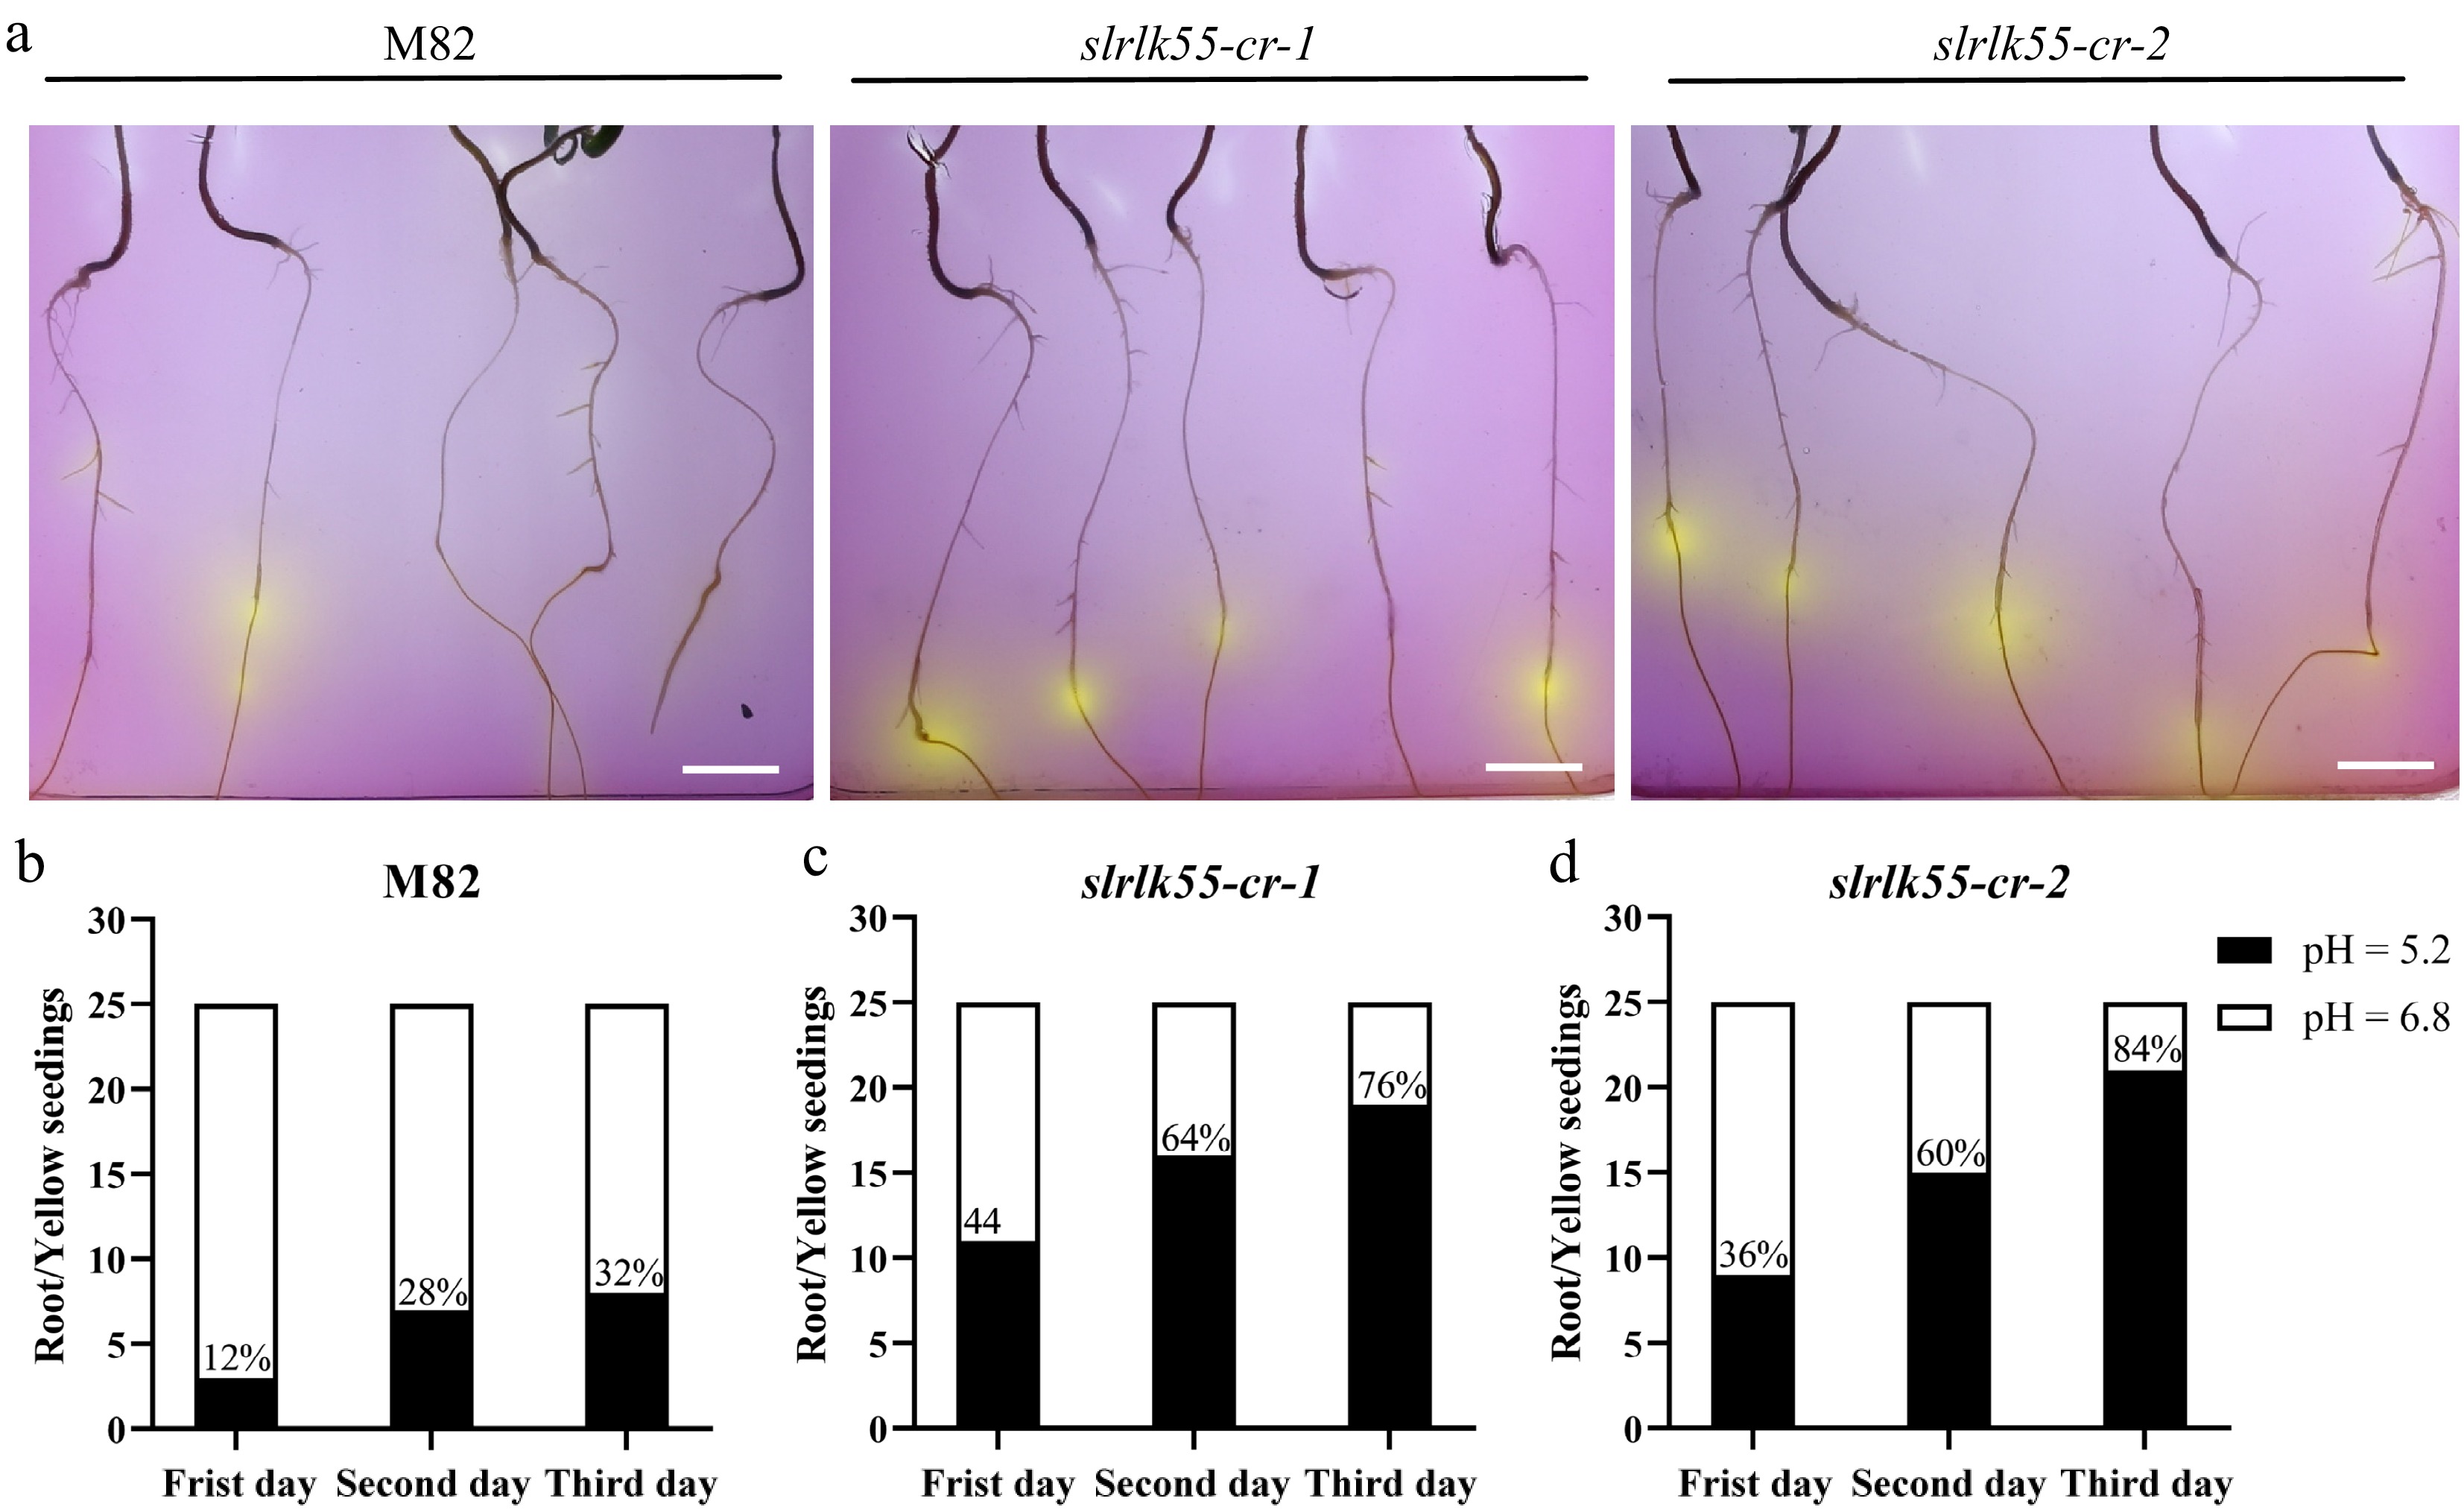
Figure 8.
Organic acid secretion was enhanced in slrlk55-cr with Pi deprivation. (a) Root acidification staining of seedlings of M82 and slrlk55-cr. Two-day-old seedlings grown with +Pi were transferred to medium containing bromocresol violet with Pi deprivation for another 3 d before the images were taken. The color change from purple to yellow indicates the pH change in the media due to acidification of rhizosphere of plants. Organic acid secretion by the seedling roots of (b) M82, (c) slrlk55-cr-1, and (d) slrlk55-cr-2 after 1 to 3 d growth under Pi deprivation conditions (n = 25). Scale bars = 1 cm.
Figures
(8)
Tables
(0)