-
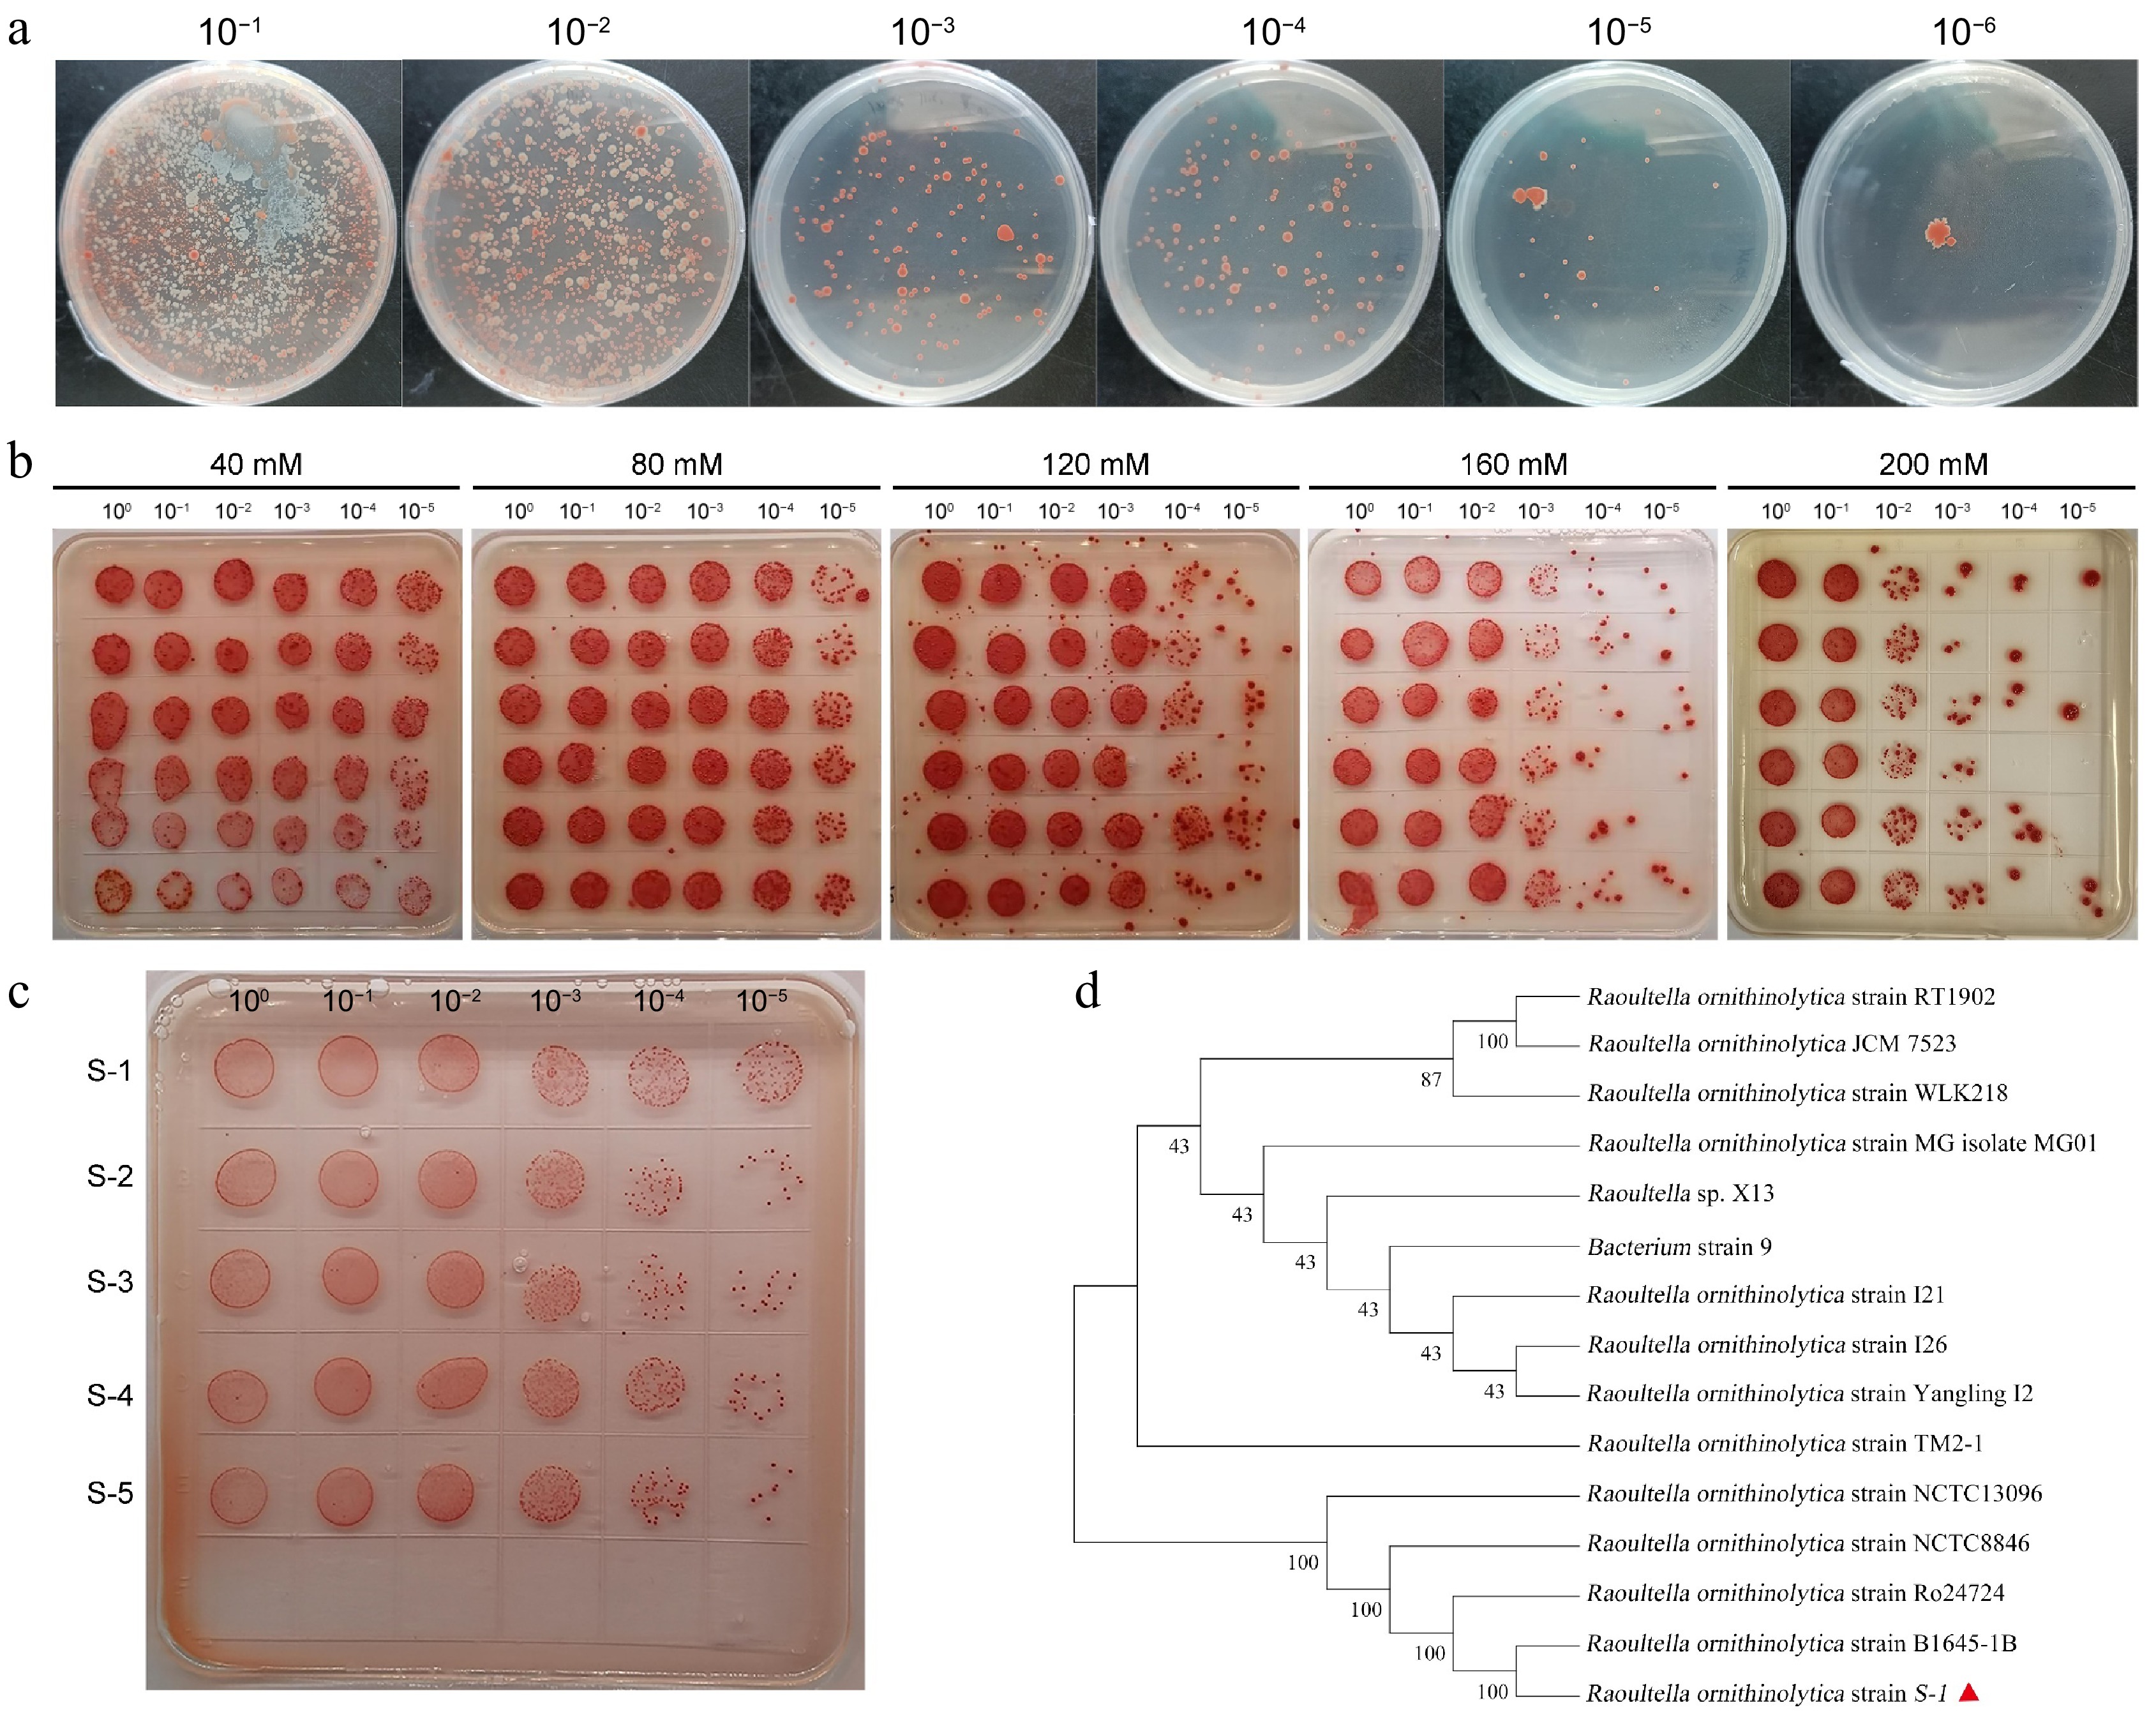
Figure 1.
Screening and identification of strain S-1. (a) Isolation of soil selenium-reducing bacteria. (b) Determination of selenium tolerance screening conditions. (c) Evaluation of selenium resistance in S-1. (d) Phylogenetic analysis of the 16S rRNA gene sequence in S-1.
-
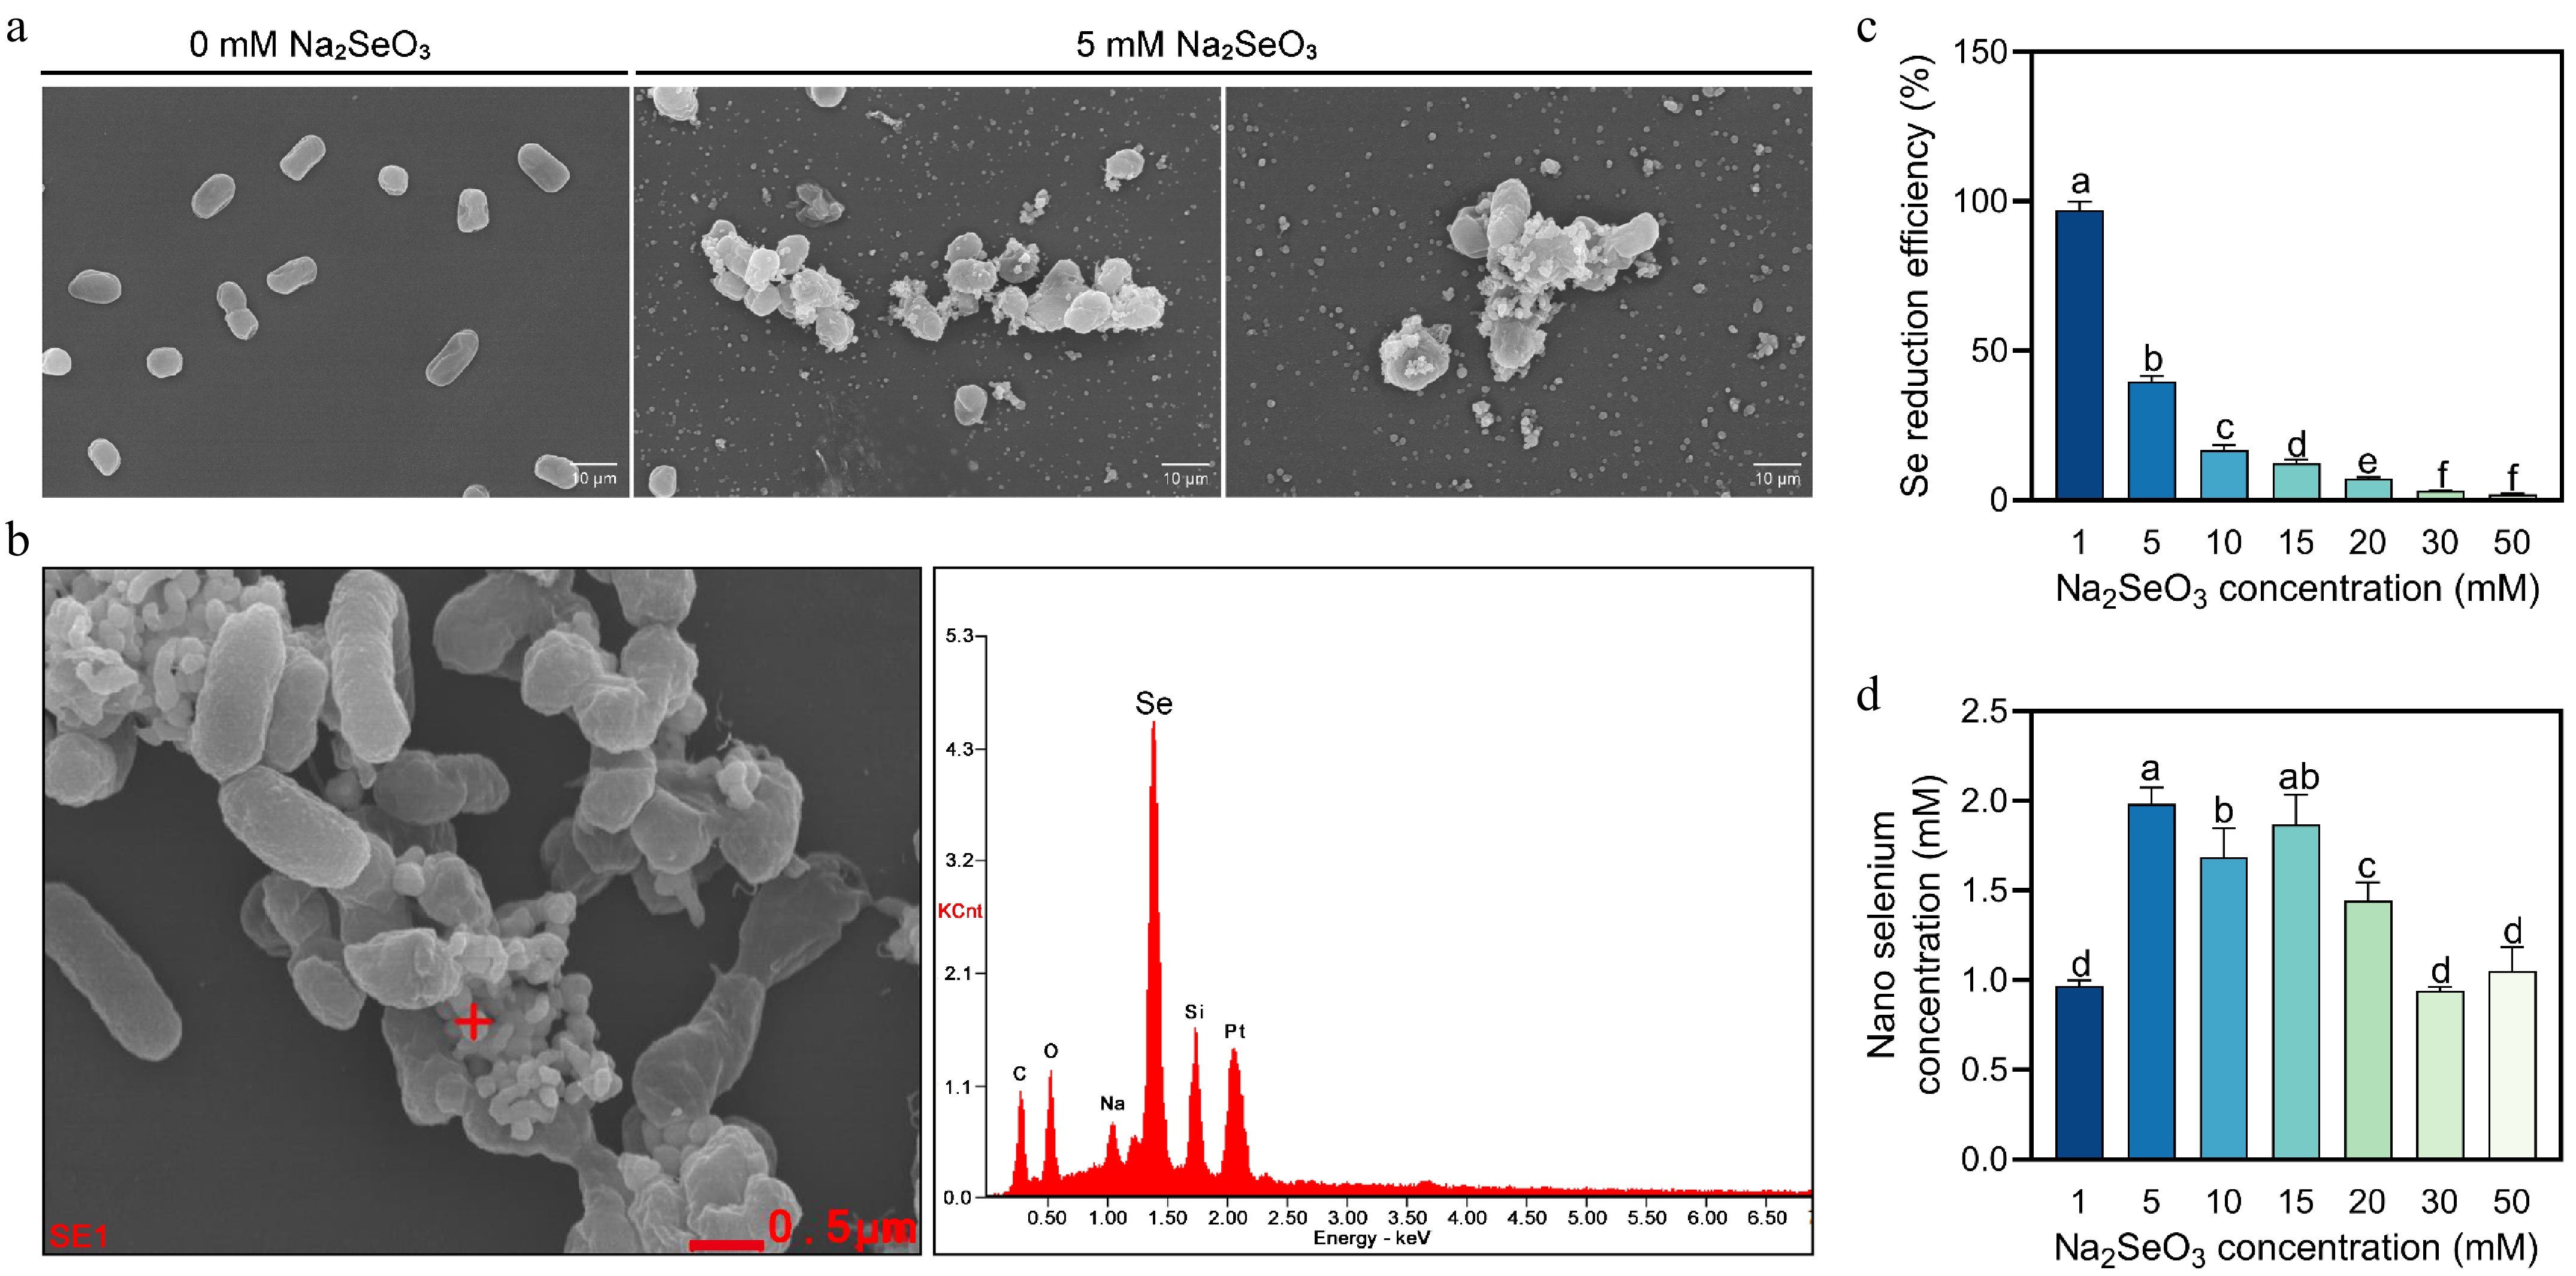
Figure 2.
S-1 Synthesis of bio-nano selenium characterization and selenium reduction capacity analysis. (a) Observation of bio-nano selenium. (b) Characterization of bio-nano selenium. (c), (d) Selenium reduction capacity analysis. Each bar indicates the mean ± SD, and statistical significance (p < 0.05) is indicated by different letters according to Duncan's multiple range test.
-
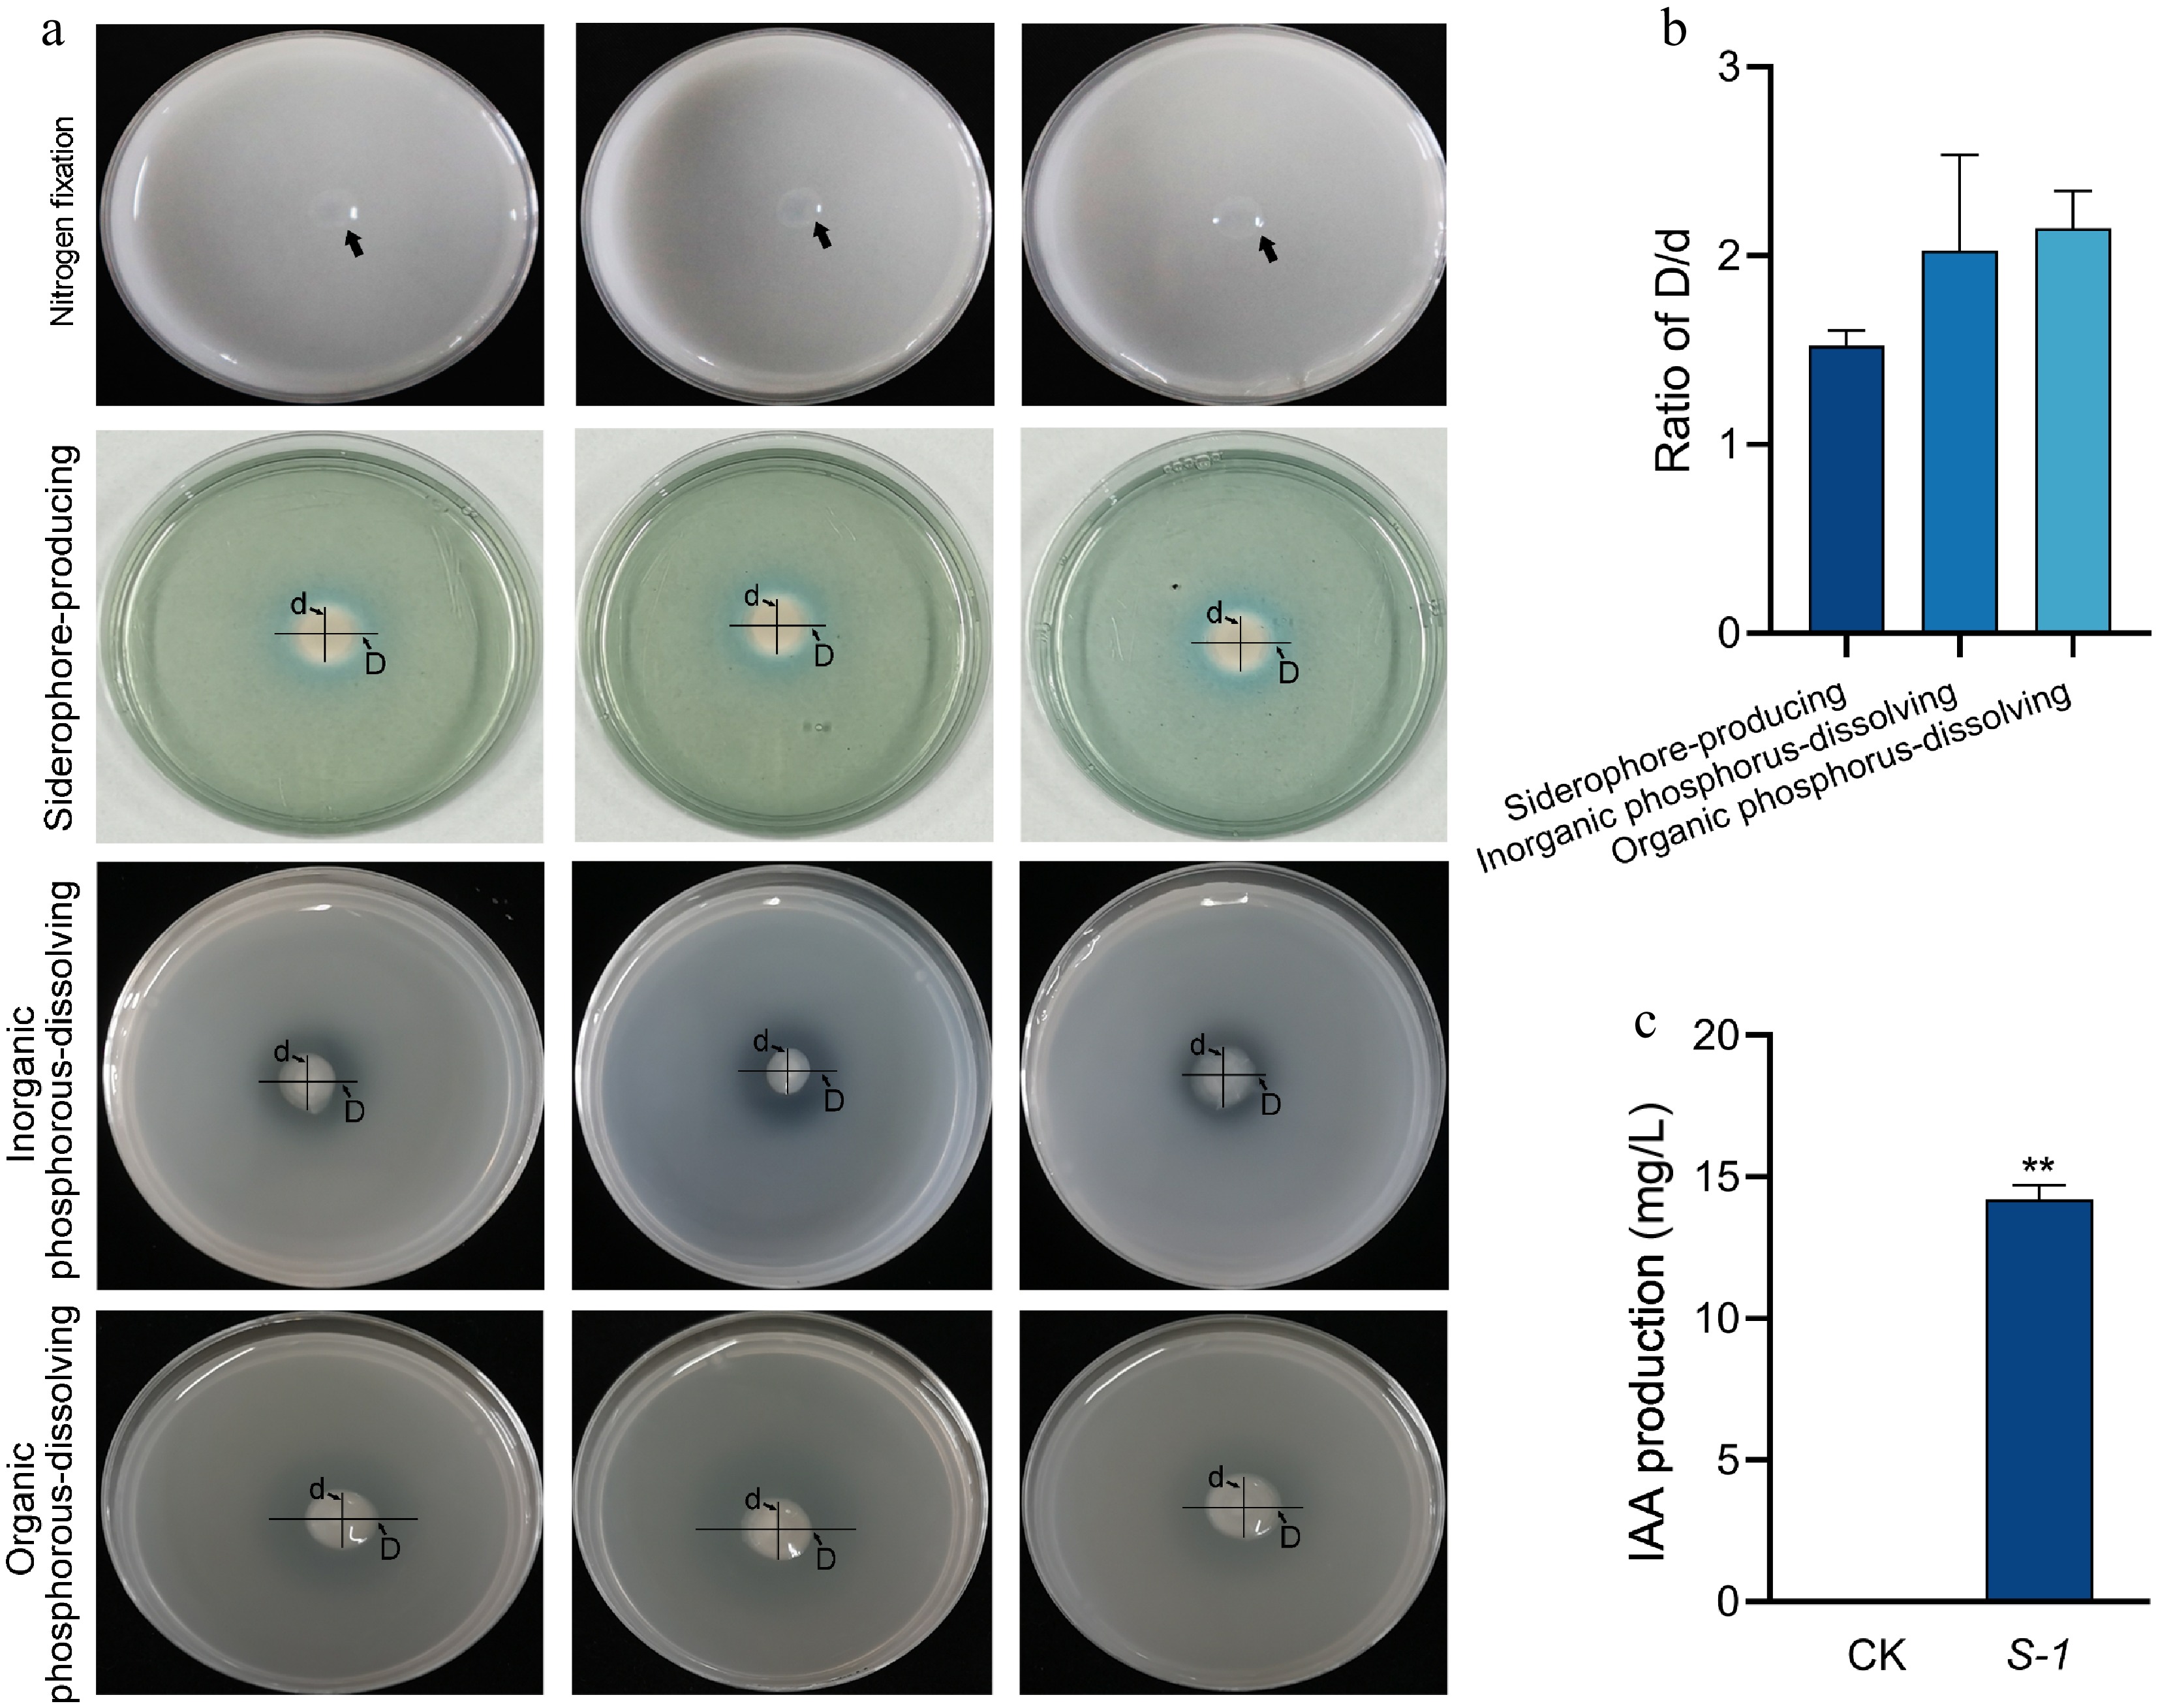
Figure 3.
Analysis of the growth-promoting capacity of S-1. (a), (b) Analysis of nitrogen fixation, phosphorus-dissolving, and siderophore-producing capacity. (c) Analysis of IAA production capacity. Each bar indicates the mean ± SD. Asterisks represent statistical significance determined by Student's t-test (** p < 0.01).
-
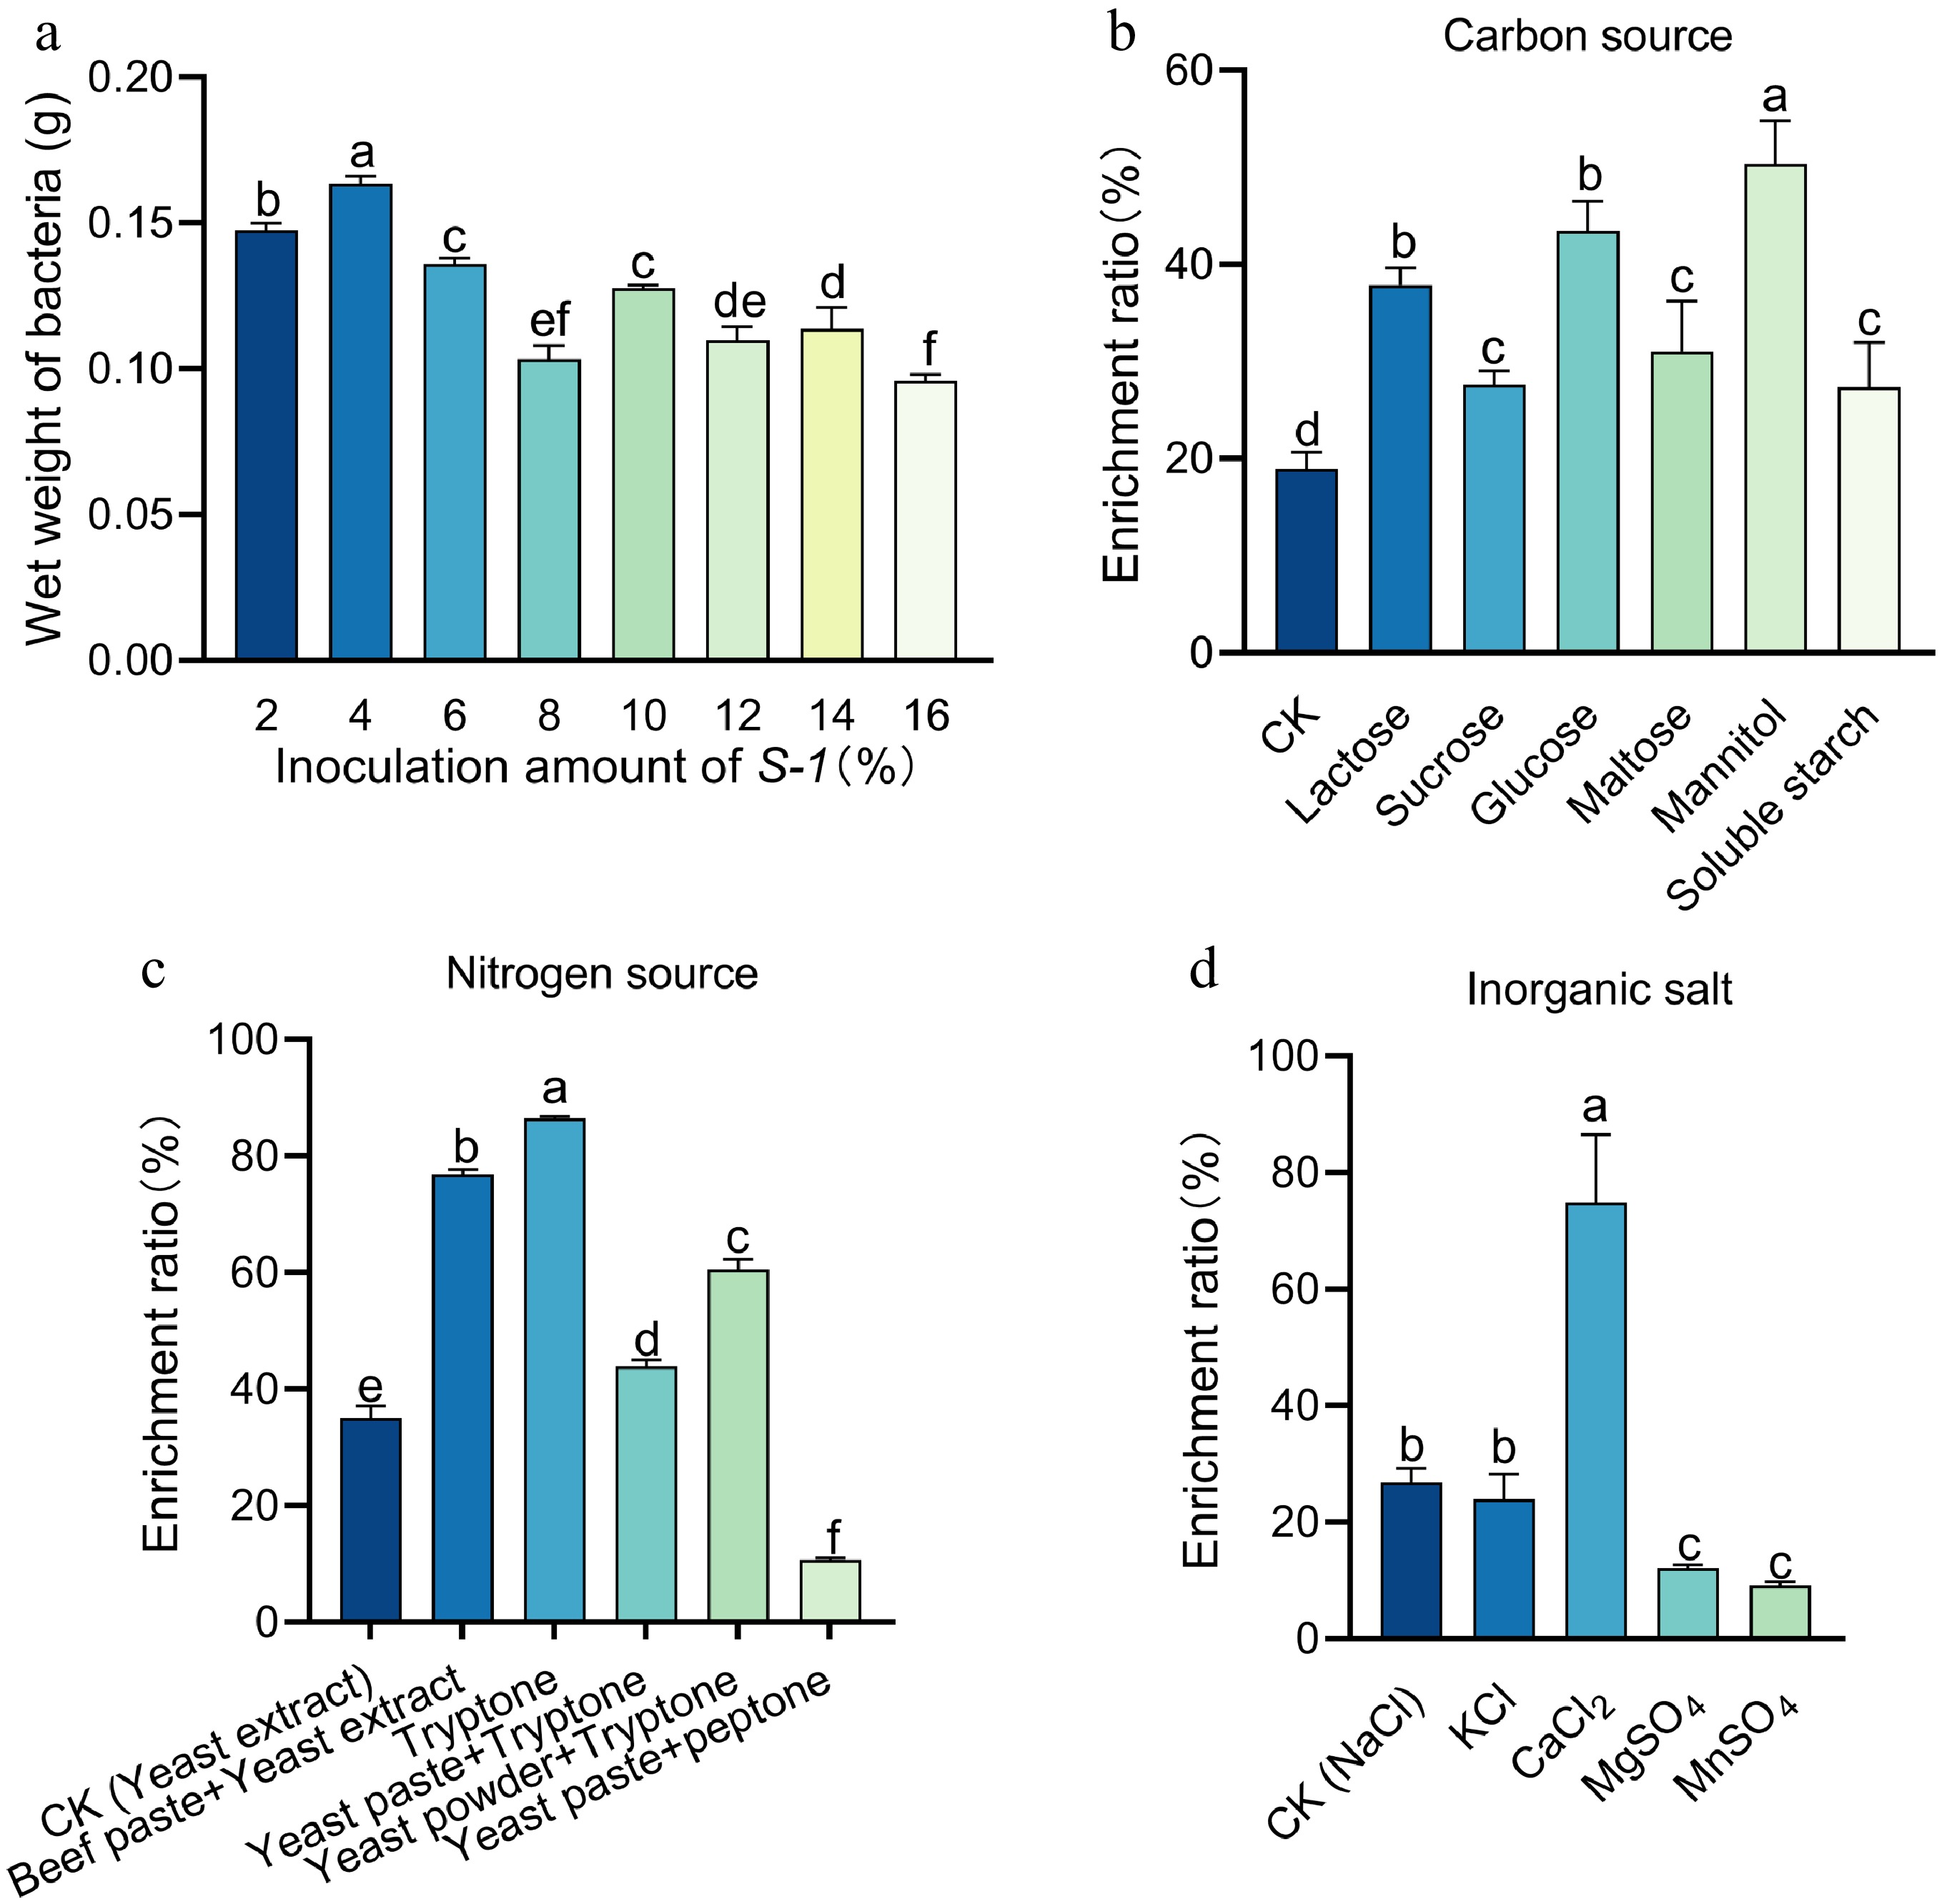
Figure 4.
Optimization of the fermentation medium for S-1 SeNPs. (a) Determination of optimal inoculum amount for S-1. (b)−(d) Screening of optimal nitrogen source, carbon source and inorganic salts. Each bar indicates the mean ± SD, and statistical significance (p < 0.05) is indicated by different letters according to Duncan's multiple range test.
-
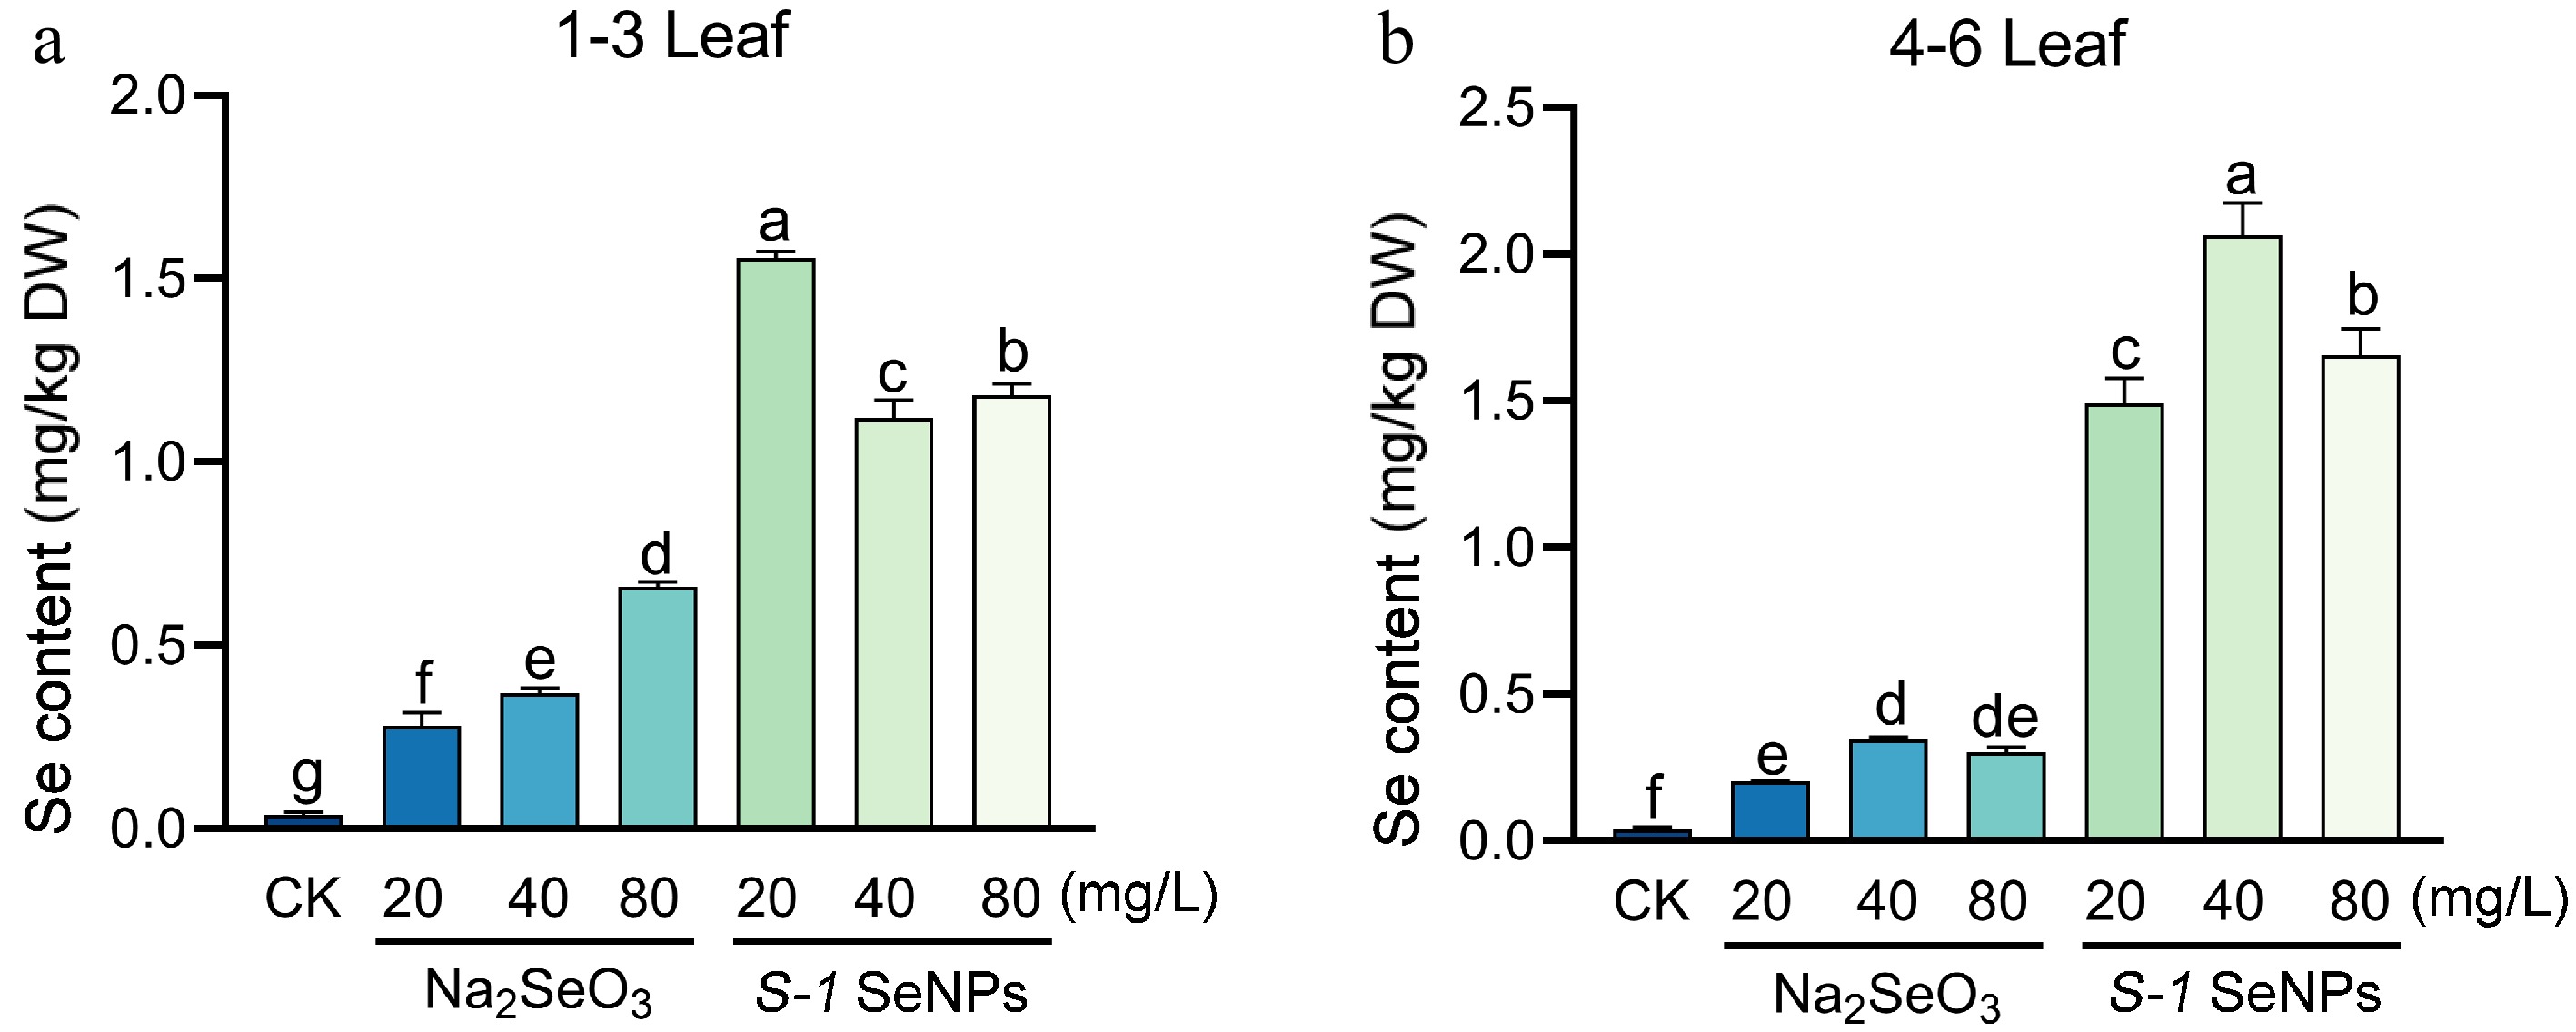
Figure 5.
Selenium content in summer-autumn tea fresh leaves after foliar spraying with S-1 SeNPs and Na2SeO3. (a) Selenium content of summer-autumn tea in young leaves. (b) Selenium content of summer-autumn tea in mature leaves. Each bar indicates the mean ± SD, and statistical significance (p < 0.05) is indicated by different letters according to Duncan's multiple range test.
-
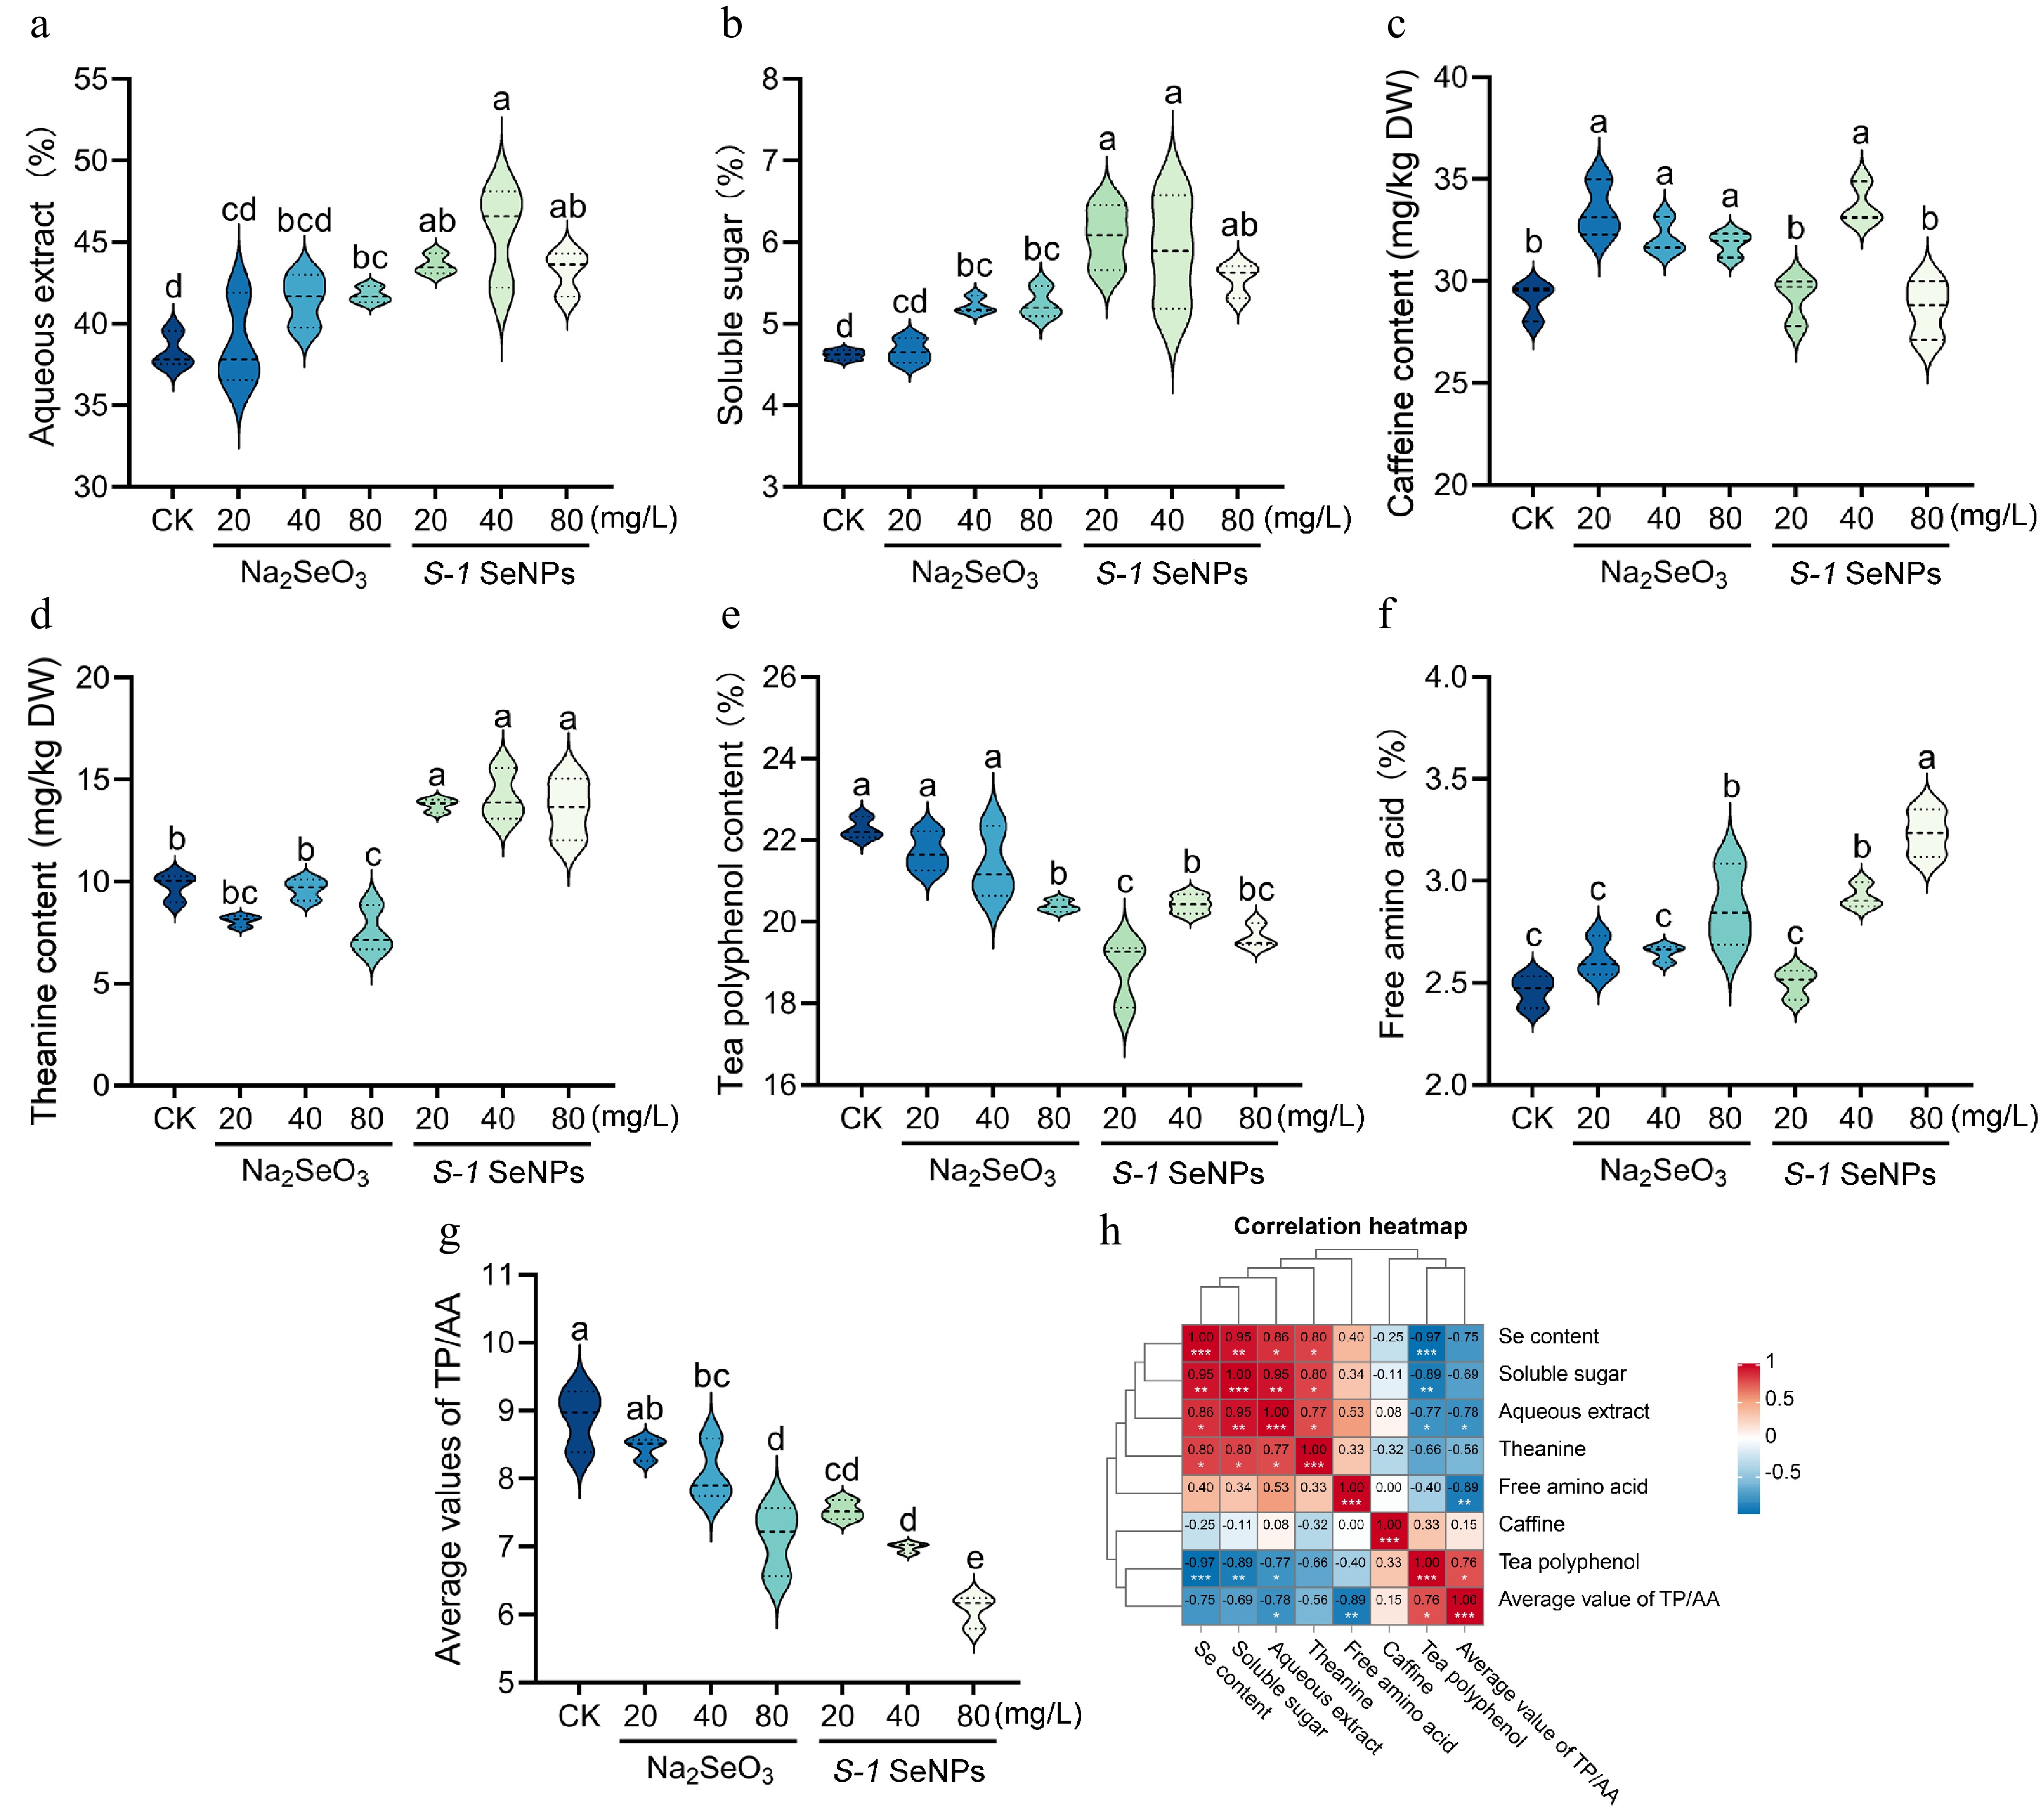
Figure 6.
Content of major biochemical components in summer-autumn tea fresh leaves after foliar spraying with S-1 SeNPs. (a)−(f) Content of aqueous extract, soluble sugar, caffeine, theanine, tea polyphenols, and free amino acids. (g) Phenol-ammonia ratio. (h) Heat map of correlation between selenium and major biochemical components. Each bar indicates the mean ± SD, and statistical significance (p < 0.05) is indicated by different letters according to Duncan's multiple range test.
-
Treatment GC EGC C EC EGCG ECG CG GCG Total catechins CK 5.009 ± 0.088b 10.062 ± 0.295b 7.303 ± 0.056a 10.327 ± 0.316a 113.74 ± 2.977a 13.138 ± 0.516b 3.543 ± 0.071ab 0.4 ± 0.025cd 163.521 ± 2.095ab Na2SeO3-20 4.143 ± 0.138d 9.844 ± 0.355b 7.253 ± 0.575a 8.707 ± 0.414b 115.554 ± 3.866a 14.941 ± 0.854a 3.862 ± 0.34a 0.324 ± 0.068d 164.629 ± 2.943a Na2SeO3-40 4.281 ± 0.131d 9.304 ± 0.193cd 7.173 ± 0.495a 8.684 ± 0.091b 112.828 ± 1.187a 14.065 ± 0.415ab 3.269 ± 0.274ab 0.573 ± 0.095bc 160.177 ± 2.438ab Na2SeO3-80 6.282 ± 0.185a 9.693 ± 0.099bc 7.439 ± 0.662a 8.718 ± 0.102b 114.549 ± 1.504a 11.95 ± 0.331c 3.383 ± 0.246ab 0.38 ± 0.024d 162.396 ± 2.358ab S-1 SeNPs-20 4.735 ± 0.187c 10.589 ± 0.306a 5.844 ± 0.388b 10.352 ± 0.634a 105.053 ± 2.736b 13.673 ± 0.389b 3.083 ± 0.182bc 0.423 ± 0.145cd 153.752 ± 4.743cd S-1 SeNPs-40 6.09 ± 0.085a 8.892 ± 0.259d 6.234 ± 0.599b 7.238 ± 0.258c 115.132 ± 3.000a 11.441 ± 0.824c 2.977 ± 0.441bc 0.691 ± 0.095b 158.695 ± 3.395bc S-1 SeNPs-80 3.539 ± 0.165e 9.973 ± 0.123b 5.614 ± 0.585b 8.941 ± 0.742b 106.393 ± 0.865b 10.566 ± 0.285d 2.64 ± 0.47d 1.223 ± 0.153a 148.889 ± 1.306d Statistical significance (p < 0.05) is indicated by a different lower case letter, based on Duncan's multiple range test. Table 1.
Content of catechin fractions in young summer-autumn tea fresh leaves after foliar spraying with S-1 SeNPs (mg/g DW).
-
Organization Treatment Al Cd Fe Cu Zn F 1−3 Leaf CK 407.609 ± 5.923a 0.128 ± 0.008a 99.057 ± 4.47a 6.022 ± 0.061c 32.425 ± 0.294bc 104.725 ± 3.03a Na2SeO3-20 375.568 ± 12.834b 0.124 ± 0.011a 78.859 ± 11.469bc 7.347 ± 0.104b 32.97 ± 2.084abc 99.491 ± 2.924a Na2SeO3-40 397.657 ± 21.568ab 0.109 ± 0.002b 71.116 ± 4.626cde 6.171 ± 0.171c 33.295 ± 3.386abc 77.664 ± 5.176b Na2SeO3-80 381.622 ± 3.717b 0.103 ± 0.002bc 88.794 ± 7.481ab 7.559 ± 0.145b 38.573 ± 2.712a 78.465 ± 8.538b S-1 SeNPs-20 350.993 ± 22.579c 0.097 ± 0.005c 74.169 ± 7.182cd 7.61 ± 0.145b 36.302 ± 3.15ab 76.088 ± 6.065b S-1 SeNPs-40 266.612 ± 4.941d 0.073 ± 0.006d 61.699 ± 7.701de 6.131 ± 0.367c 30.044 ± 4.754c 60.784 ± 2.947c S-1 SeNPs-80 241.625 ± 4.768e 0.063 ± 0.001d 58.133 ± 4.864e 8.292 ± 0.545a 38.392 ± 2.791a 74.666 ± 5.04b Statistical significance (p < 0.05) is indicated by a different lower case letter, based on Duncan's multiple range test. Table 2.
Content of some elements in young summer-autumn tea fresh leaves after foliar spraying with S-1 SeNPs (mg/kg DW).
-
Organization Treatment Al Cd Fe Cu Zn F 4−6 Leaf CK 2095.842 ± 112.689a 0.179 ± 0.007a 116.171 ± 2.917a 5.59 ± 0.195c 19.157 ± 1.205b 574.049 ± 24.699a Na2SeO3-20 1453.677 ± 50.696c 0.149 ± 0.009b 82.675 ± 4.345b 6.347 ± 0.117b 23.649 ± 2.844ab 560.489 ± 32.39ab Na2SeO3-40 1701.189 ± 27.697b 0.114 ± 0.003cd 69.753 ± 5.489d 5.262 ± 0.164bc 18.895 ± 1.956b 508.938 ± 7.363c Na2SeO3-80 2023.124 ± 75.592a 0.118 ± 0.012c 85.331 ± 4.176b 7.628 ± 0.494a 19.205 ± 3.683b 529.286 ± 22.752bc S-1 SeNPs-20 1237.24 ± 6.856d 0.114 ± 0.001cd 79.404 ± 2.669bc 5.725 ± 0.321bcd 23.092 ± 2.864ab 397.916 ± 18.117e S-1 SeNPs-40 1283.071 ± 11.484d 0.103 ± 0.004d 73.599 ± 1.643cd 6.164 ± 0.279bc 24.537 ± 2.785a 459.837 ± 13.397d S-1 SeNPs-80 1286.445 ± 42.1d 0.113 ± 0.005cd 84.427 ± 1.015b 5.927 ± 0.723bcd 27.342 ± 2.607a 404.02 ± 17.577e Statistical significance (p < 0.05) is indicated by a different lower case letter, based on Duncan's multiple range test. Table 3.
Content of some elements in mature summer-autumn tea fresh leaves after foliar spraying with S-1 SeNPs (mg/kg DW).
Figures
(6)
Tables
(3)