-
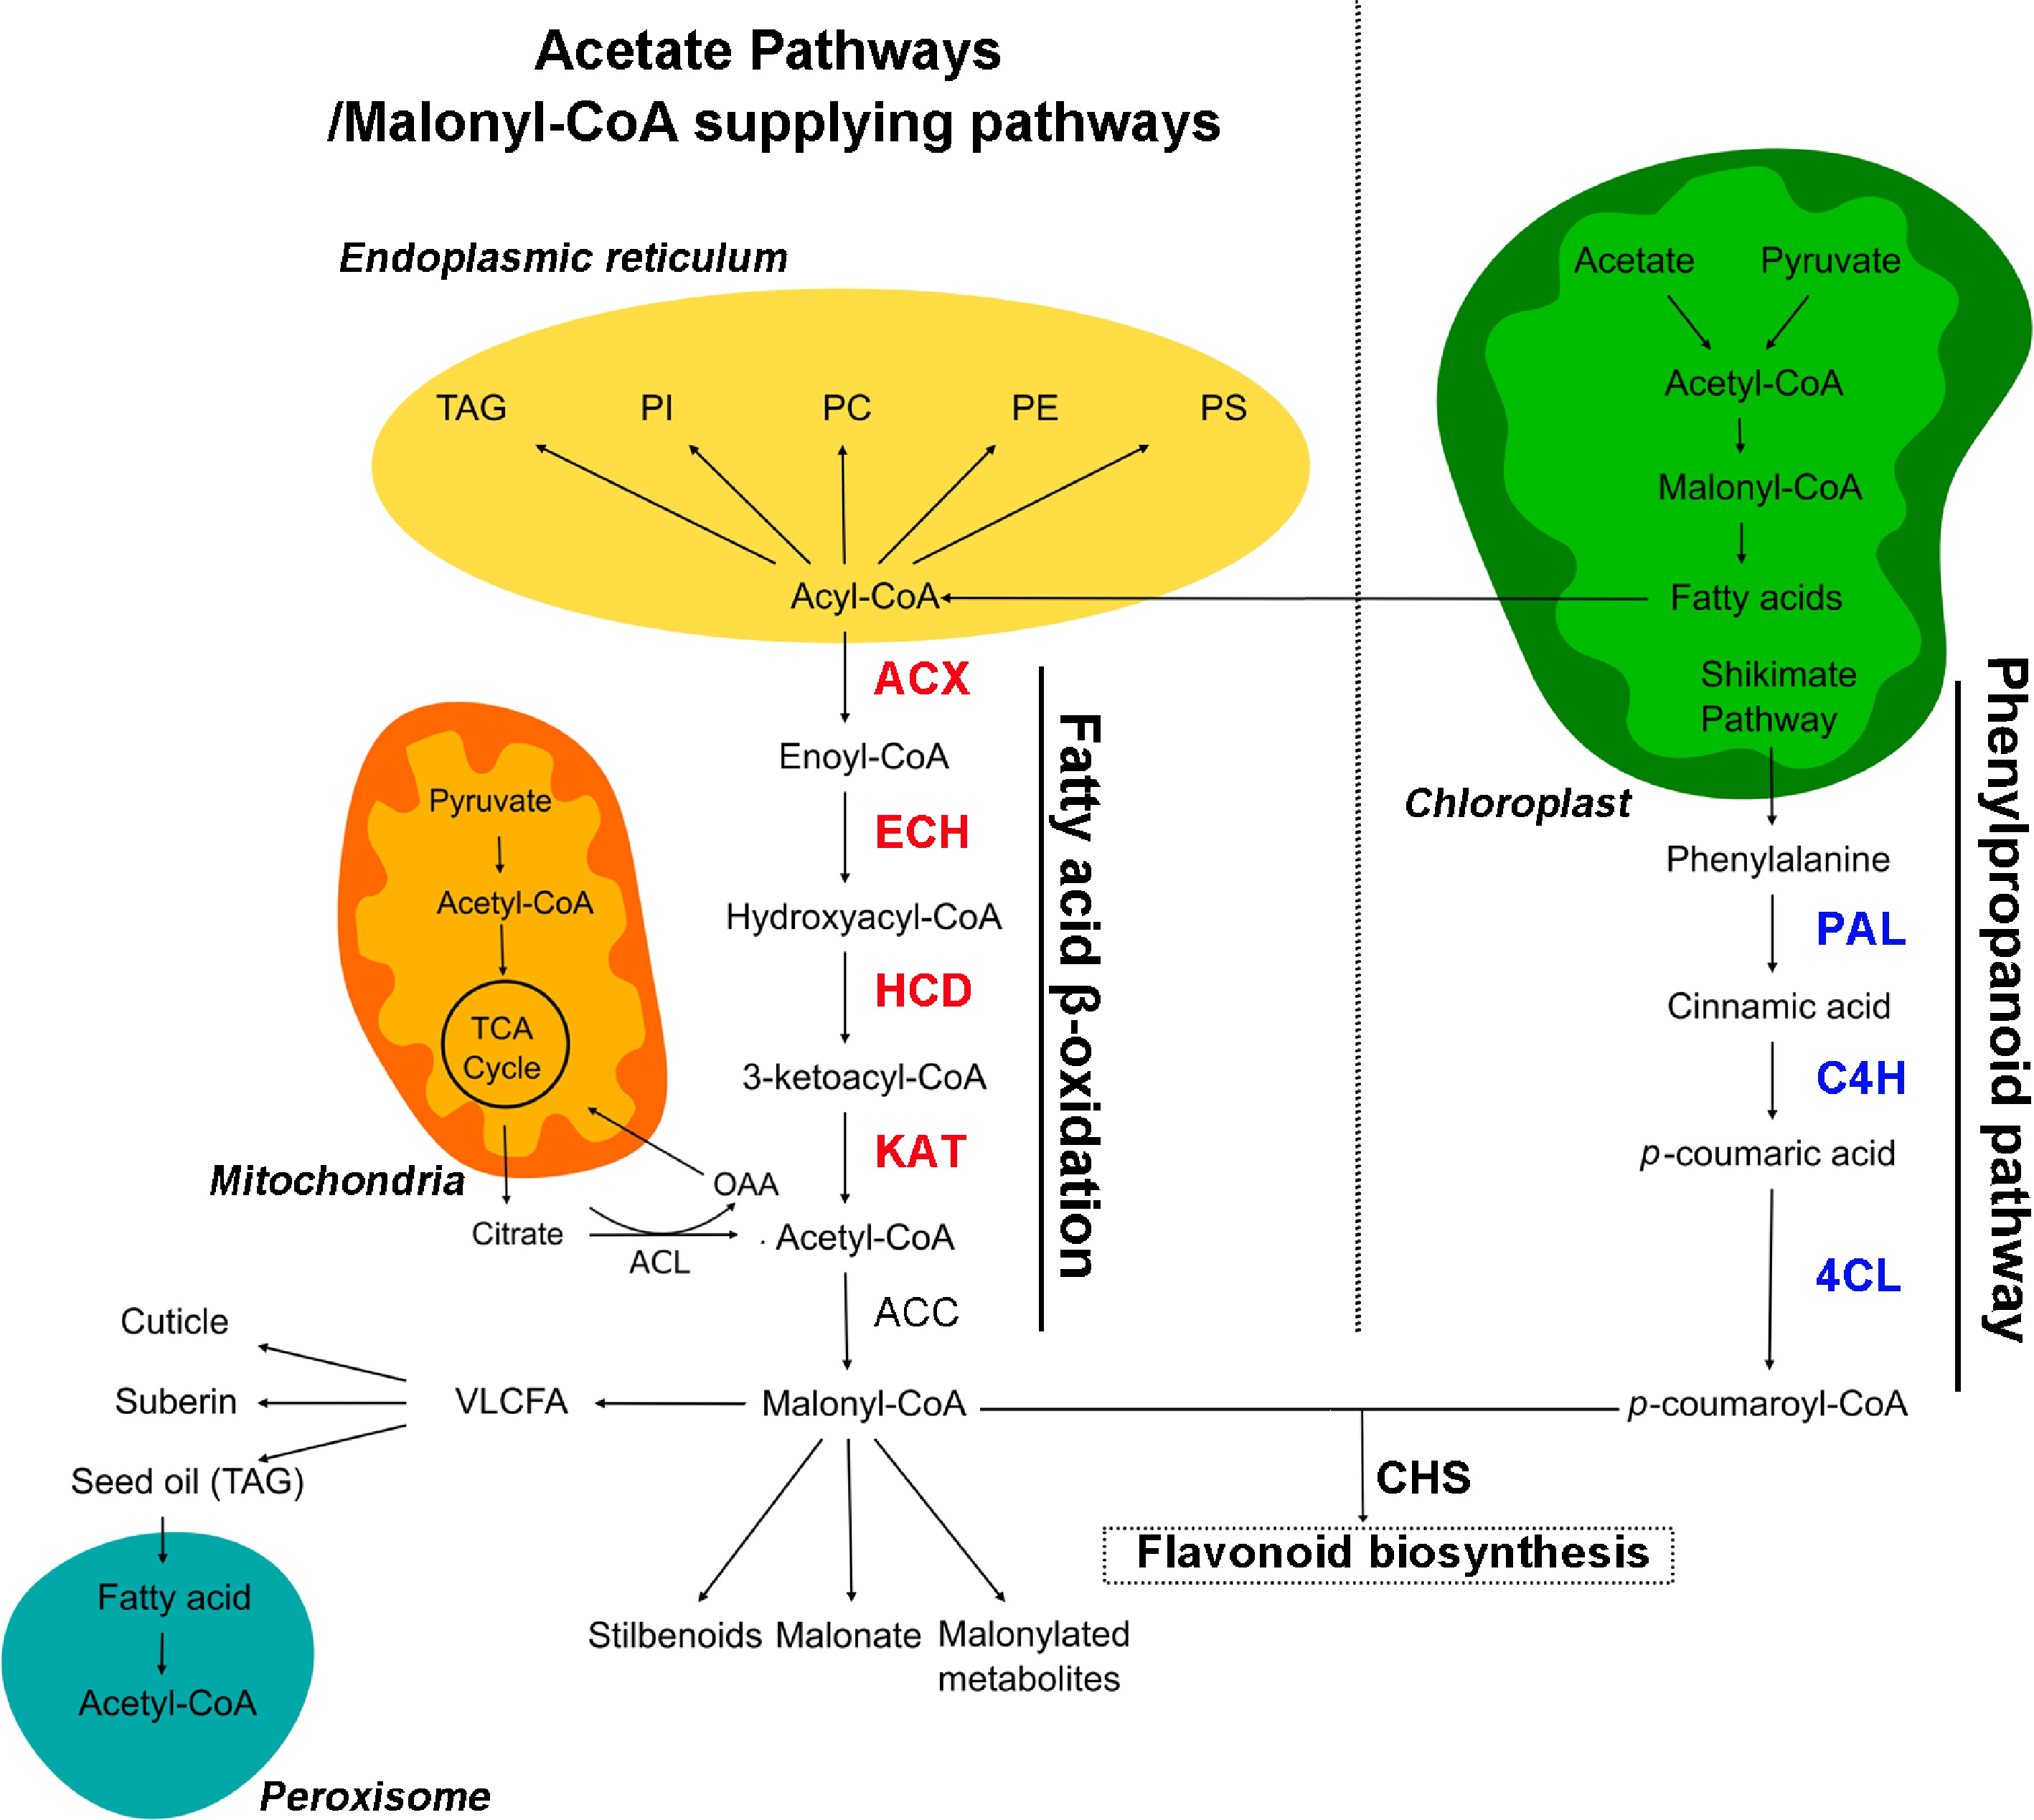
Figure 1.
Overview of flavonoid and acetyl-CoA metabolic pathways in plants. Enzymes mentioned in this work are highlighted in red for fatty acid β-oxidation and blue for the phenylpropanoid pathway. OAA, oxaloacetate; ECH, enoyl-CoA hydratase; HCD, hydroxyacyl-CoA dehydrogenase; PAL, phenylalanine ammonia lyase; C4H, cinnamate 4-hydroxylase; 4CL, 4-coumarate: CoA ligase; CHS, chalcone synthase. The pathway map was drawn according to the report of Perez de Souza et al.[5].
-
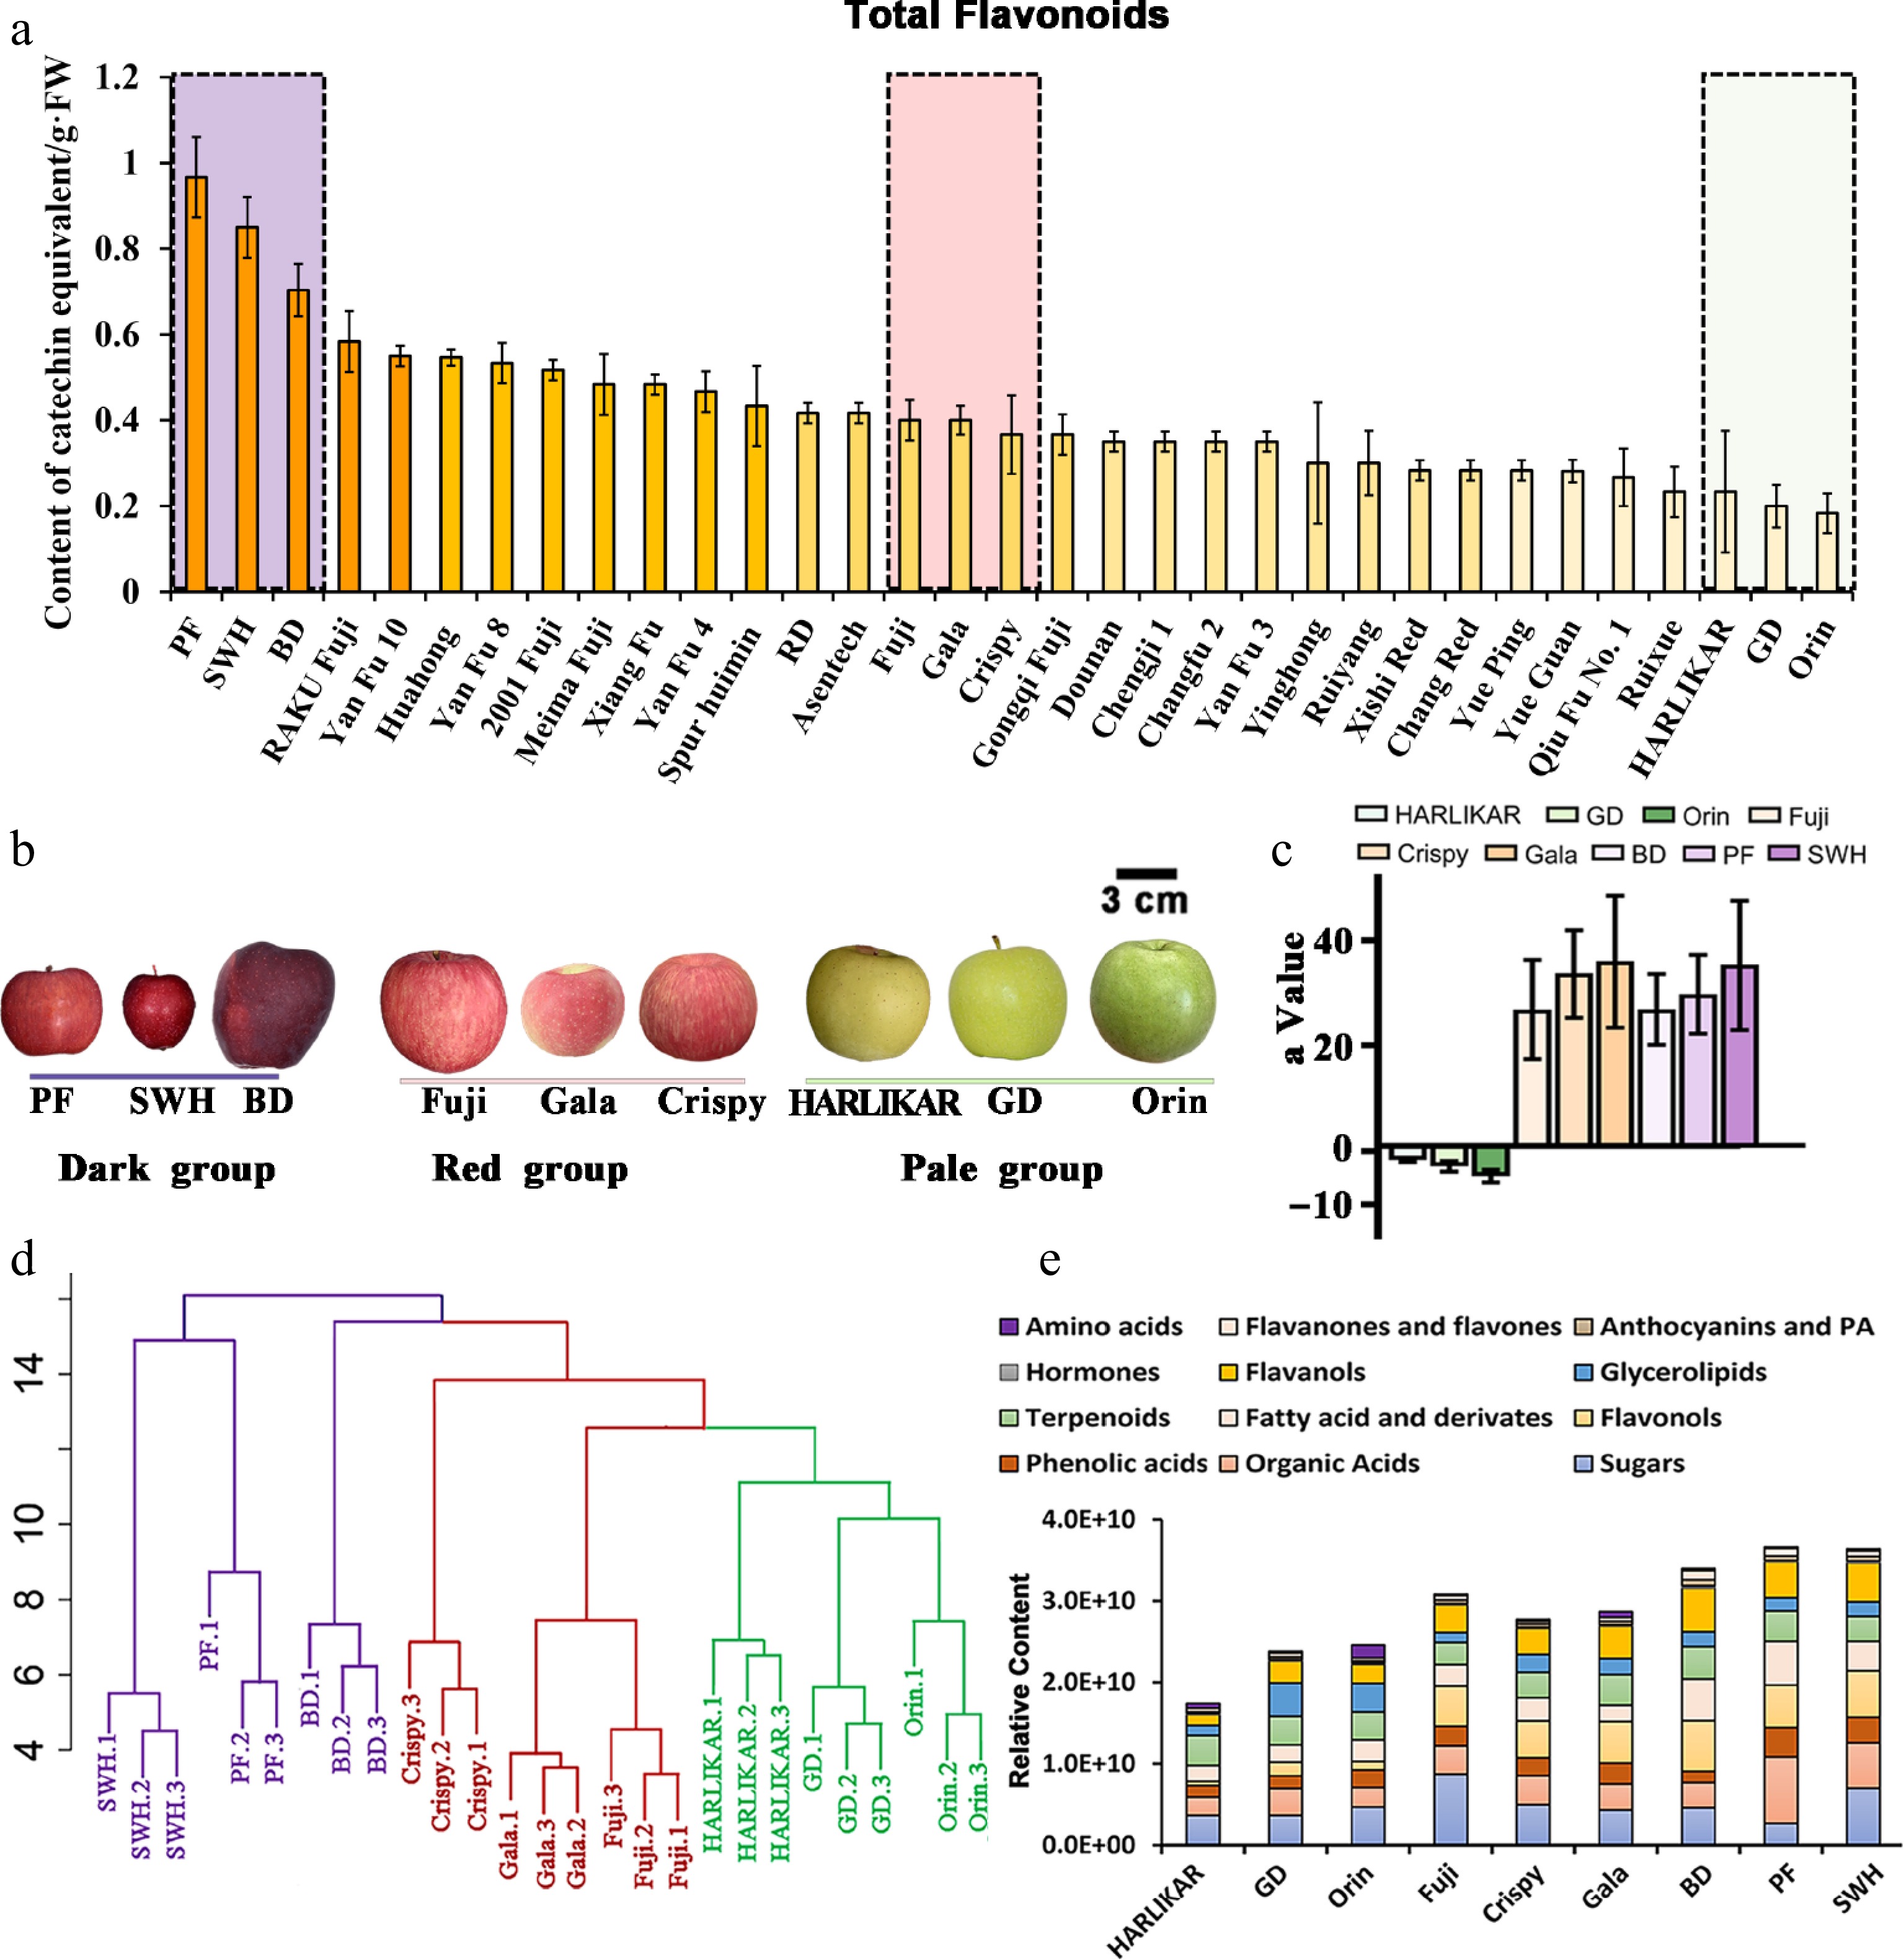
Figure 2.
Nontargeted analysis of nine apple cultivars with different flavonoid contents. (a) Total flavonoid contents of 33 popular cultivars. (b) Appearance of the fruit of nine selected cultivars with different flavonoid contents. (c) The 'a' value of the colorimeter for these nine cultivars. (d) Hierarchical clustering of nontargeted metabolic results of nine cultivars. Cultivars in the same group are indicated in the same color. (e) Relative content of each metabolic subclass observed via nontargeted analysis. Data are the means ± standard deviation (SD) of three biological replicates. Detailed data of the nontarget analysis are presented in Supplementary Table S1.
-
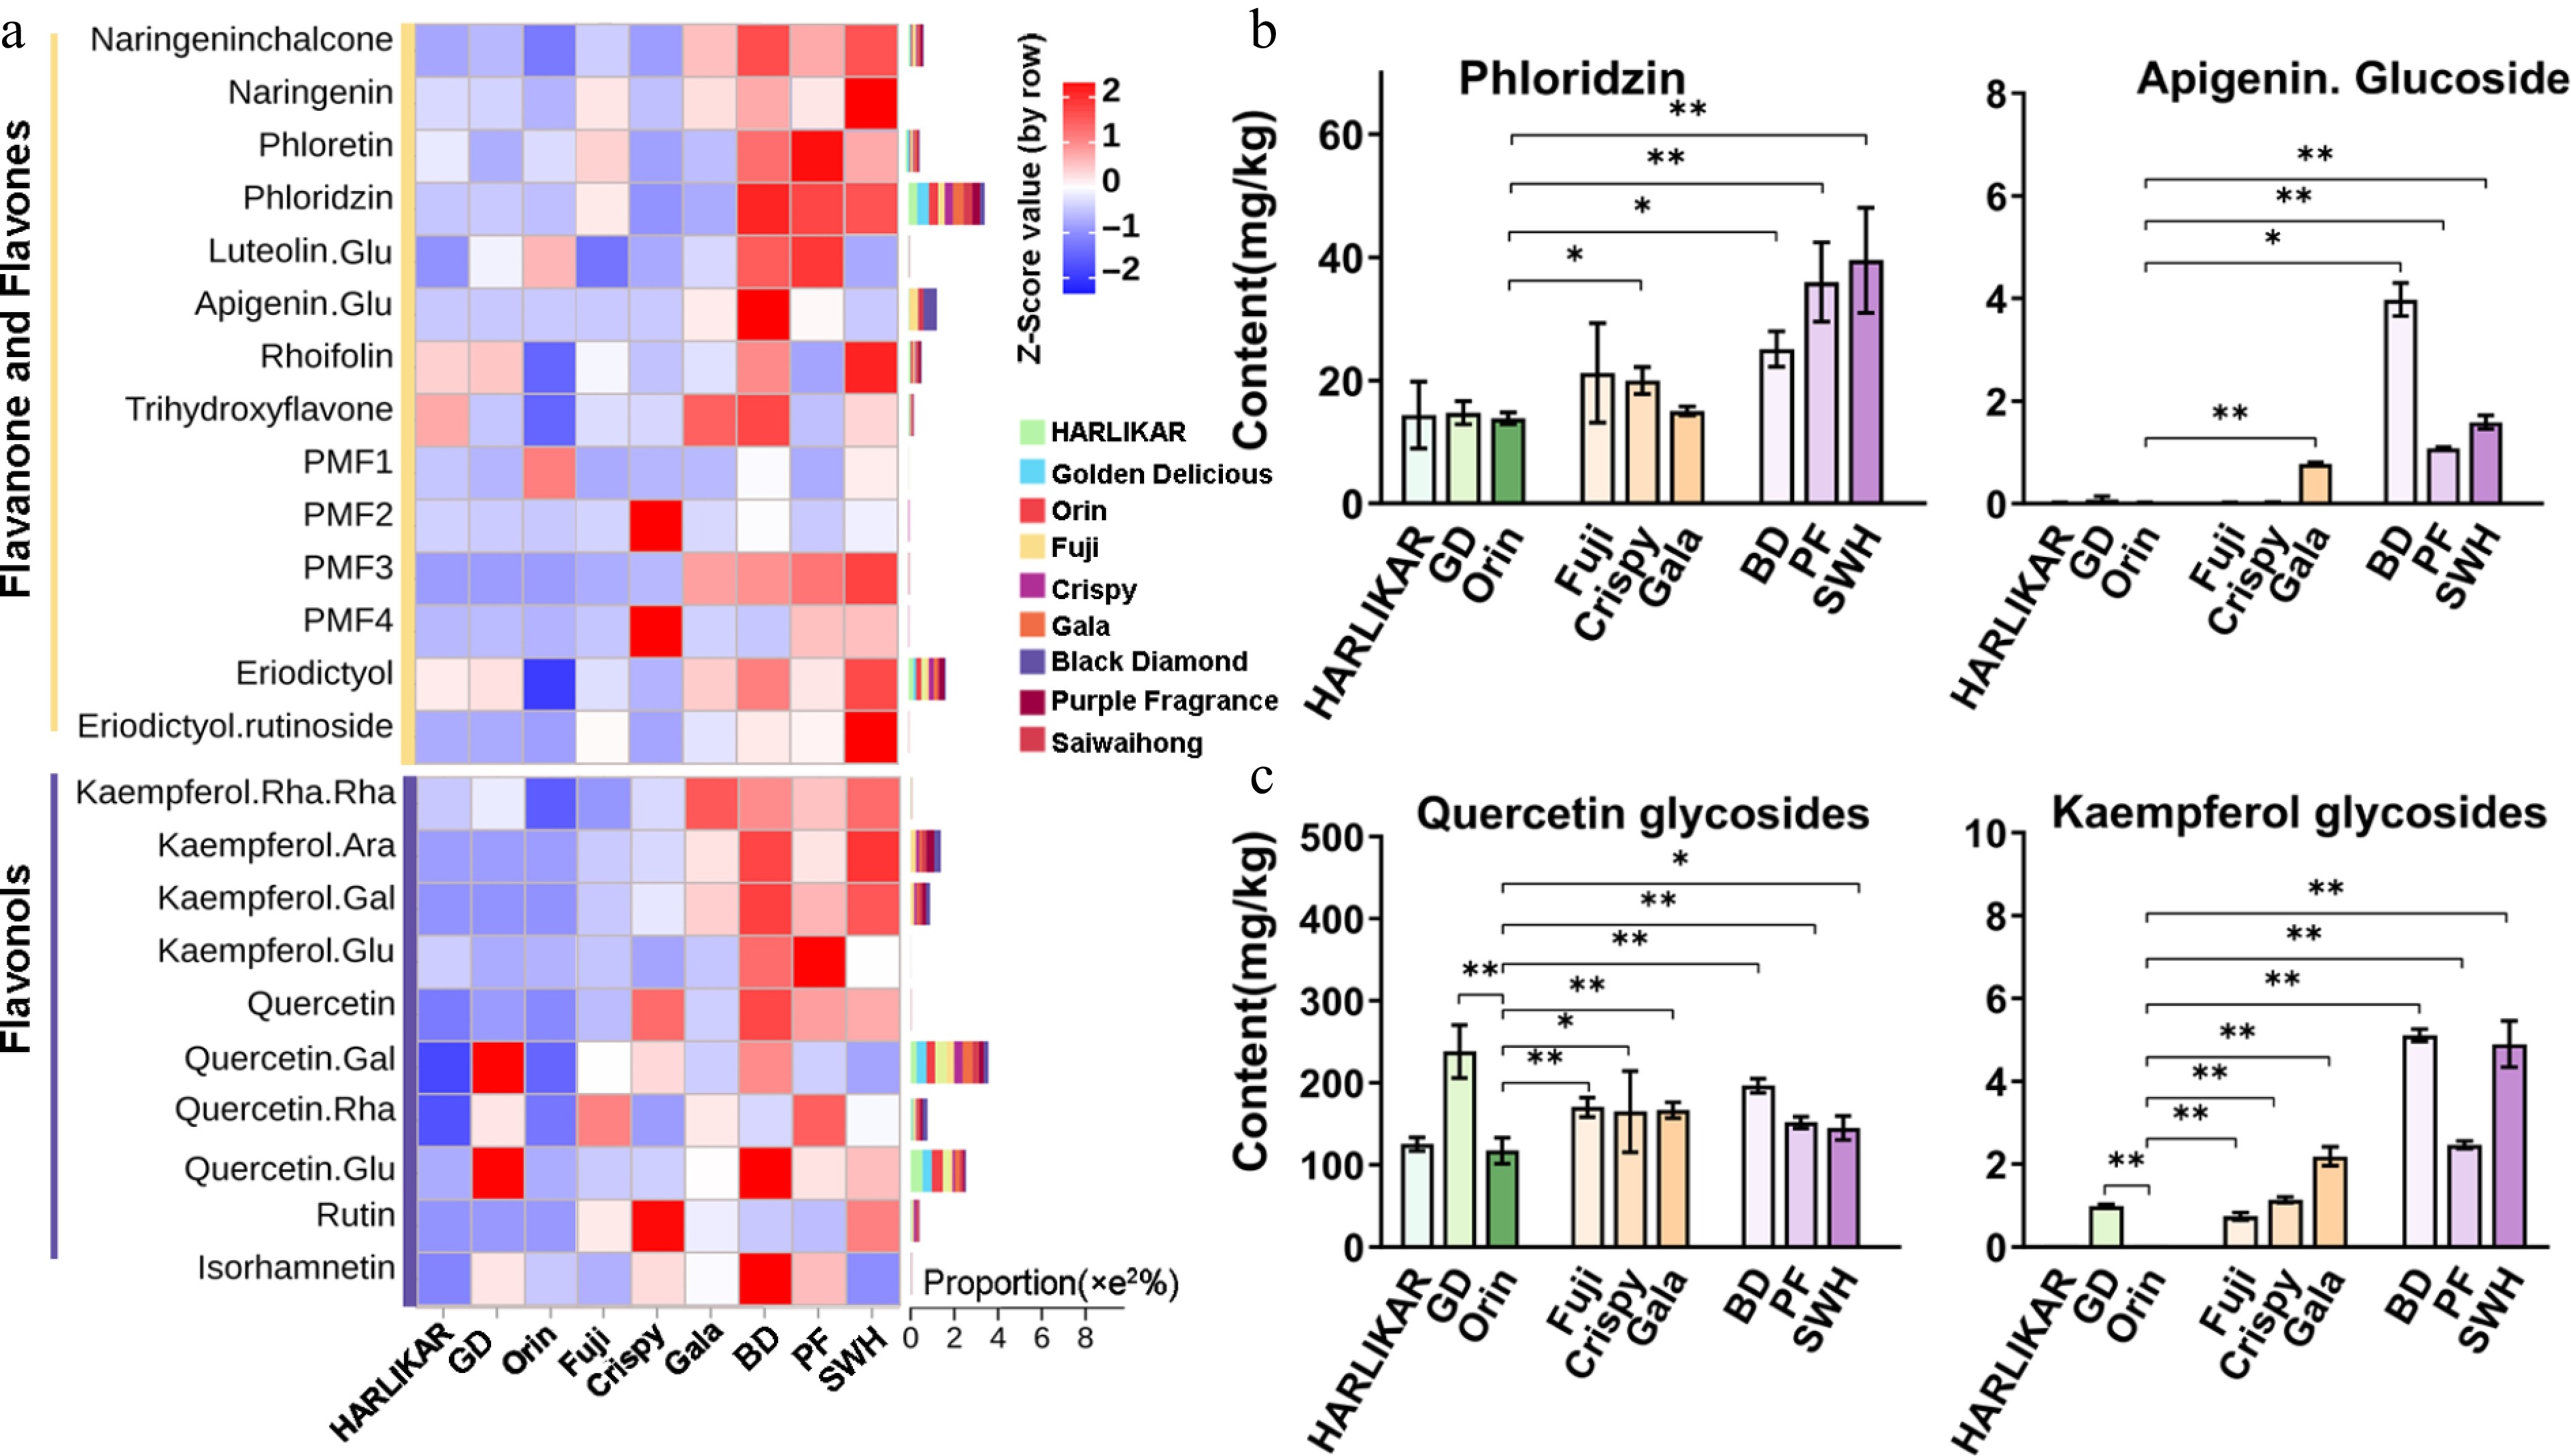
Figure 3.
Content variations of flavanone-flavones and flavonols among the three groups. (a) Contents of flavanone-flavones and flavonol compounds measured by LC-Orbitrap MS/MS. Color scales from red to blue represent values from high to low. Bars located to the left of heatmap represent the total proportion of each compound in each subclass. (b) Contents of phloridzin and apigenin glucoside from the flavanone-flavones subclass measured by QQQ MS/MS. (c) Contents of quercetin and kaempferol glycosides from the flavonol subclass. Data are the means ± SD of three biological replicates. Student's t-test p-values were calculated between 'Orin' and other cultivars. * and ** indicate Student's t-test p-values lower than 0.05 and 0.01, respectively (n = 3).
-
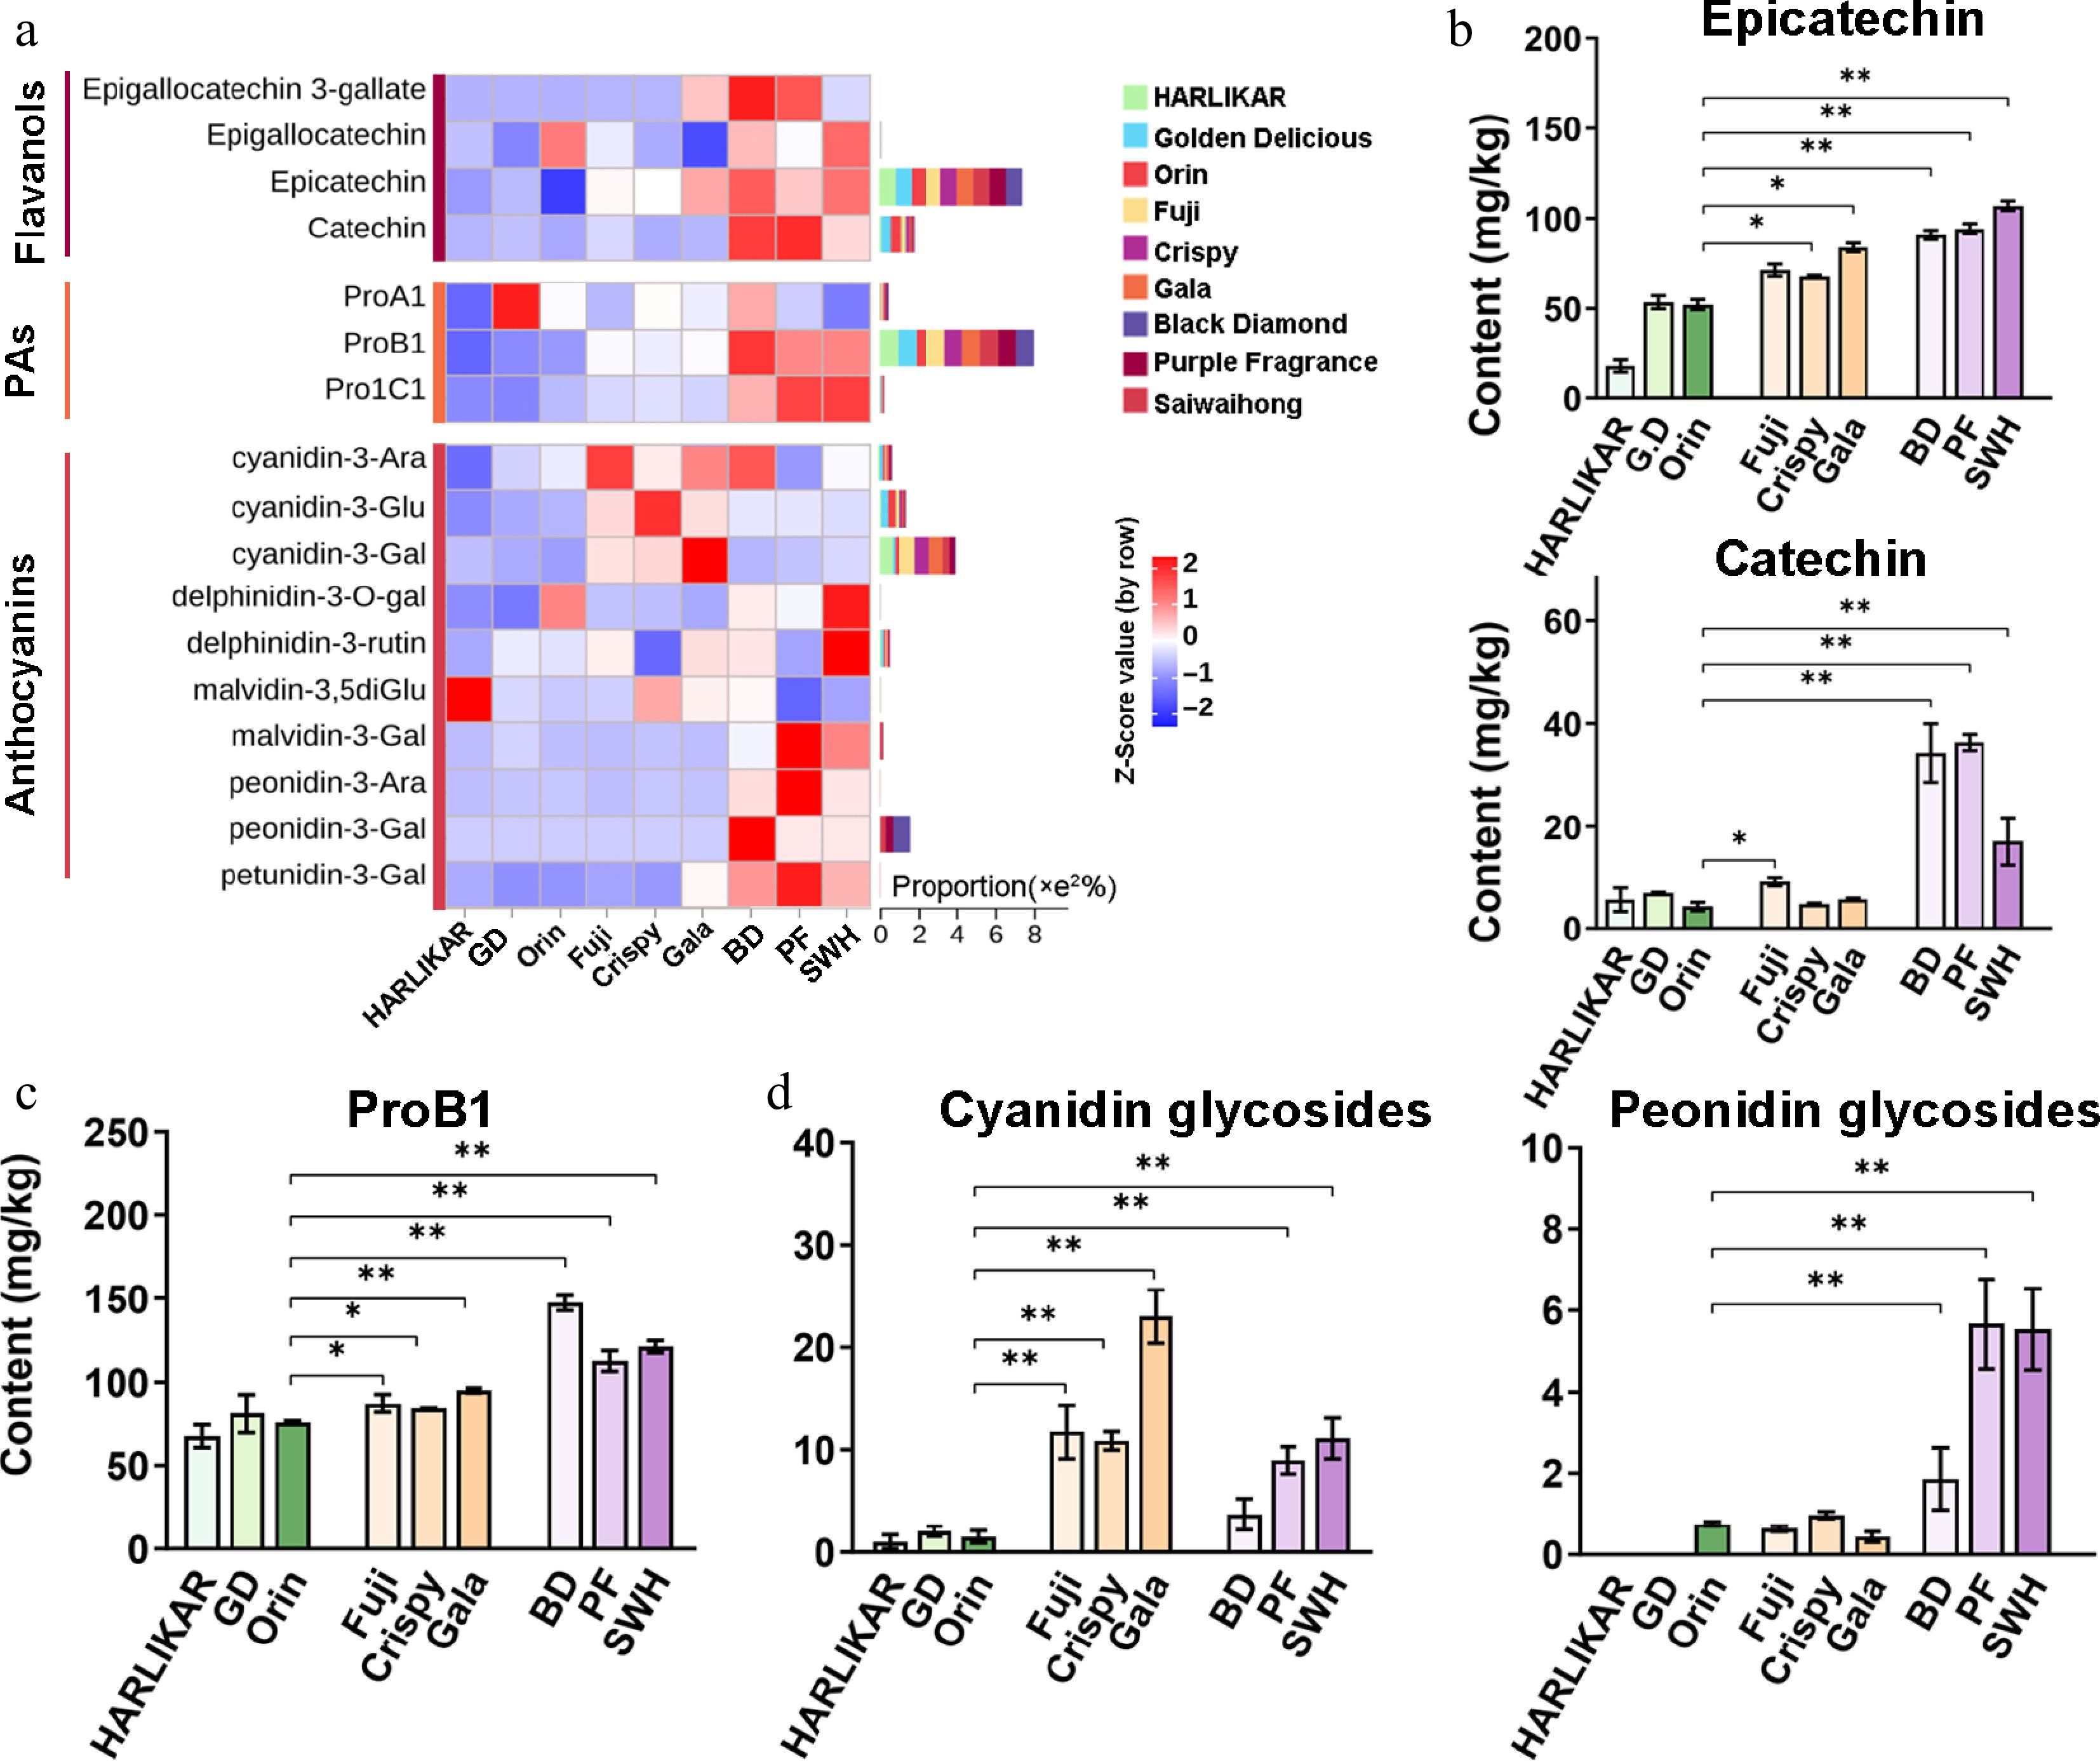
Figure 4.
Variation in the content of flavanol, proanthocyanidins (PAs), and anthocyanins among the three groups. (a) Contents of flavanol, PAs, and anthocyanins. Flavanols and PAs were measured by LC-Orbitrap MS/MS while anthocyanins were measured by QQQ MS/MS. Color scales from red to blue represent values from high to low. Bars to the left of the heatmap represent the total proportion of each compound in each subclass. (b) Contents of epicatechin and catechin from the flavanol subclass. (c) Contents of PoB1 from the PA subclass. (d) Contents of cyanidin and peonidin glycosides from the anthocyanin subclass. Data are the means ± SD of three biological replicates. Student's t-test p-values were calculated between 'Orin' and other cultivars. * and ** indicate Student's t-test p-values lower than 0.05 and 0.01, respectively (n = 3).
-
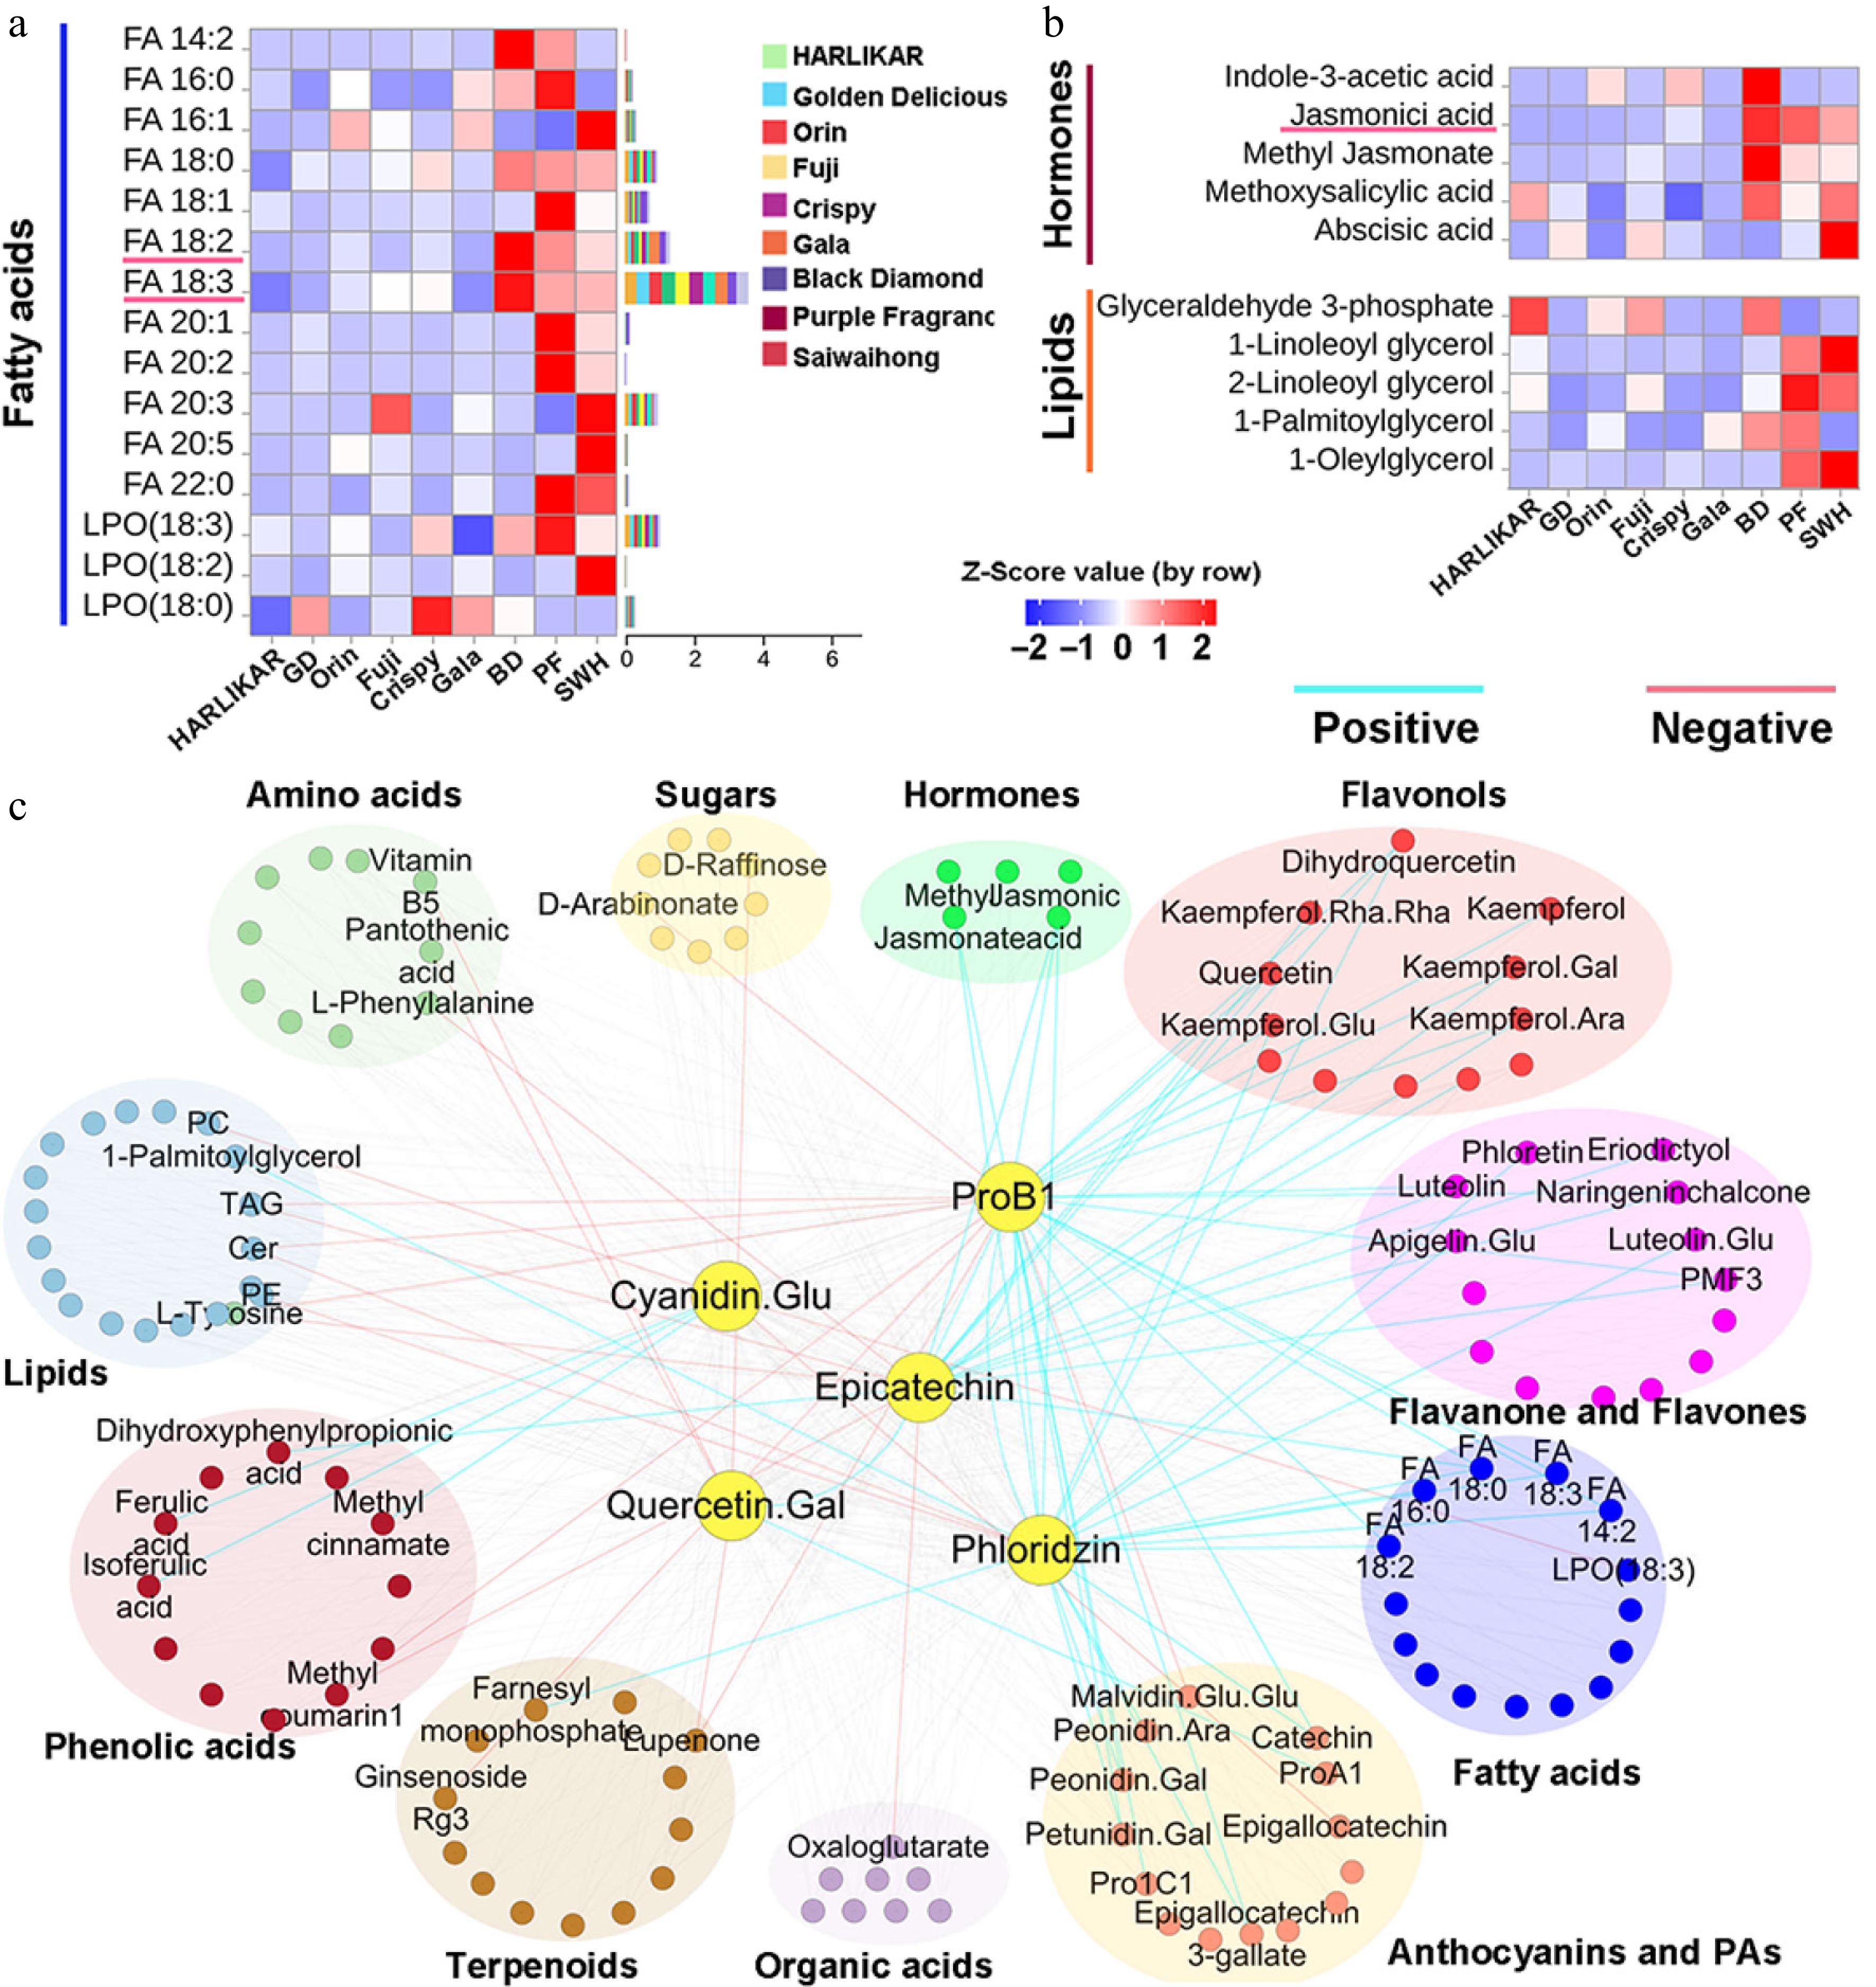
Figure 5.
Content variation of other metabolites and their correlation with major flavonoids. (a) and (b) Contents of fatty acids, hormones, and lipids measured by LC-Orbitrap-MS/MS. Color scales from red to blue represent values from high to low. Bars to the left of the heat map represent the total proportion of each compound in each subclass. (c) Correlation network of major flavonoid components and other metabolites. The correlation matrix was calculated using Pearson's correlation algorithm. The nodes represent metabolites and the edges represent the correlations between metabolites and the five flavonoids with a Pearson correlation coefficient above an absolute threshold of 0.7 and p ≤ 0.05. The edge colors represent positive (light blue) and negative (red) correlation coefficients between the pairs of metabolites.
-
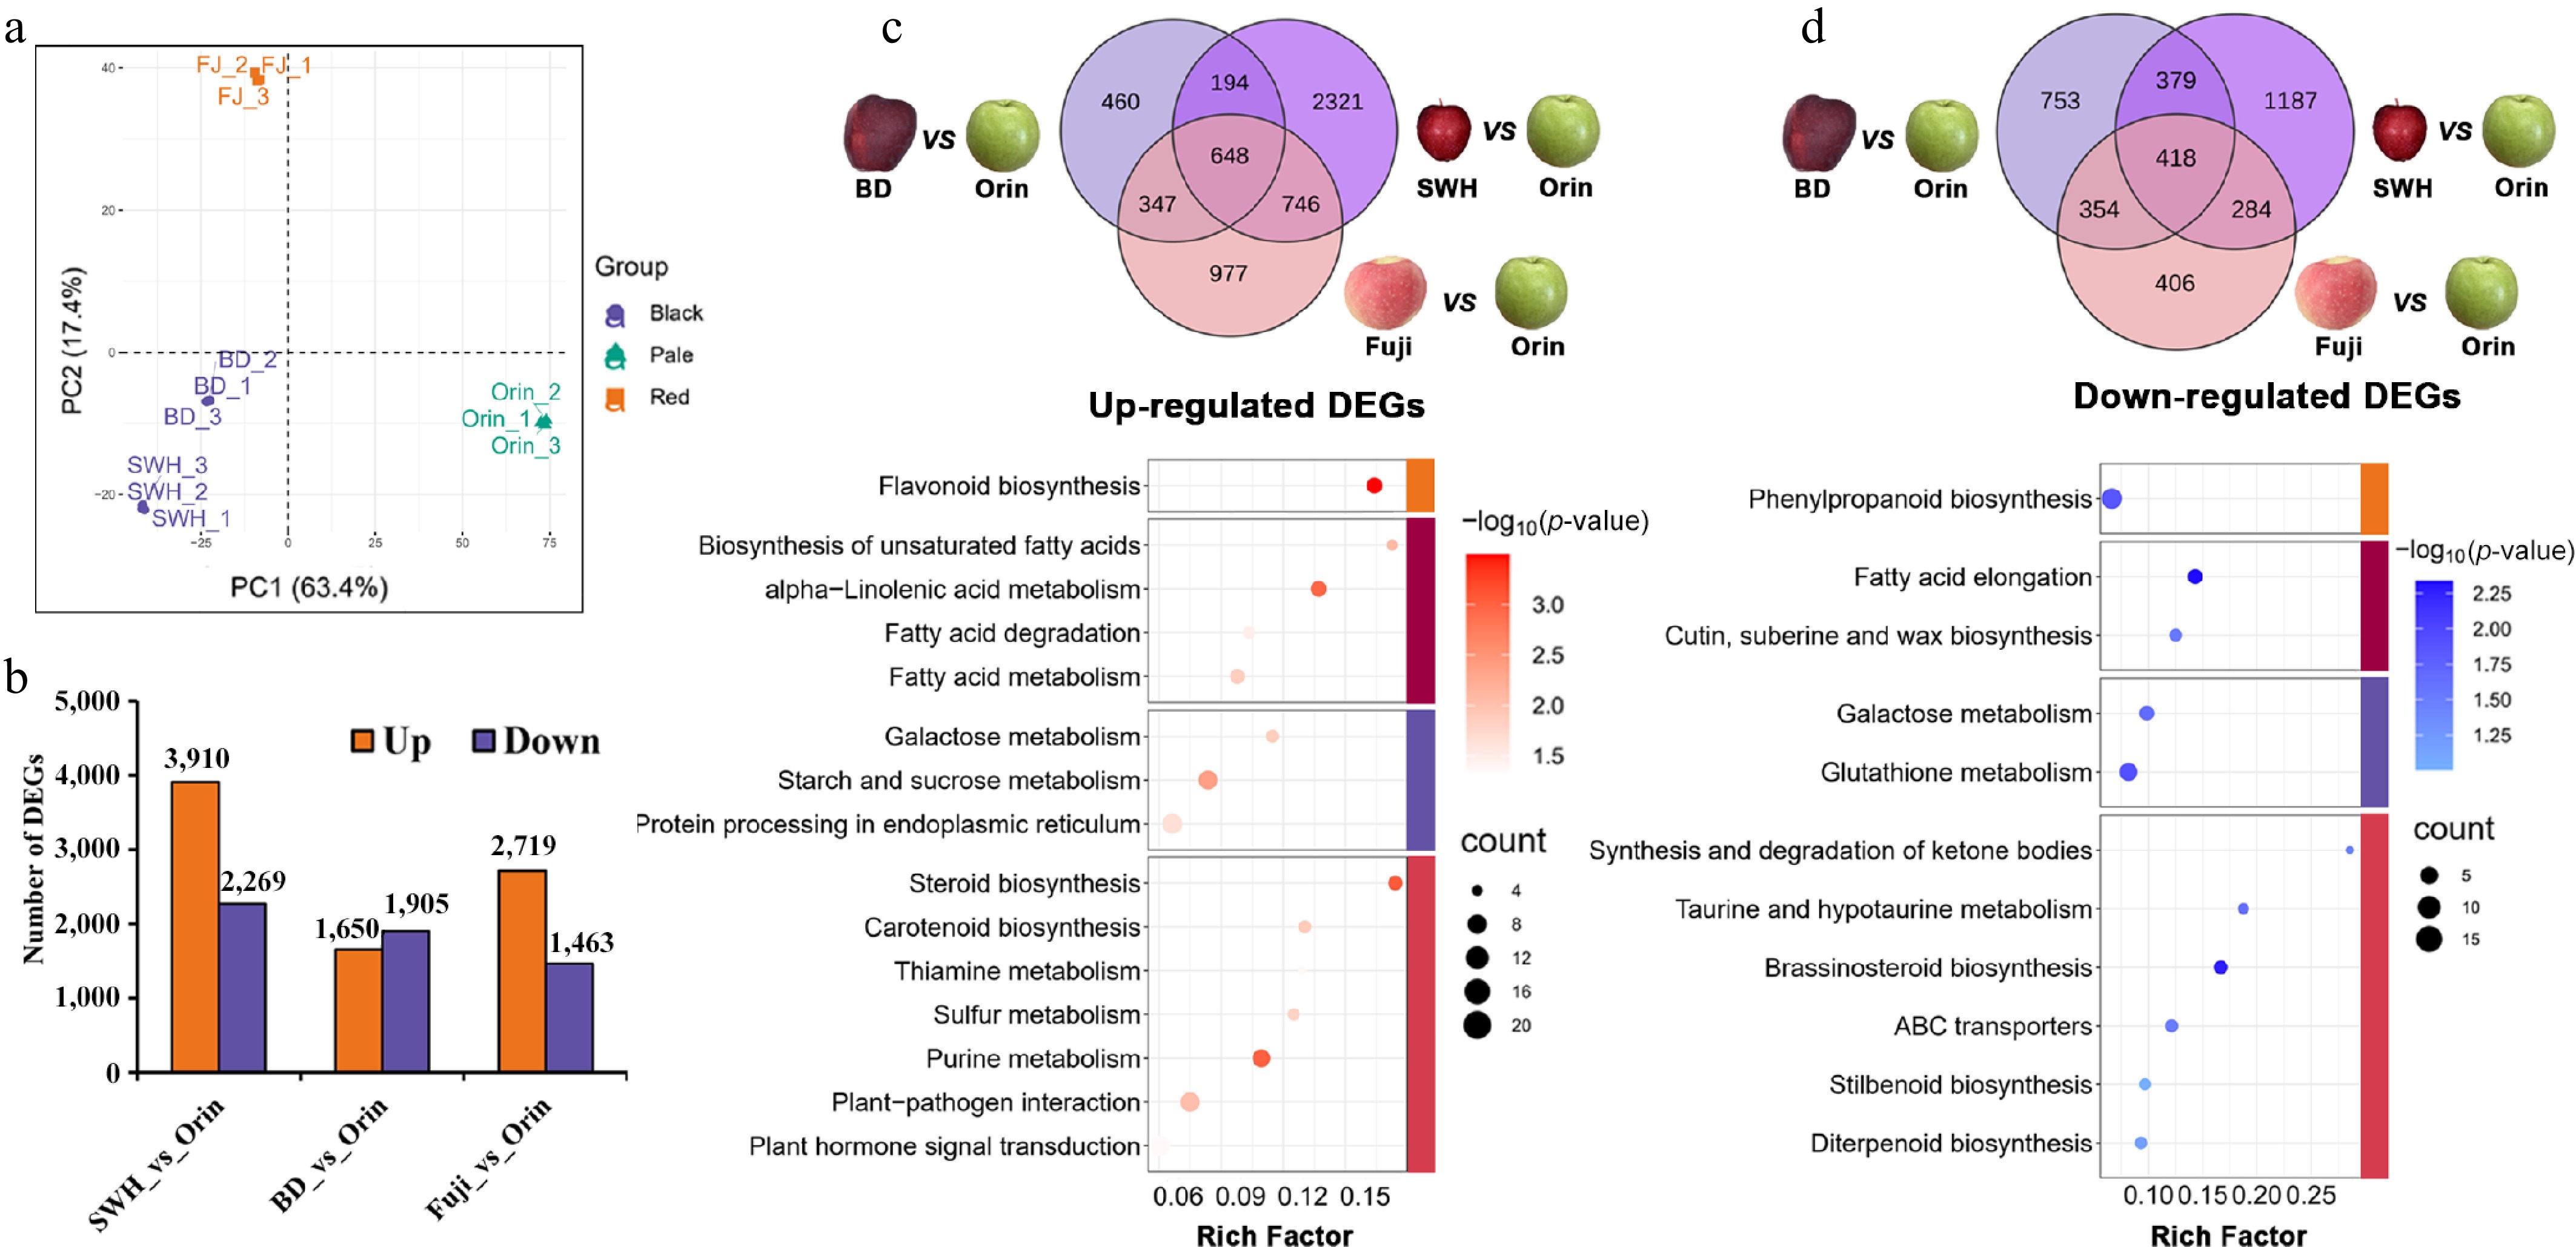
Figure 6.
DEGs among representative cultivars from the three groups. (a) PCA results of the samples used for transcriptome measurements. (b) Number of up- or downregulated genes between 'Orin' and other cultivars. (c) overlapping upregulated genes and their KEGG pathway enrichment results. (d) Overlapping downregulated genes and their KEGG pathway enrichment results.
-
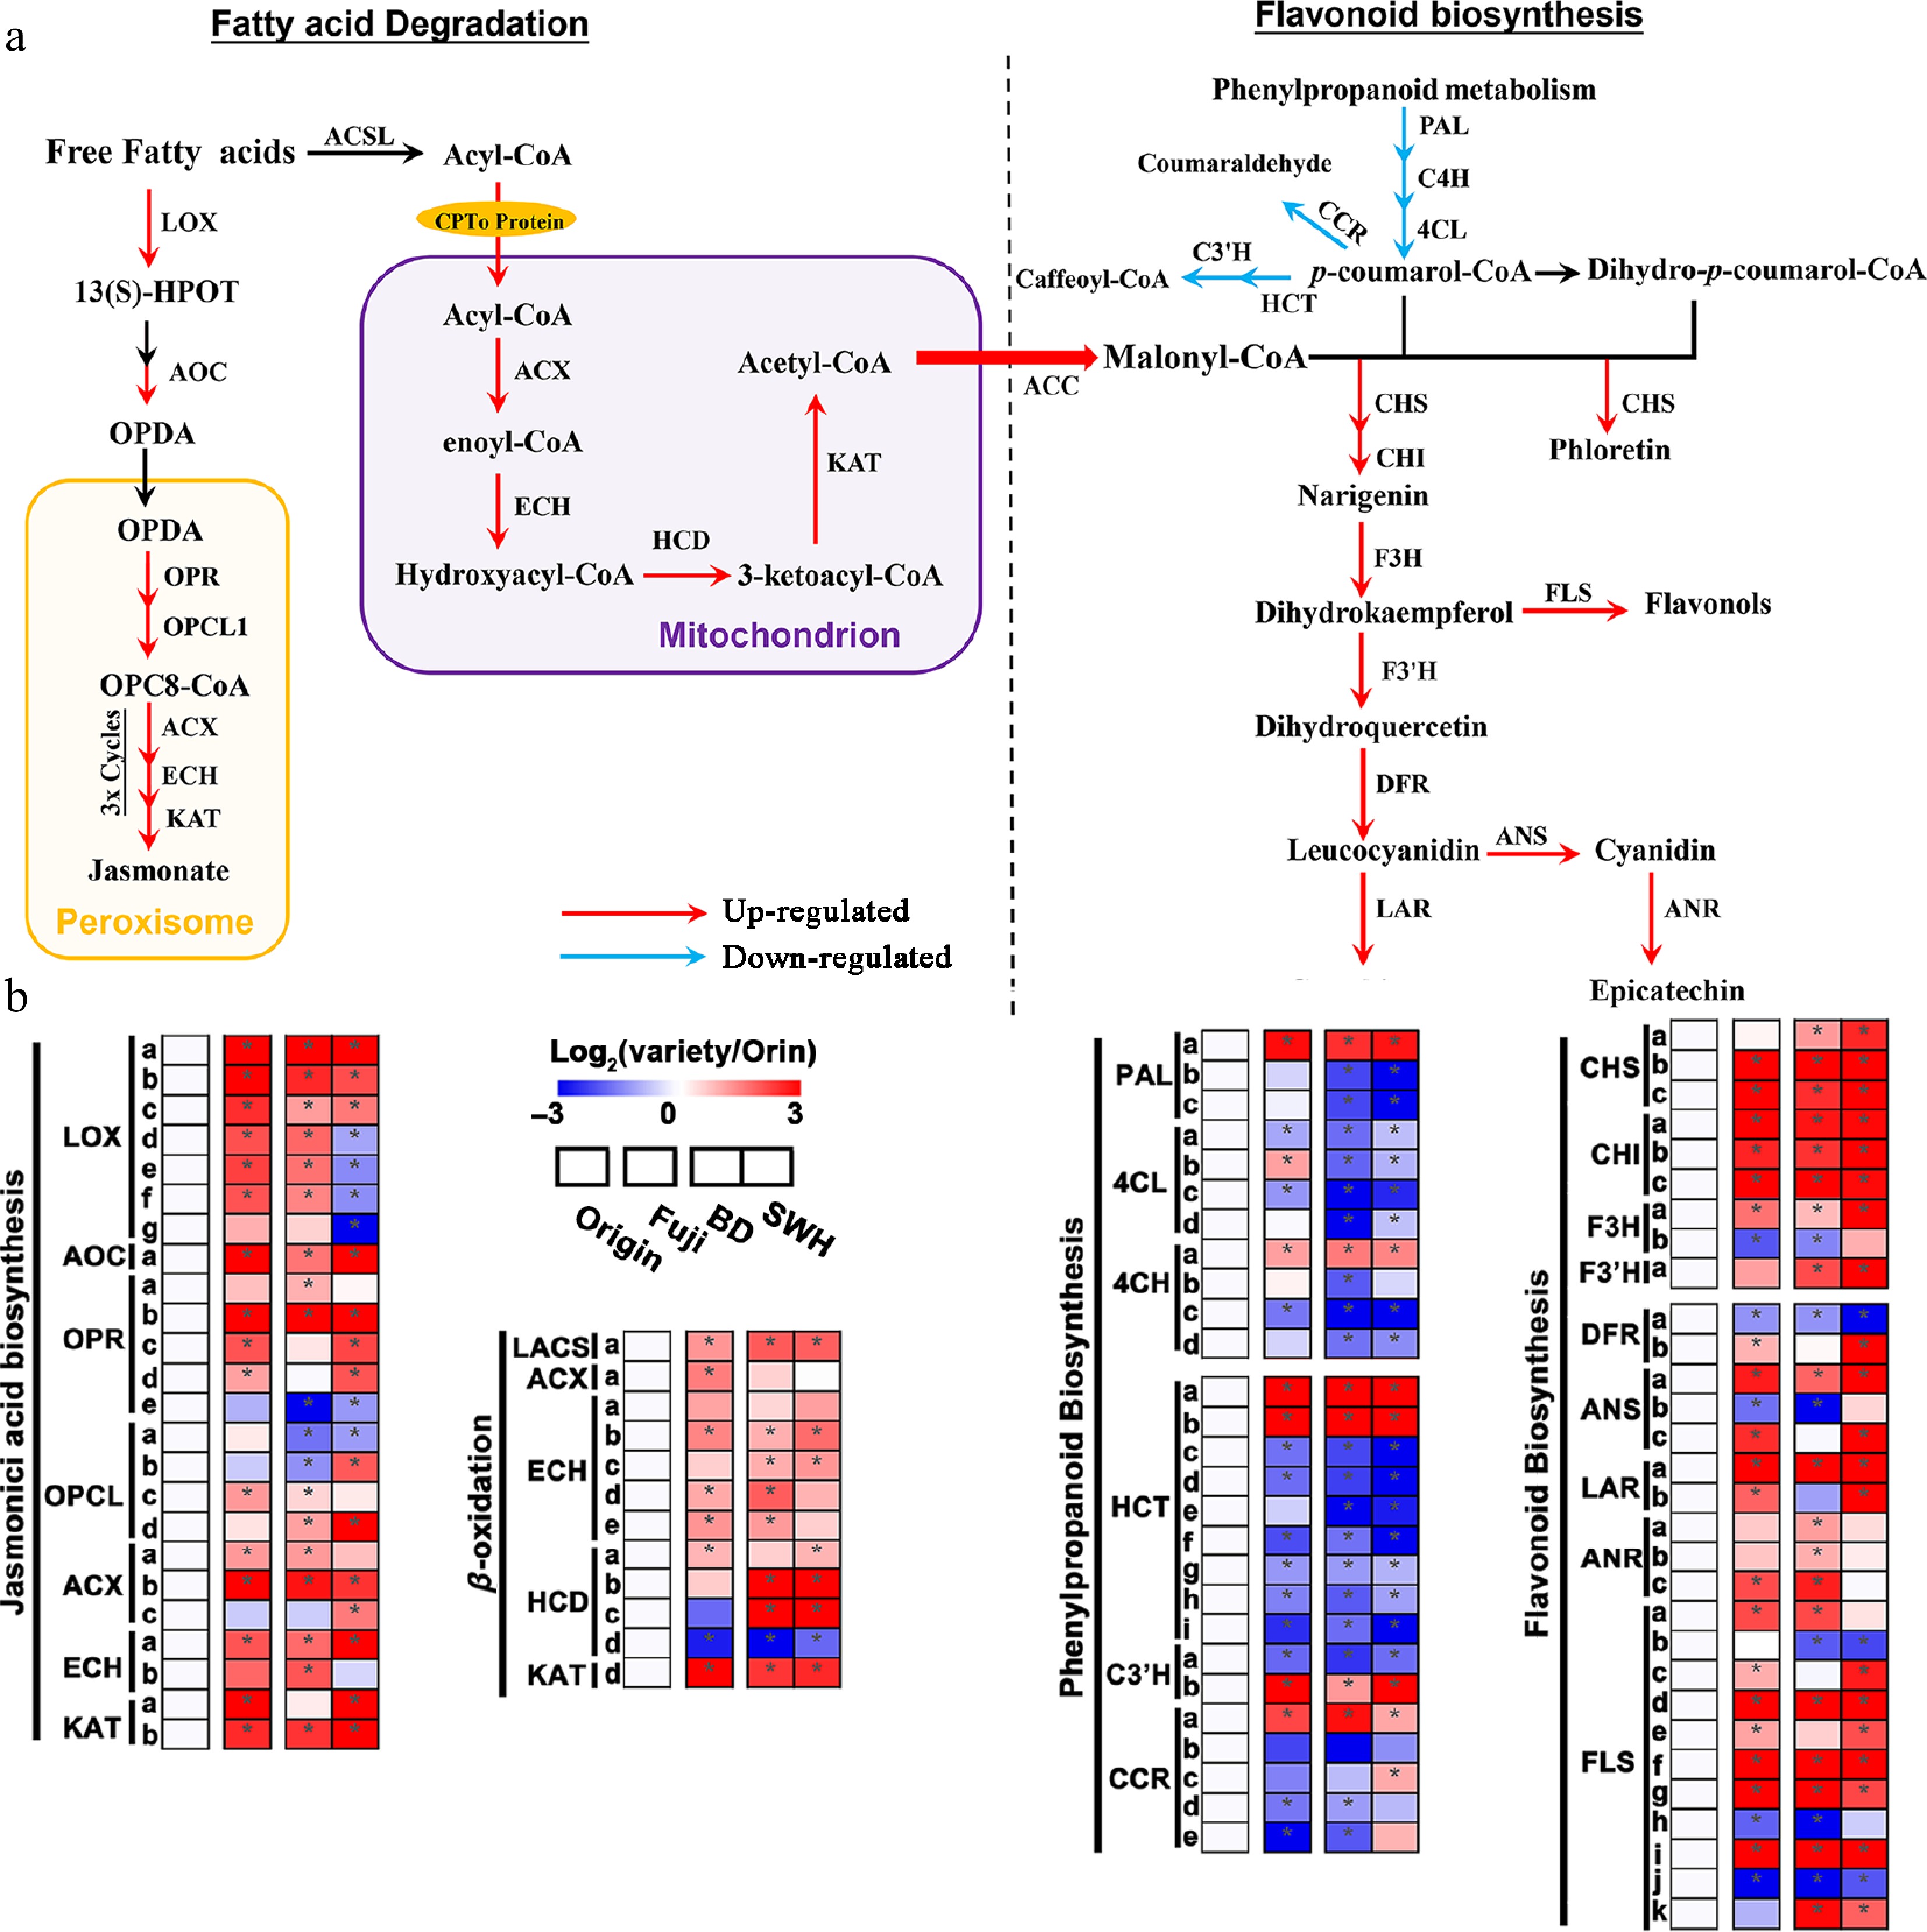
Figure 7.
Up- or down-regulated pathways in 'Fuji', 'BD' and 'SWH' compared with 'Orin'. (a) Schematic diagram revealing the up- or down-regulated genes from the JA biosynthesis, flavonoid biosynthesis and fatty acid β-oxidation pathways. Arrows in red or blue indicate up- or down-regulated genes in this step. (b) Expression of DEGs from the JA biosynthesis, flavonoid biosynthesis and fatty acid β-oxidation pathways. Values were scaled to 'Orin'.
-
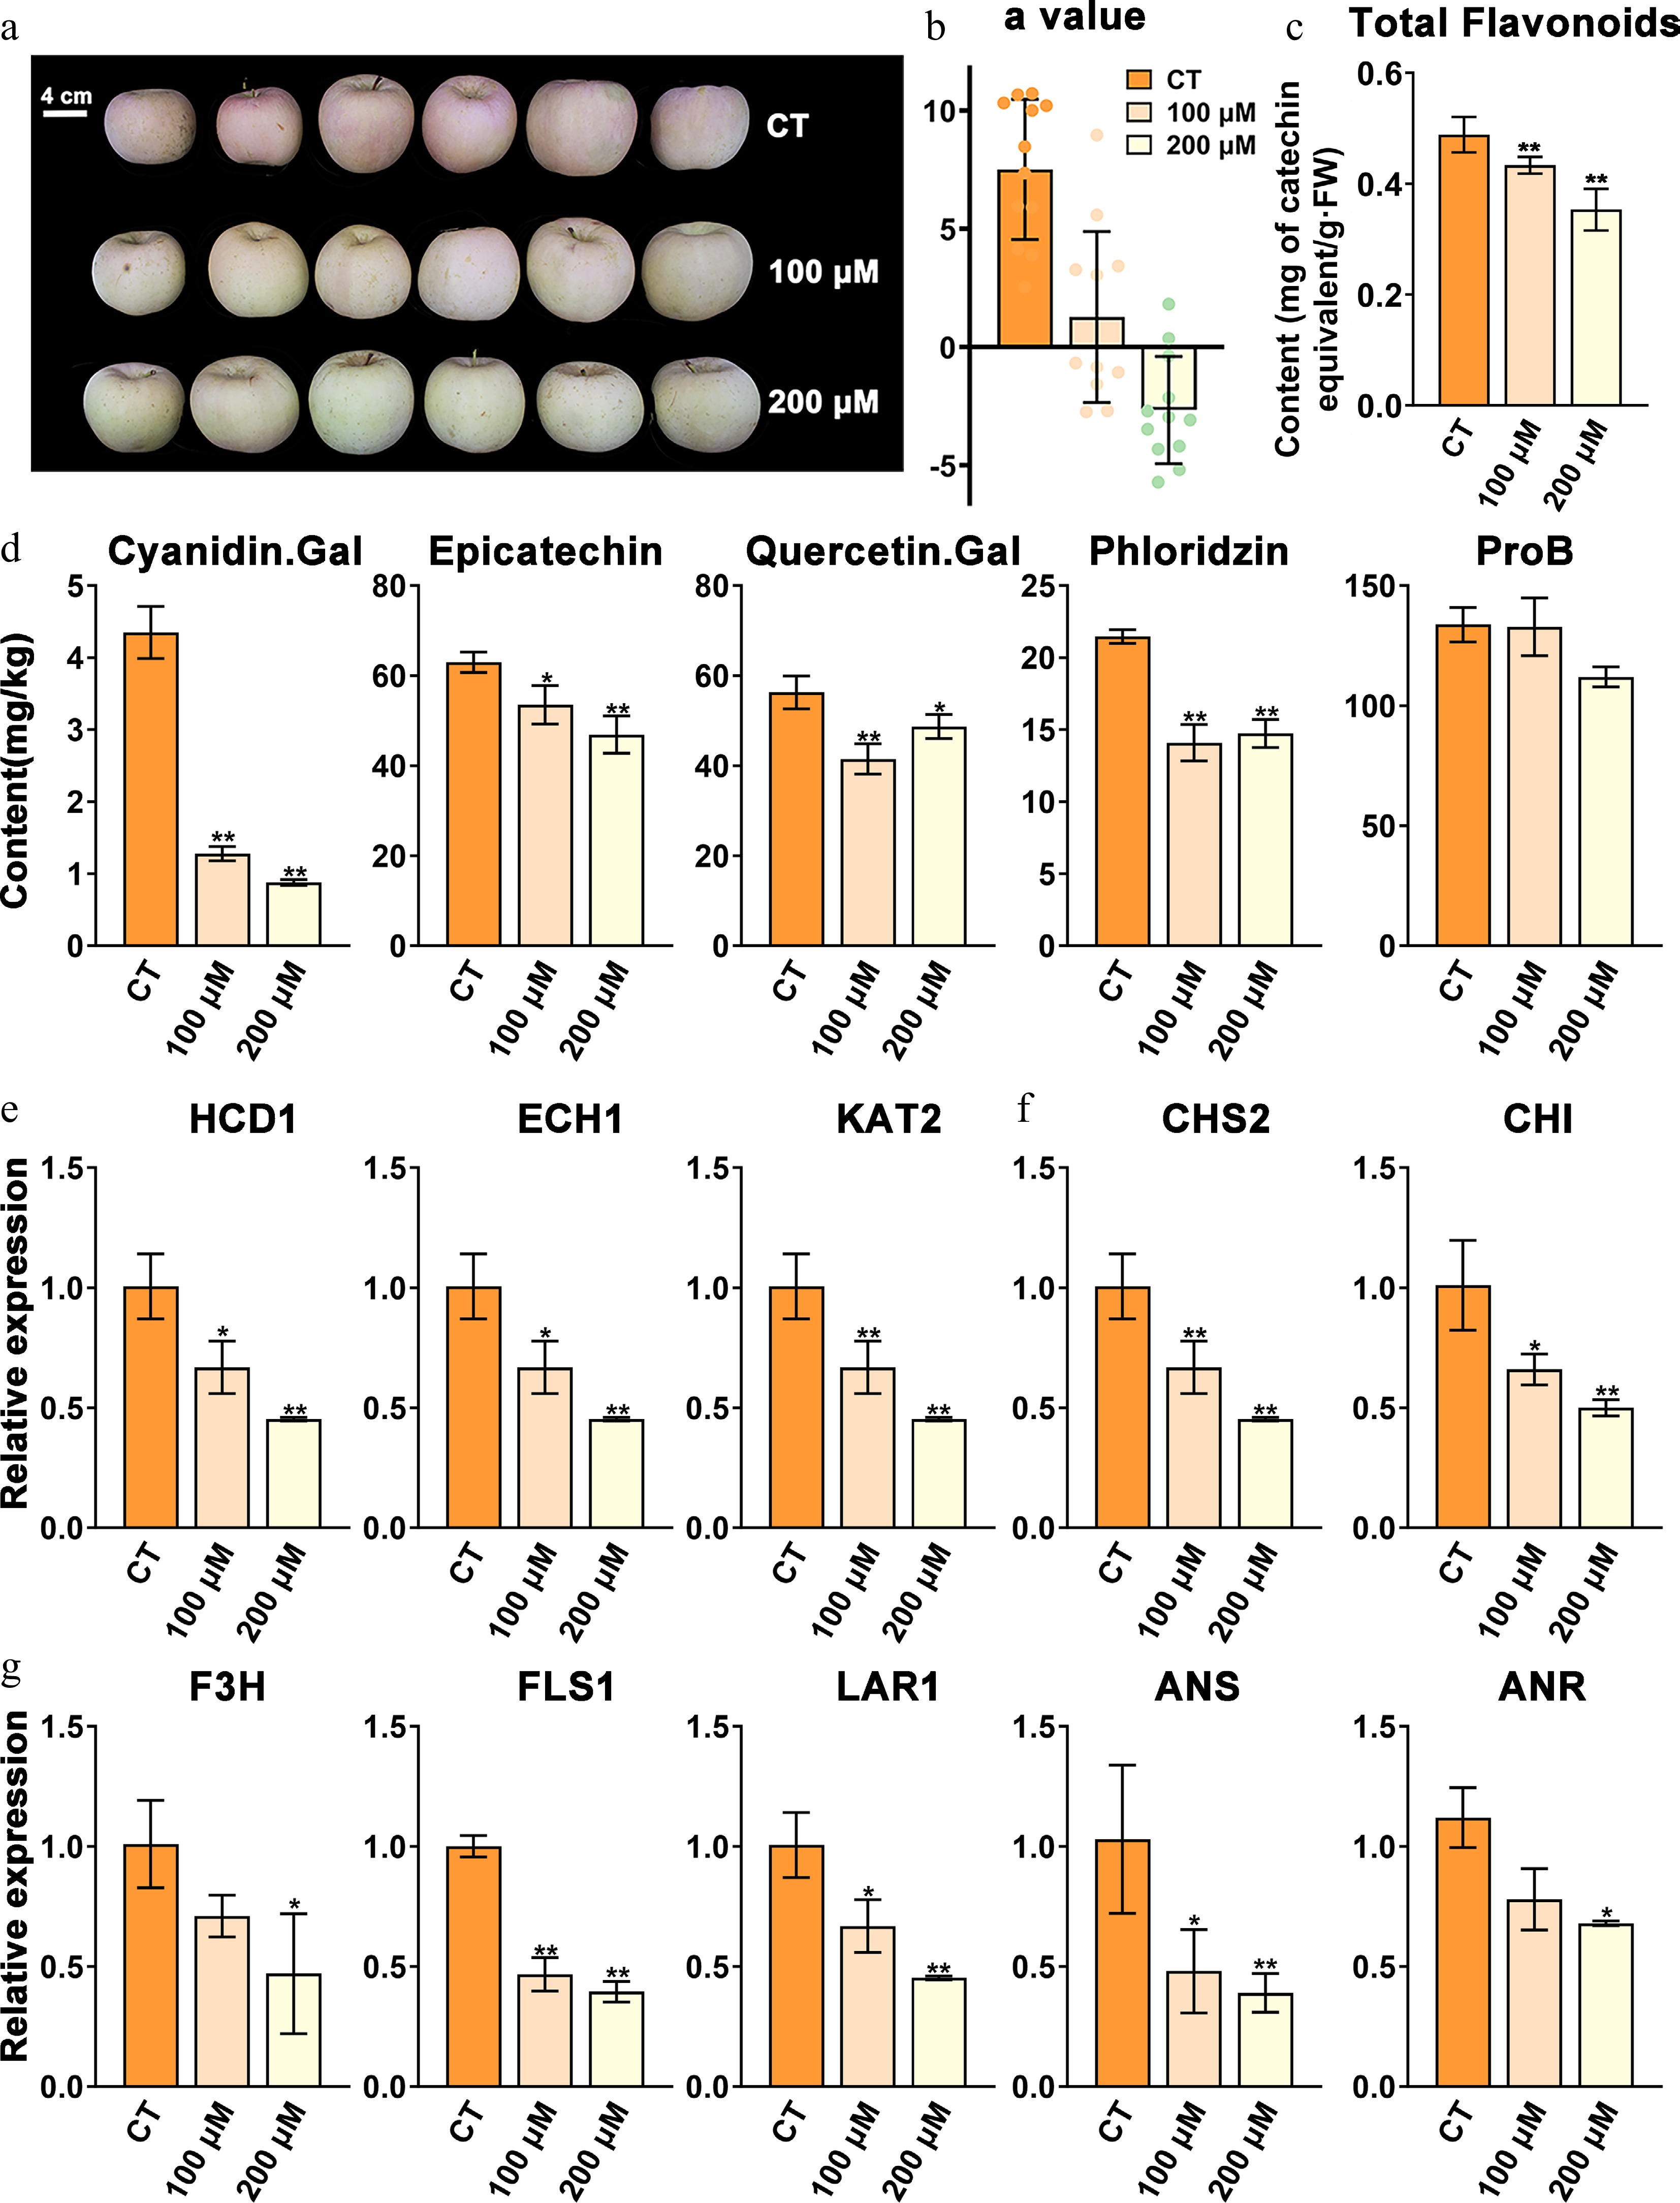
Figure 8.
Phenotypes of etomoxir-treated apples in the coloring stage and the control. (a) Phenotypes of apples treated with 100 and 200 μM etomoxir and the relative control (CT). (b) The colorimeter 'a' value of the two treated groups and the CT. (c) Total flavonoid contents of etomoxir-treated groups and the CT. (d) Contents of major flavonoid components of etomoxir-treated fruit and the CT. (e) Relative expression of key β-oxidation genes of etomoxir-treated fruit and the CT. (f) and (g) Relative expression of key flavonoid-related genes of etomoxir-treated fruit and the CT. Data are the means ± SD of three biological replicates. Student's t-test p-values were calculated between the CT and two treated groups. * and ** indicate Student's t-test p-values lower than 0.05 and 0.01, respectively (n = 3).
Figures
(8)
Tables
(0)