-
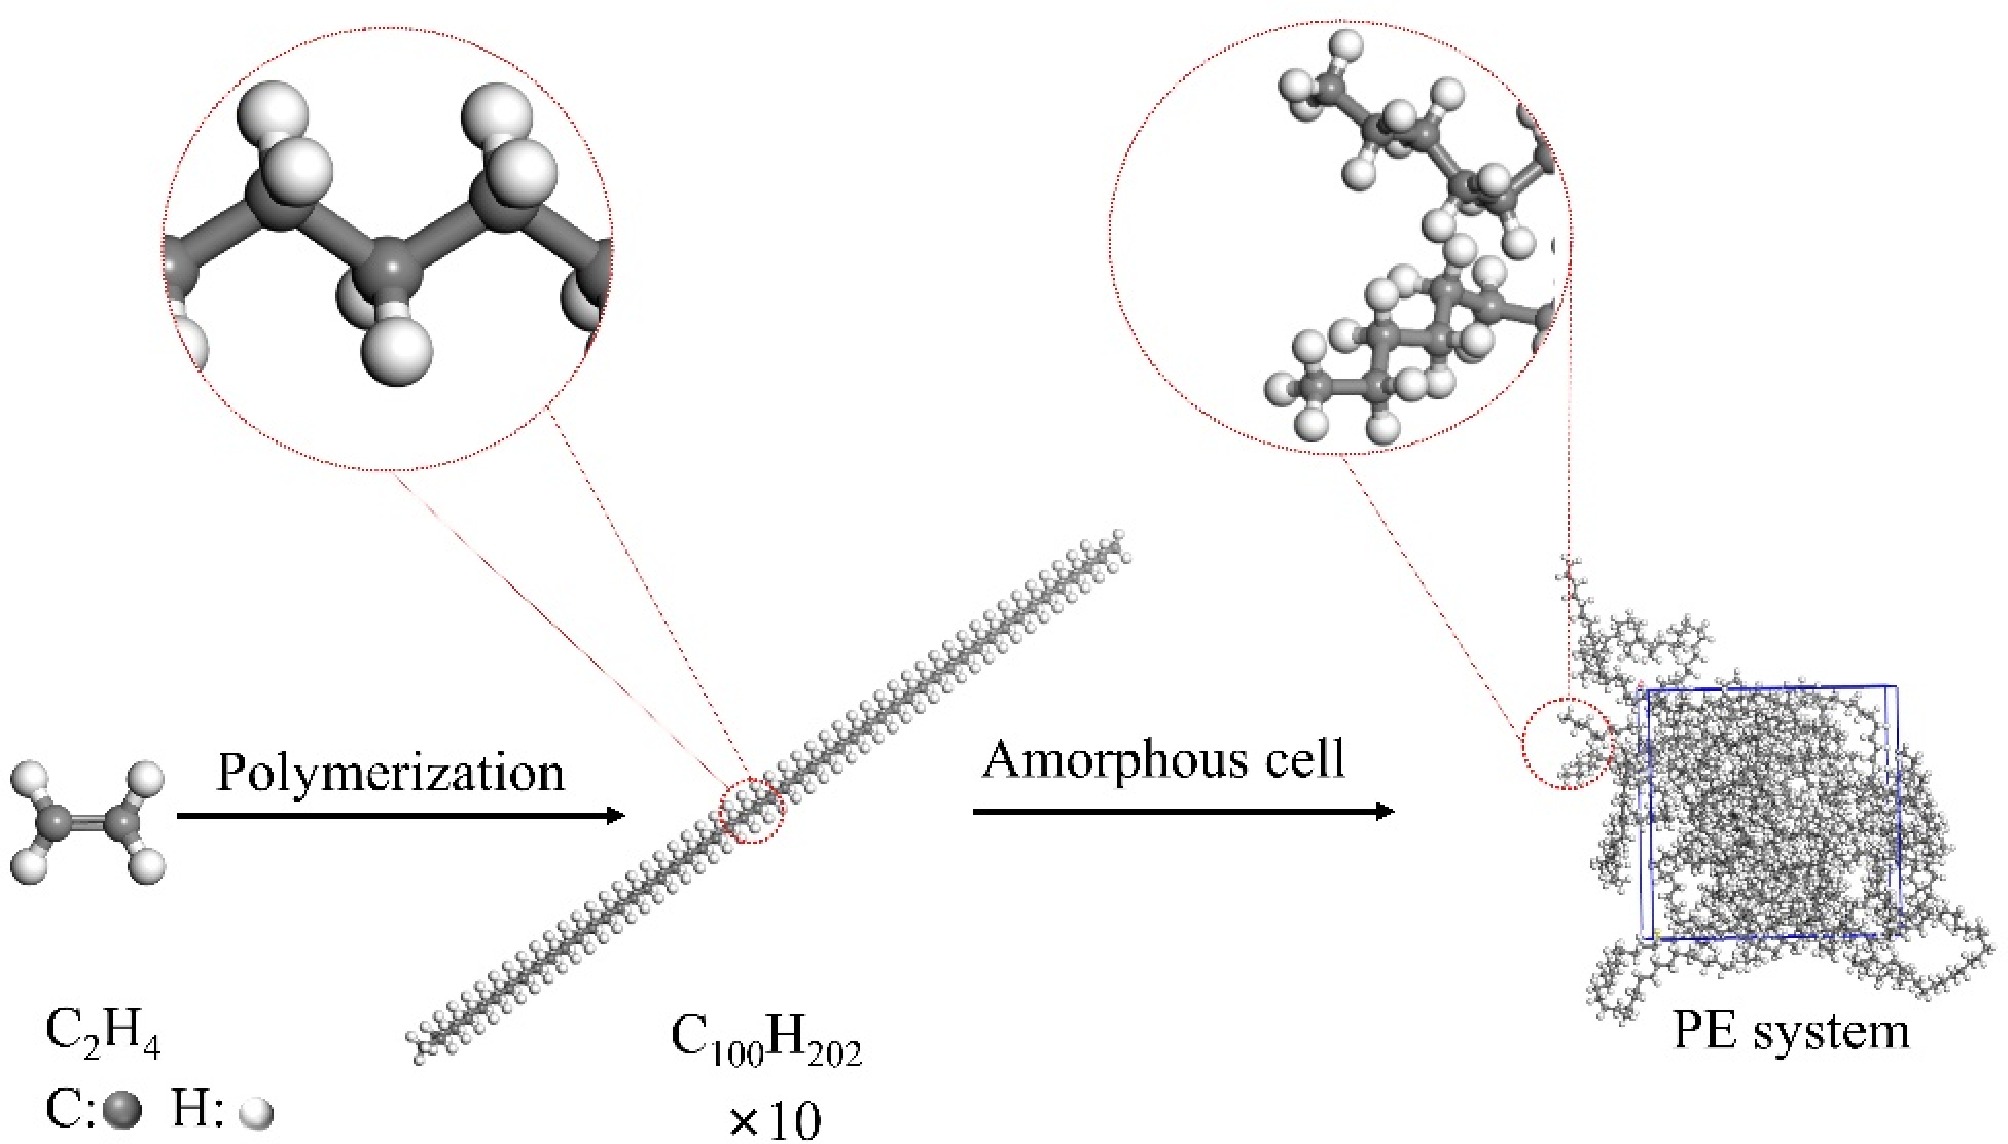
Figure 1.
PE pyrolysis model.
-
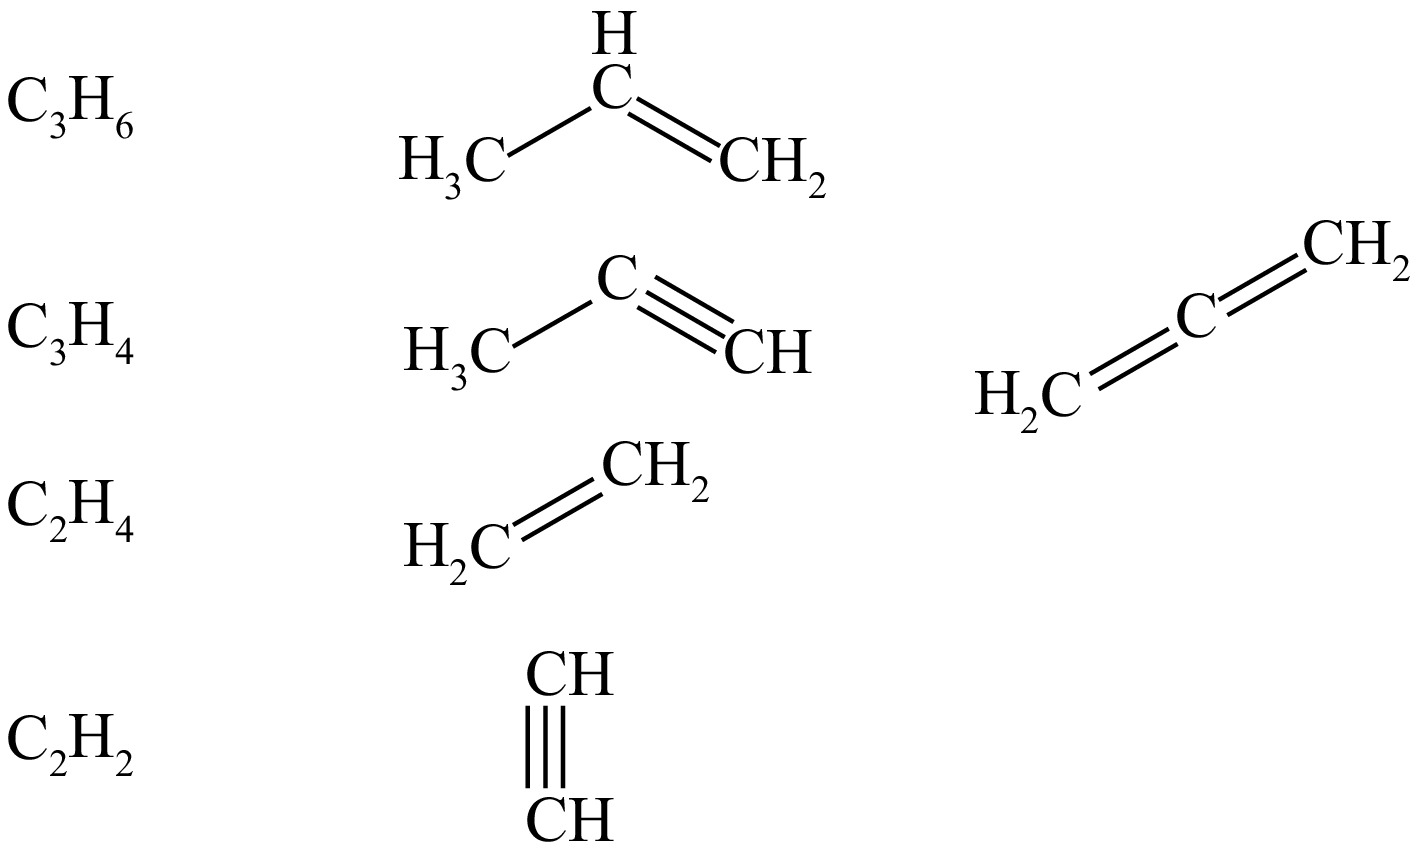
Figure 2.
Isomers of major pyrolysis products.
-
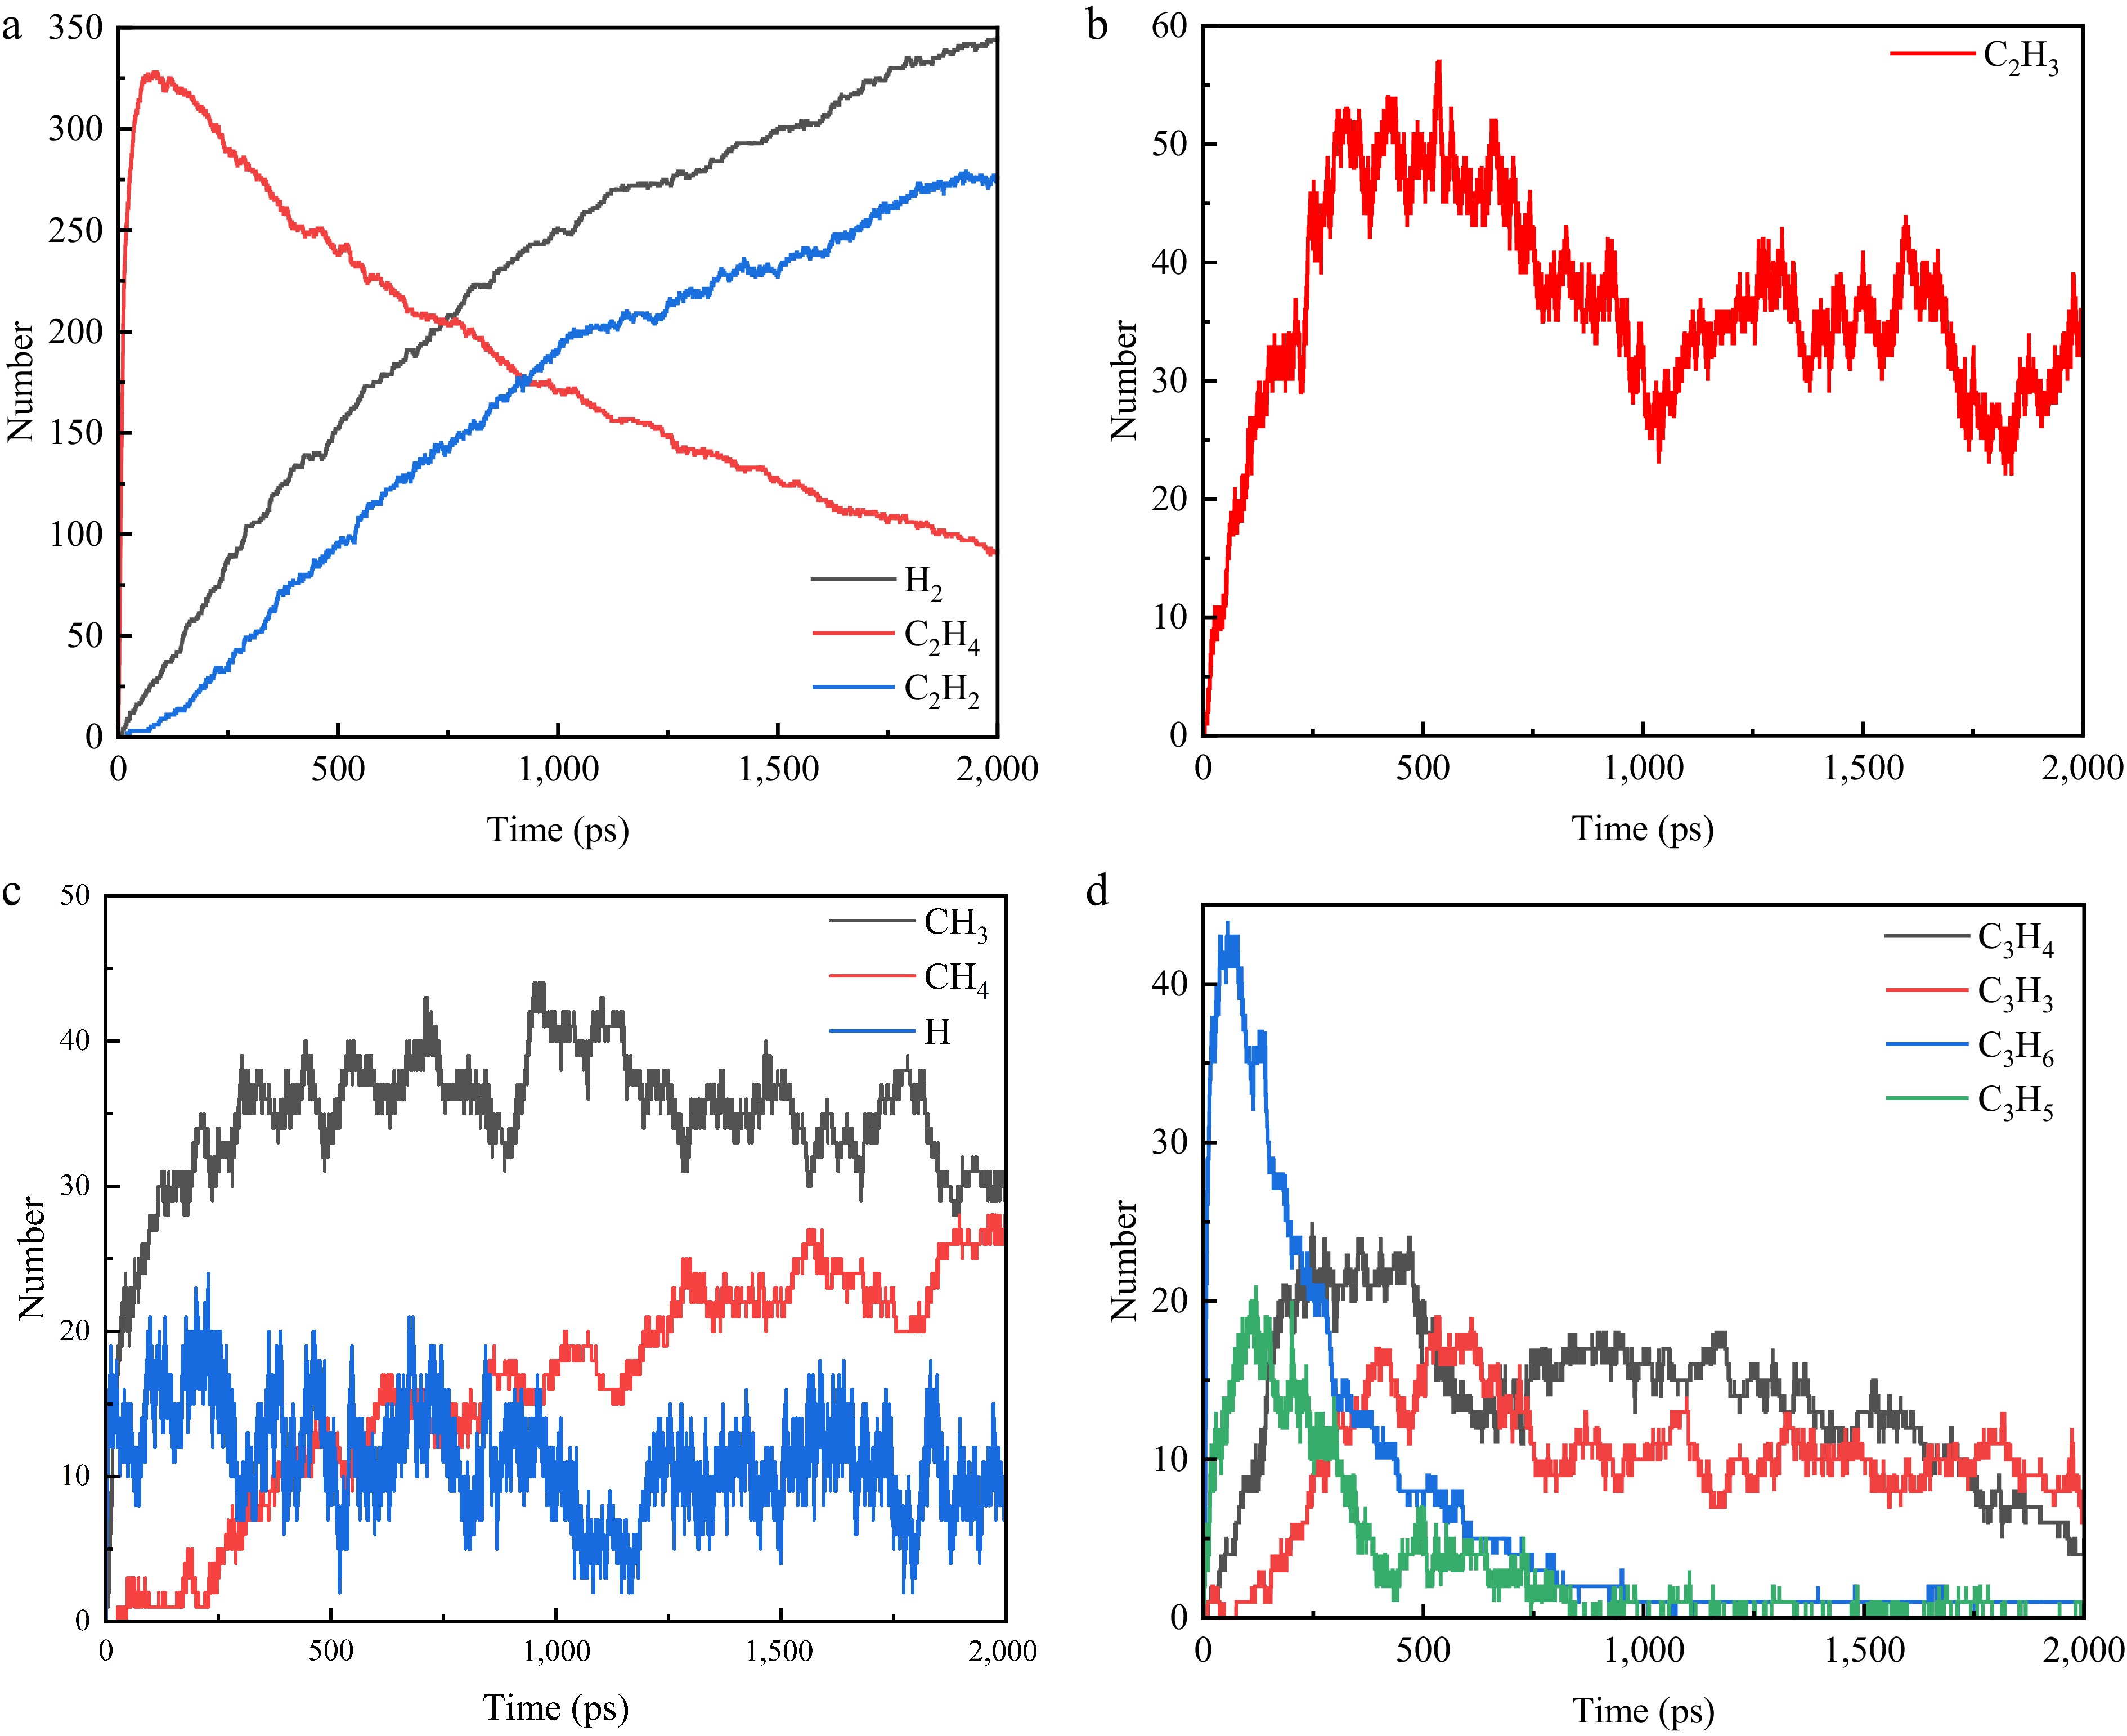
Figure 3.
Variation curve of the number of main pyrolysis particles (total number of isomers) with time. (a) C2H2, C2H4, H2. (b) C2H3. (c) CH3, CH4, H. (d) C3H6, C3H5, C3H4, C3H3.
-
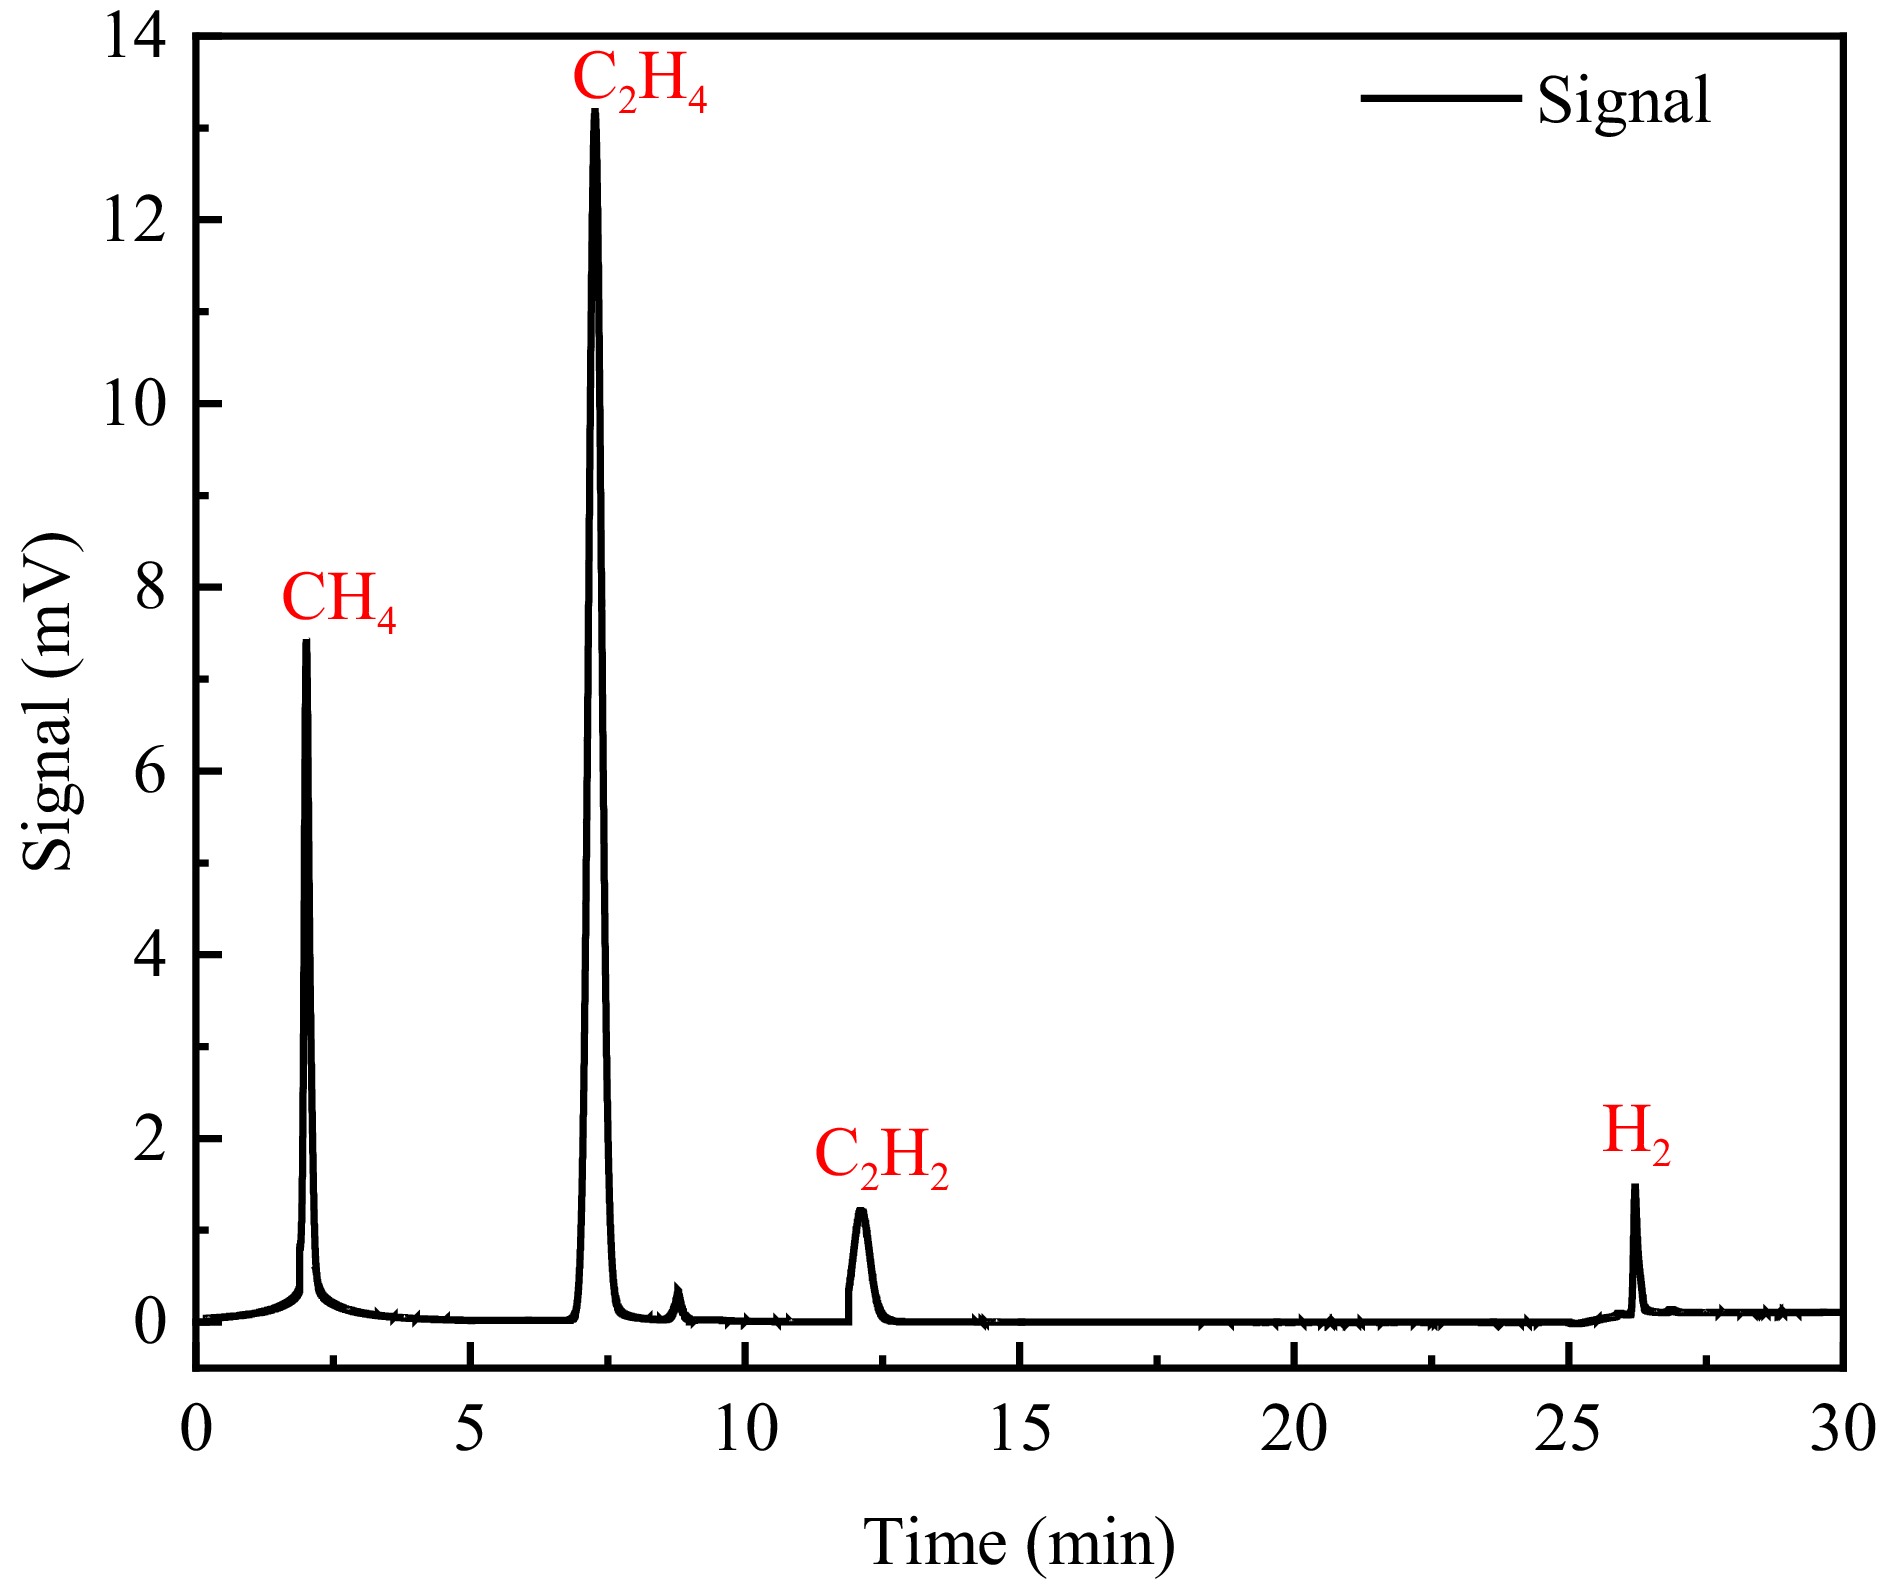
Figure 4.
PE pyrolysis components.
-
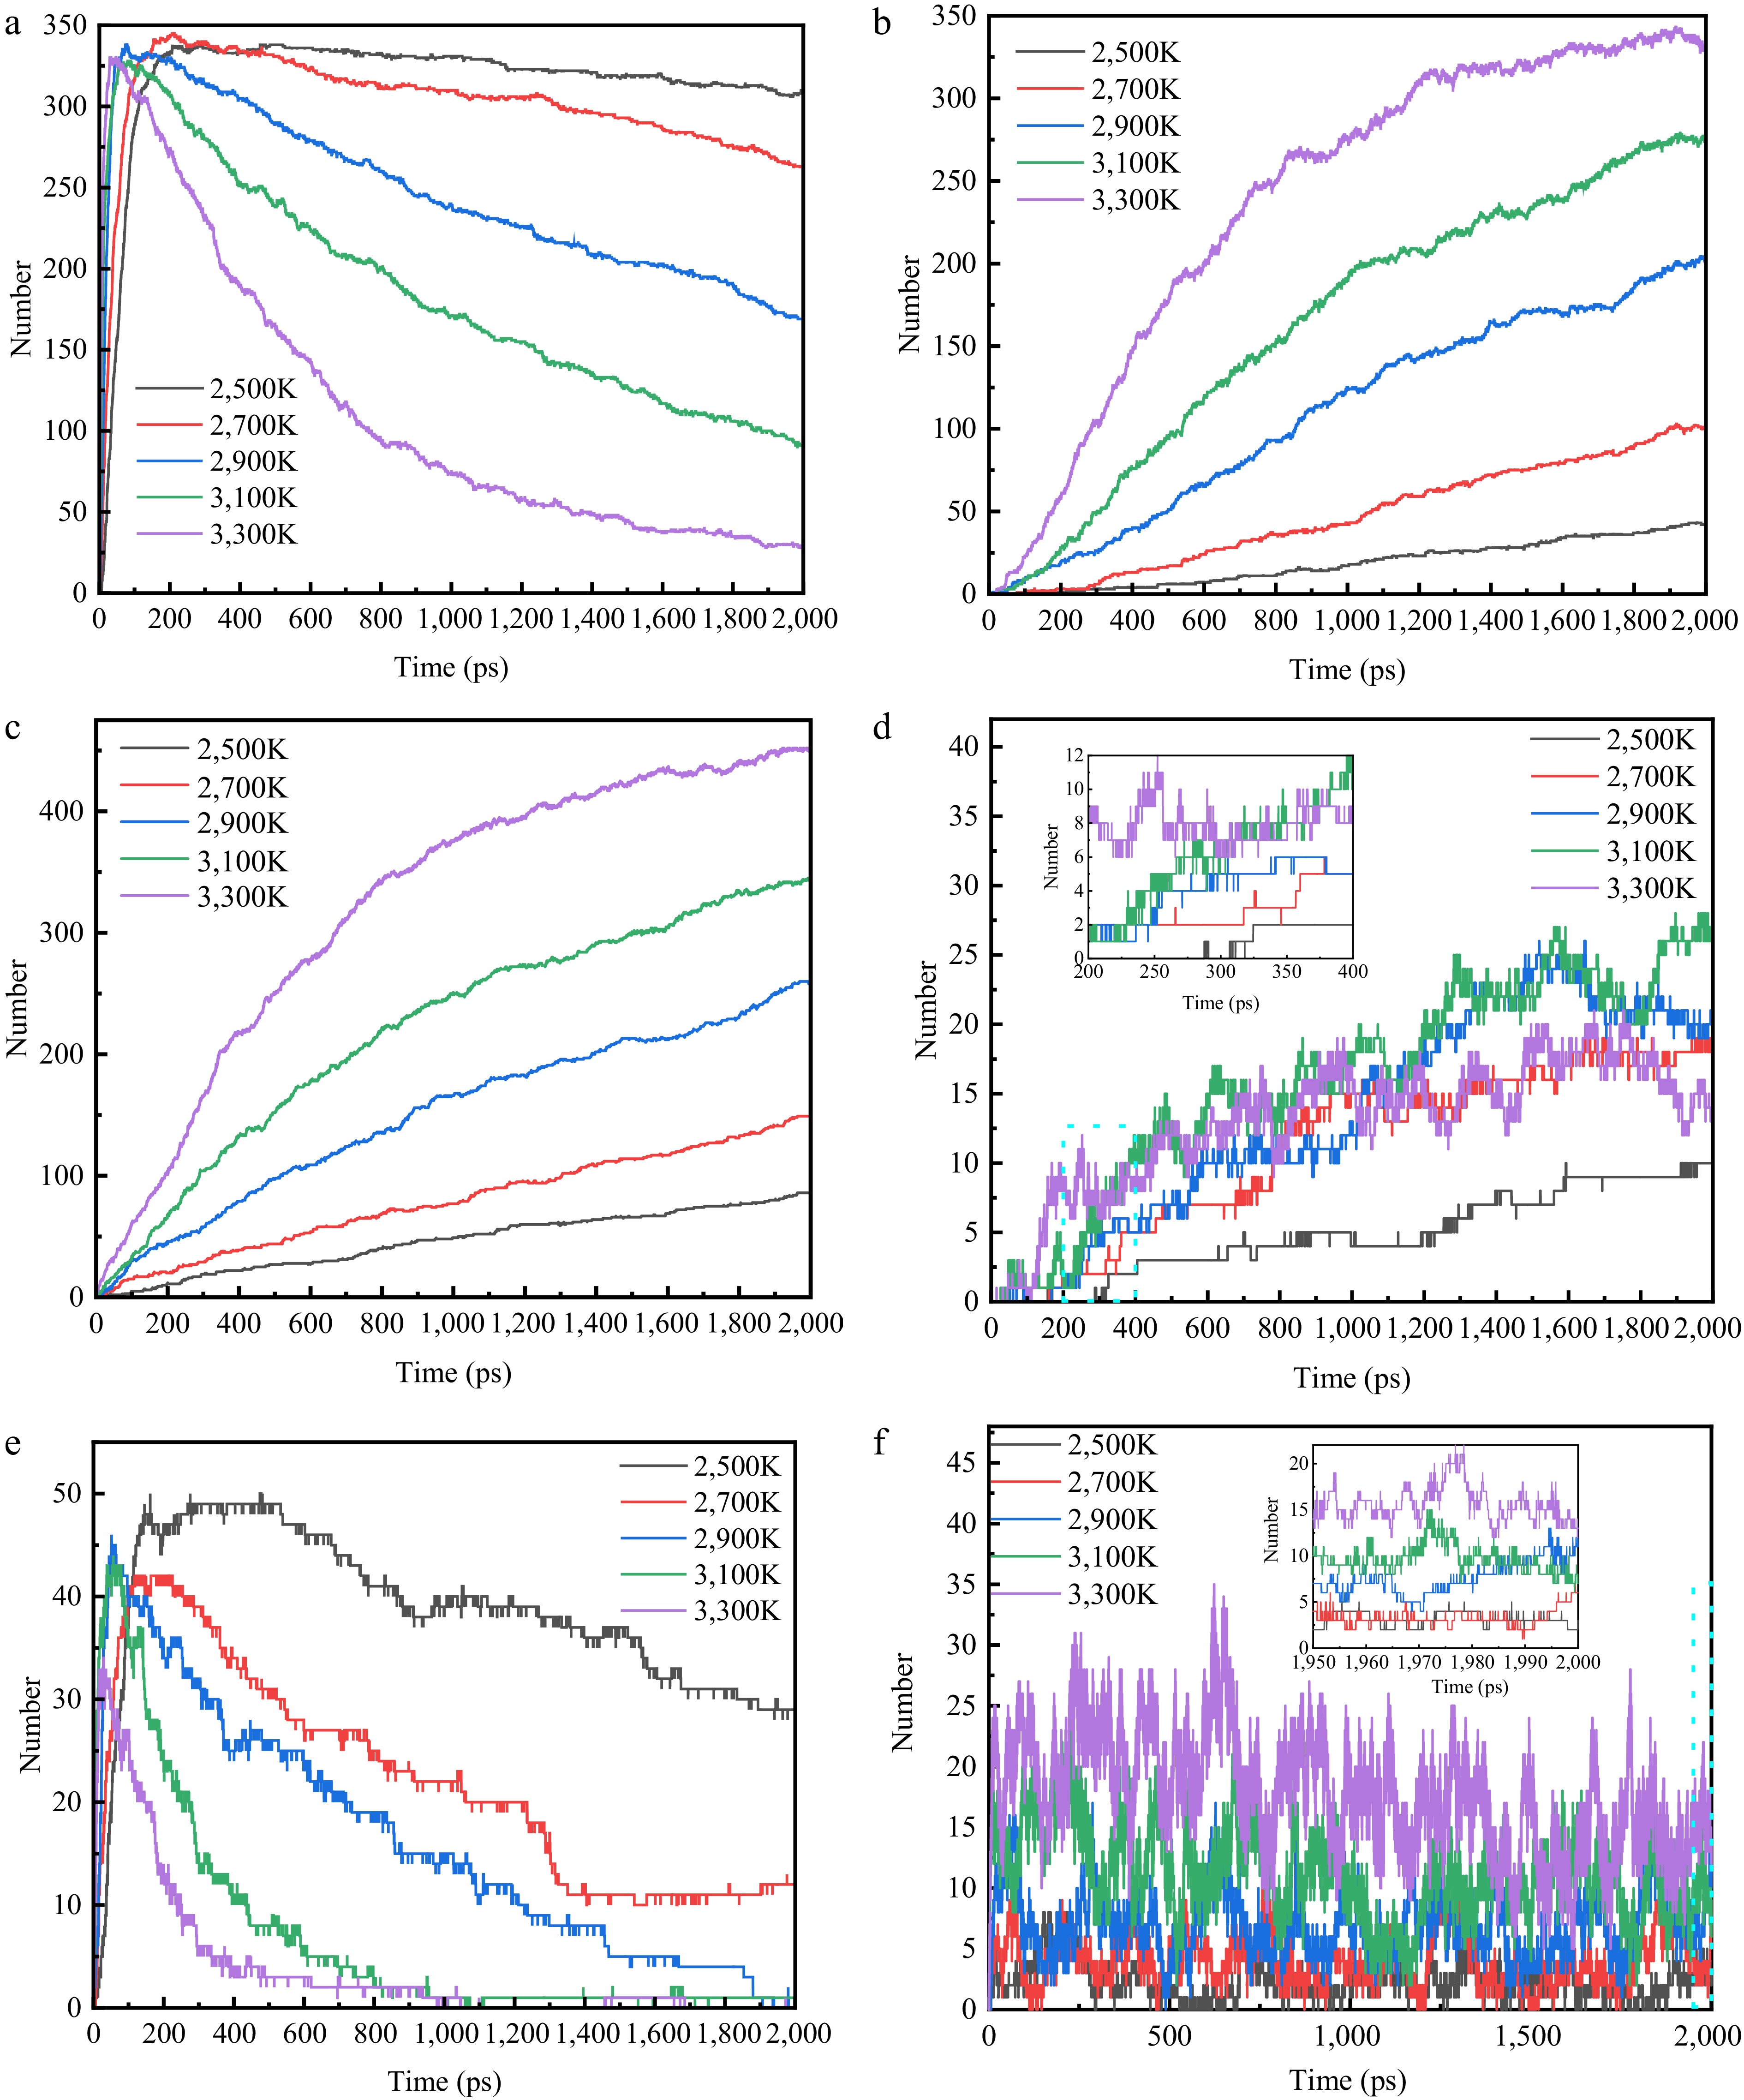
Figure 5.
Plot of changes in the amount of important pyrolysis products at different temperatures. (a) C2H4. (b) C2H2. (c) H2. (d) CH4. (e) C3H6. (f) H.
-
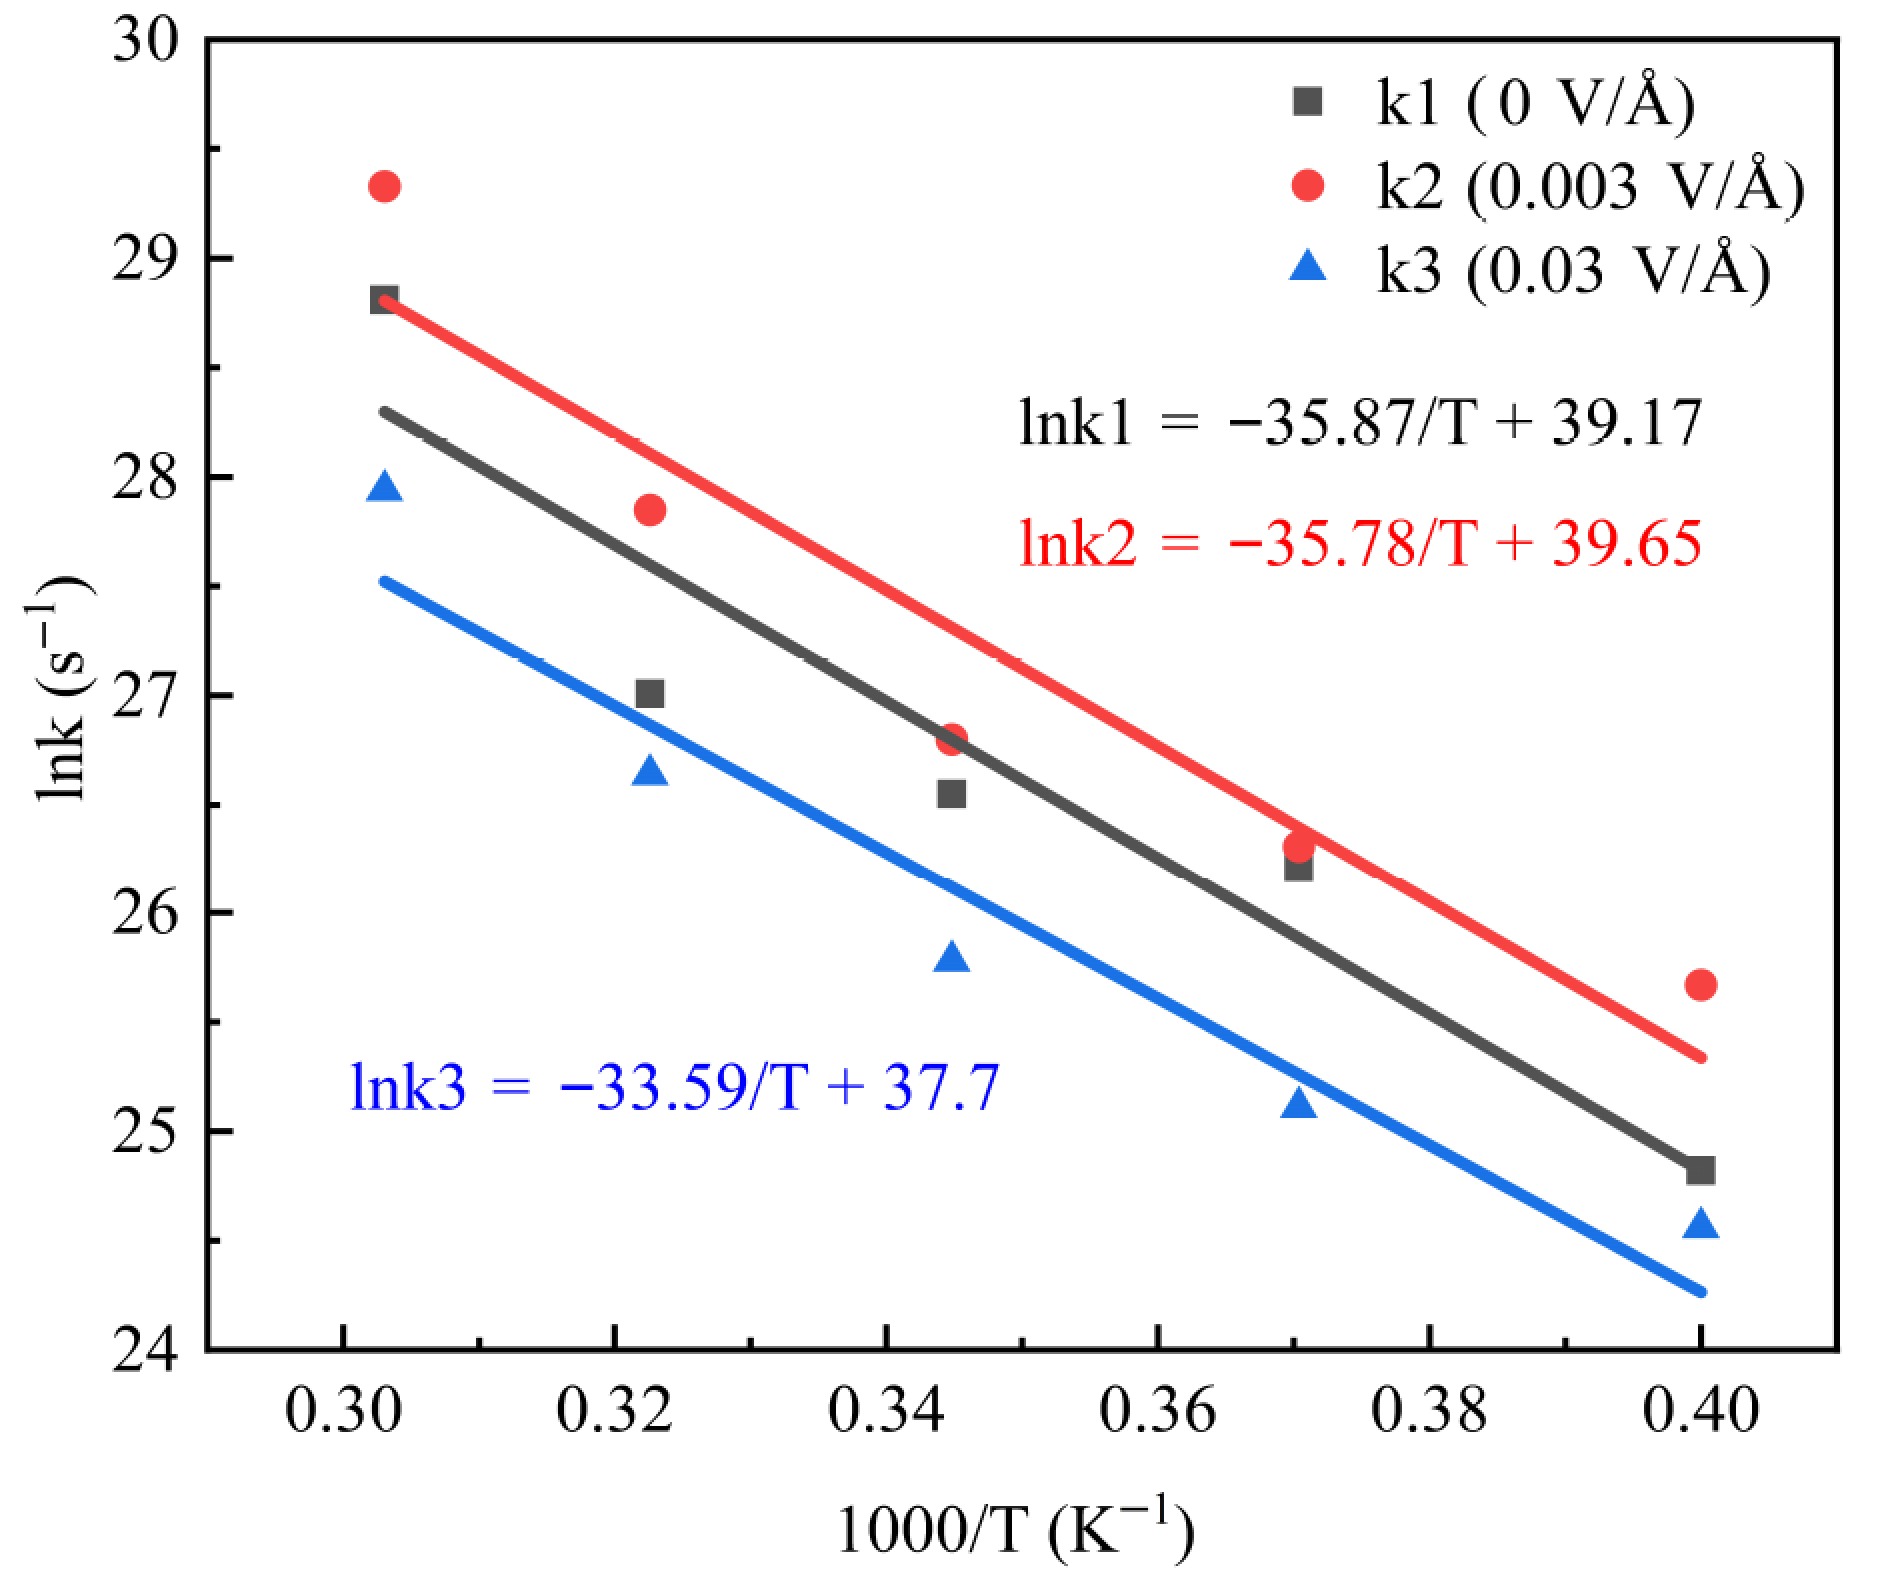
Figure 6.
Kinetic fit of PE pyrolysis rate constant versus temperature.
-
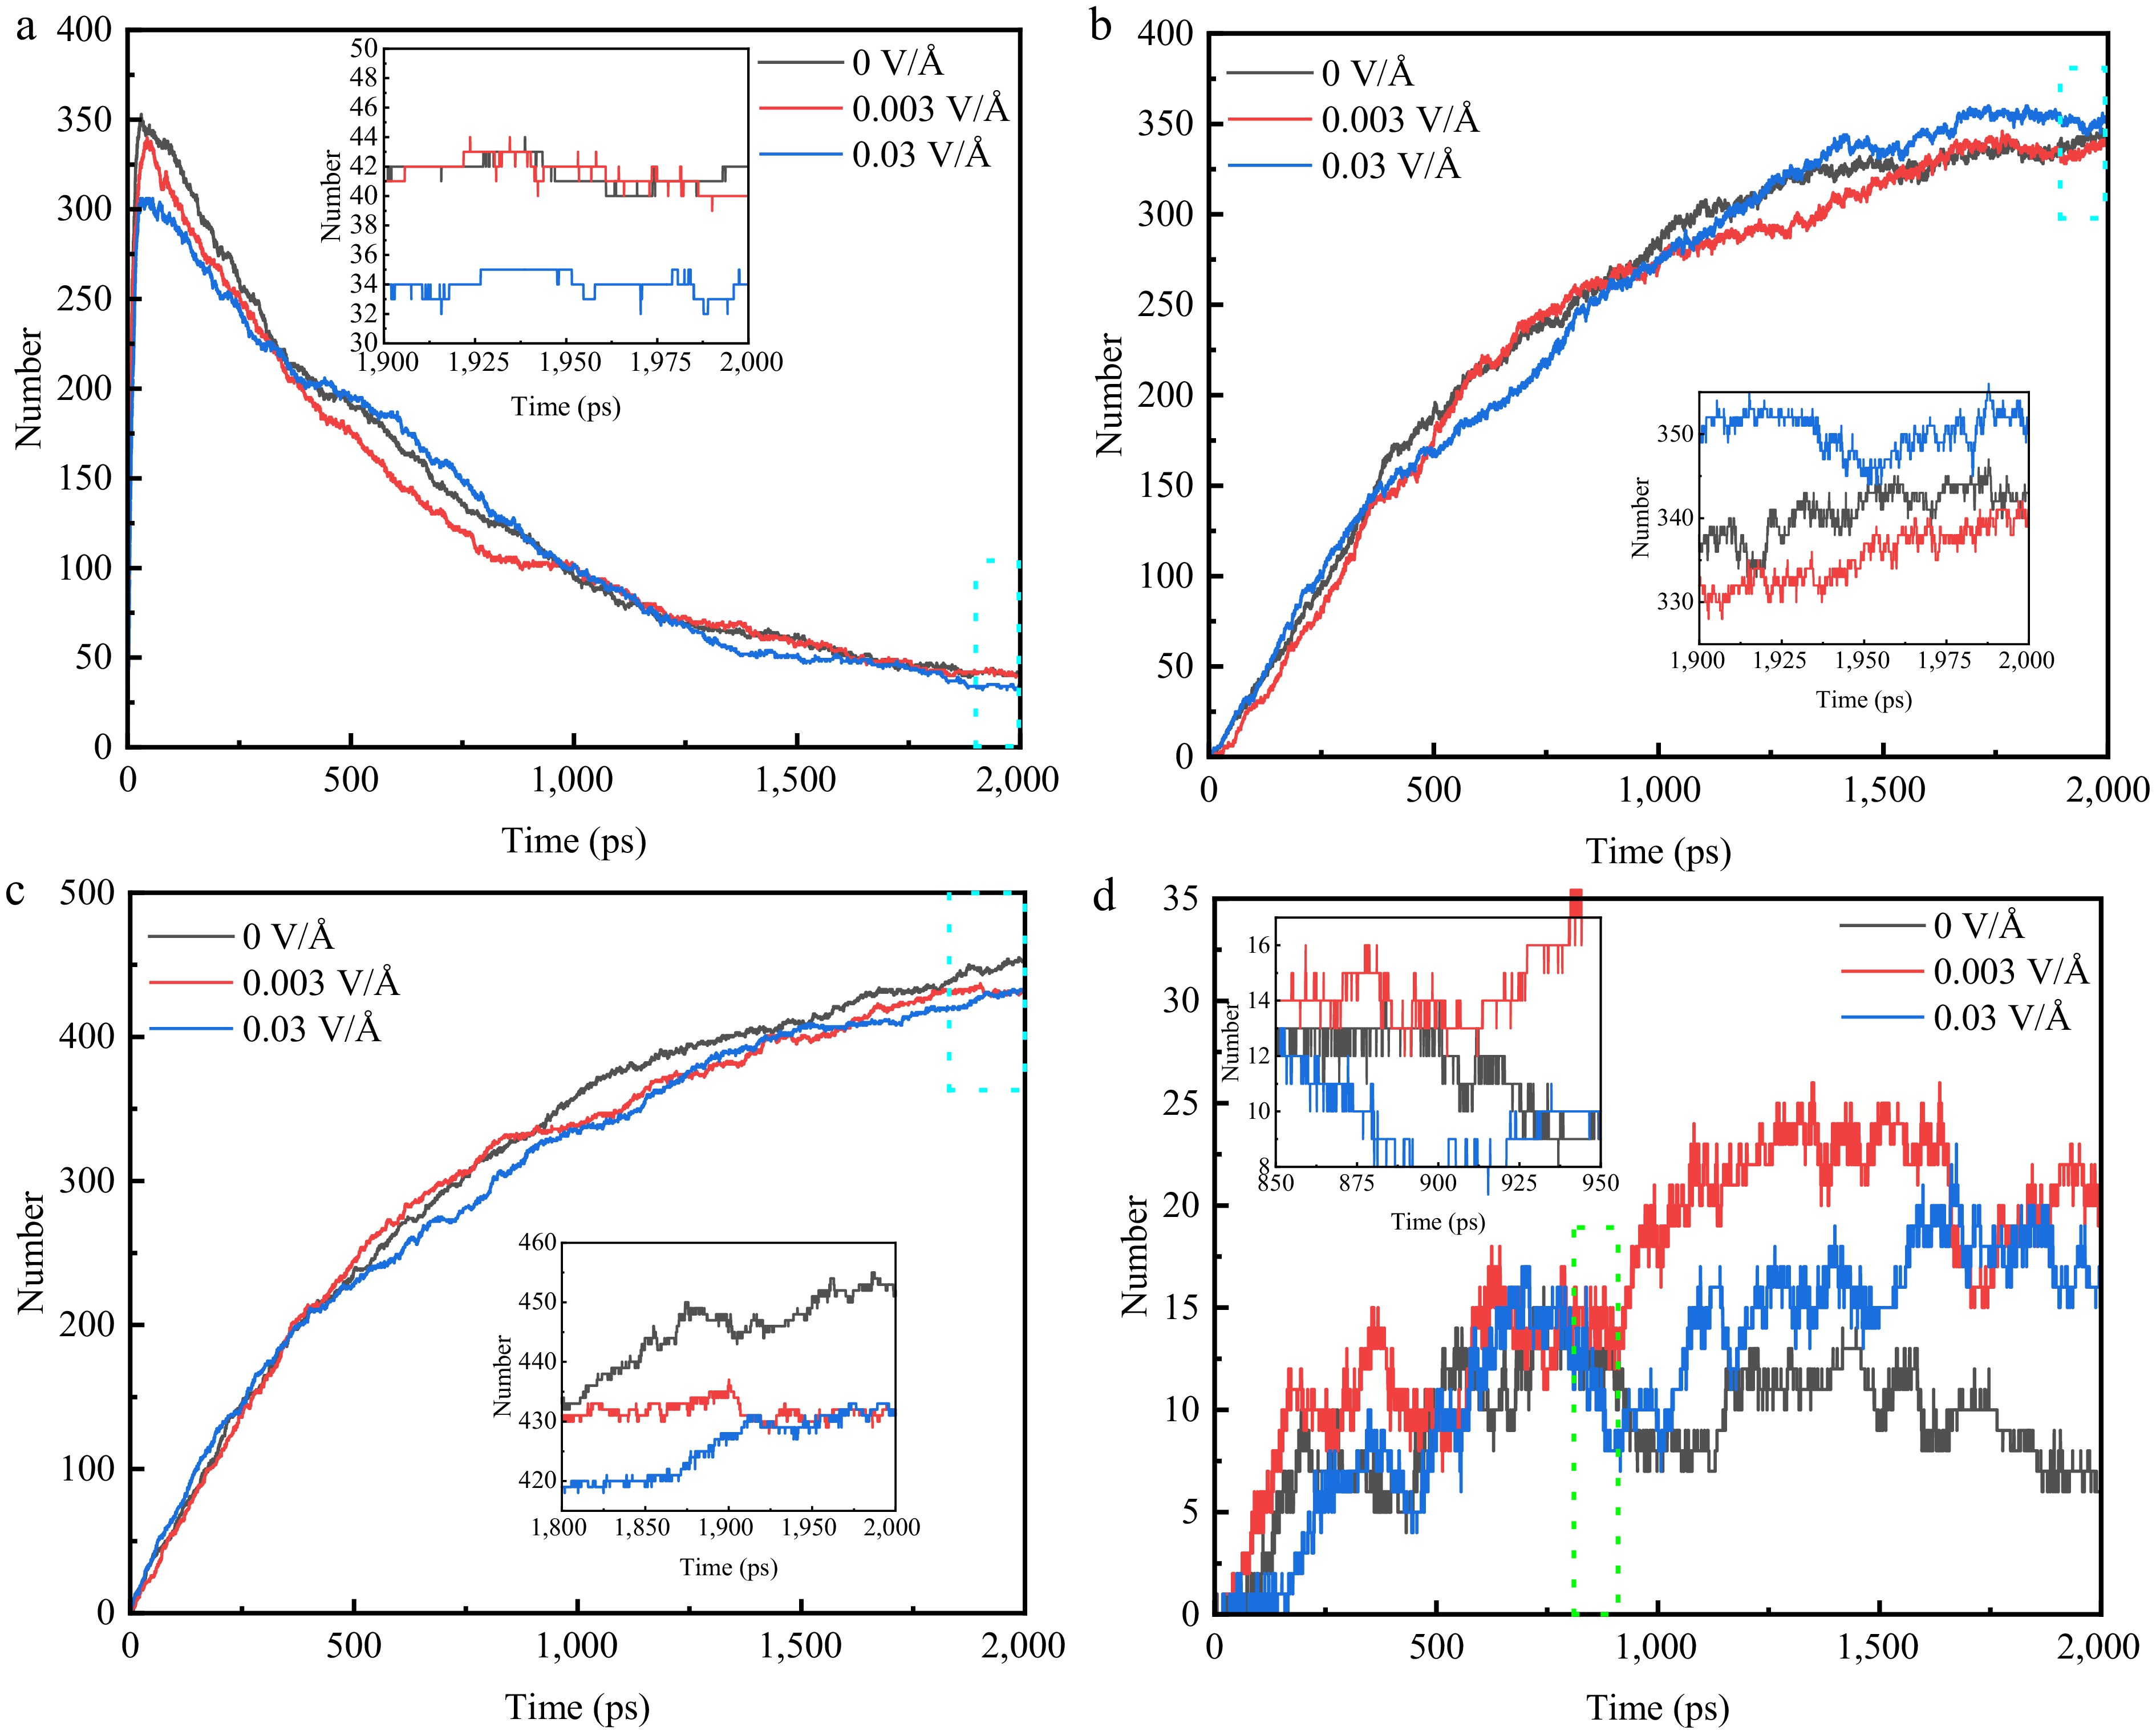
Figure 7.
Variation of the number of major pyrolysis products under different electric fields at 3,300 K. (a) C2H4. (b) C2H2. (c) H2. (d) CH4.
-
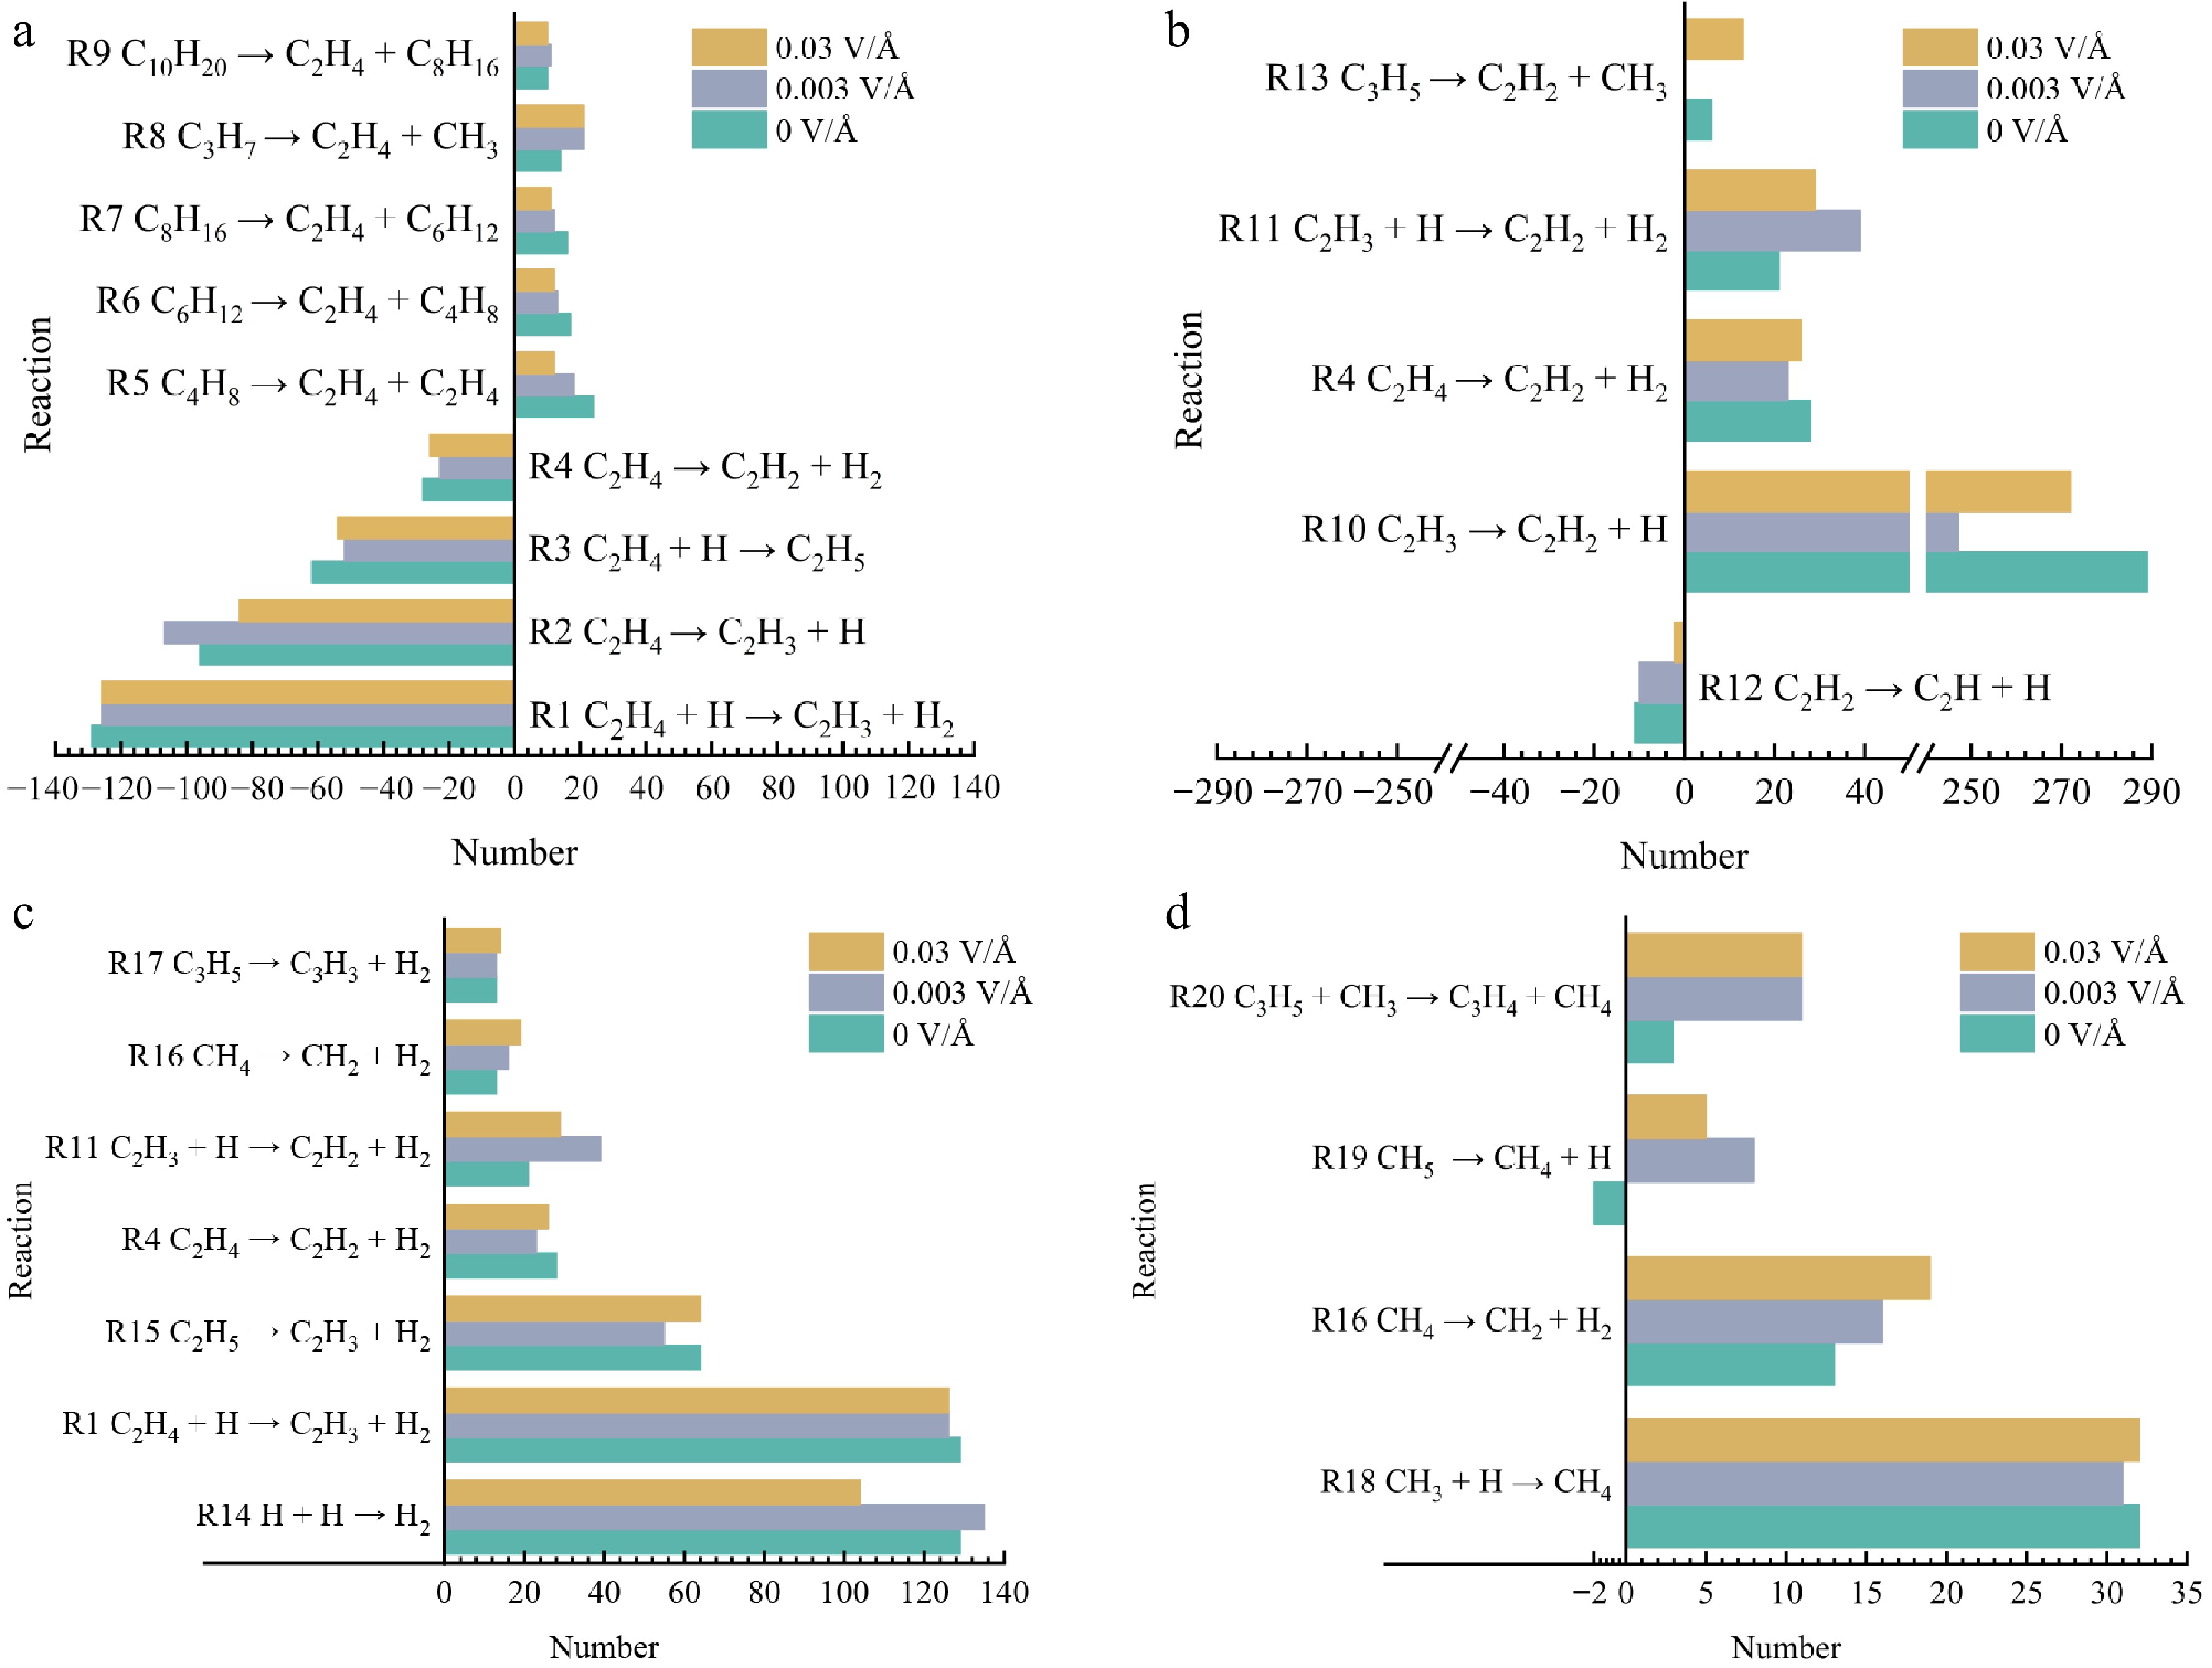
Figure 8.
Major reactions involving major pyrolysis products at different electric fields. (a) C2H4. (b) C2H2. (c) H2. (d) CH4.
-
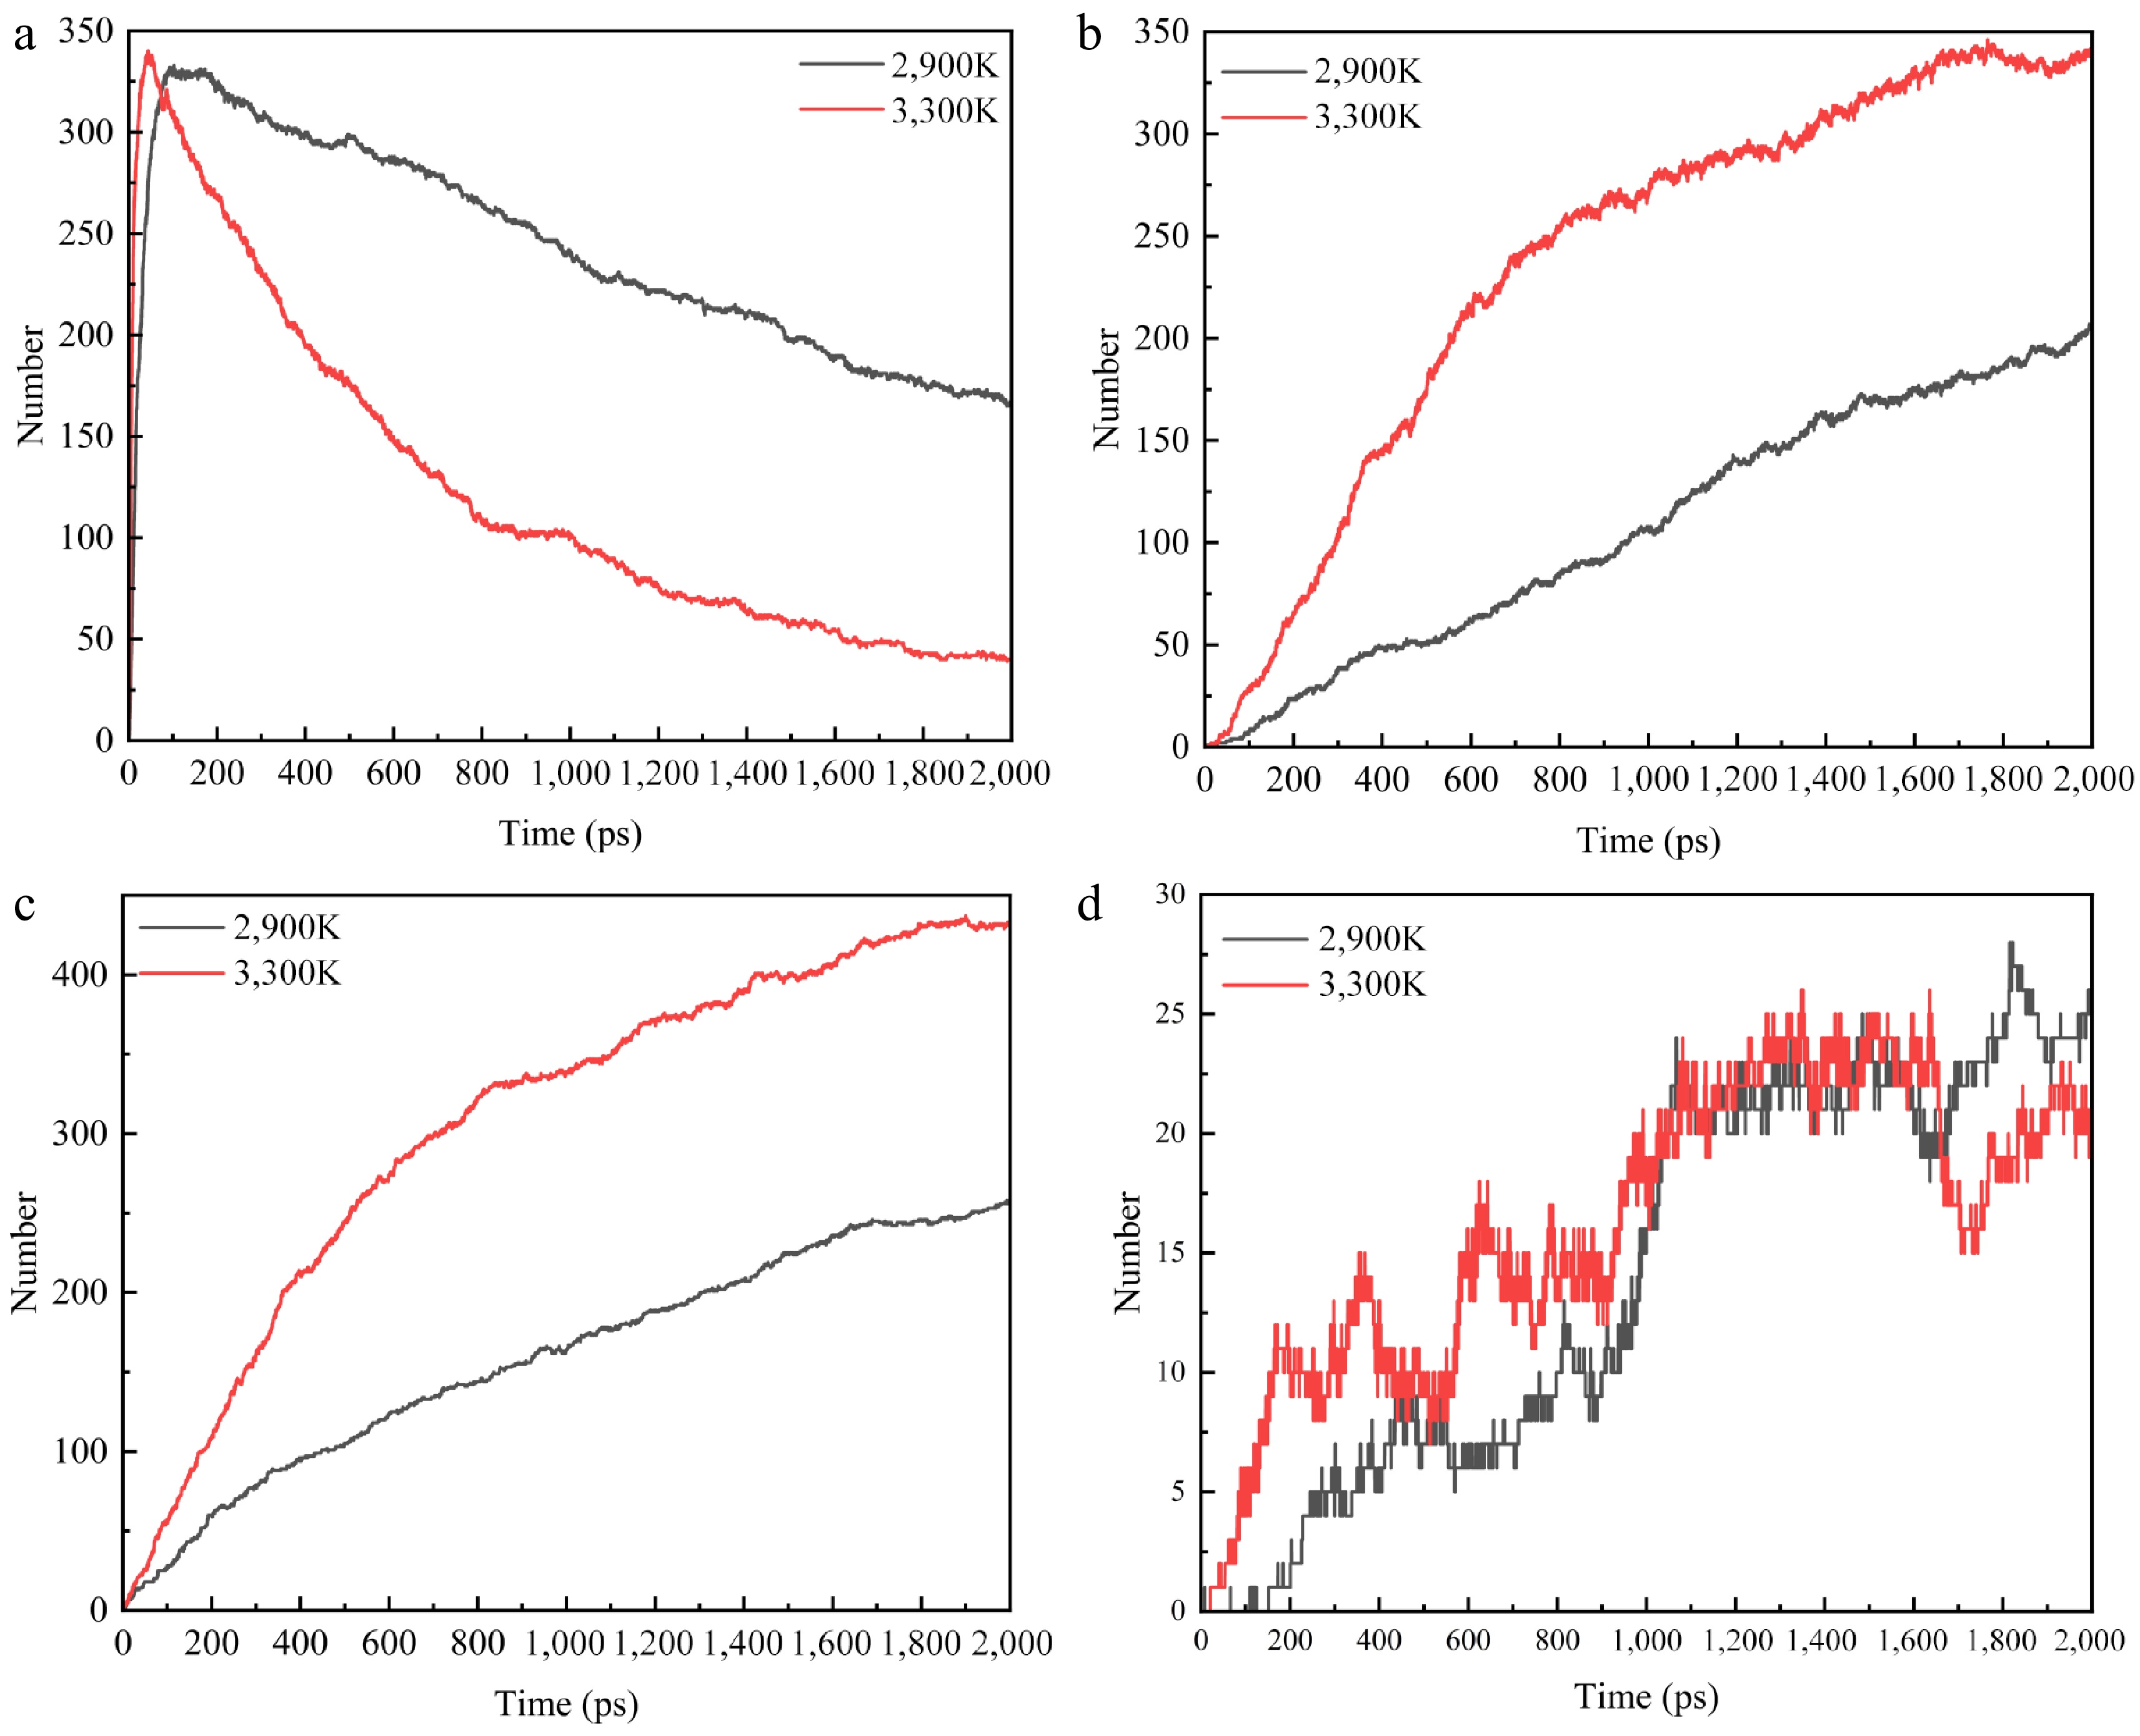
Figure 9.
Plot of changes in the number of pyrolyzed molecules at 2,900 and 3,300 K for specific electric fields. (a) C2H4. (b) C2H2. (c) H2. (d) CH4.
-
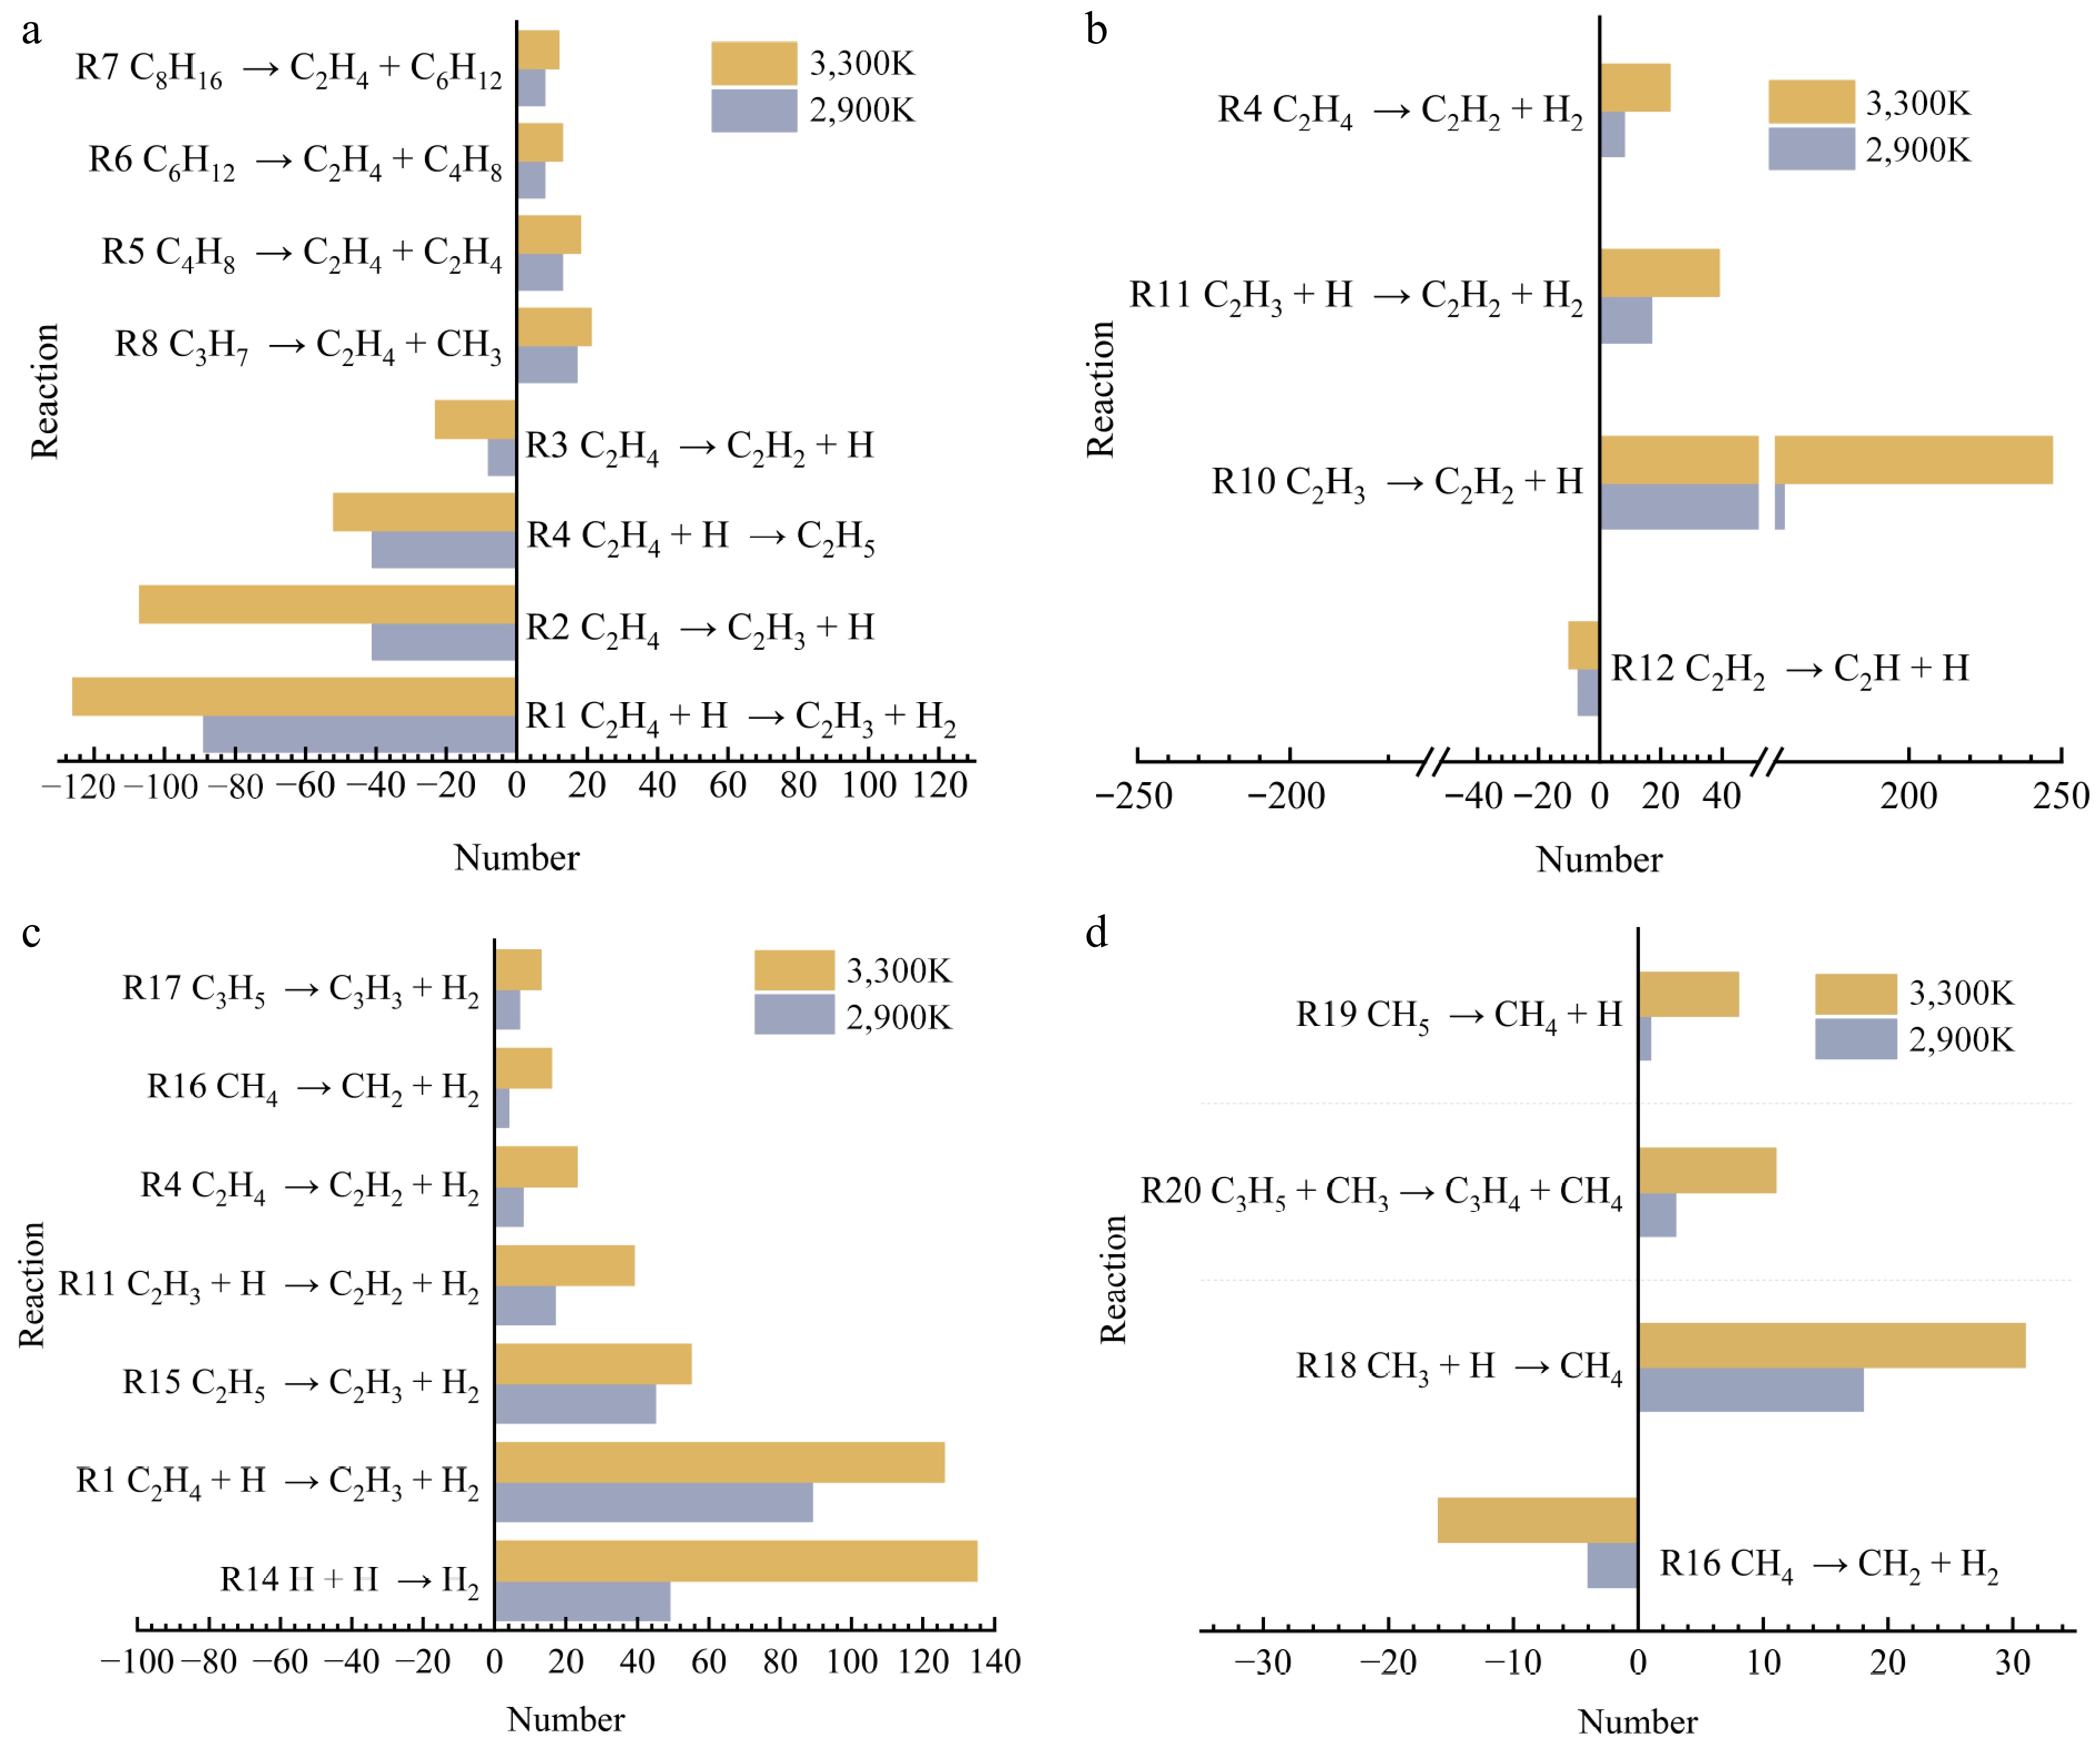
Figure 10.
Plot of the number of major reactions at 2,900 and 3,300 K for specific electric fields. (a) C2H4. (b) C2H2. (c) H2. (d) CH4.
-
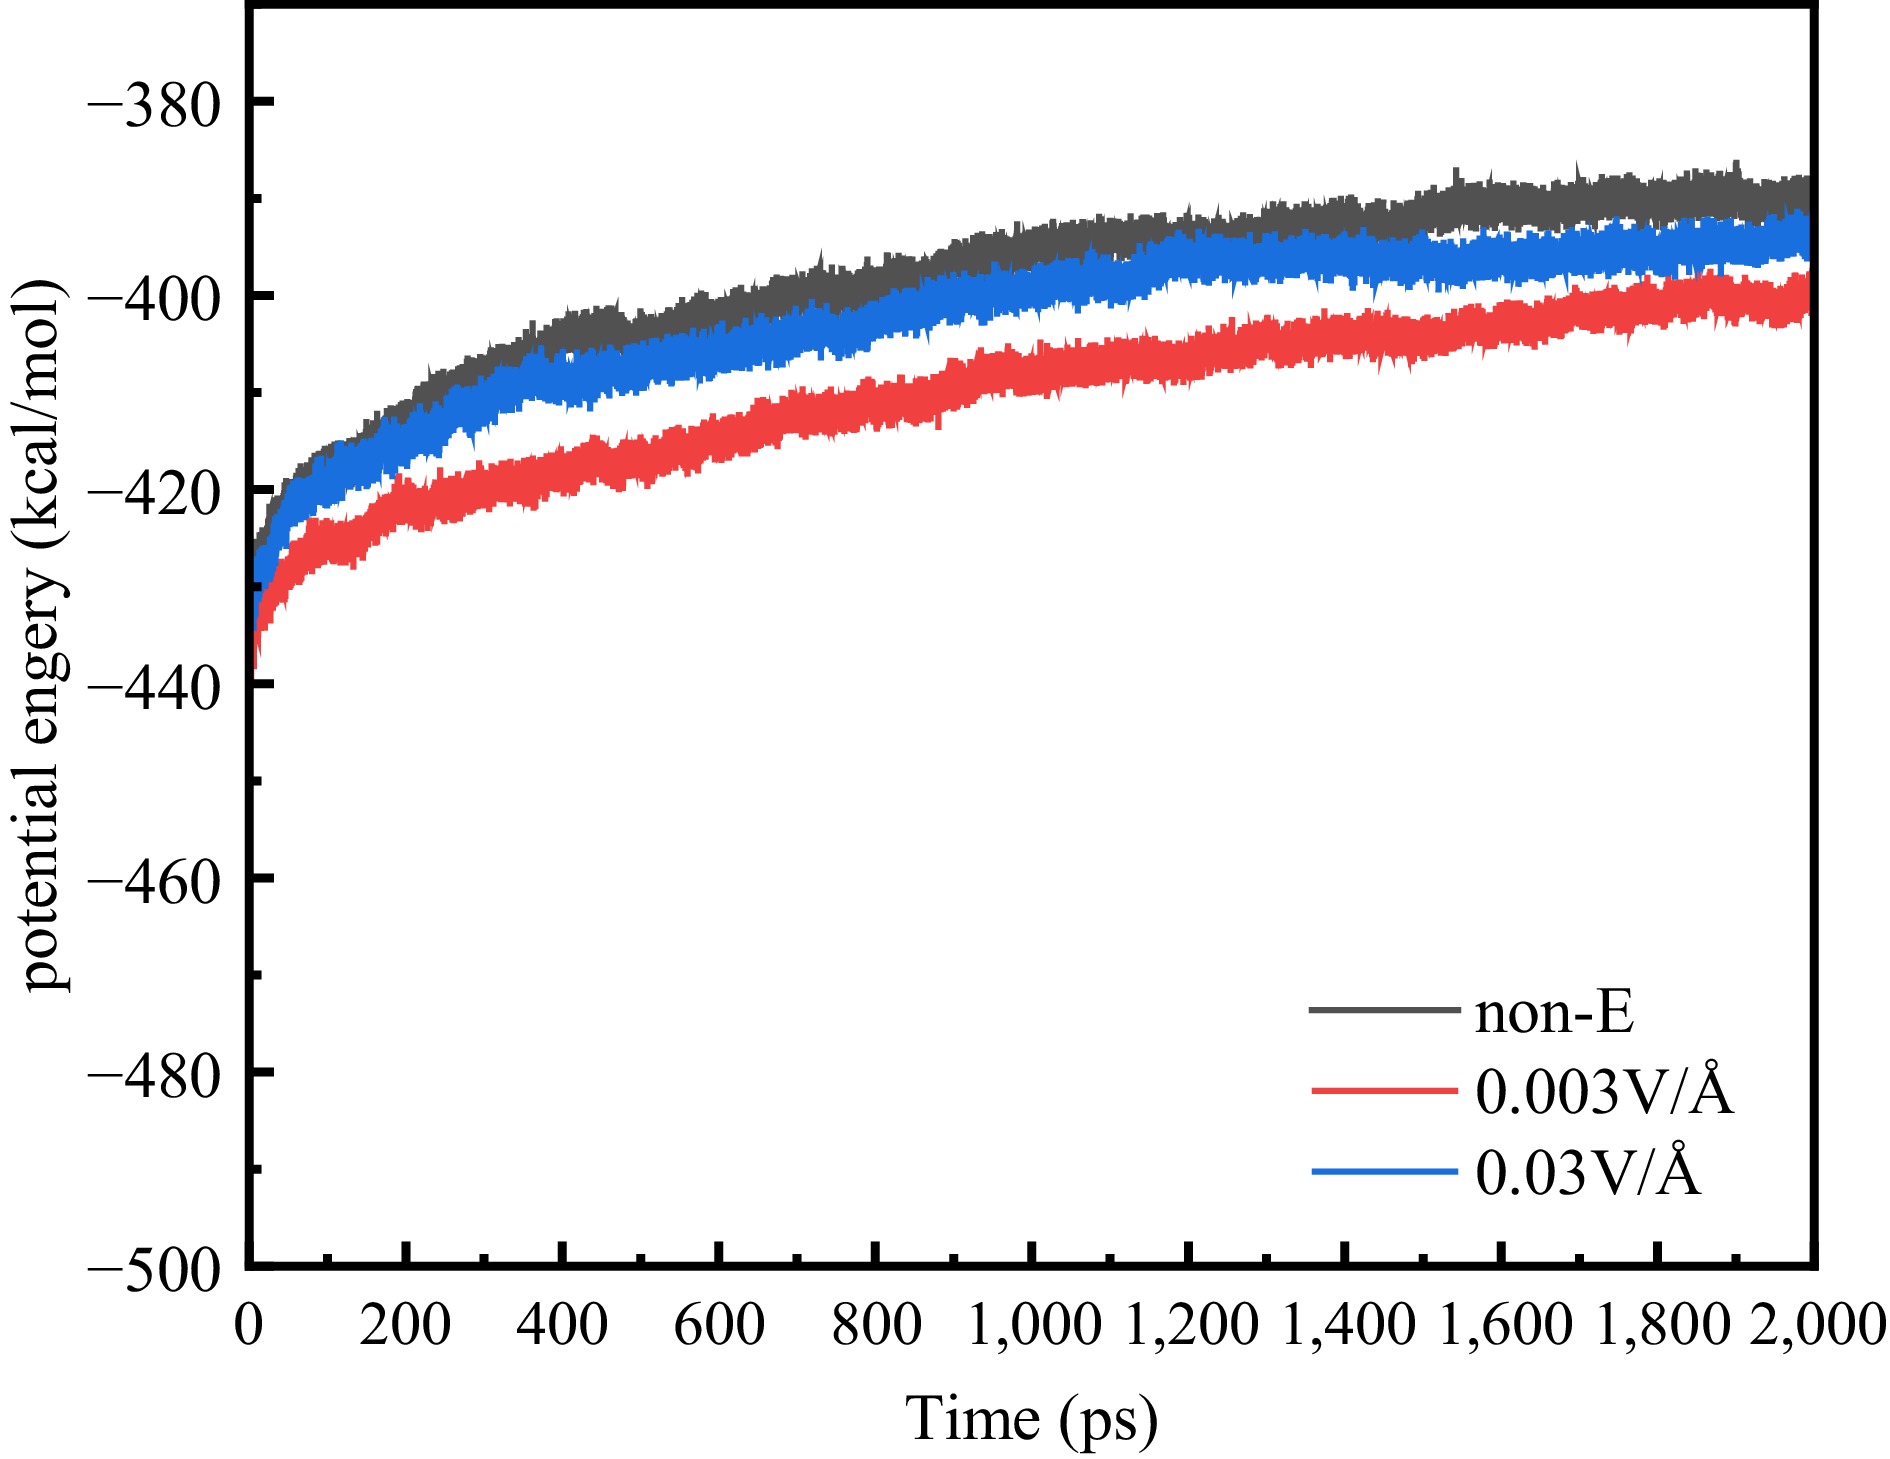
Figure 11.
Potential energy at different electric fields.
-
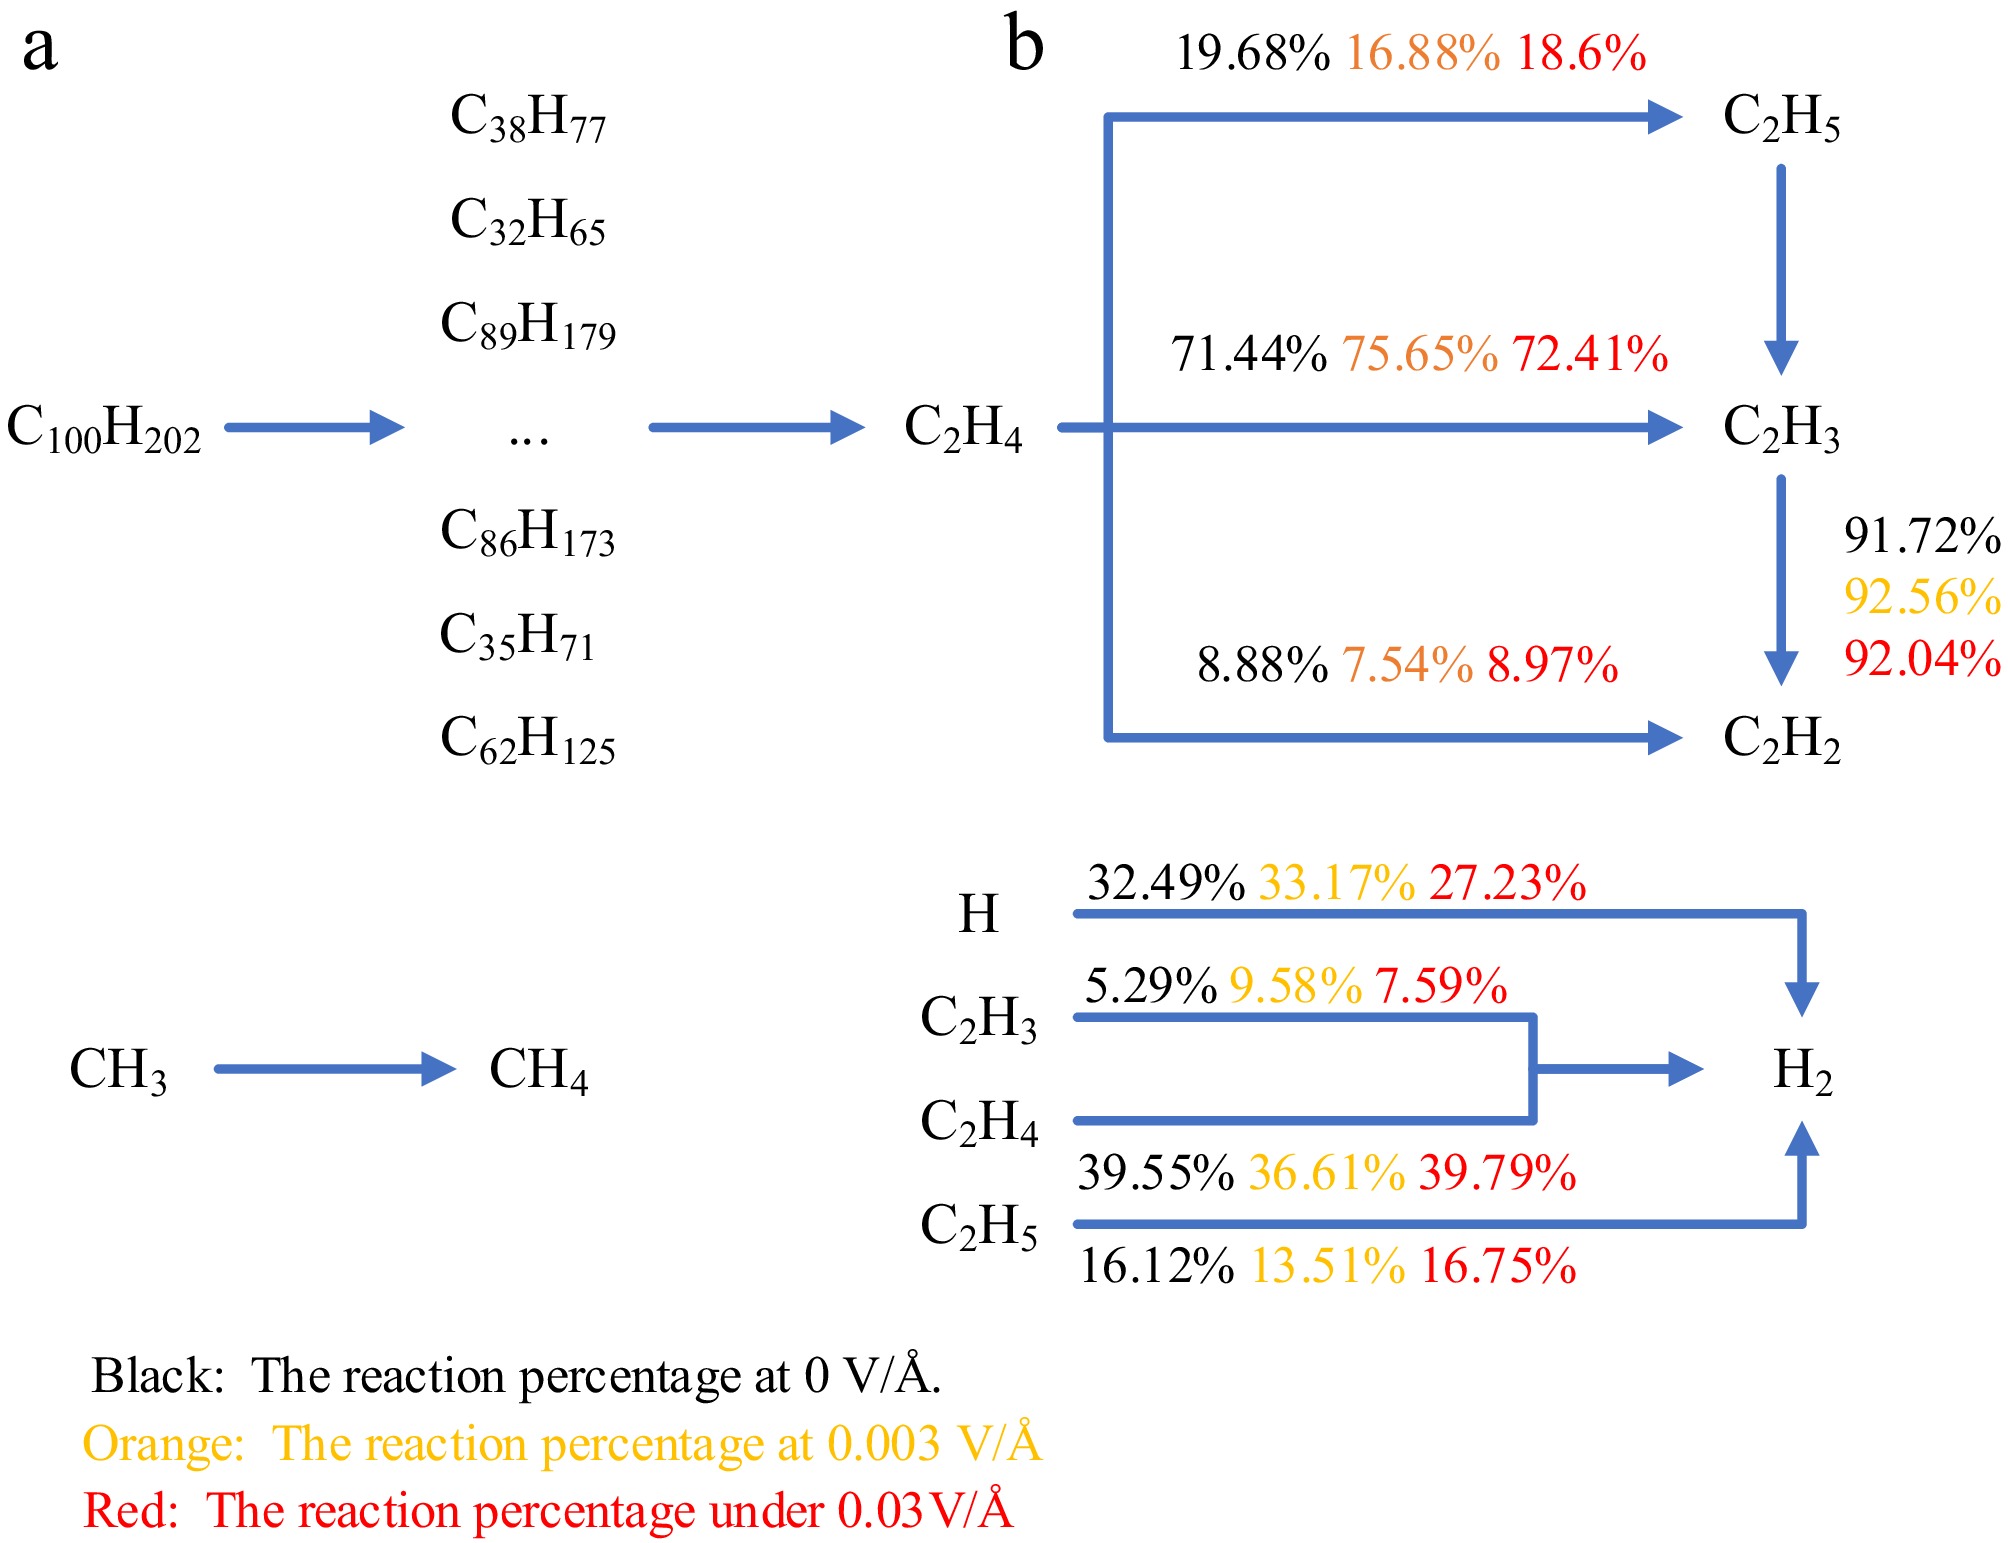
Figure 12.
Generation path of each pyrolysis product after 100 ps. (a) 0.003 V/Å. (b) Strong electric field.
-
Temperature (K) 2,500 2,700 2,900 3,100 3,300 0 V/Å 6.01 × 10¹⁰ 2.41 × 10¹¹ 3.39 × 10¹¹ 5.37 × 10¹¹ 3.25 × 10¹² 0.003 V/Å 1.41 × 10¹¹ 2.67 × 10¹¹ 4.36 × 10¹¹ 1.24 × 10¹² 5.47 × 10¹² 0.03 V/Å 4.63 × 10¹⁰ 8.04 × 10¹⁰ 1.57 × 10¹¹ 3.71 × 10¹¹ 1.36 × 10¹² Table 1.
Rate constants at different pyrolysis temperatures and electric fields.
Figures
(12)
Tables
(1)