-
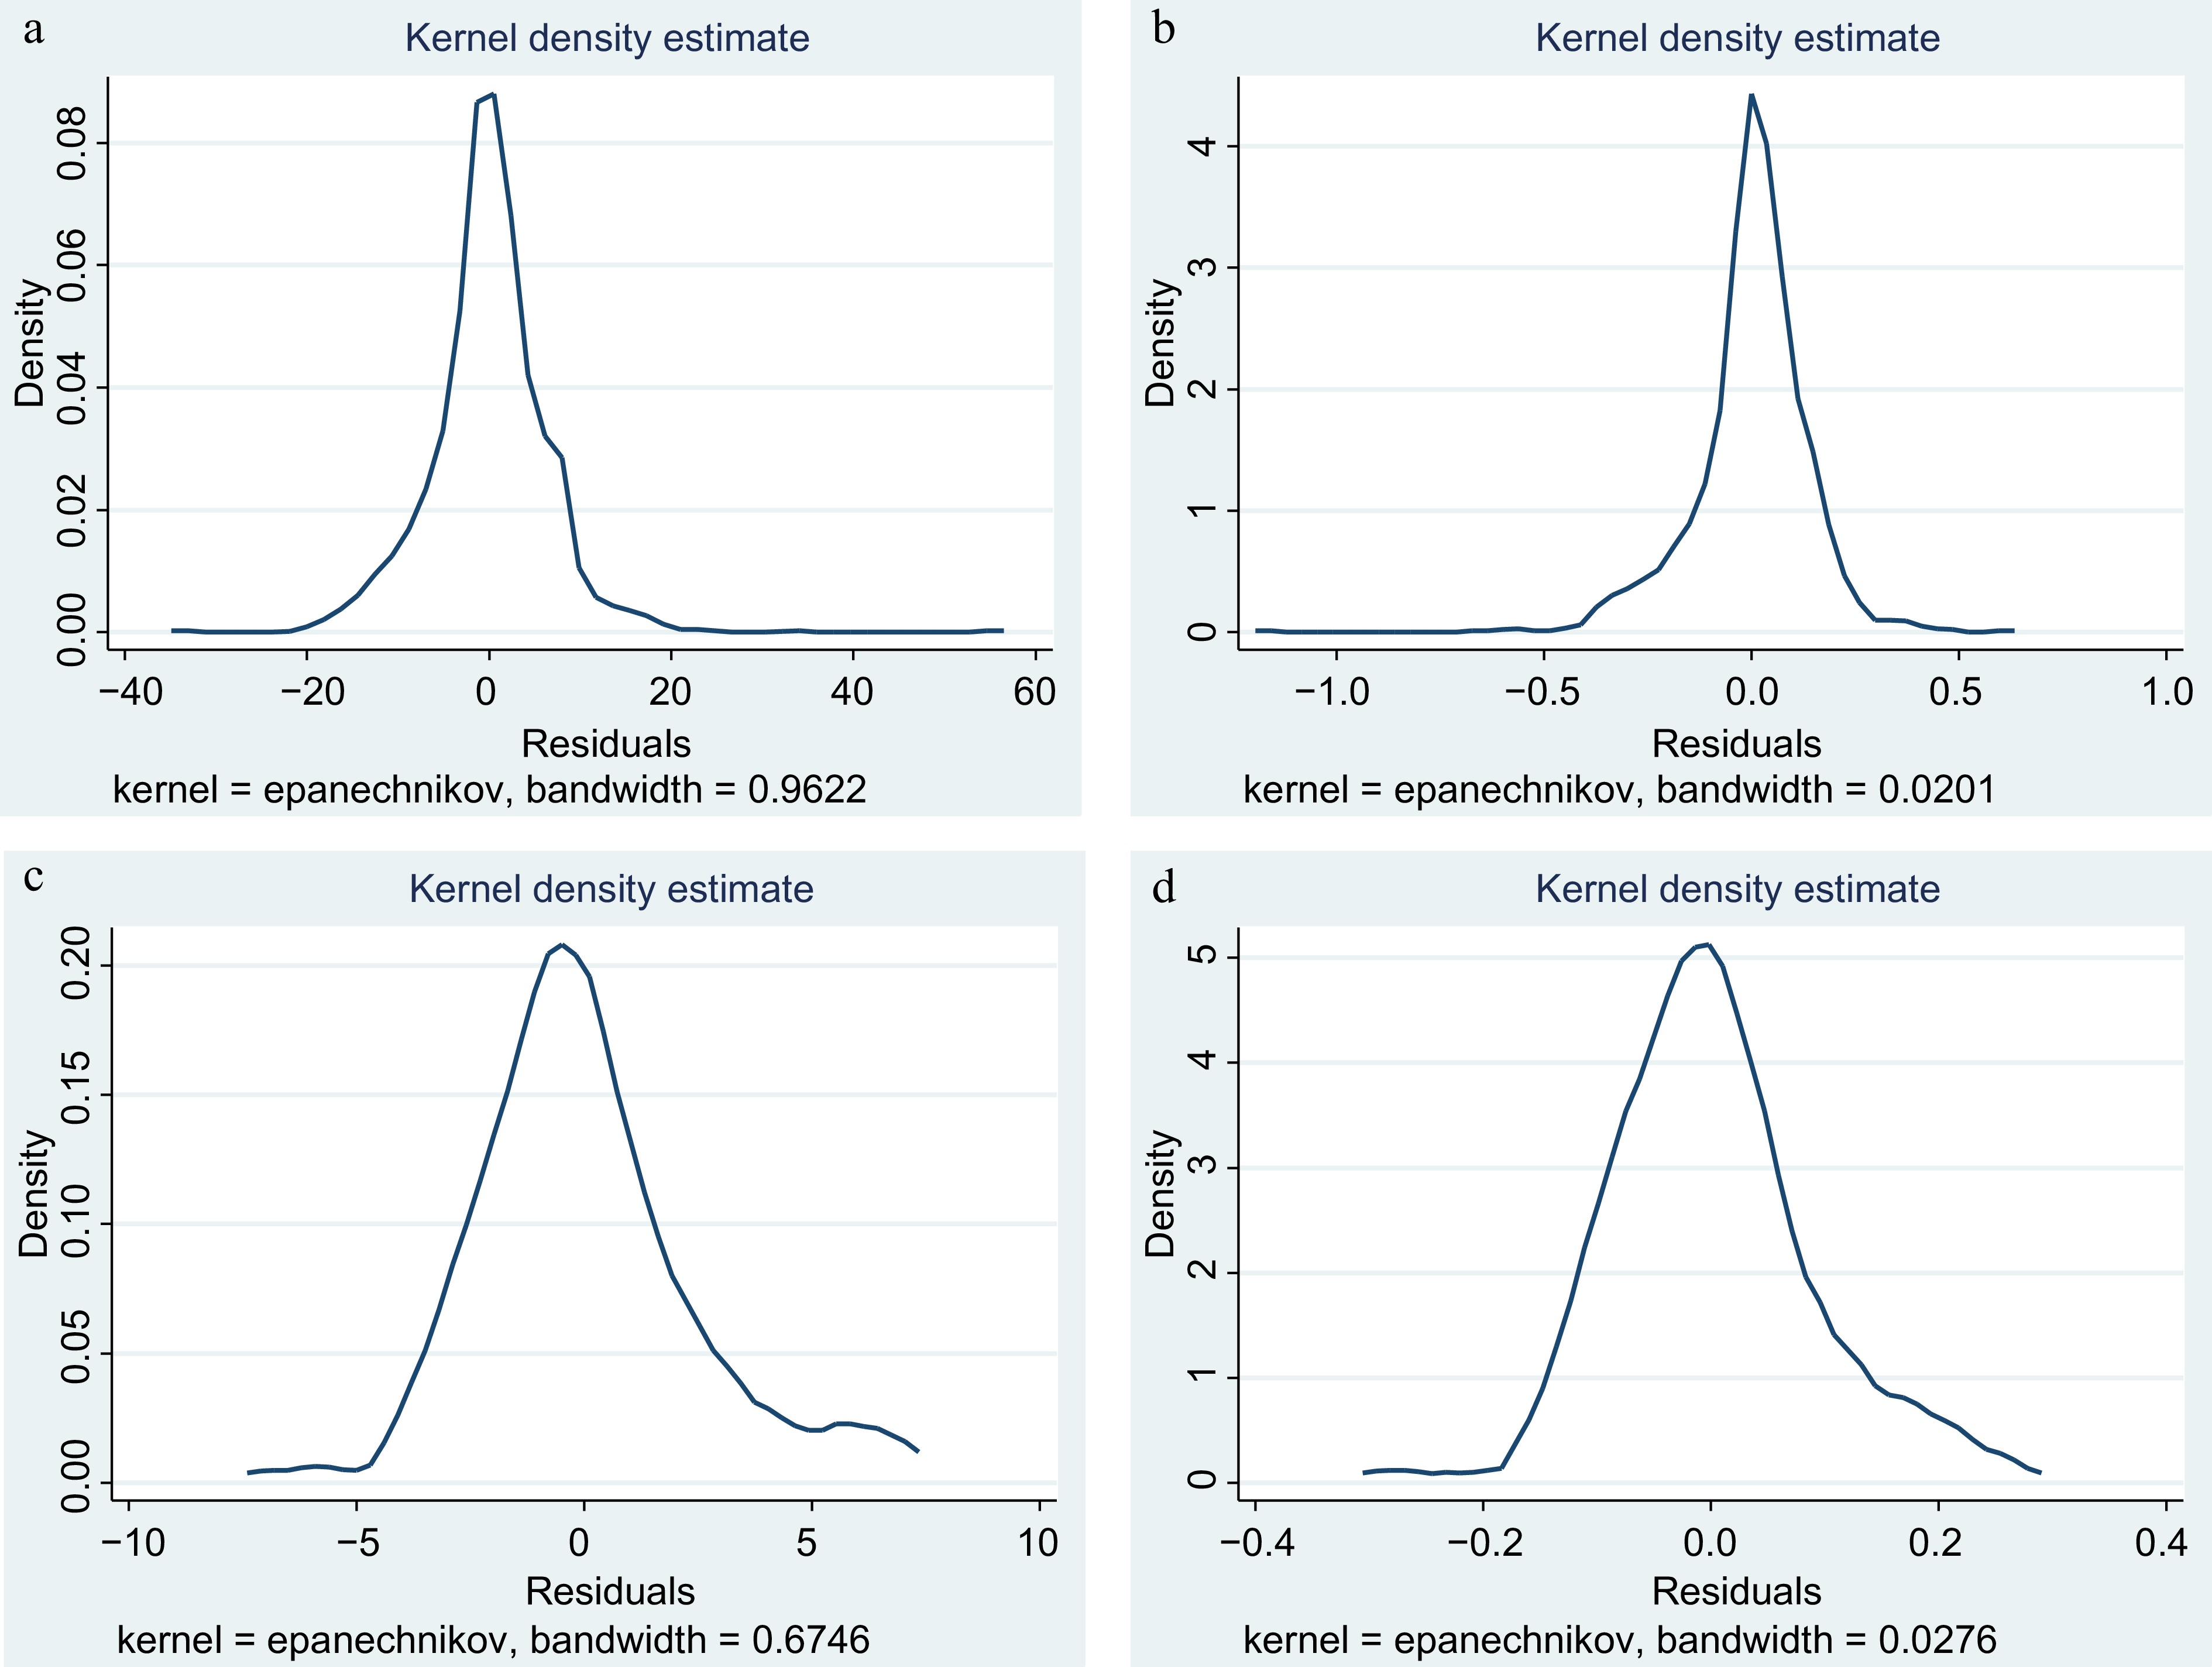
Figure 1.
Residual diagnostic using kernel density estimation.
-
Zone Description Zone II (Terai Zone) Jalpaiguri, Coochbehar, Uttar–Dinajpur Zone III (New Alluvial Zone) Malda, Murshidabad, Nadia, North 24 Parganas, Howrah Zone IV (Old Alluvial Zone) Murshidabad, Burdwan, Hoogly, West Midnapore, East Midnapore Zone V
(Red and Laterite Zone)Birbhum, Burdwan, Bankura, Purulia, West Midnapore Zone VI
(Coastal Saline Zone)North 24 Parganas, South 24 Parganas, East Midnapore Source: Directorate of Economics and Statistics, Department of Agriculture, Cooperation and Farmers Welfare, Ministry of Agriculture and Farmers' Welfare, Government of India[32]. Table 1.
Agro-climatic zone descriptions for west Bengal.
-
Zone Description Zone I Gurdaspur, SBS Nagar, Rupnagar, Patiala, Fatehgarh Sahib, Amritsar, Tarn Taran, Hoshiarpur, and Ferozepur Zone II Moga, Ludhiana, Sangrur, Jalandhar, and Kapurthala Zone III Sangrur, Mansa, Bhatinda, Sri Muktsar Sahib, and Fazika Source: Directorate of Economics and Statistics, Department of Agriculture, Cooperation and Farmers Welfare, Ministry of Agriculture and Farmers' Welfare, Government of India[32]. Table 2.
Zone-wise description of Punjab, West Bengal.
-
Particulars Linear model Log-linear model Coefficient Standard error p-value Coefficient Standard error p-value Constant 3.31 0.4 0.00 0.82 0.02 0.00 Farm size −0.35 0.14 0.02 −0.02 0.01 0.00 Family labor 2.00E-03 2.00E-03 0.34 −1.30E-04 0.00 0.15 Casual labor 9.00E-04 1.00E-03 0.54 −0.00 0.00 0.36 Seed 0.03 0.02 0.28 −1.50E-04 9.60E-04 0.87 Fertilizer 4.00E-03 0.01 0.59 7.00E-04 3.00E-04 0.01 Bullock and machinery 1.50E-03 0.01 0.84 −2.00E-04 3.00E-04 0.35 Imputed rent of land 1.80E-03 0.00 0.00 5.00E-05 3.50E-06 0.00 R2 0.9 0.86 Table 3.
Farm size-productivity relationship in the Terai Zone (II) of West Bengal (paddy).
-
Particulars Linear model Log-linear model Coefficient Standard error p-value Coefficient Standard error p-value Constant 4.64 0.33 0.00 0.81 0.01 2.00E-04 Farm size −0.12 0.05 0.01 −4.93E-03 1.65E-03 5.00E-04 Family labor 3.00E-03 1.02E-03 8.25E-04 0.01 3.00E-04 0.02 Casual labor 1.00E-03 1.11E-03 0.37 4.00E-04 3.00E-03 0.27 Seed 0.05 0.02 1.95E-03 2.45E-03 6.21E-04 0.00 Fertilizer 0.03 4.15E-03 4.00E-04 1.08E-03 1.41E-04 0.00 Bullock and machinery −0.01 0.01 0.40 −2.20E-04 3.16E-04 0.49 Imputed rent of land 1.00E-03 2.00E-04 0.00 3.00E-04 2.00E-04 1.00E-04 R2 0.8 0.81 Table 4.
Farm size-productivity relationship in the New Alluvial Zone (III) of West Bengal (paddy).
-
Particulars Linear model Log-linear model Coefficient Standard error p-value Coefficient Standard error p-value Constant 6.77 0.34 6.80E-04 0.92 0.01 0.00 Farm size −0.70 0.09 1.90E-03 −0.03 3.13E-03 4.40E-04 Family labor −3.35E-03 1.33E-03 0.01 −1.60E-04 4.40E-04 4.64E-04 Casual labor −4.15E-03 1.15E-03 3.43E-04 −1.50E-04 3.83E-04 6.20E-03 Seed 0.19 0.01 0.02 6.59E-03 4.95E-04 0.00 Fertilizer 0.02 3.27E-03 2.40E-03 7.60E-04 1.09E-04 0.06 Bullock and machinery 5.79E-03 0.01 0.60 4.97E-04 3.63E-04 0.17 Imputed rent of land 9.28E-04 0.44 1.55 2.64 5.00E-03 2.71E-03 R2 0.87 0.86 Table 5.
Farm size-productivity relationship in Zone IV of West Bengal for paddy cultivation.
-
Particulars Linear model Log-linear model Coefficient Standard error p-value Coefficient Standard error p-value Constant 0.57 0.32 0.01 0.63 0.01 0.01 Farm size −0.23 0.063 2.62E-04 −0.01 2.72E-03 1.20E-04 Family labor −5.90E-04 1.72E-03 0.73 −7.00E-04 0.07 0.99 Casual labor 4.18E-03 1.51E-03 5.86E-03 3.40E-03 0.07 0.02 Seed 0.22 0.02 0.04 7.23E-03 7.77E-04 0.02 Fertilizer 3.00E-03 5.93E-03 0.61 −2.60E-04 2.56E-04 0.30 Bullock and machinery 3.04E-03 7.58E-03 0.69 3.88E-04 3.28E-04 0.24 Imputed rent of land 1.85E-03 0.06 9.60E-03 0.07 0.24 0.01 R2 0.9 0.88 Table 6.
Farm size-productivity dynamics in Zone V of West Bengal for paddy cultivation.
-
Particulars Linear model Log-linear model Coefficient Standard error p-value Coefficient Standard error p-value Constant 0.47 0.56 4.04E-01 0.52 0.03 1.80E-04 Farm size −0.57 0.19 2.64E-03 −0.03 0.01 0.04 Family labor 0.01 2.28E-03 0.02 2.20E-04 1.30E-04 0.09 Casual labor −2.87E-03 2.80E-03 0.31 −1.00E-04 1.60E-04 0.42 Seed 0.06 0.03 0.03 4.77E-03 1.70E-03 0.01 Fertilizer 0.02 6.48E-03 5.17E-04 4.04E-04 3.77E-04 0.29 Bullock and machinery 0.02 0.03 0.43 1.10E-03 1.62E-03 0.49 Imputed rent of land 1.91E-03 1.01 2.40 8.50E-04 5.00E-04 0.03 R2 0.94 0.9 Table 7.
Farm size-productivity relationship in Coastal Saline Zone (VI) of West Bengal for paddy cultivation.
-
Particulars Linear model Log-linear model Coefficient Standard error p-value Coefficient Standard error p-value Constant 8.11 0.71 3.15E-04 0.92 0.04 0.01 Farm size 6.31E-03 0.01 0.05 4.65E-04 6.99E-04 5.00E-04 Family labor −3.37E-03 0.01 0.72 −4.45E-03 4.25E-04 0.93 Casual labor −7.70E-04 4.09E-03 0.85 −5.43E-03 2.10E-04 0.79 Seed 0.04 0.03 0.16 1.24E-03 1.42E-03 0.38 Fertilizer 5.23E-03 0.01 0.45 2.03E-04 3.57E-04 0.57 Bullock and machinery −0.20 0.08 0.02 −0.01 4.36E-03 0.01 Imputed rent of land 1.13E-04 3.66E-04 2.21E-04 5.81E-04 1.88 2.10E-03 R2 0.67 0.65 Table 8.
Farm size-productivity dynamics in Zone I of Punjab (wheat).
-
Particulars Linear model Log-linear model Coefficient Standard error p-value Coefficient Standard error p-value Constant 6.40 0.85 7.18E-03 0.84 0.04 1.78E-03 Farm size 0.01 0.01 0.50 6.15E-04 4.86E-04 2.09 Family labor −0.01 0.01 0.28 −5.40E-04 5.11 0.29 Casual labor −6.00E-03 0.01 0.61 −2.54 5.19 0.62 Seed 0.07 0.03 0.02 2.92E-03 1.31E-03 0.03 Fertilizer 0.03 0.01 6.33E-04 1.35E-03 3.88E-04 6.93E-04 Bullock and machinery 0.10 0.09 0.24 4.17E-03 3.89E-03 0.29 Imputed rent of land 1.21E-04 3.00E-04 1.01E-03 5.33E-03 0.01 0.09 R2 0.48 0.48 Table 9.
Farm size-productivity dynamics in Zone II of Punjab (wheat).
-
Particulars Linear model Log-linear model Coefficient Standard error p-value Coefficient Standard error p-value Constant 6.27 0.74 0.01 0.84 0.03 4.25E-03 Farm size 2.19E-03 1.46E-02 0.38 2.39E-04 6.98E-04 0.33 Family labour −0.02 0.01 0.04 −1.14E-03 0.06 0.05 Casual labour 0.02 0.01 0.10 0.07 4.00E-04 0.15 Seed 0.09 0.03 1.30E-03 3.35E-03 1.38E-03 0.02 Fertilizer 0.03 0.01 0.01 1.30E-03 5.07E-04 0.01 Bullock and machinery −3.43E-03 0.09 0.97 1.45E-03 4.71E-03 0.76 Imputed rent of land 1.74E-04 3.82E-03 9.20E-04 7.97E-03 1.36E-03 2.15E-03 R2 0.48 0.44 Table 10.
Farm size-productivity dynamics in zone III of Punjab (wheat).
Figures
(1)
Tables
(10)