-
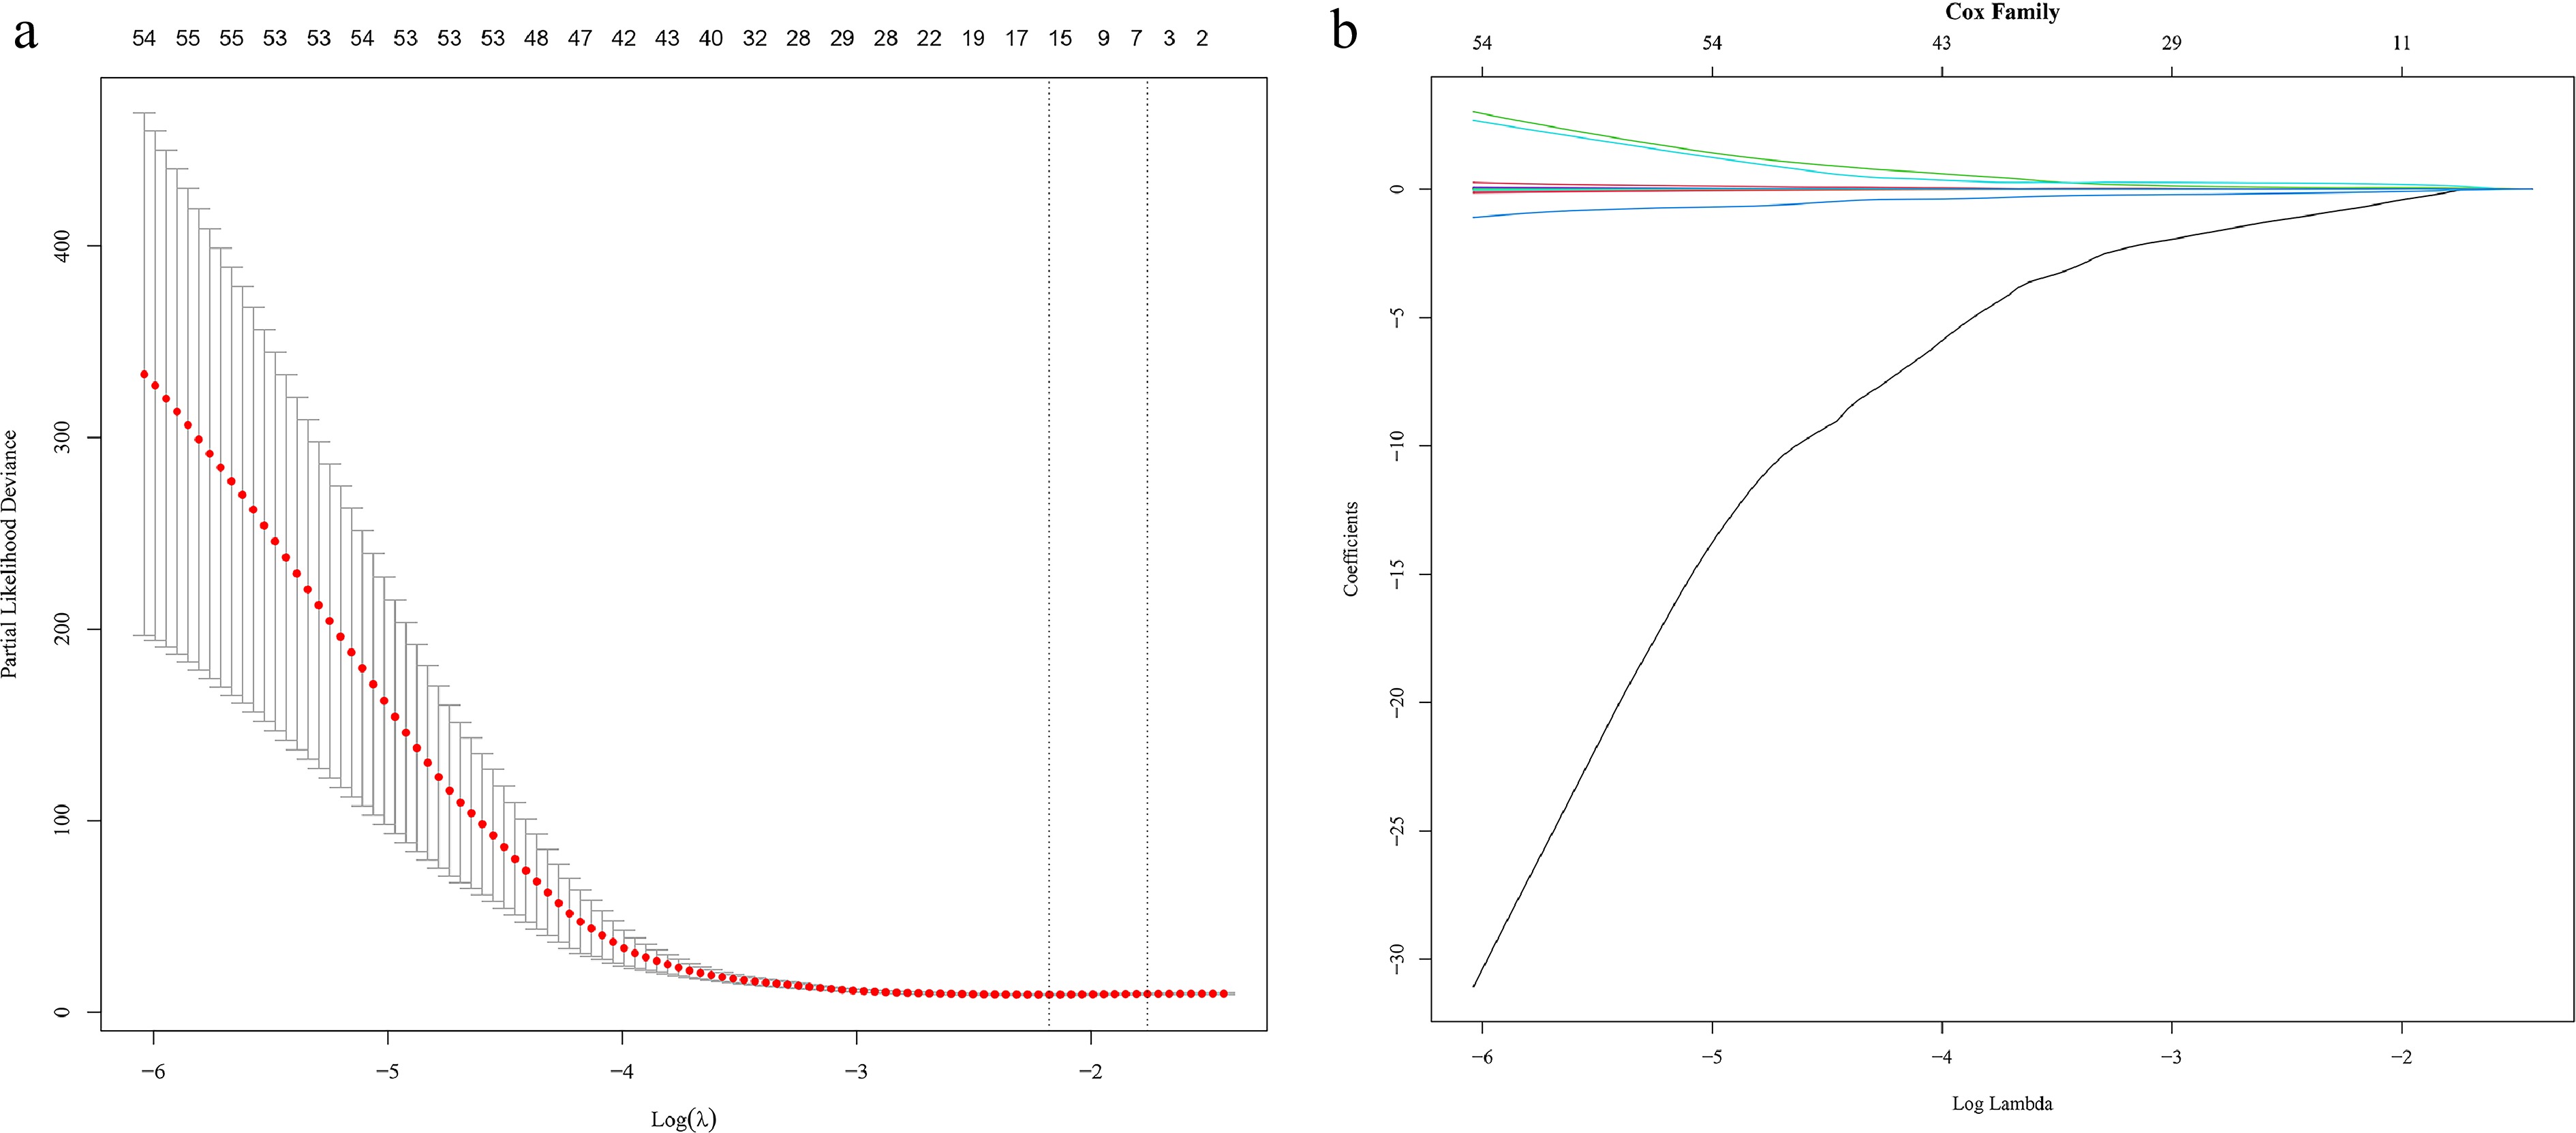
Figure 1.
(a) LASSO deviance profiles for miRNAs associated with GC patients in the training group. (b) LASSO coefficient profiles for miRNAs associated with GC patients in the training group.
-
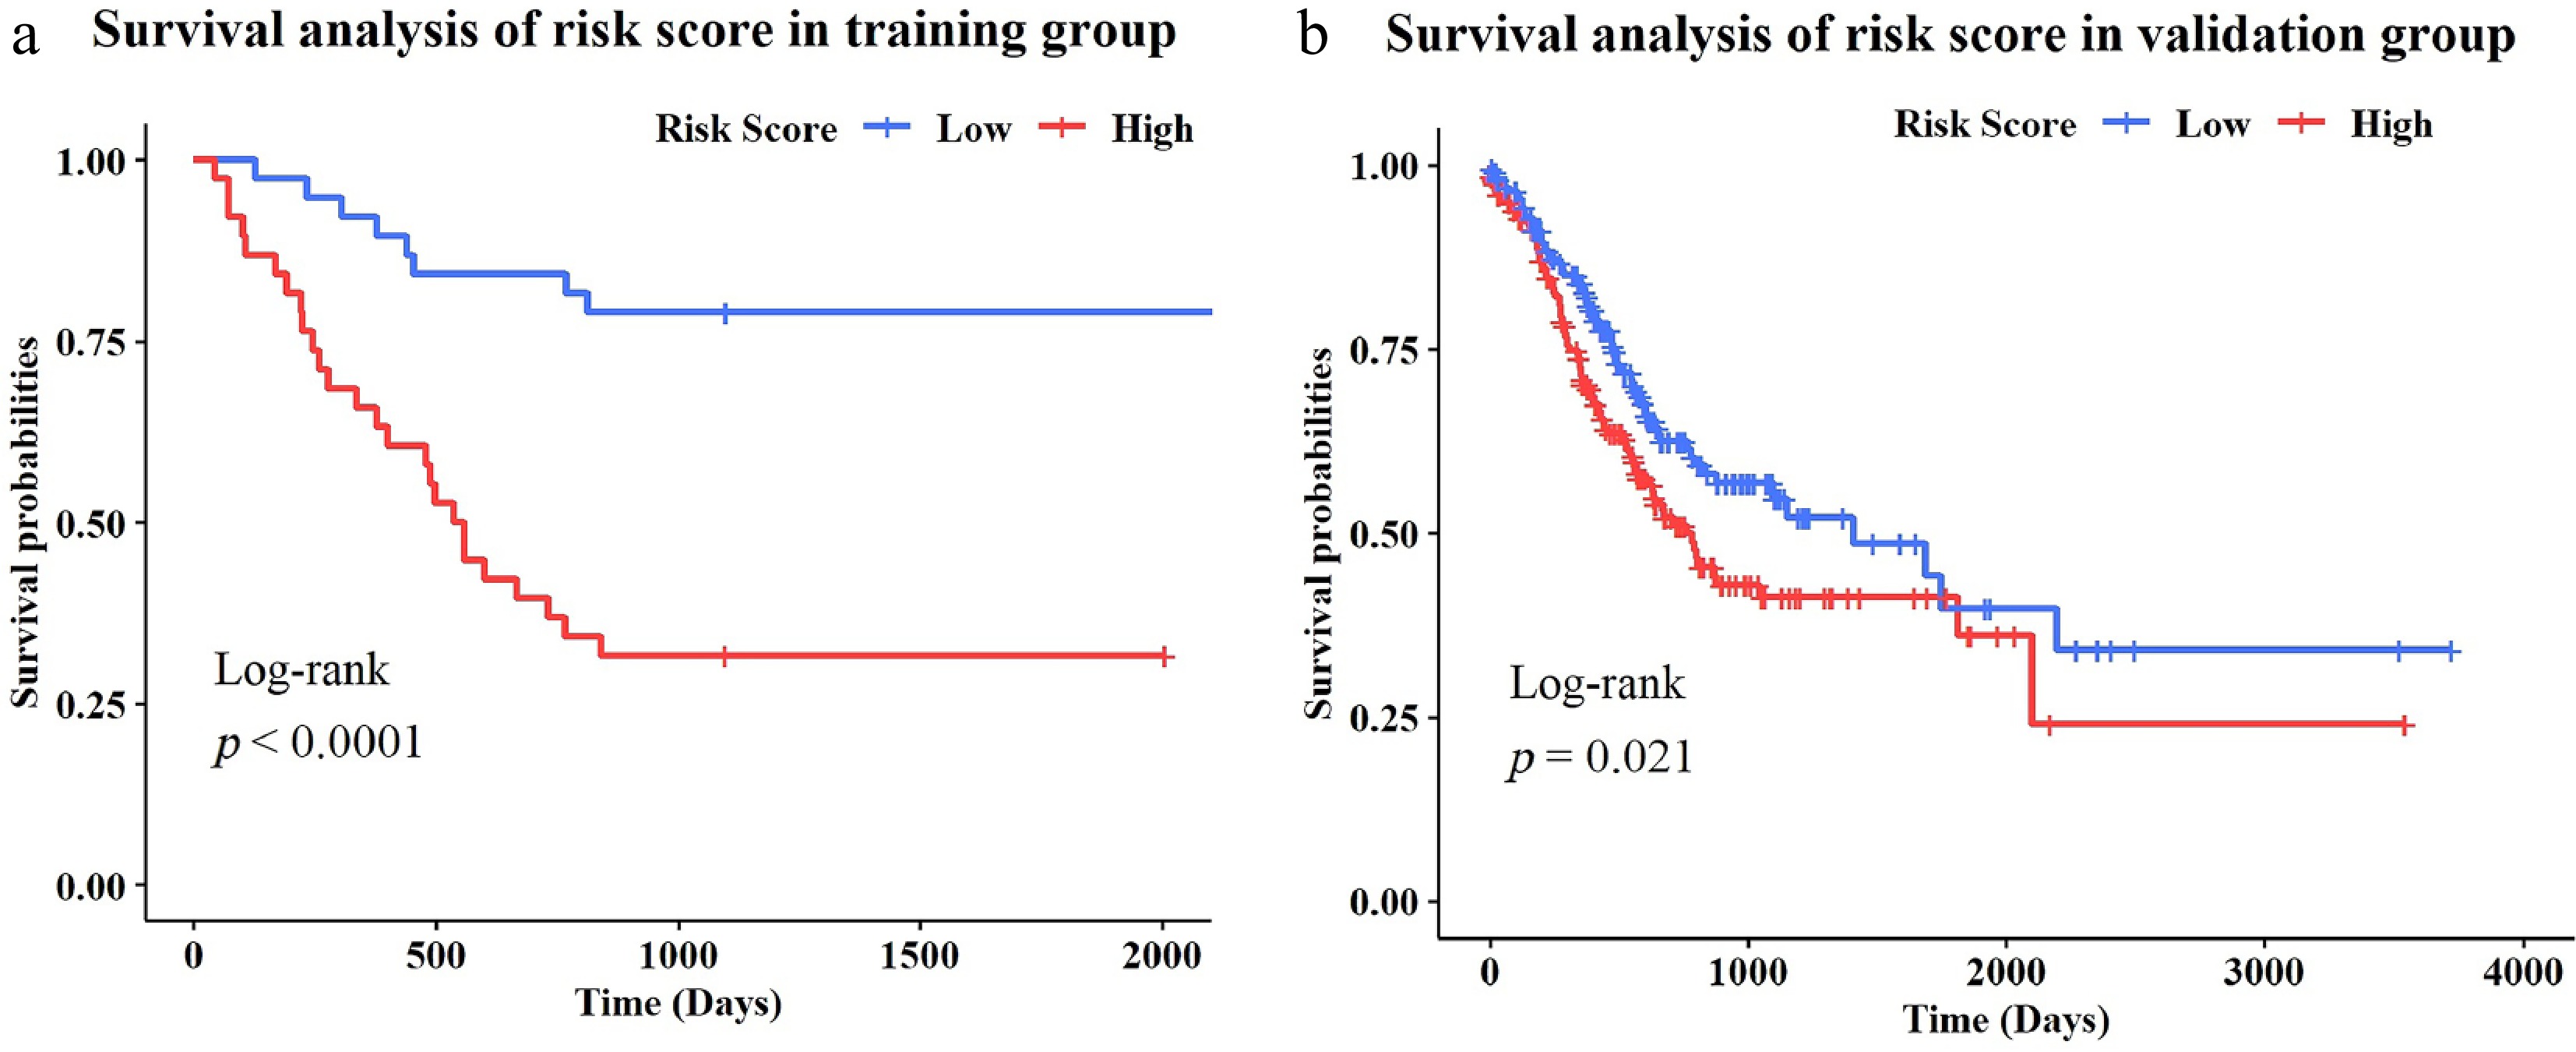
Figure 2.
(a) Survival curves of the effect of miRNA-based risk scores on GC patients in the training group. (b) Survival curves of the effect of miRNA-based risk scores on GC patients in the validation group.
-
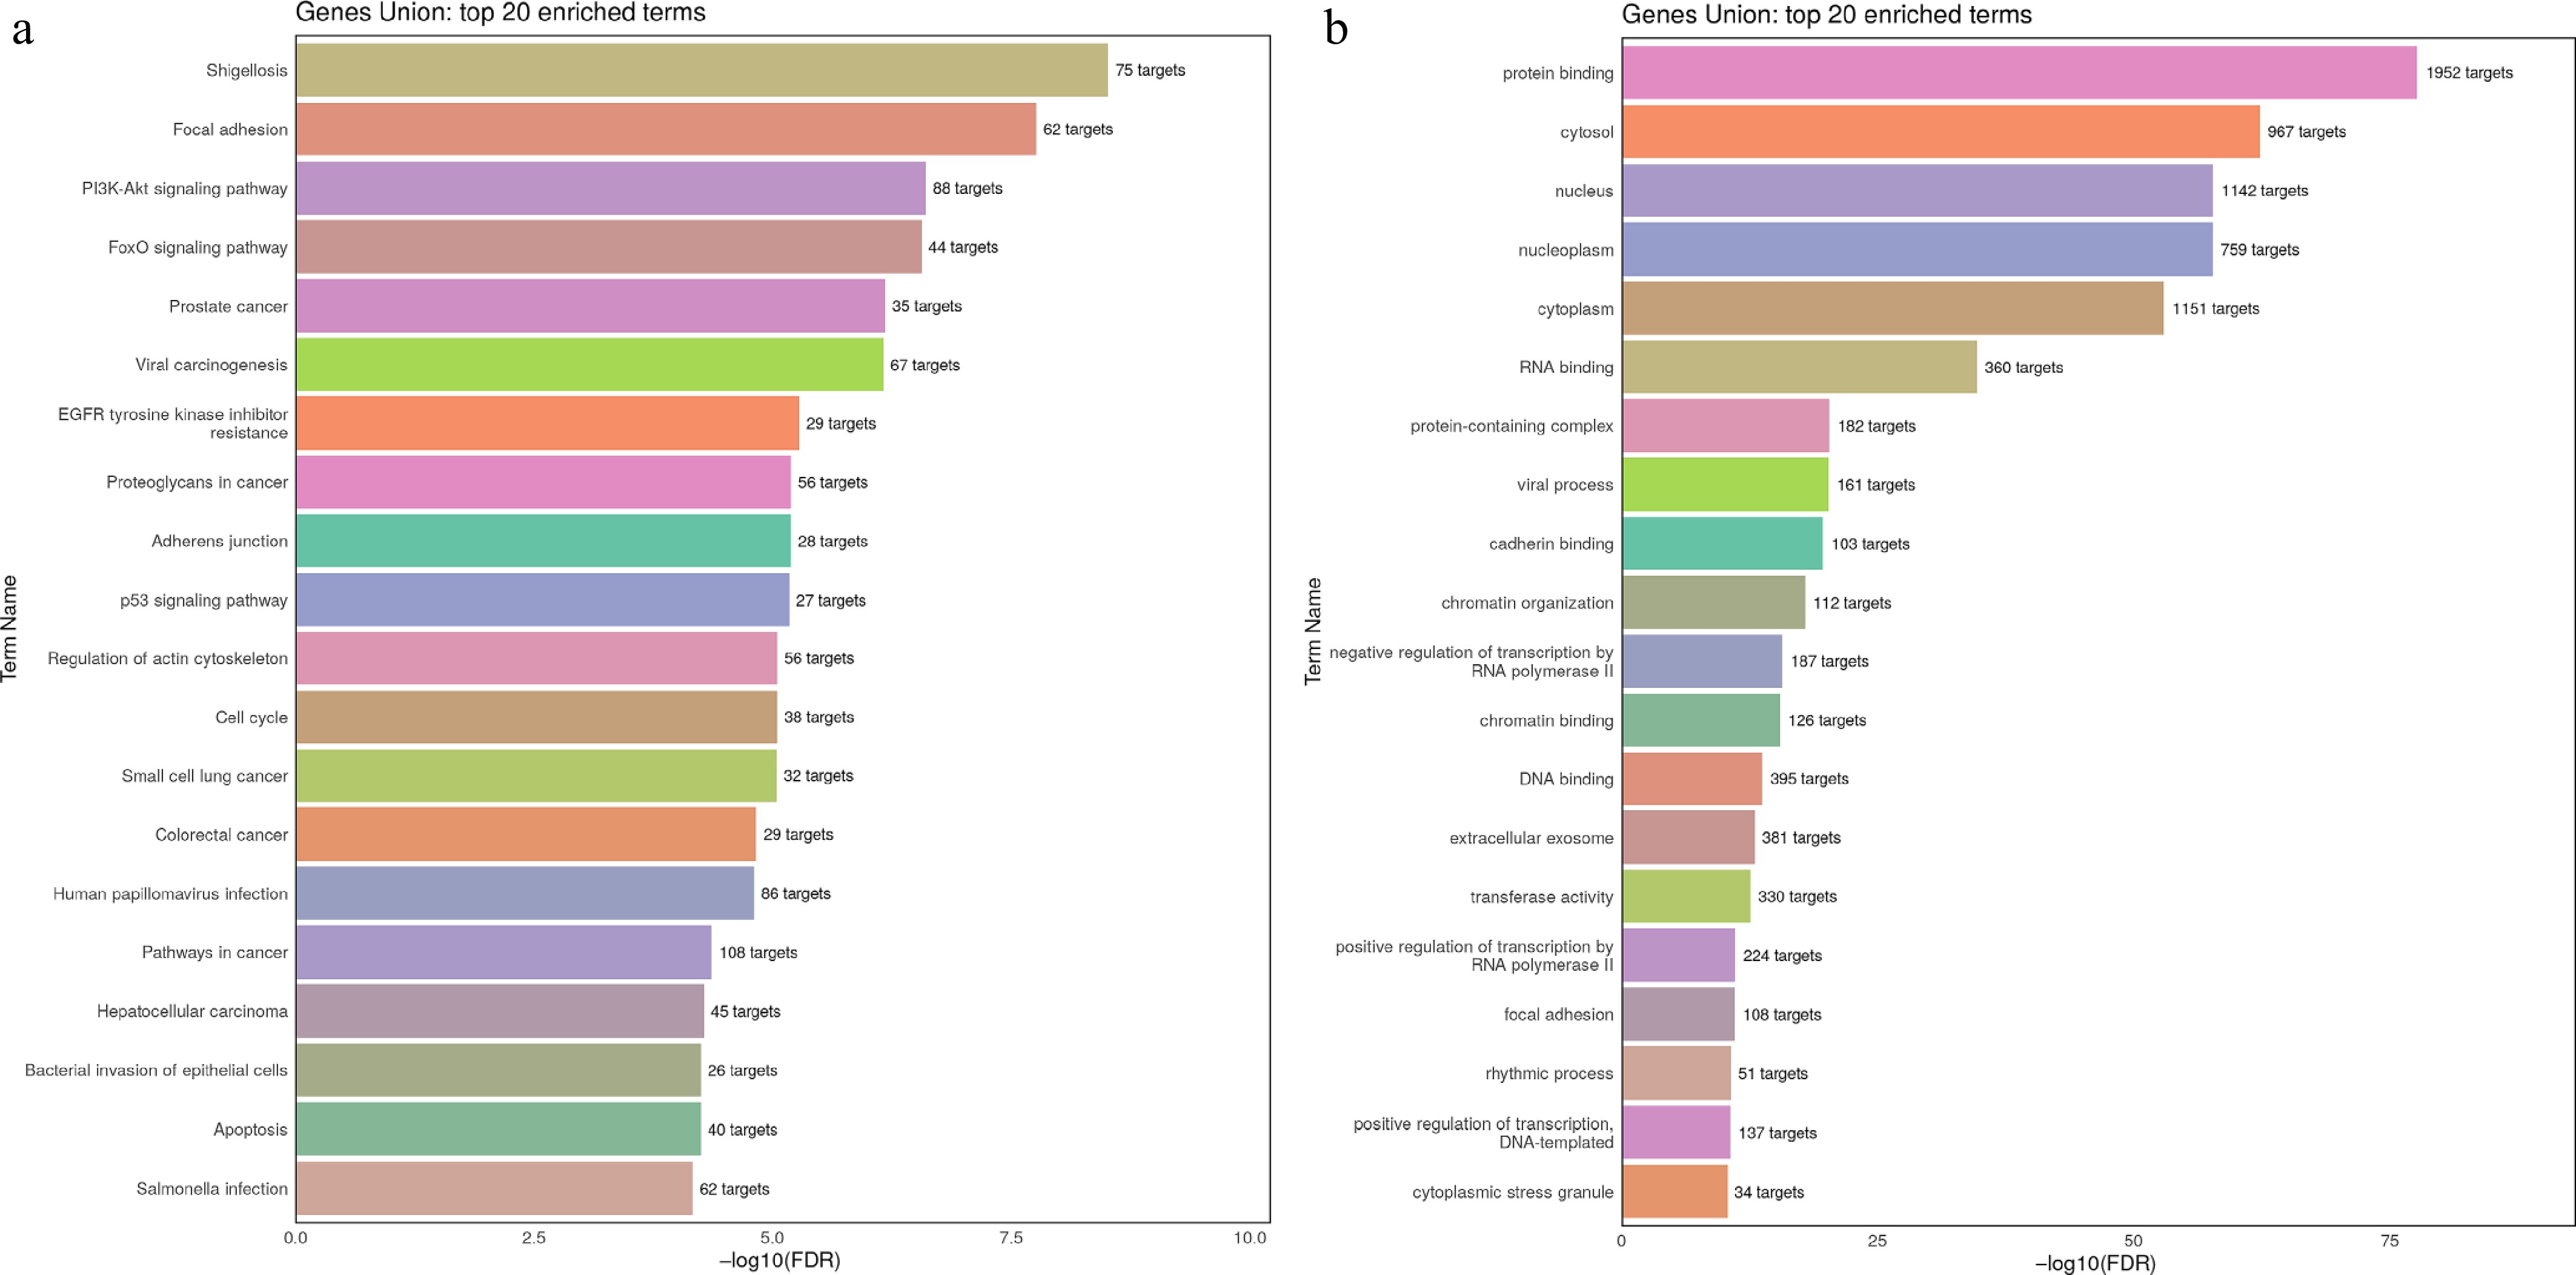
Figure 3.
(a) KEGG enrichment analysis of the miRNAs' target genes. (b) GO pathway enrichment analysis of the miRNAs' target genes.
-
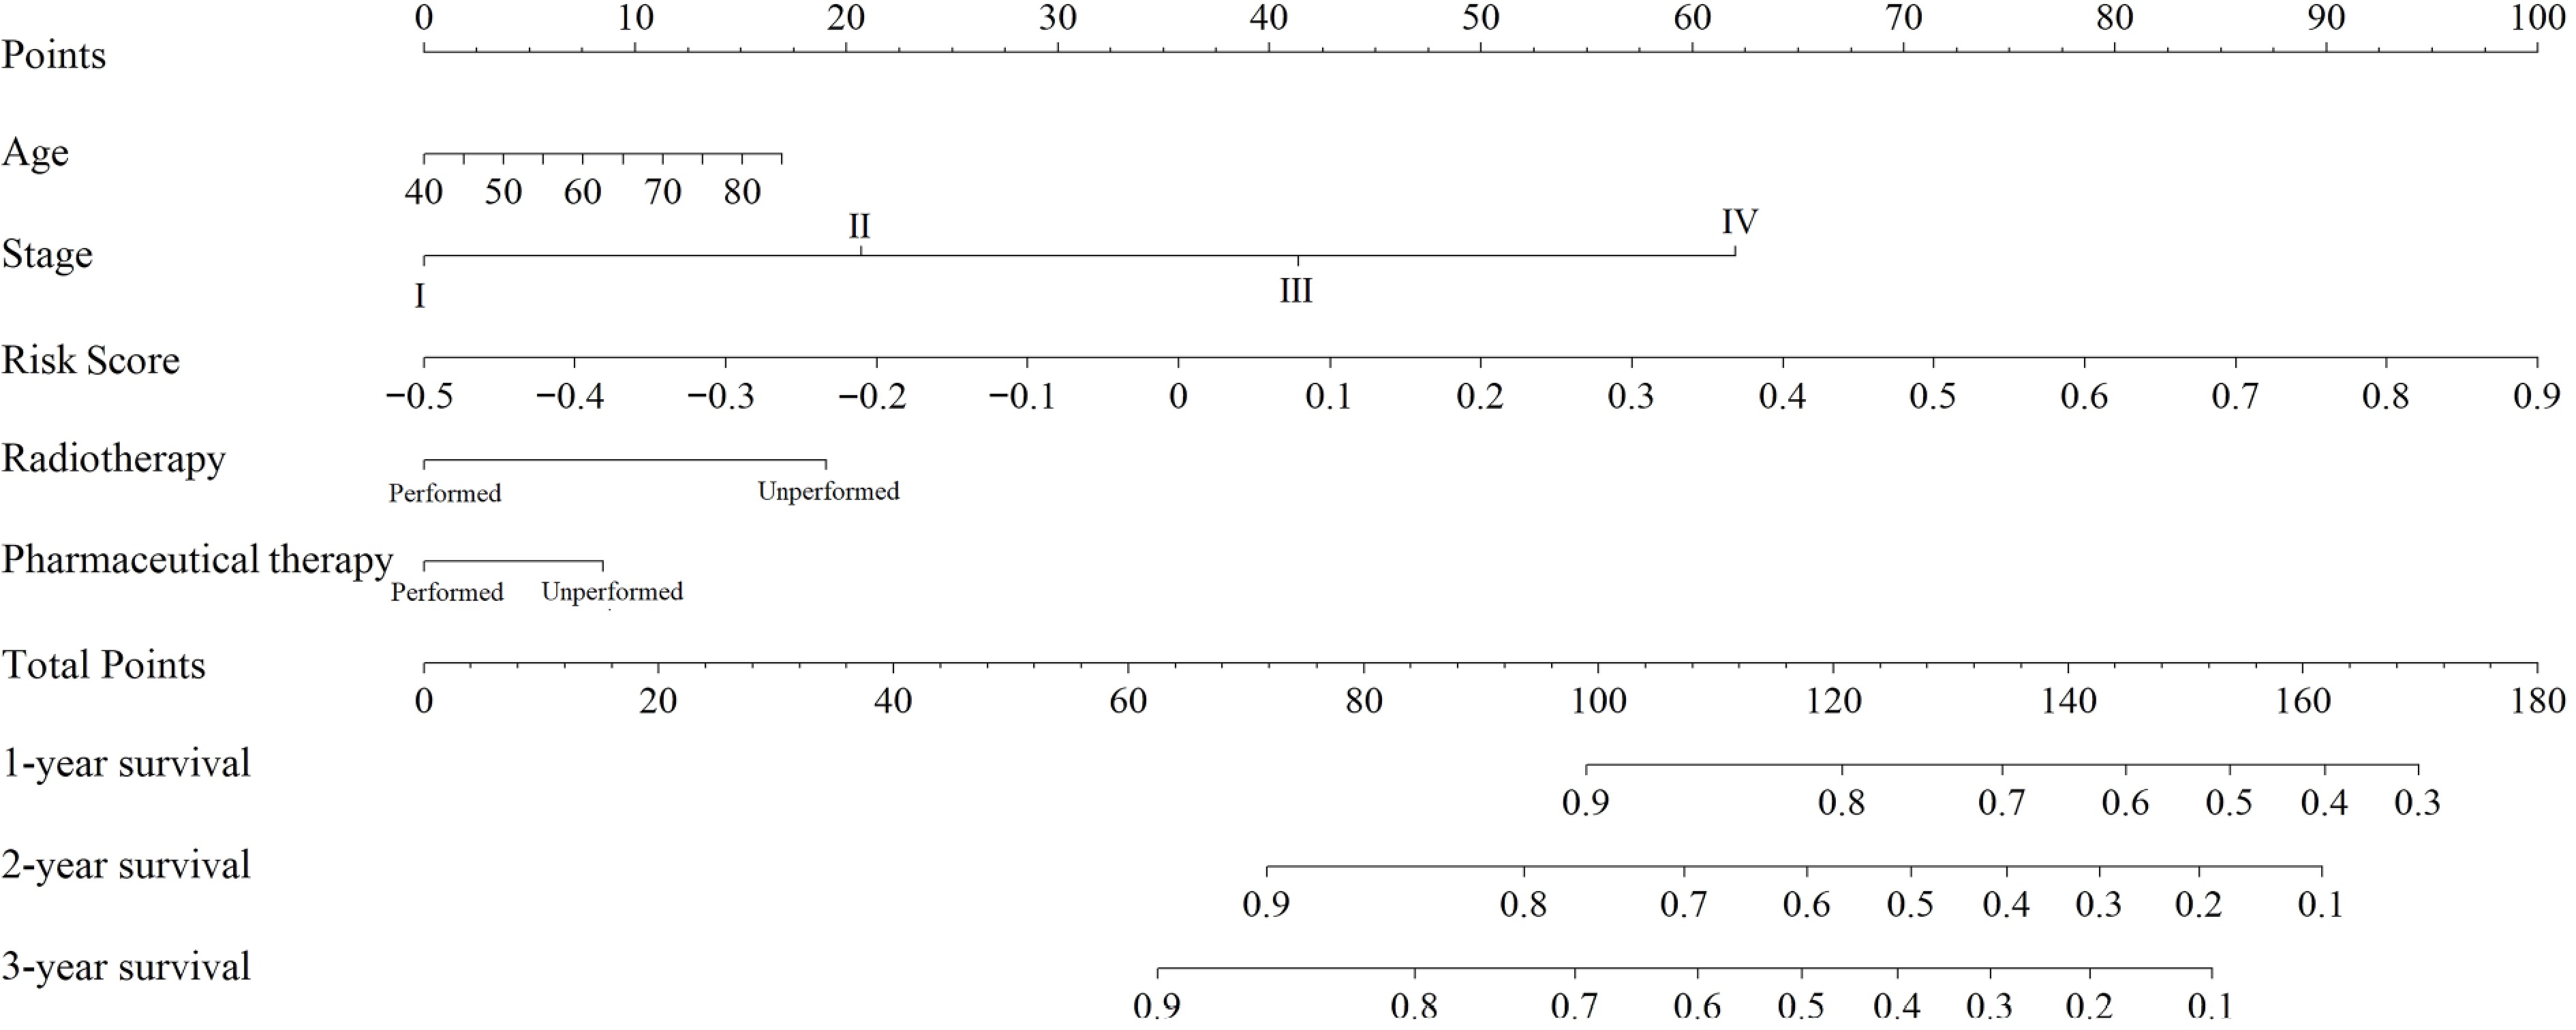
Figure 4.
Nomogram for predicting the survival rate of GC patients.
-
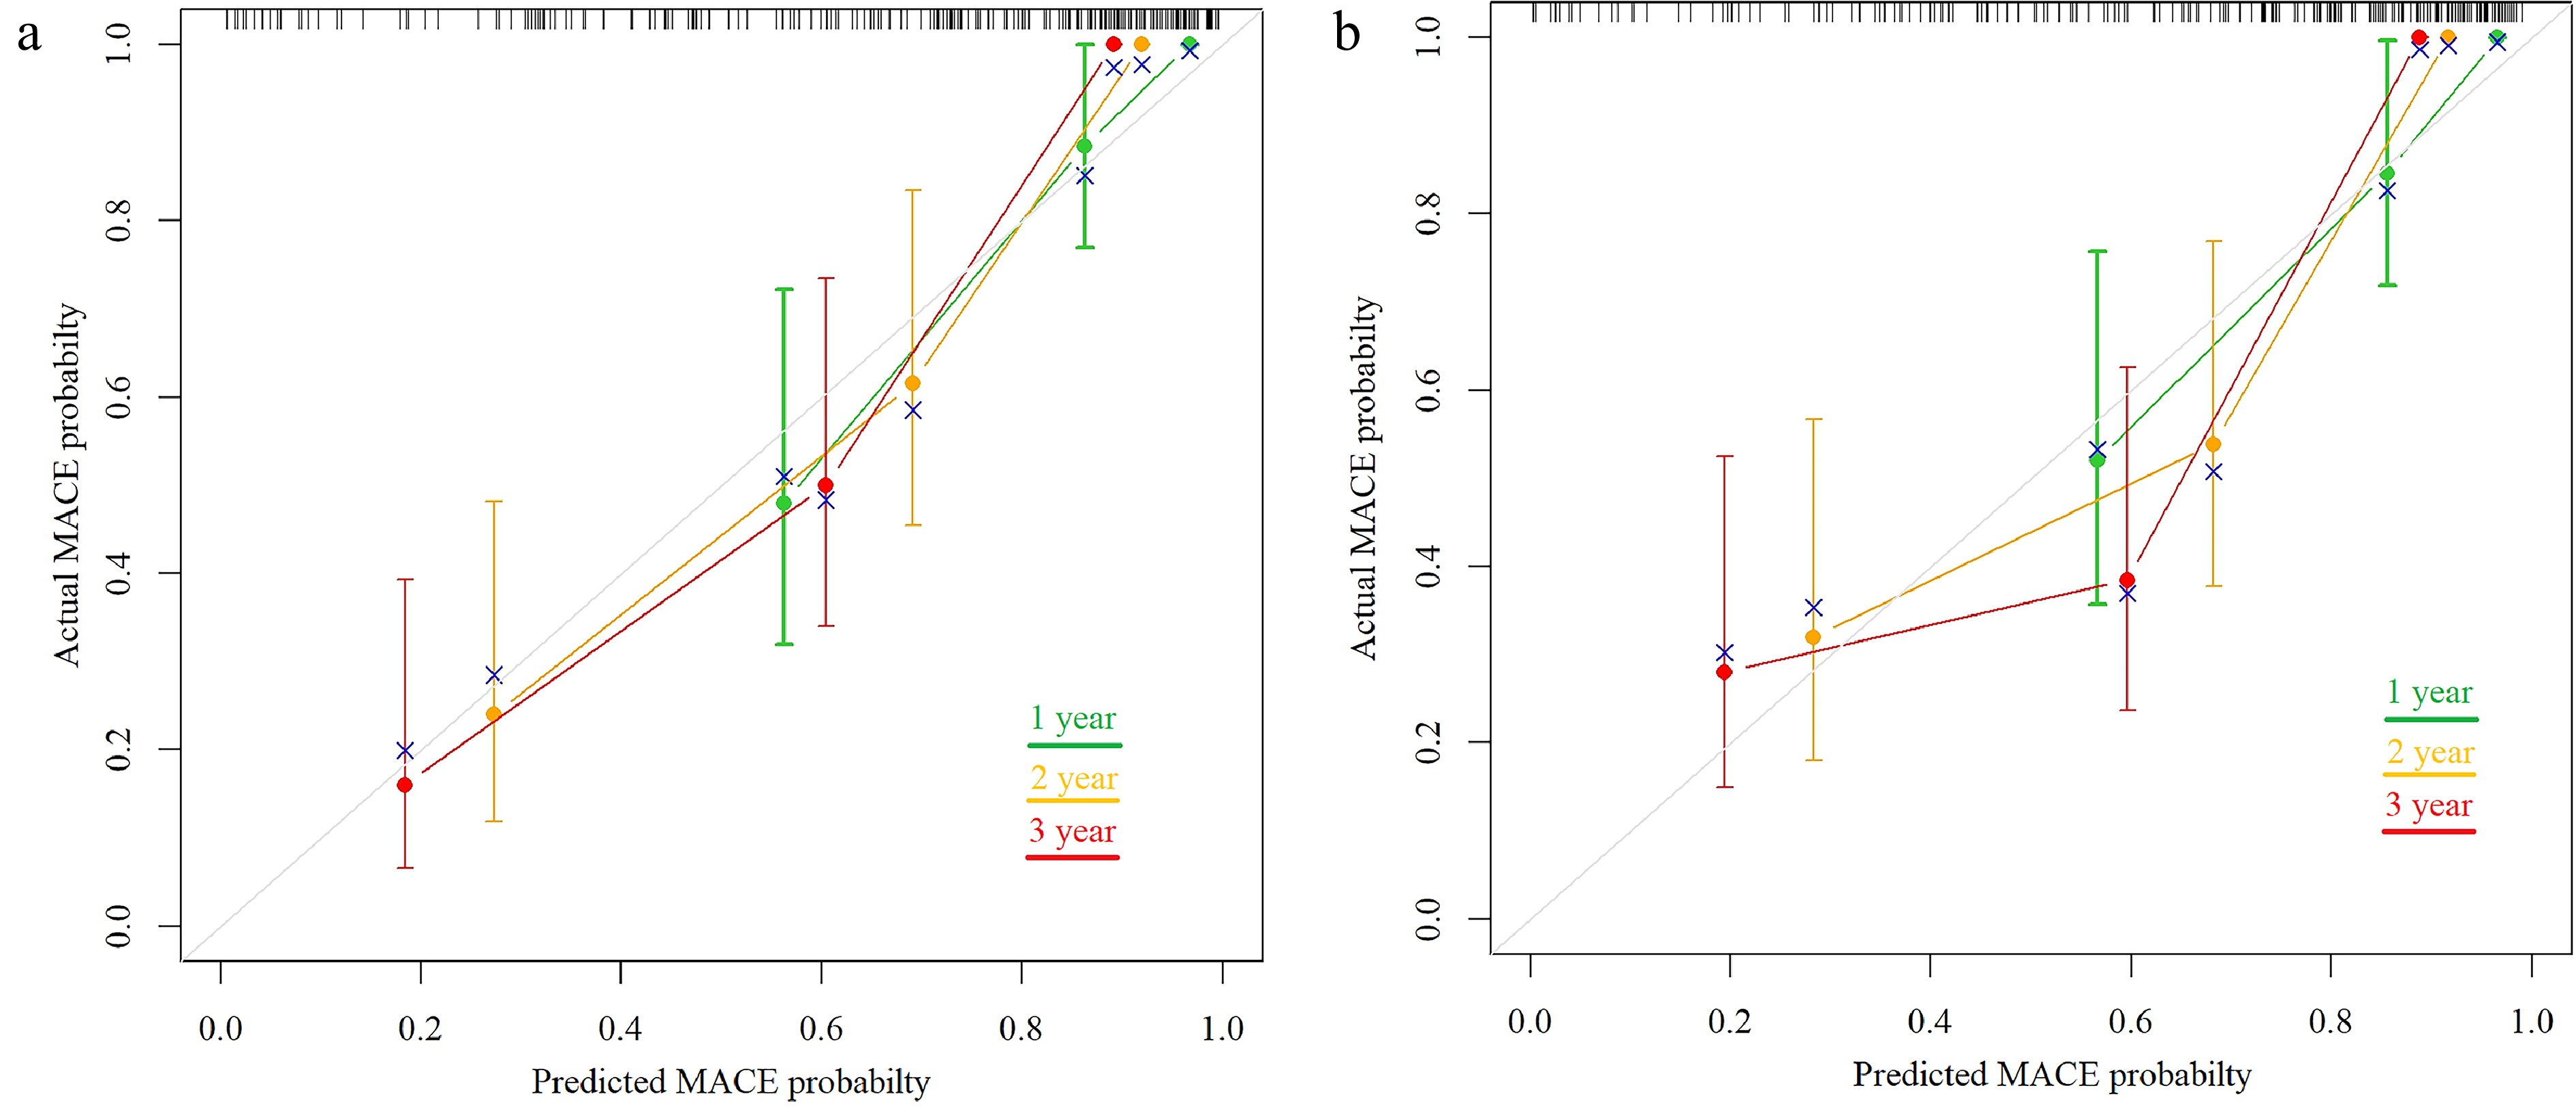
Figure 5.
(a) Calibration plot of the comparison between the predicted and actual survival probability over 1, 2, and 3 years in the training group. (b) Calibration plot of the comparison between predicted and actual survival probability over 1, 2, and 3 years in the validation group.
-
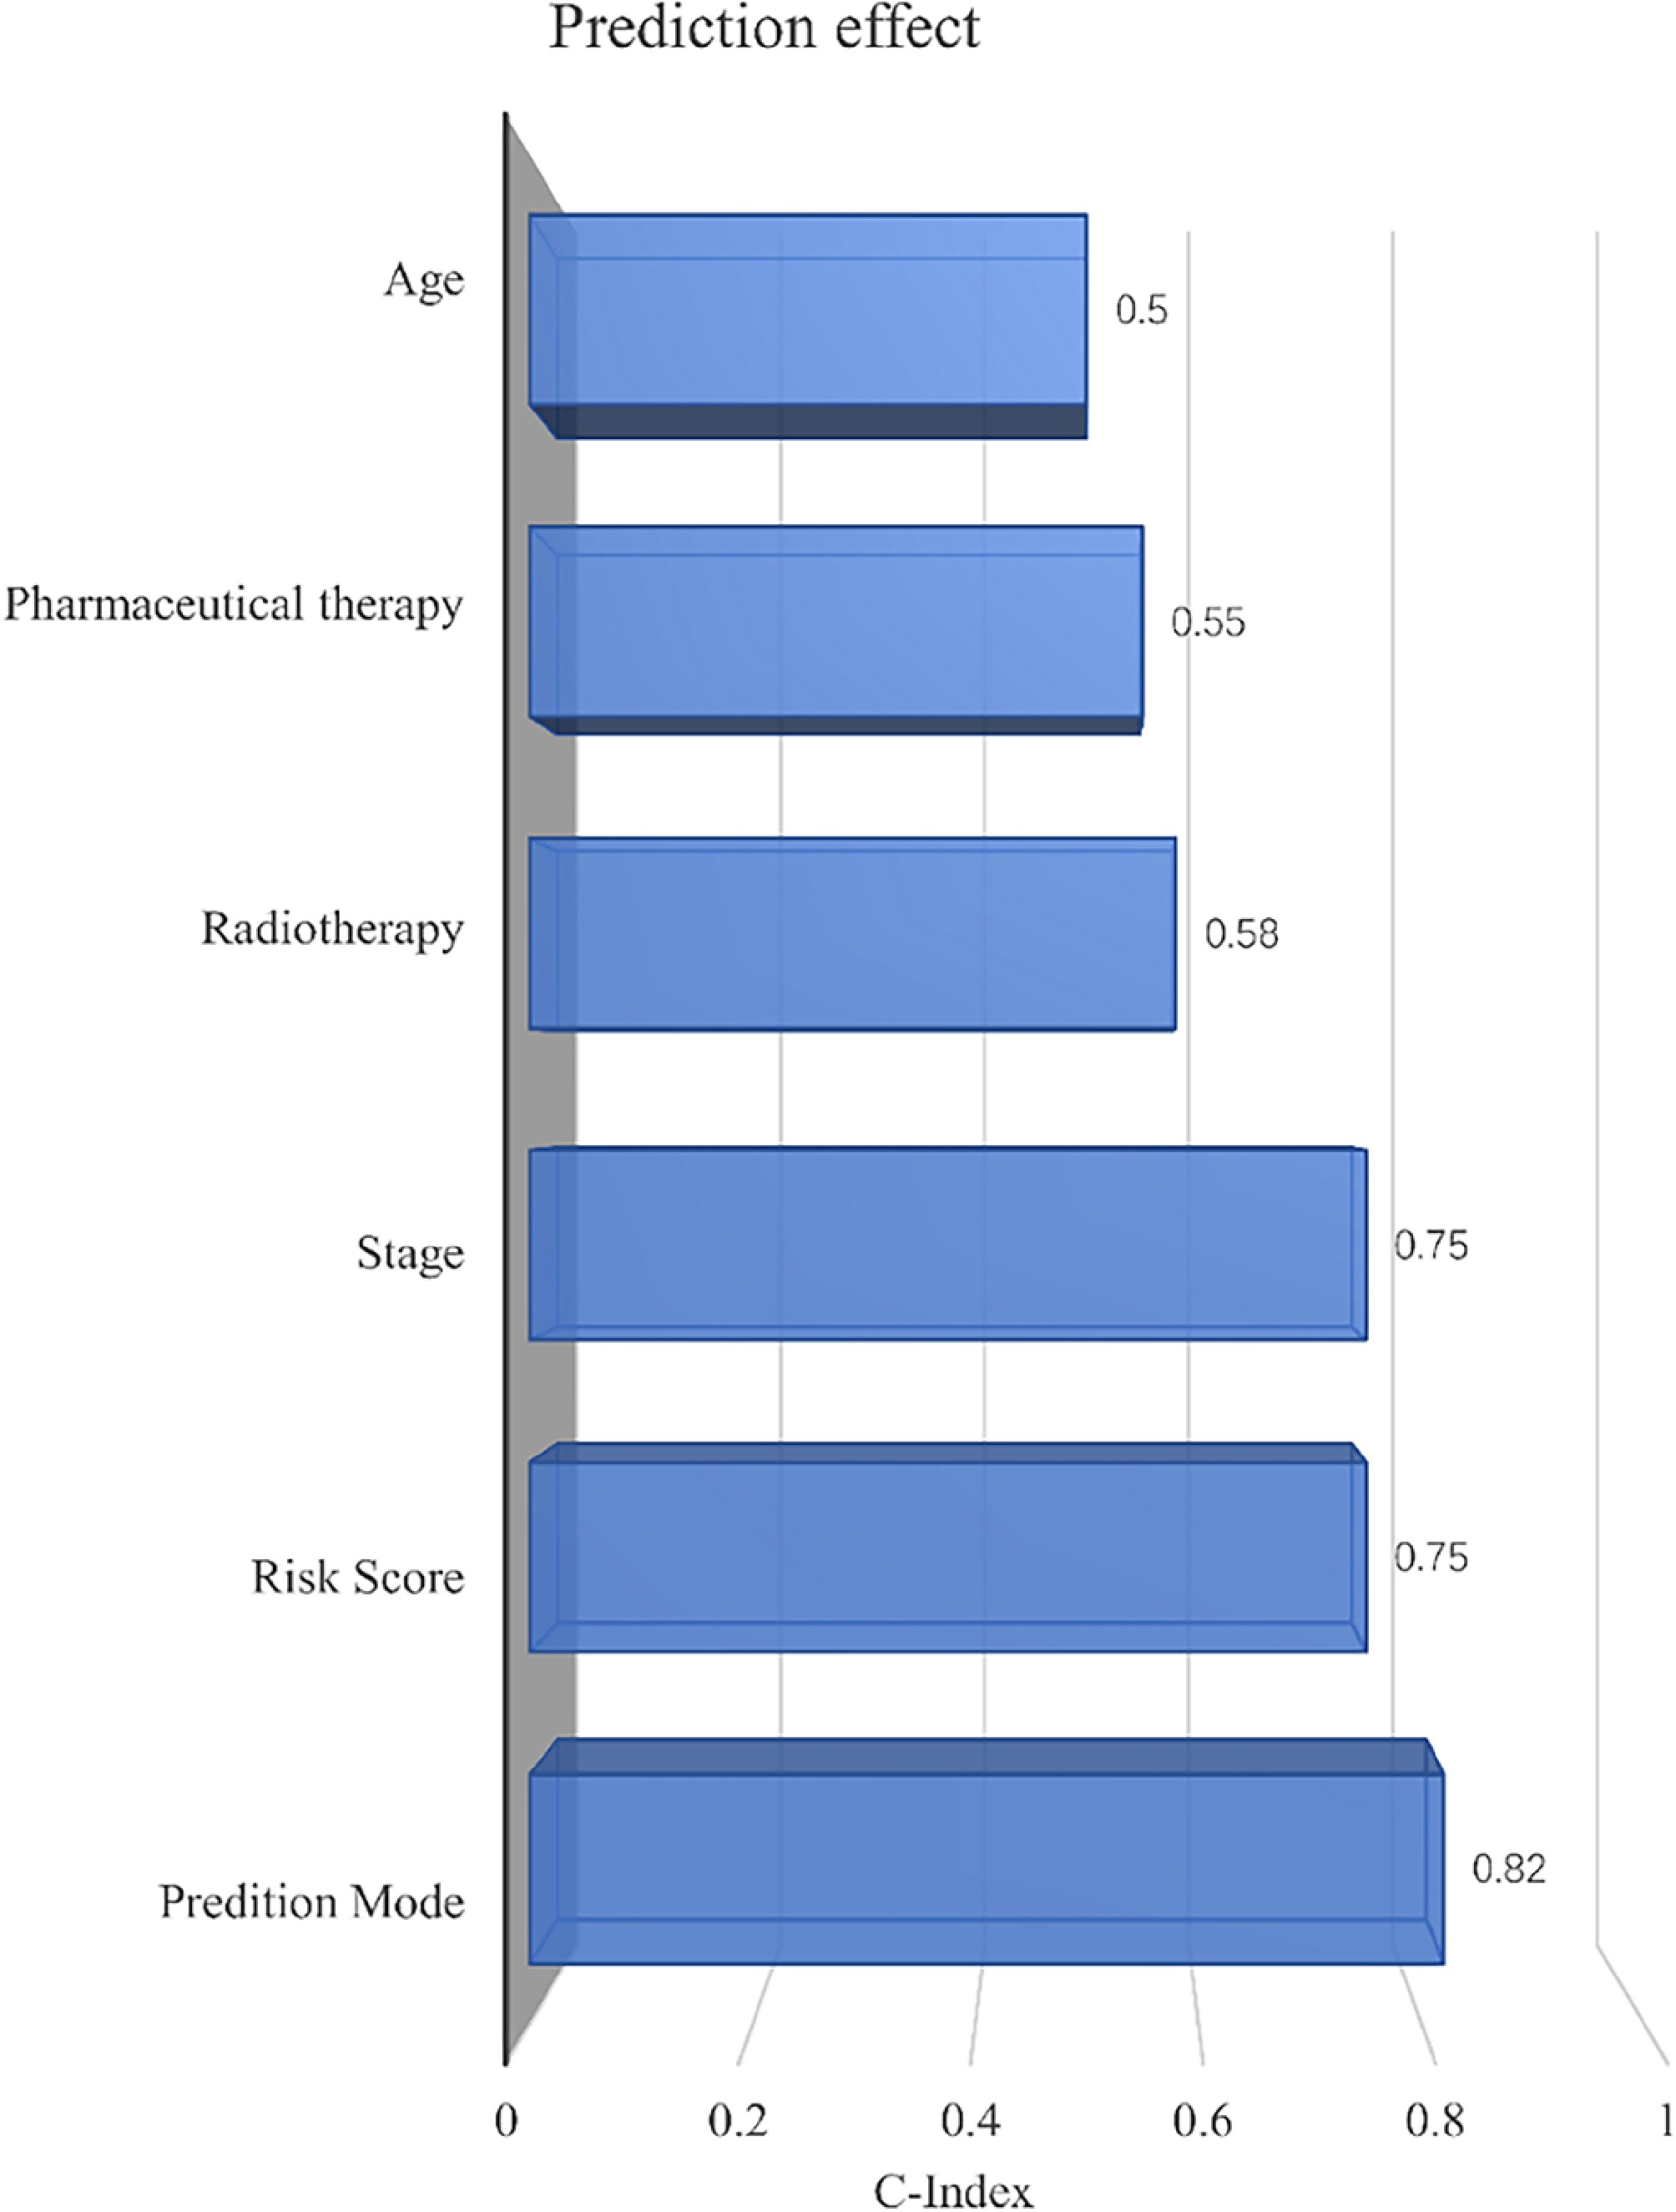
Figure 6.
The predictive effect of the nomogram model, risk score, age, radiotherapy, pharmaceutical therapy, and the tumor's pathological stage in GC patients on OS was evaluated by the C-index.
-
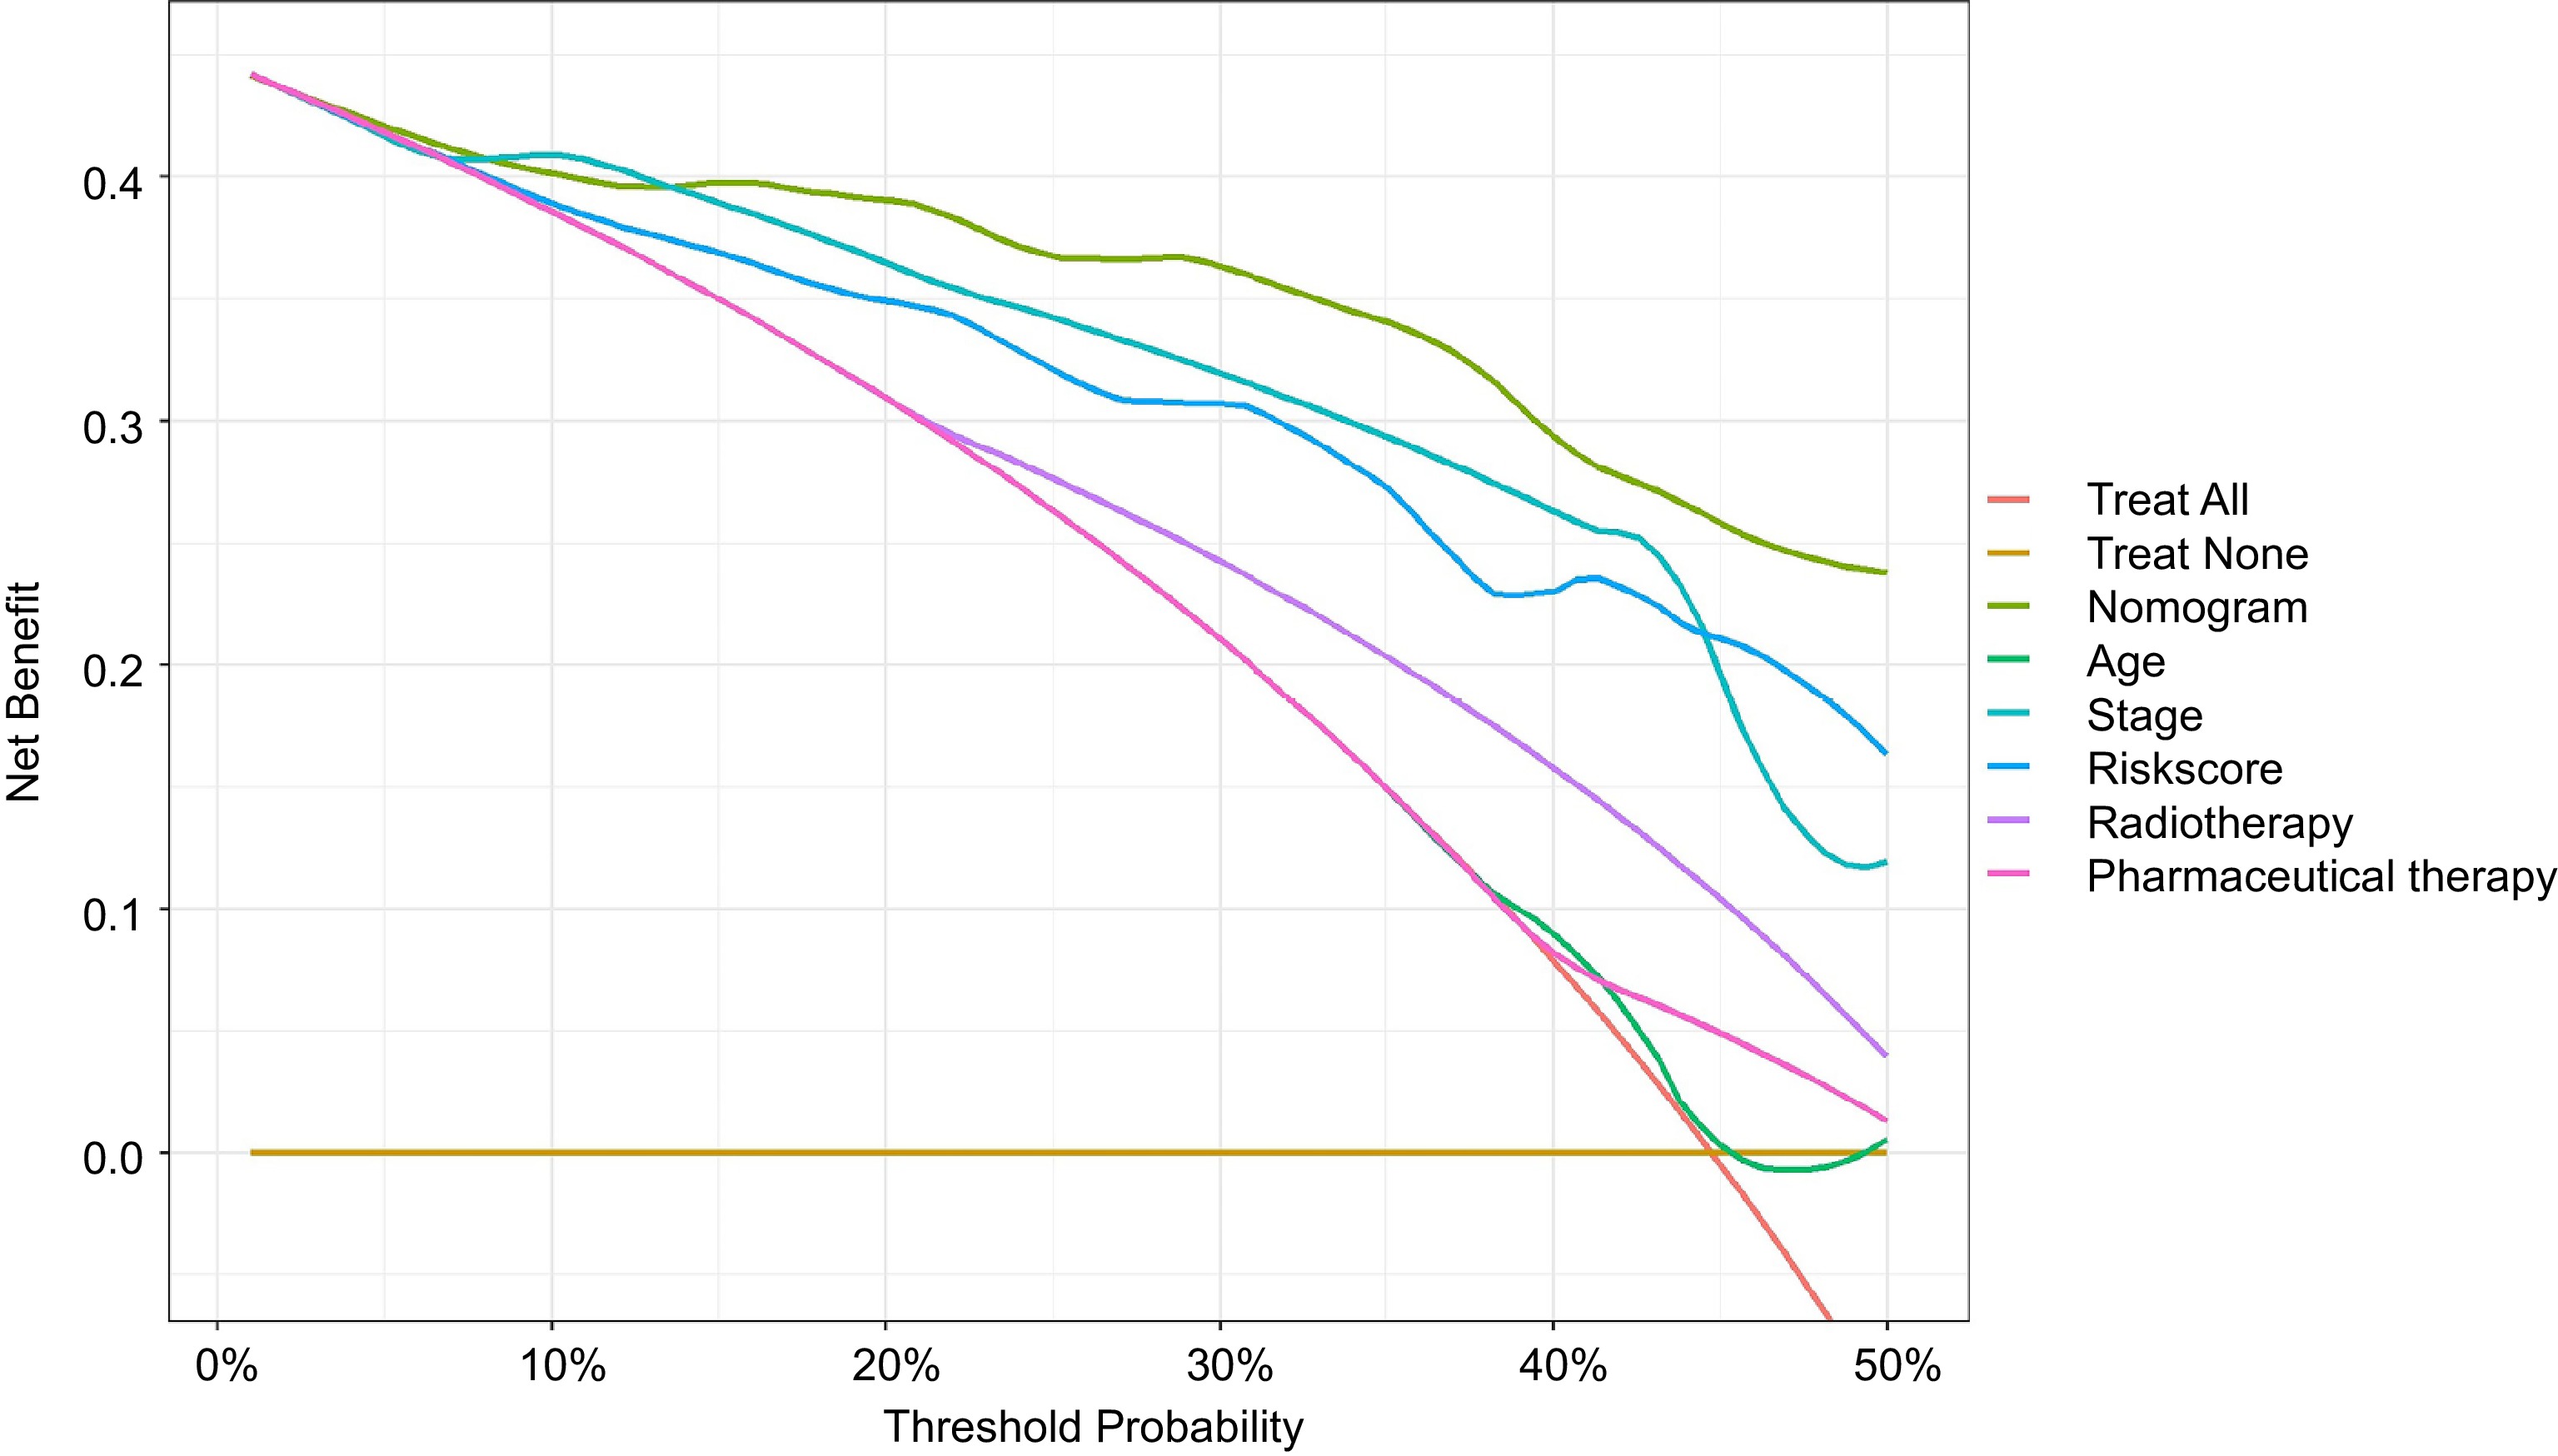
Figure 7.
DCA revealed that patients could gain significant benefits from use of the nomogram in clinical decision-making.
-
Variables Training group
(n = 76)Validation group
(n = 400)p-value Age (years) 67.34 ± 9.46 64.49 ± 11.85 0.05 Time (days) 1,095.00
(431.00, 1,095.00)460.00
(274.75, 782.75)< 0.01 Status Dead 42 (55.26%) 240 (60.00%) 0.44 Alive 34 (44.74%) 160 (40.00%) Gender Female 21 (27.63%) 139 (34.75%) 0.23 Male 55 (72.37%) 261 (65.25%) Stage I 17 (22.37%) 50 (12.50%) < 0.01 II 9 (11.84%) 130 (32.50%) III 27 (35.53%) 181 (45.25%) IV 23 (30.26%) 39 (9.75%) Tumor stage 1 12 (15.79%) 16 (4.00%) < 0.01 2 11 (14.47%) 82 (20.50%) 3 5 (6.58%) 188 (47.00%) 4 48 (63.16%) 114 (28.50%) Metastasis 0 53 (69.74%) 358 (89.50%) < 0.01 1 23 (30.26%) 26 (6.50%) Unknown 0 (0.00%) 16 (4.00%) Spread of cancer to lymph nodes 0 26 (34.21%) 125 (31.25%) < 0.01 1 7 (9.21%) 105 (26.25%) 2 18 (23.68%) 81 (20.25%) 3 25 (32.89%) 84 (21.00%) Unknown 0 (0.00%) 5 (1.25%) Lauren classification Intestinal 42 (55.26%) 83 (56.08%) 0.12 Diffuse 29 (38.16%) 63 (42.57%) Mixed 5 (6.58%) 2 (1.35%) Radiotherapy Not performed 57 (75.00%) 296 (79.36%) 0.40 Performed 19 (25.00%) 77 (20.64%) Pharmaceutical therapy Not performed 31 (40.79%) 188 (50.40%) 0.13 Performed 45 (59.21%) 185 (49.60%) Table 1.
Baseline characteristics of GC patients in the training and validation groups
Figures
(7)
Tables
(1)