-
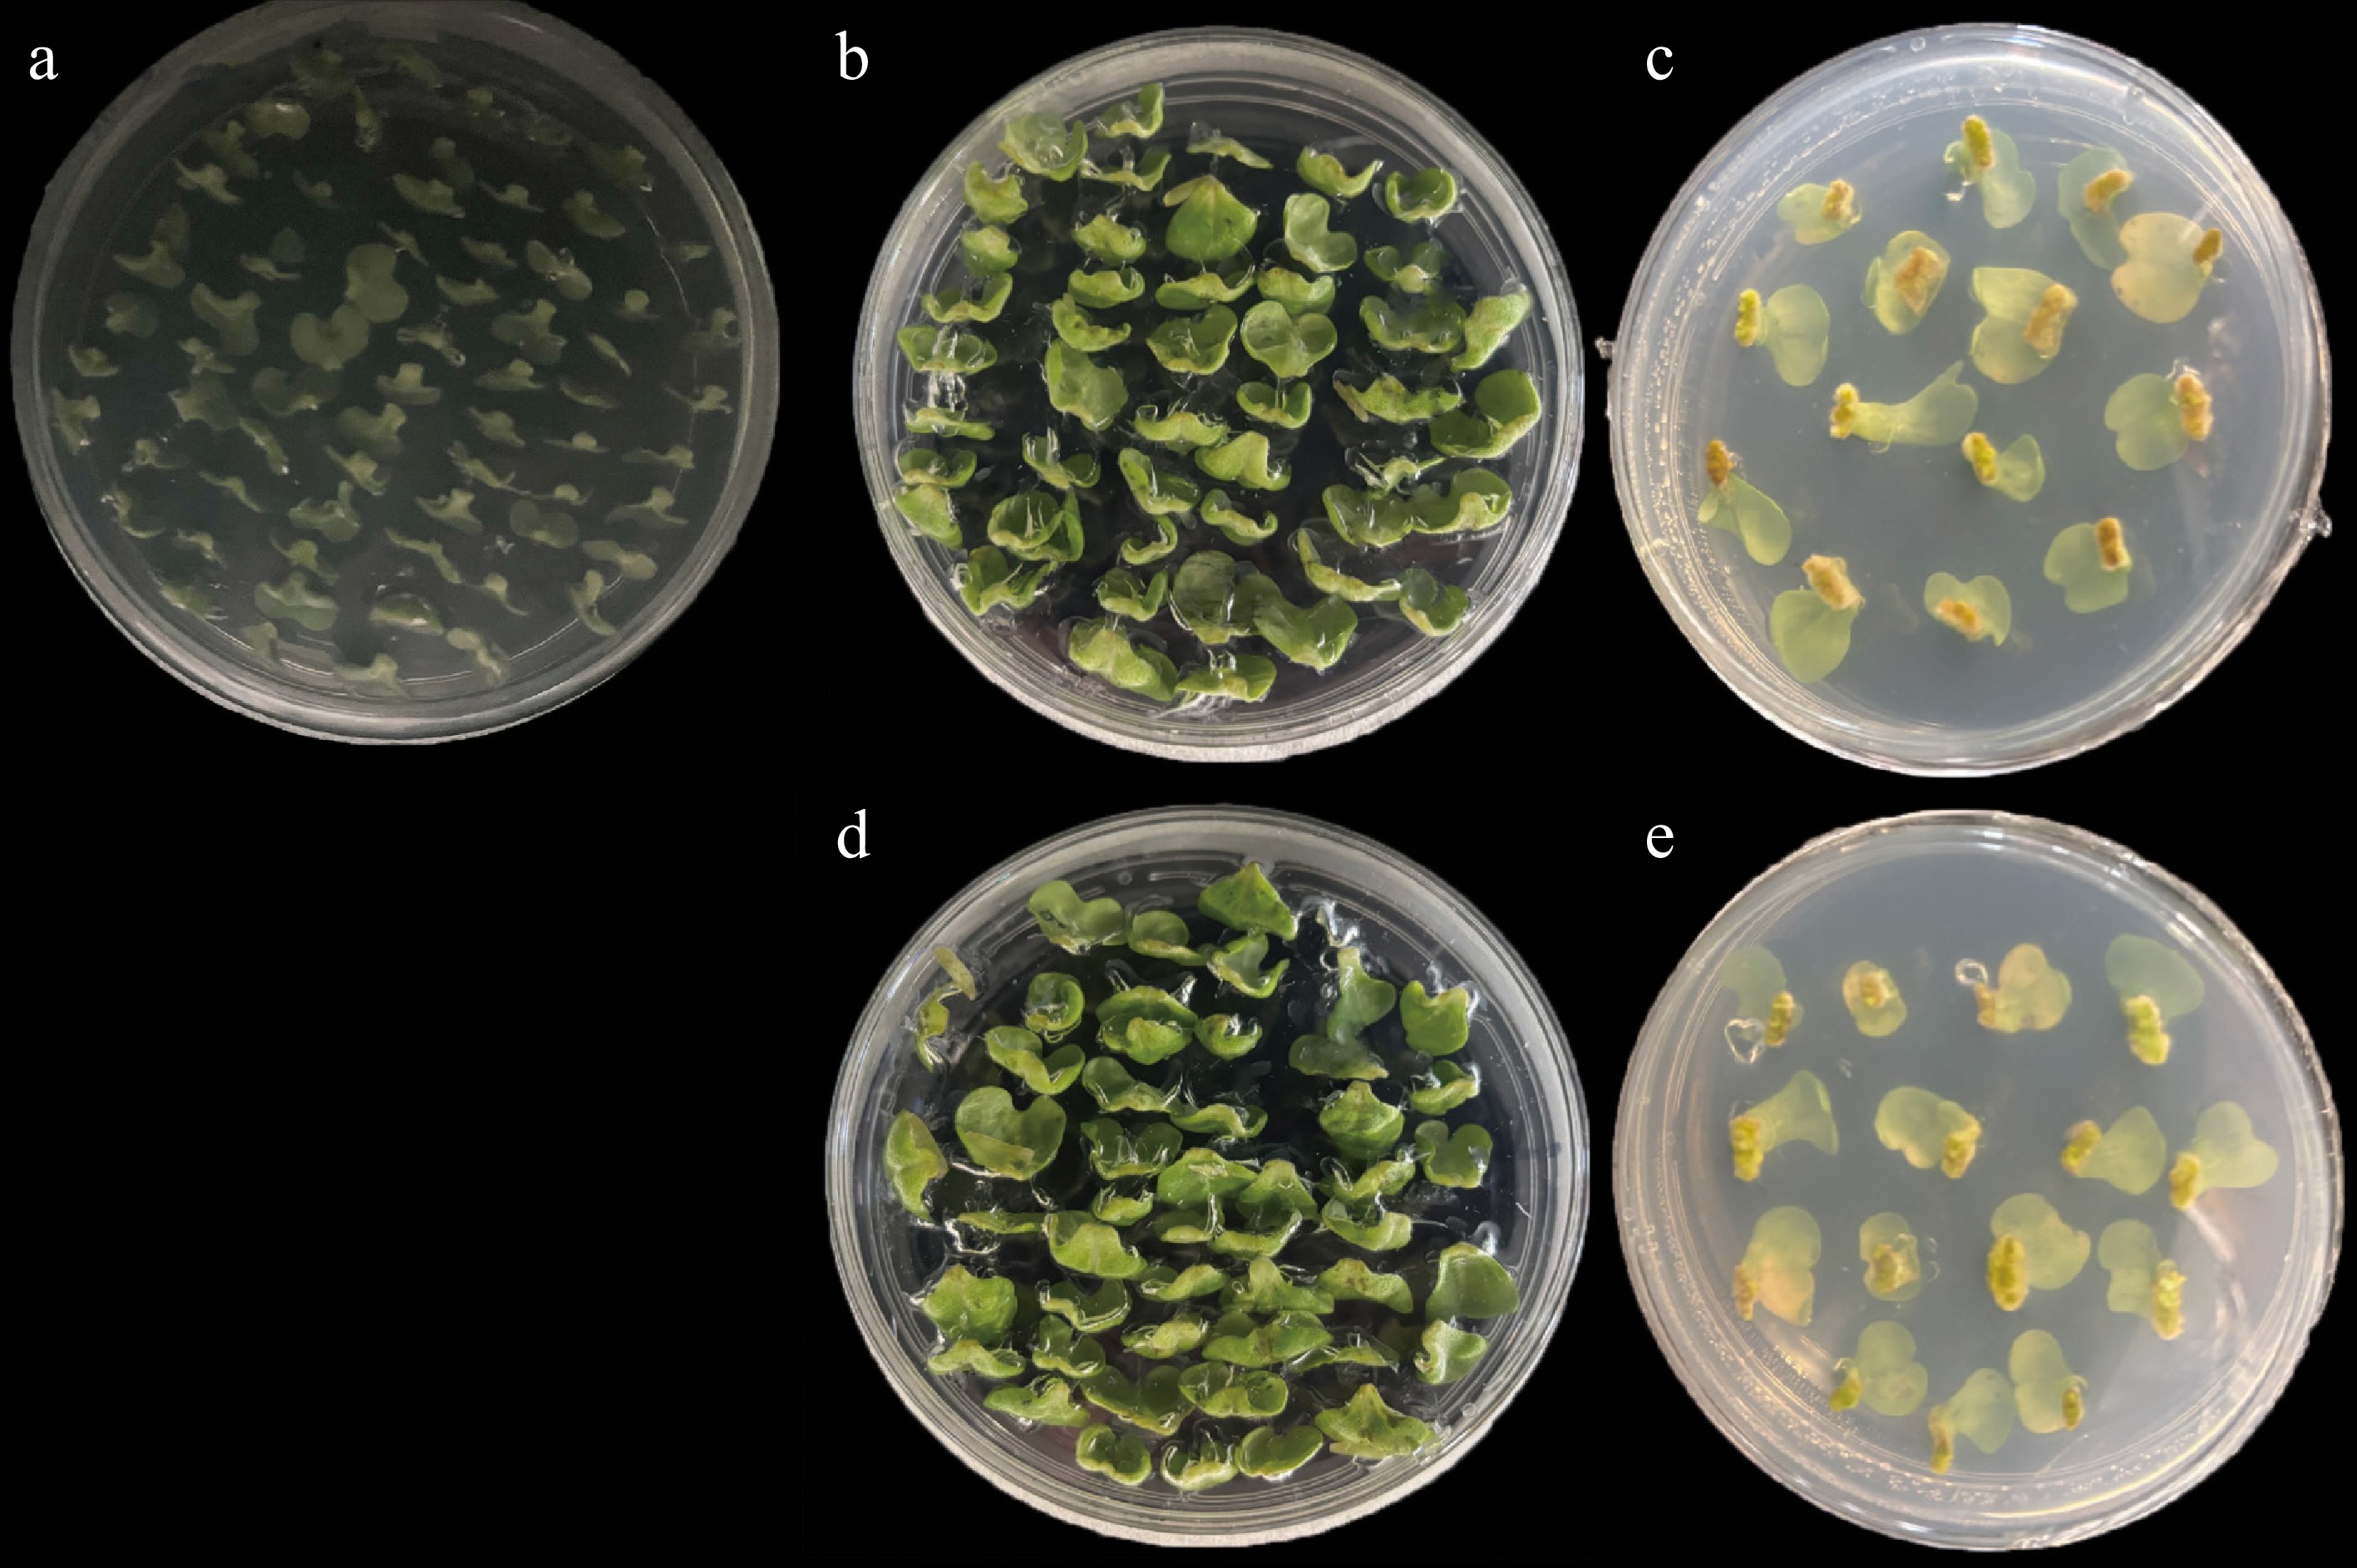
Figure 1.
Morphological changes of explants during Agrobacterium-mediated genetic transformation in non-heading Chinese cabbage. (a) CK_S1: Subpetioles of 4-day-old seedlings precultured on the preculture medium for 2 d. (b), (c) CK_S2 and CDF1_S2: Uninfected and infected subpetioles after co-culture on the co-culture medium for 3 d in the dark. (d), (e) CK_S3 and CDF1_S3: Uninfected and infected explants cultured on the callus induction medium supplemented with 250 mg/L carbenicillin disodium (Carb) and 250 mg/L timentin (TMT) for 6 d.
-
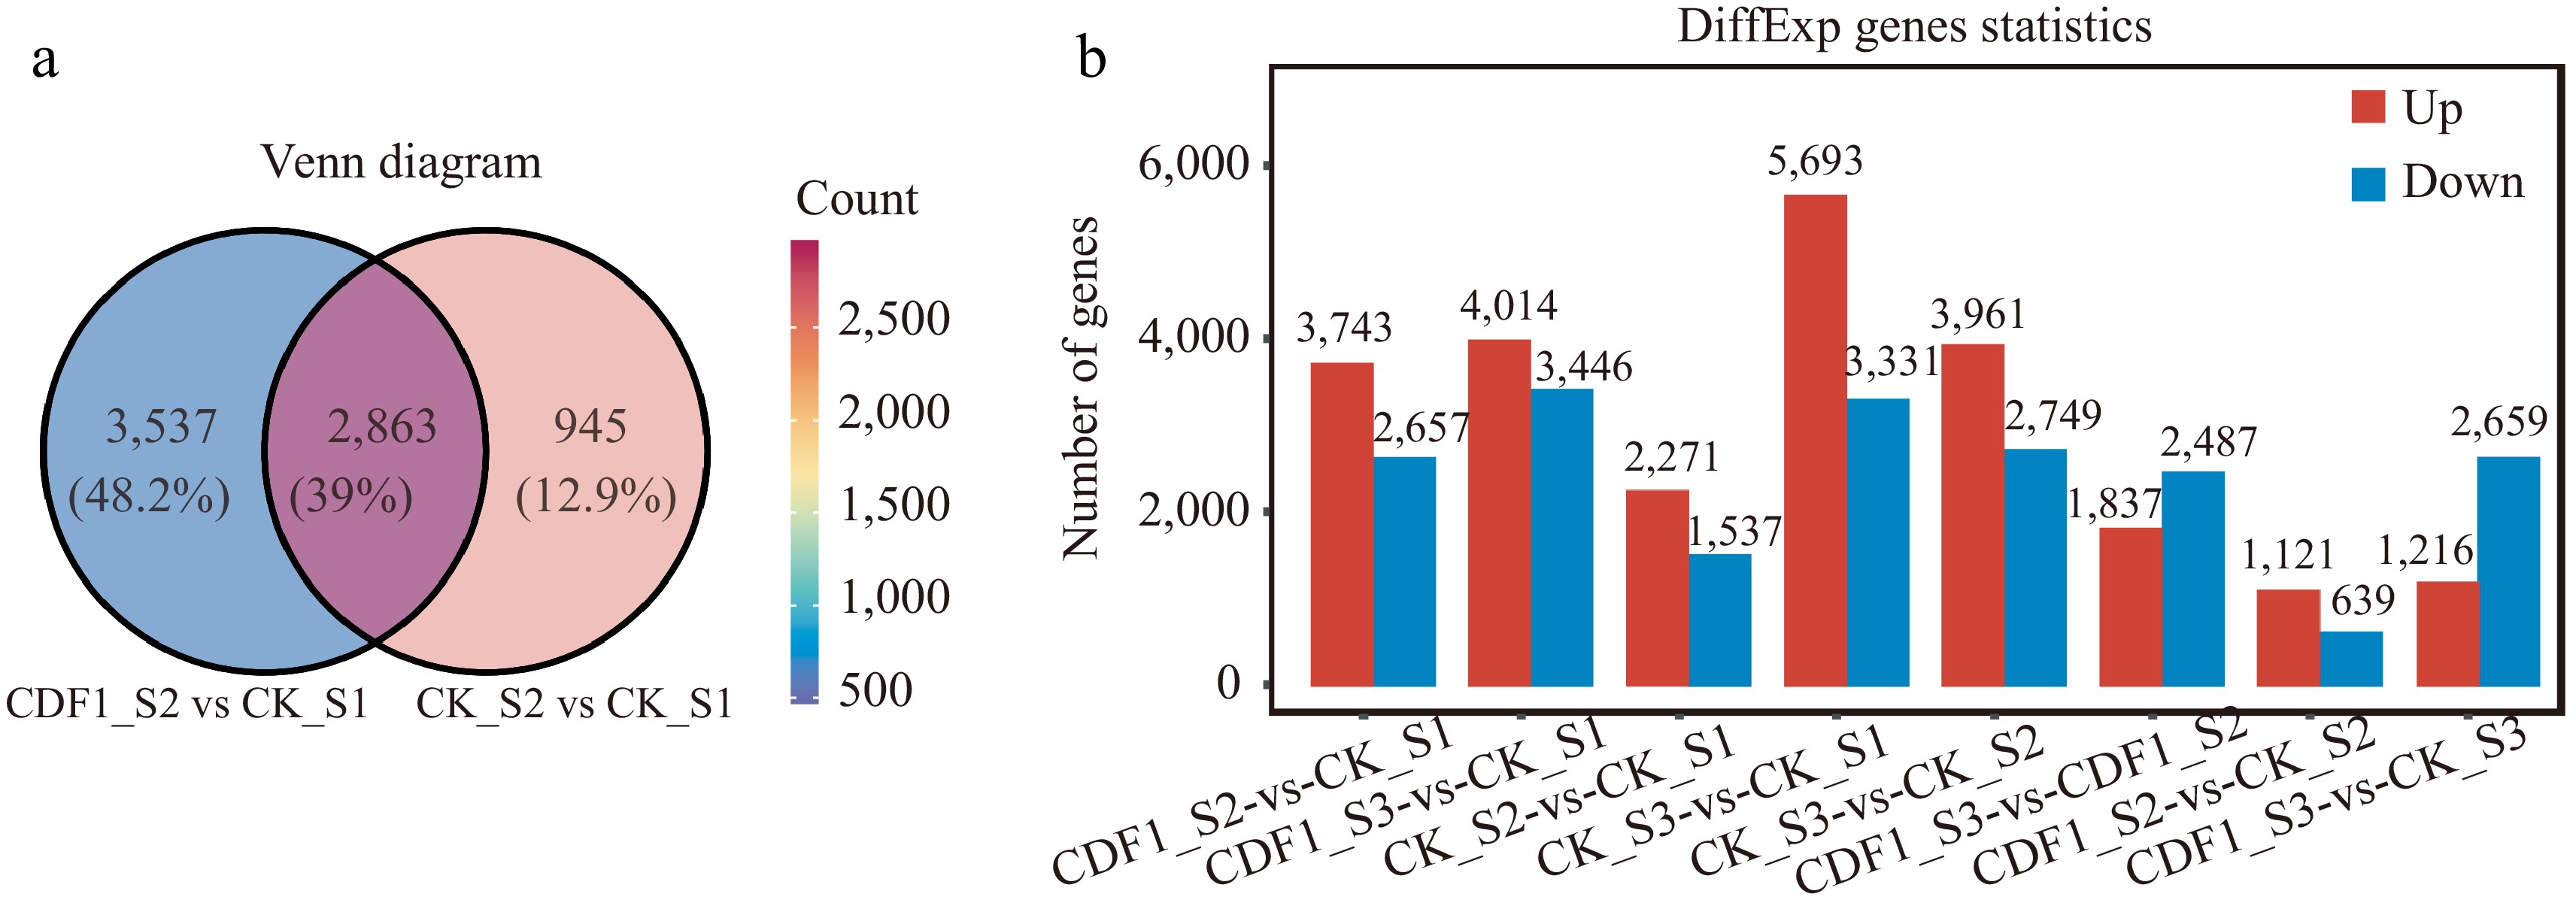
Figure 2.
Analysis of differentially expressed genes (DEGs) across diverse samples in non-heading Chinese cabbage. (a) Venn diagram comparing CK_S2/CK_S1 and CDF1_S2/CK_S1. (b) Statistical data on the number of upregulated and downregulated genes in each comparison group. Red indicates upregulated DEGs, and blue indicates downregulated DEGs.
-
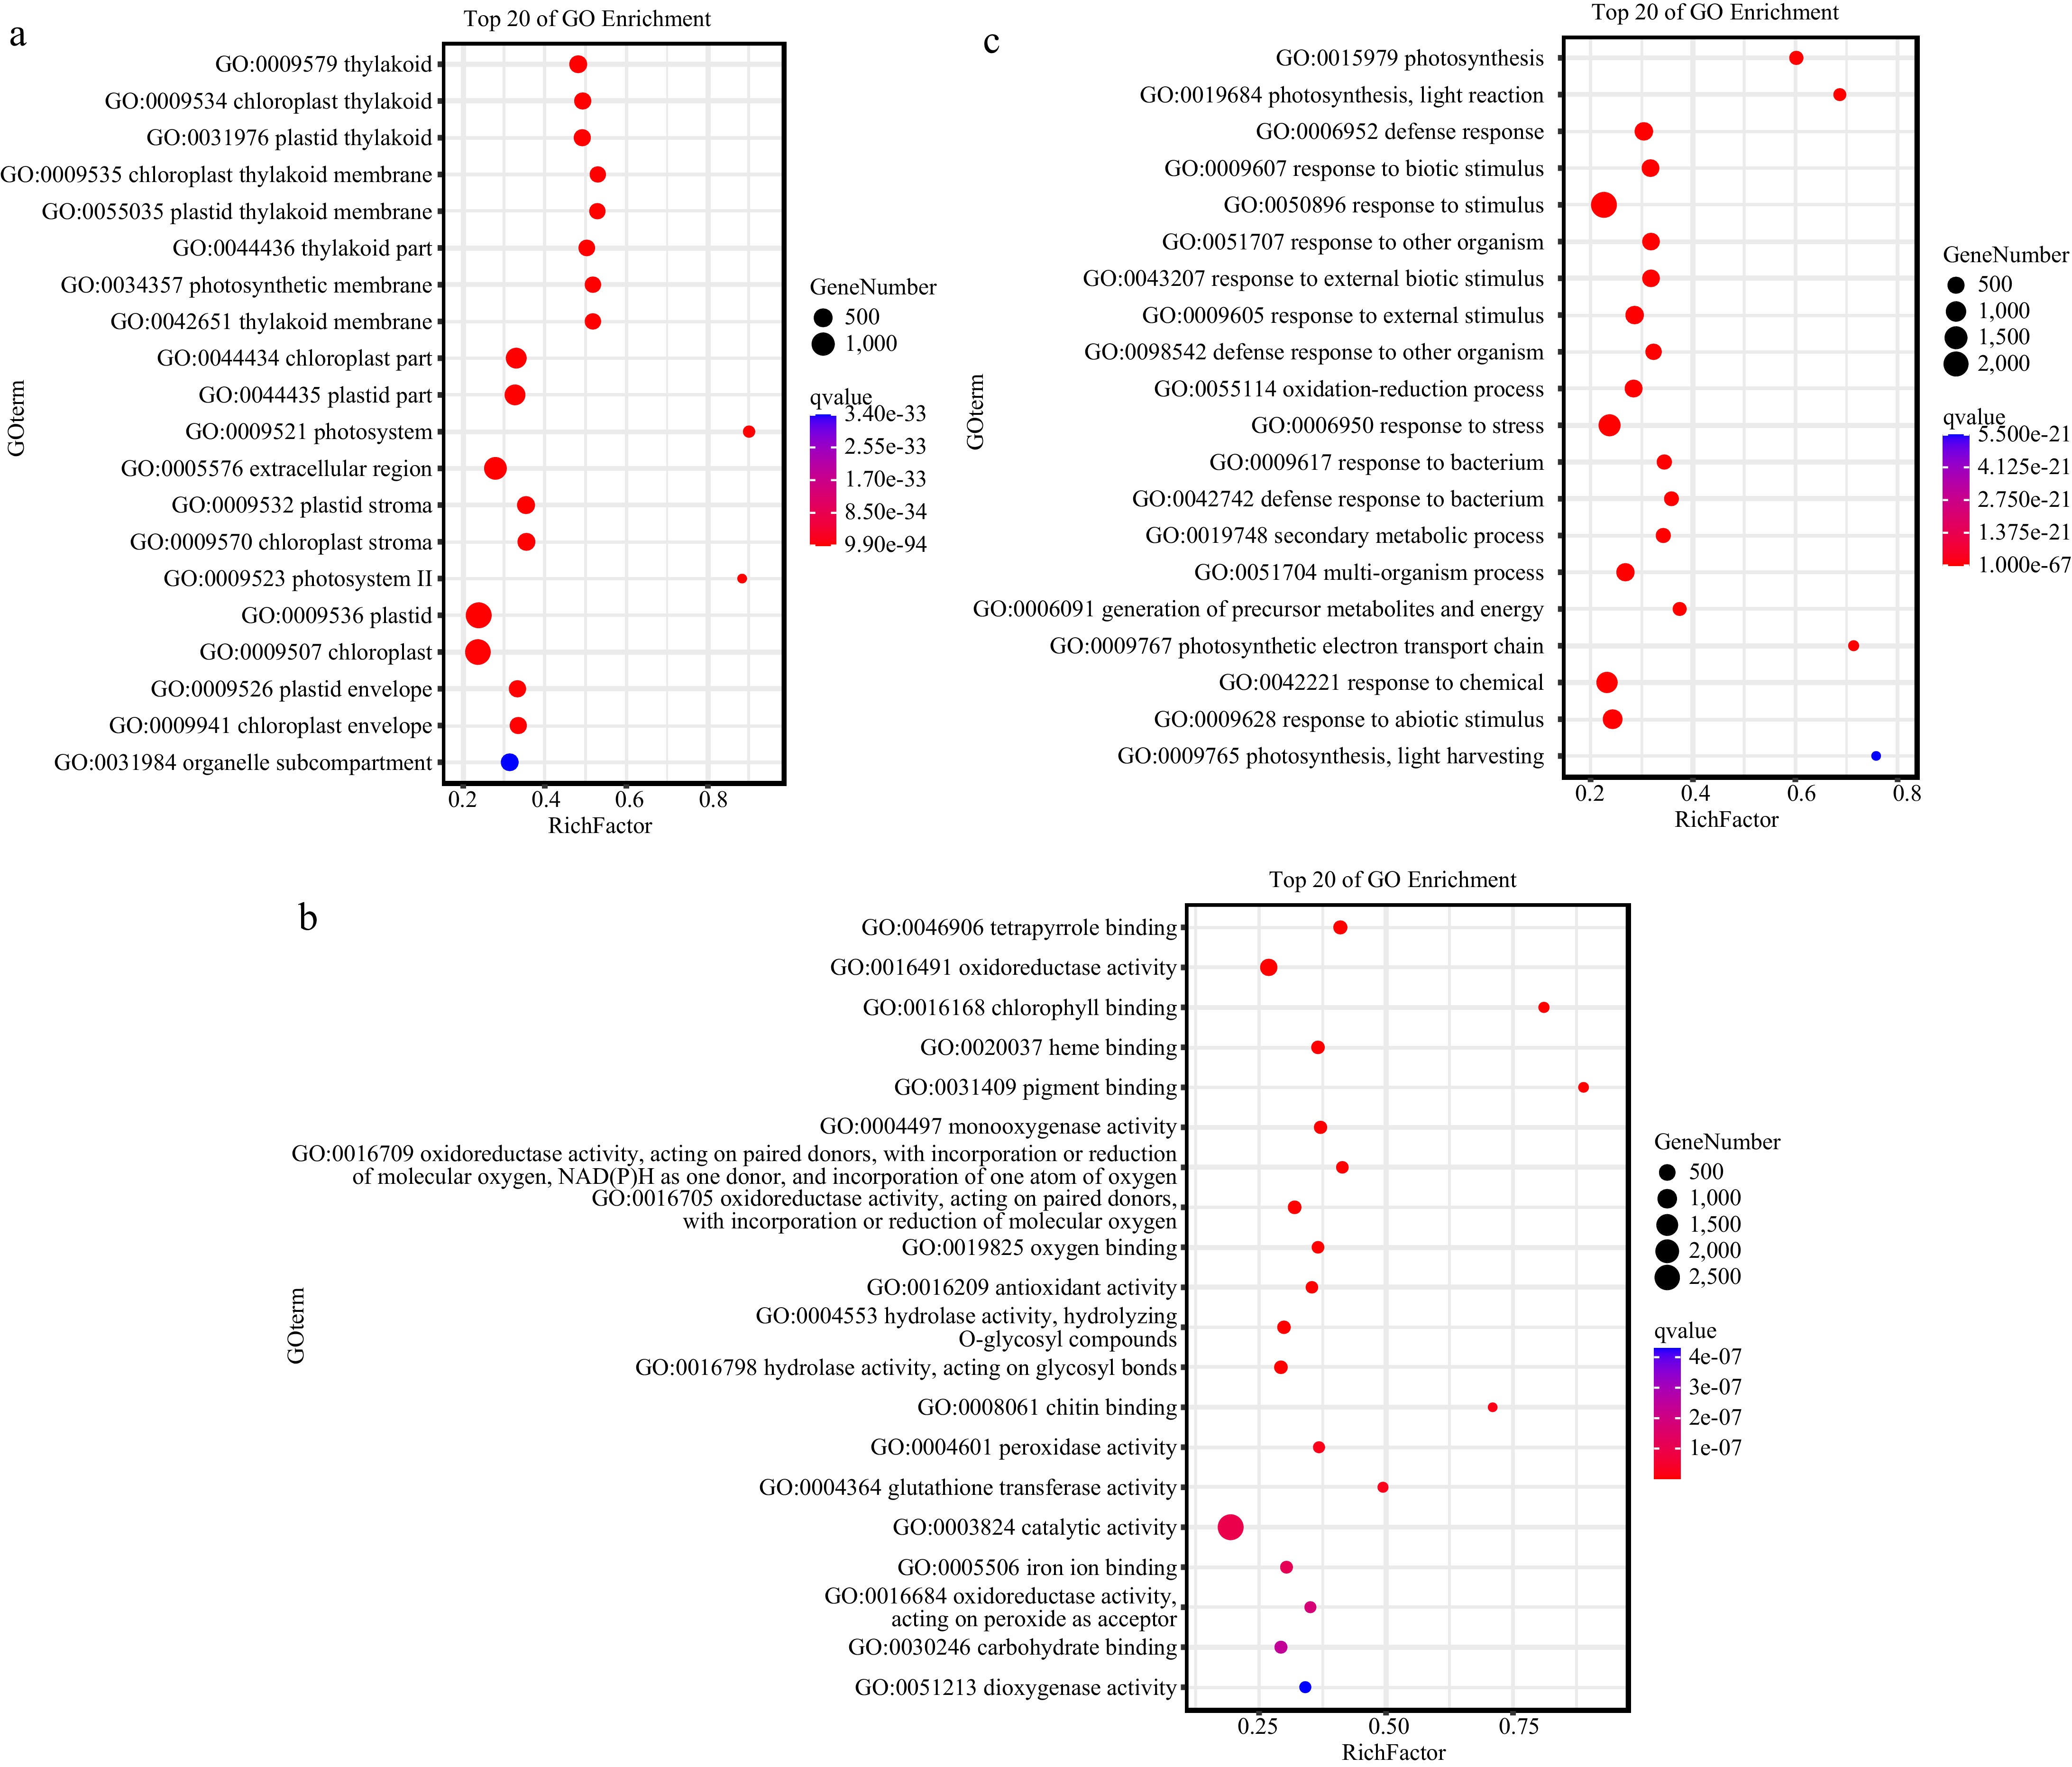
Figure 3.
Gene Ontology (GO) functional analysis of the differentially expressed genes (DEGs) in the cotyledon stalk of the CDF1_S2/CK_S1 set, which was performed using Omicshare online software.
-
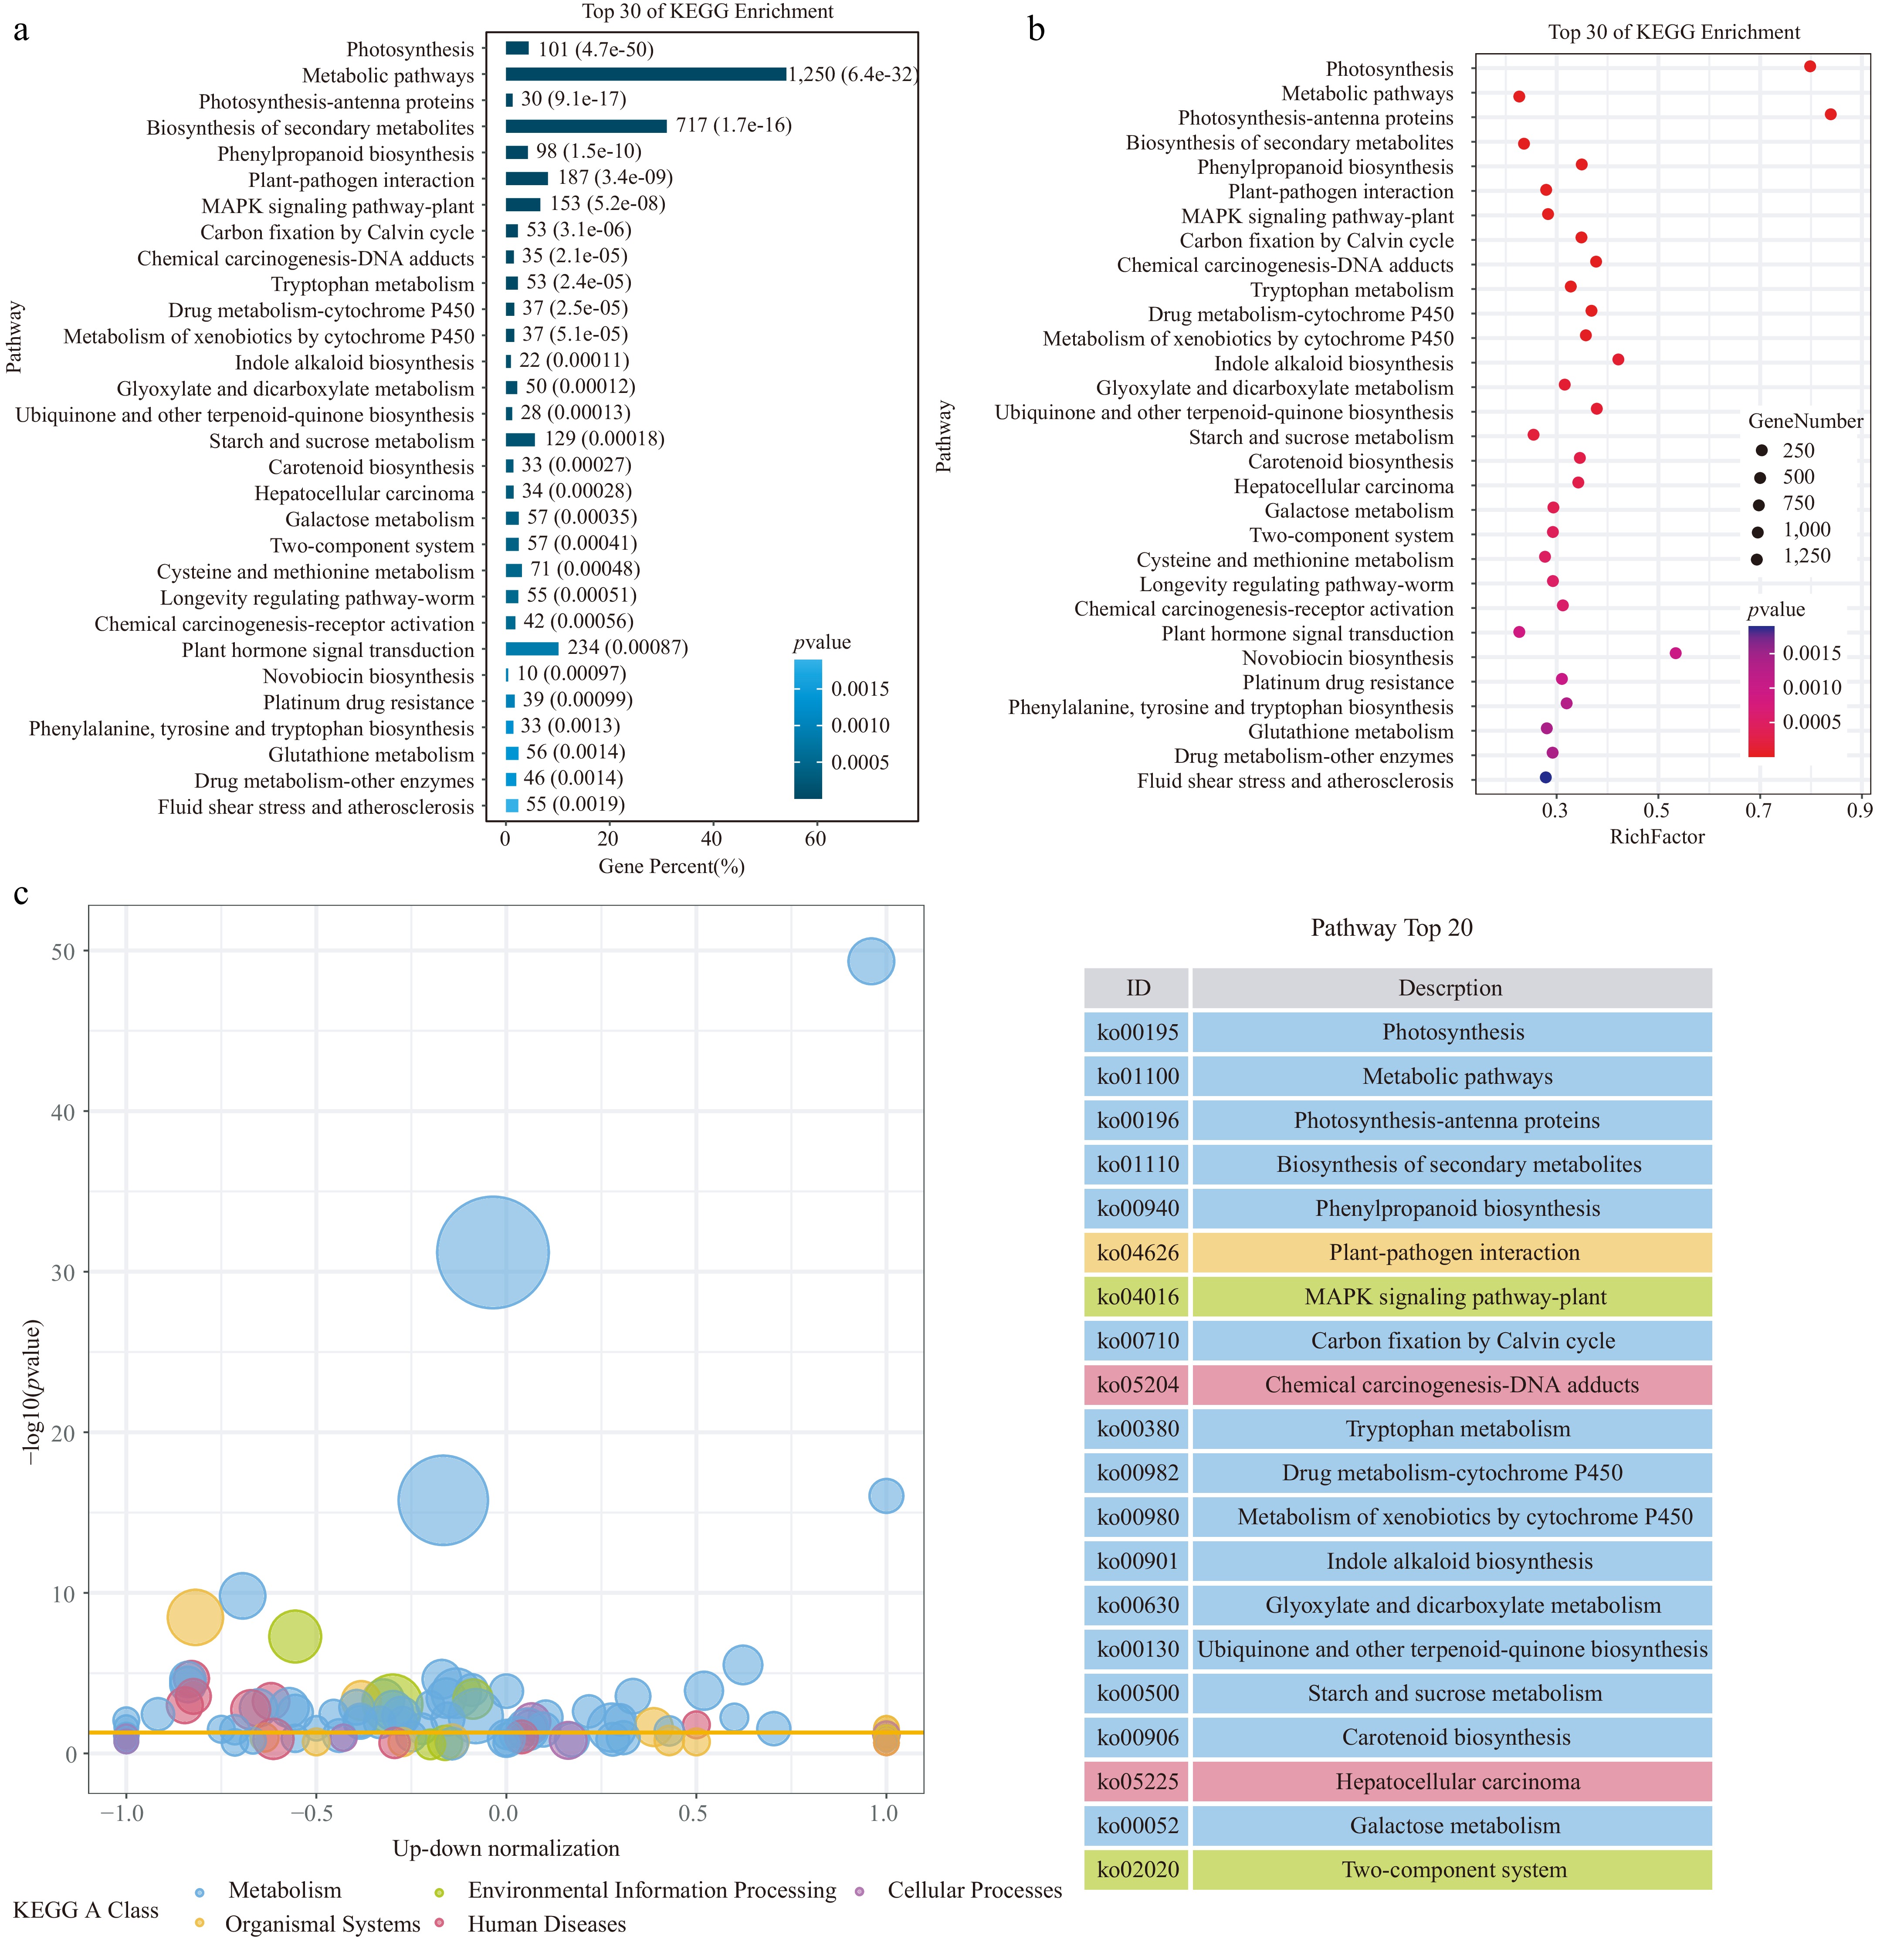
Figure 4.
Kyoto Encyclopedia of Genes and Genomes (KEGG) analysis of the DEGs in the cotyledon stalks of the CDF1_S2/CK_S1 set. (a) Top 30 KEGG enrichment pathways. (b) Summary of the KEGG pathways. (c) Bubble plot of KEGG enrichment analysis. Different colors represent different KEGG A-class categories.
-
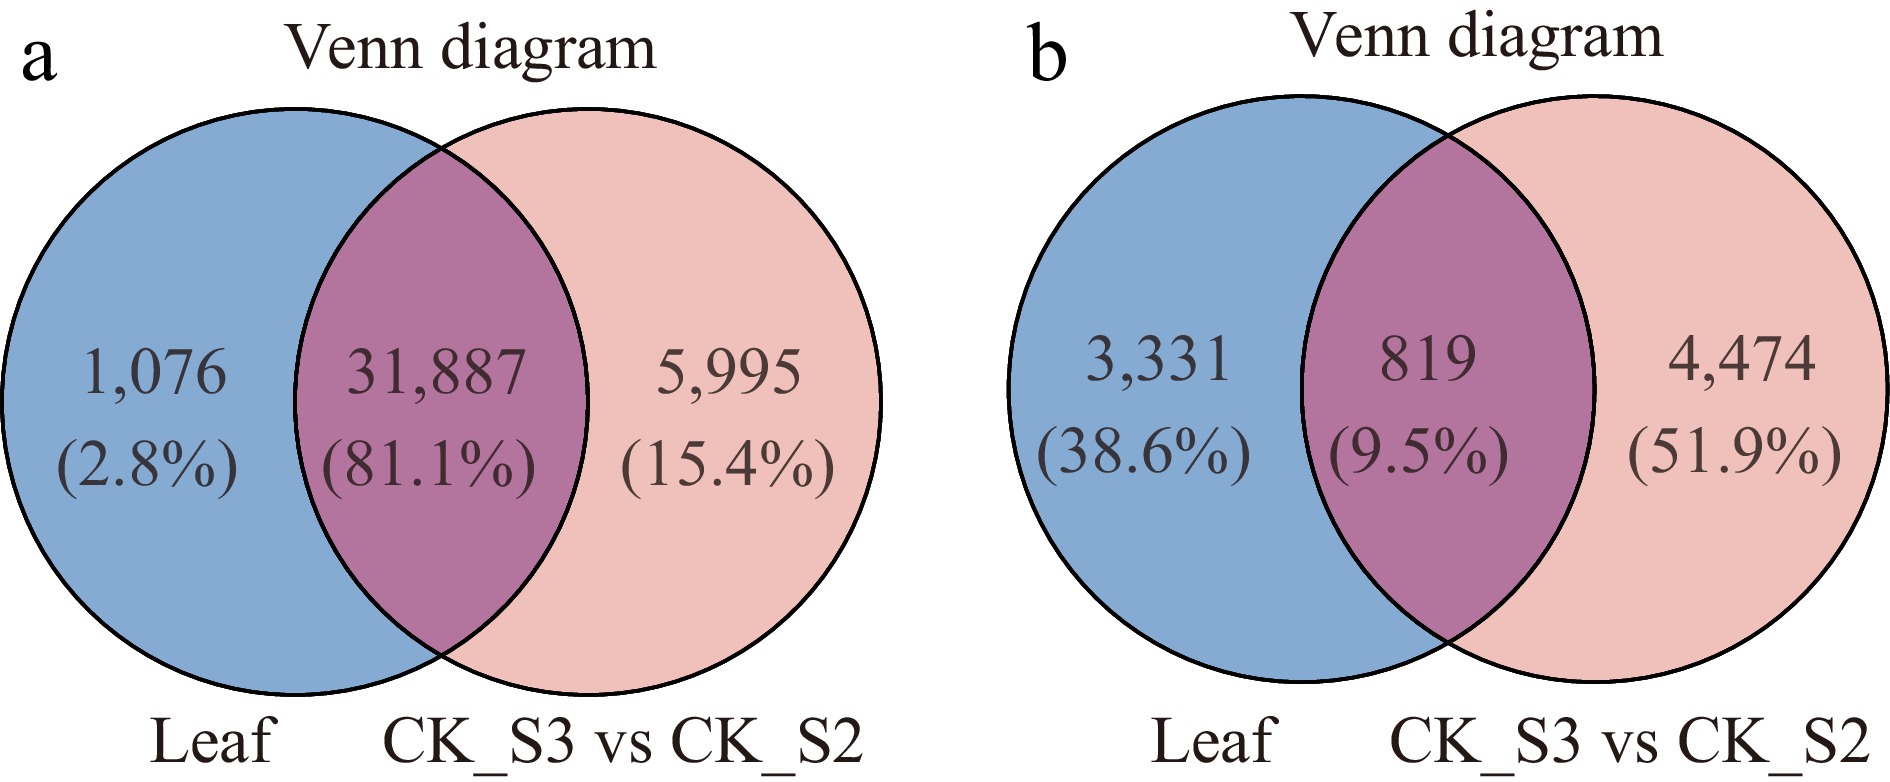
Figure 5.
Venn diagram analysis of (a) genes and (b) differentially expressed genes (DEGs) between the leaf transcriptome and the transcriptomes before and after callus growth (CDF1_S3/CK_S2).
-
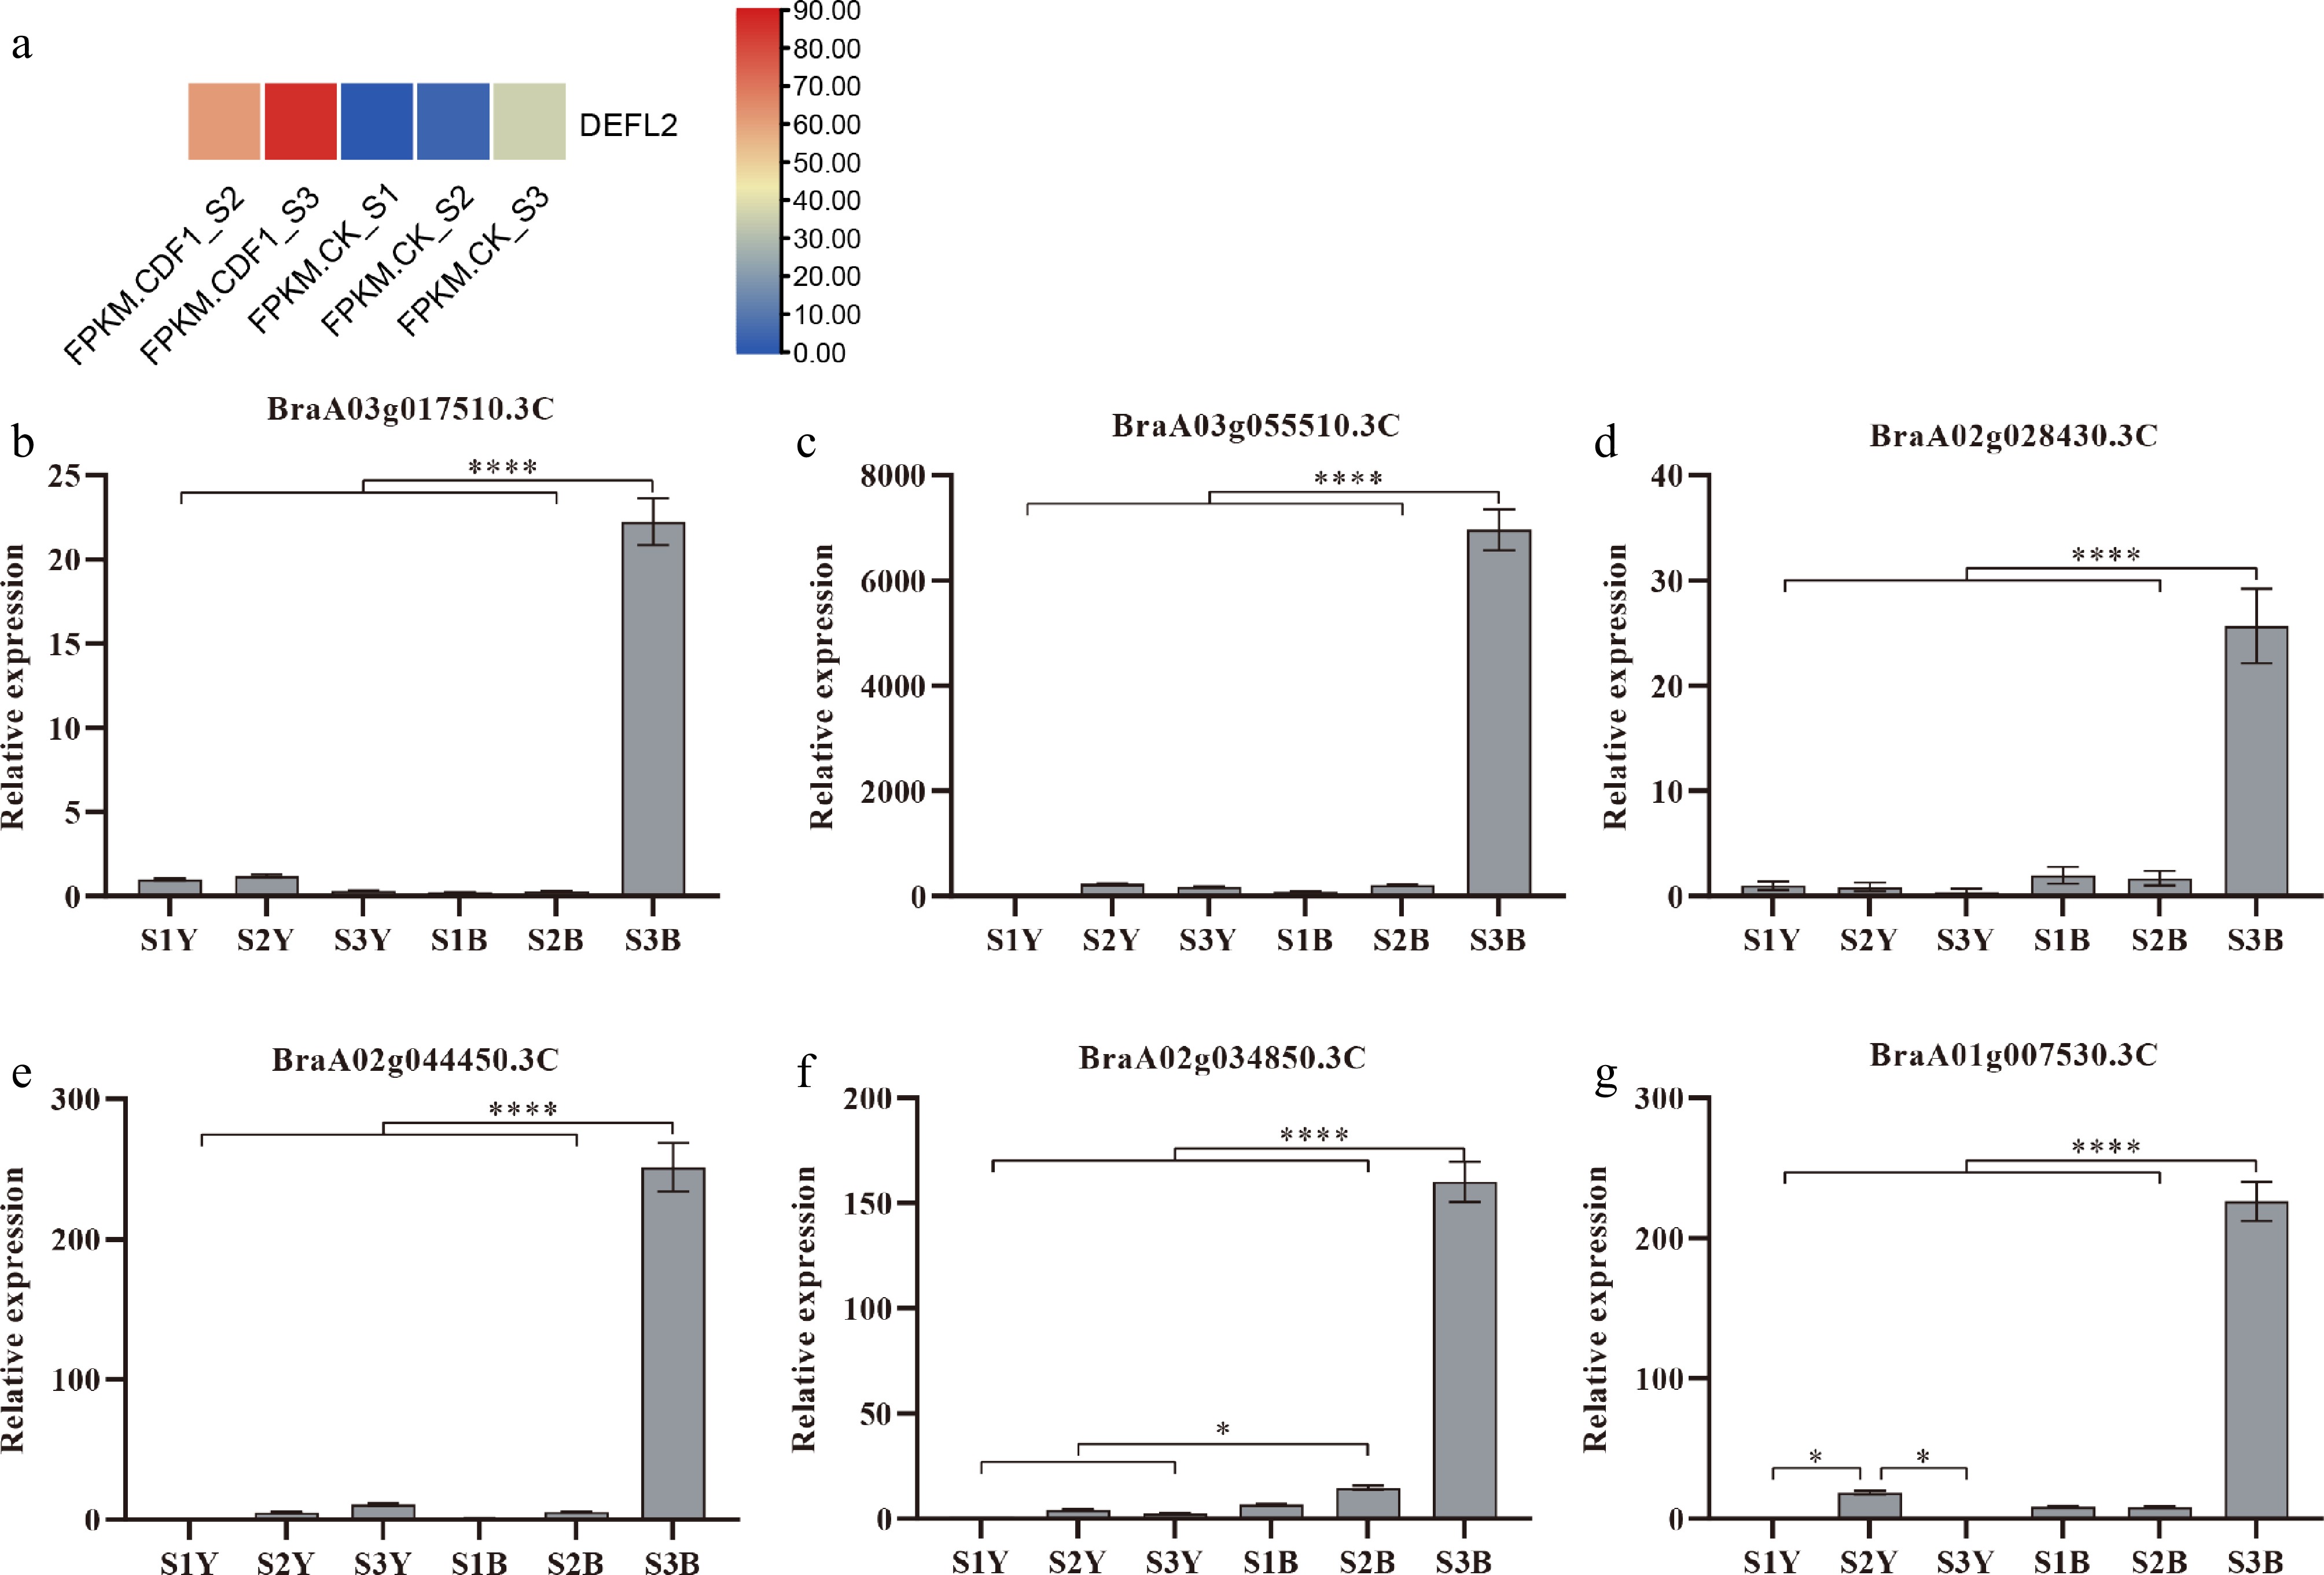
Figure 6.
(a) Heatmap showing the fragments per kilobase per million mapped fragments (FPKM) values of DEFL in the cotyledon petiole samples across the following stages: CK_S1 (preculture), CK_S2 (mock co-culture), CDF1_S2 (co-culture after 3 d), CK_S3 (mock callus induction), and CDF1_S3 (callus induction after 6 d). Color intensity (blue to red) represents the FPKM level. (b)–(g) The relative expression levels of six randomly selected genes from the transcriptome. * represents p < 0.05, indicating a significant difference; ** represents p < 0.01, suggesting a highly significant difference; *** represents p < 0.001, demonstrating a very highly significant difference; and **** represents p < 0.0001, showing an extremely significant difference. Data represent the mean ± SD of three independent biological replicates (n = 3).
Figures
(6)
Tables
(0)