-
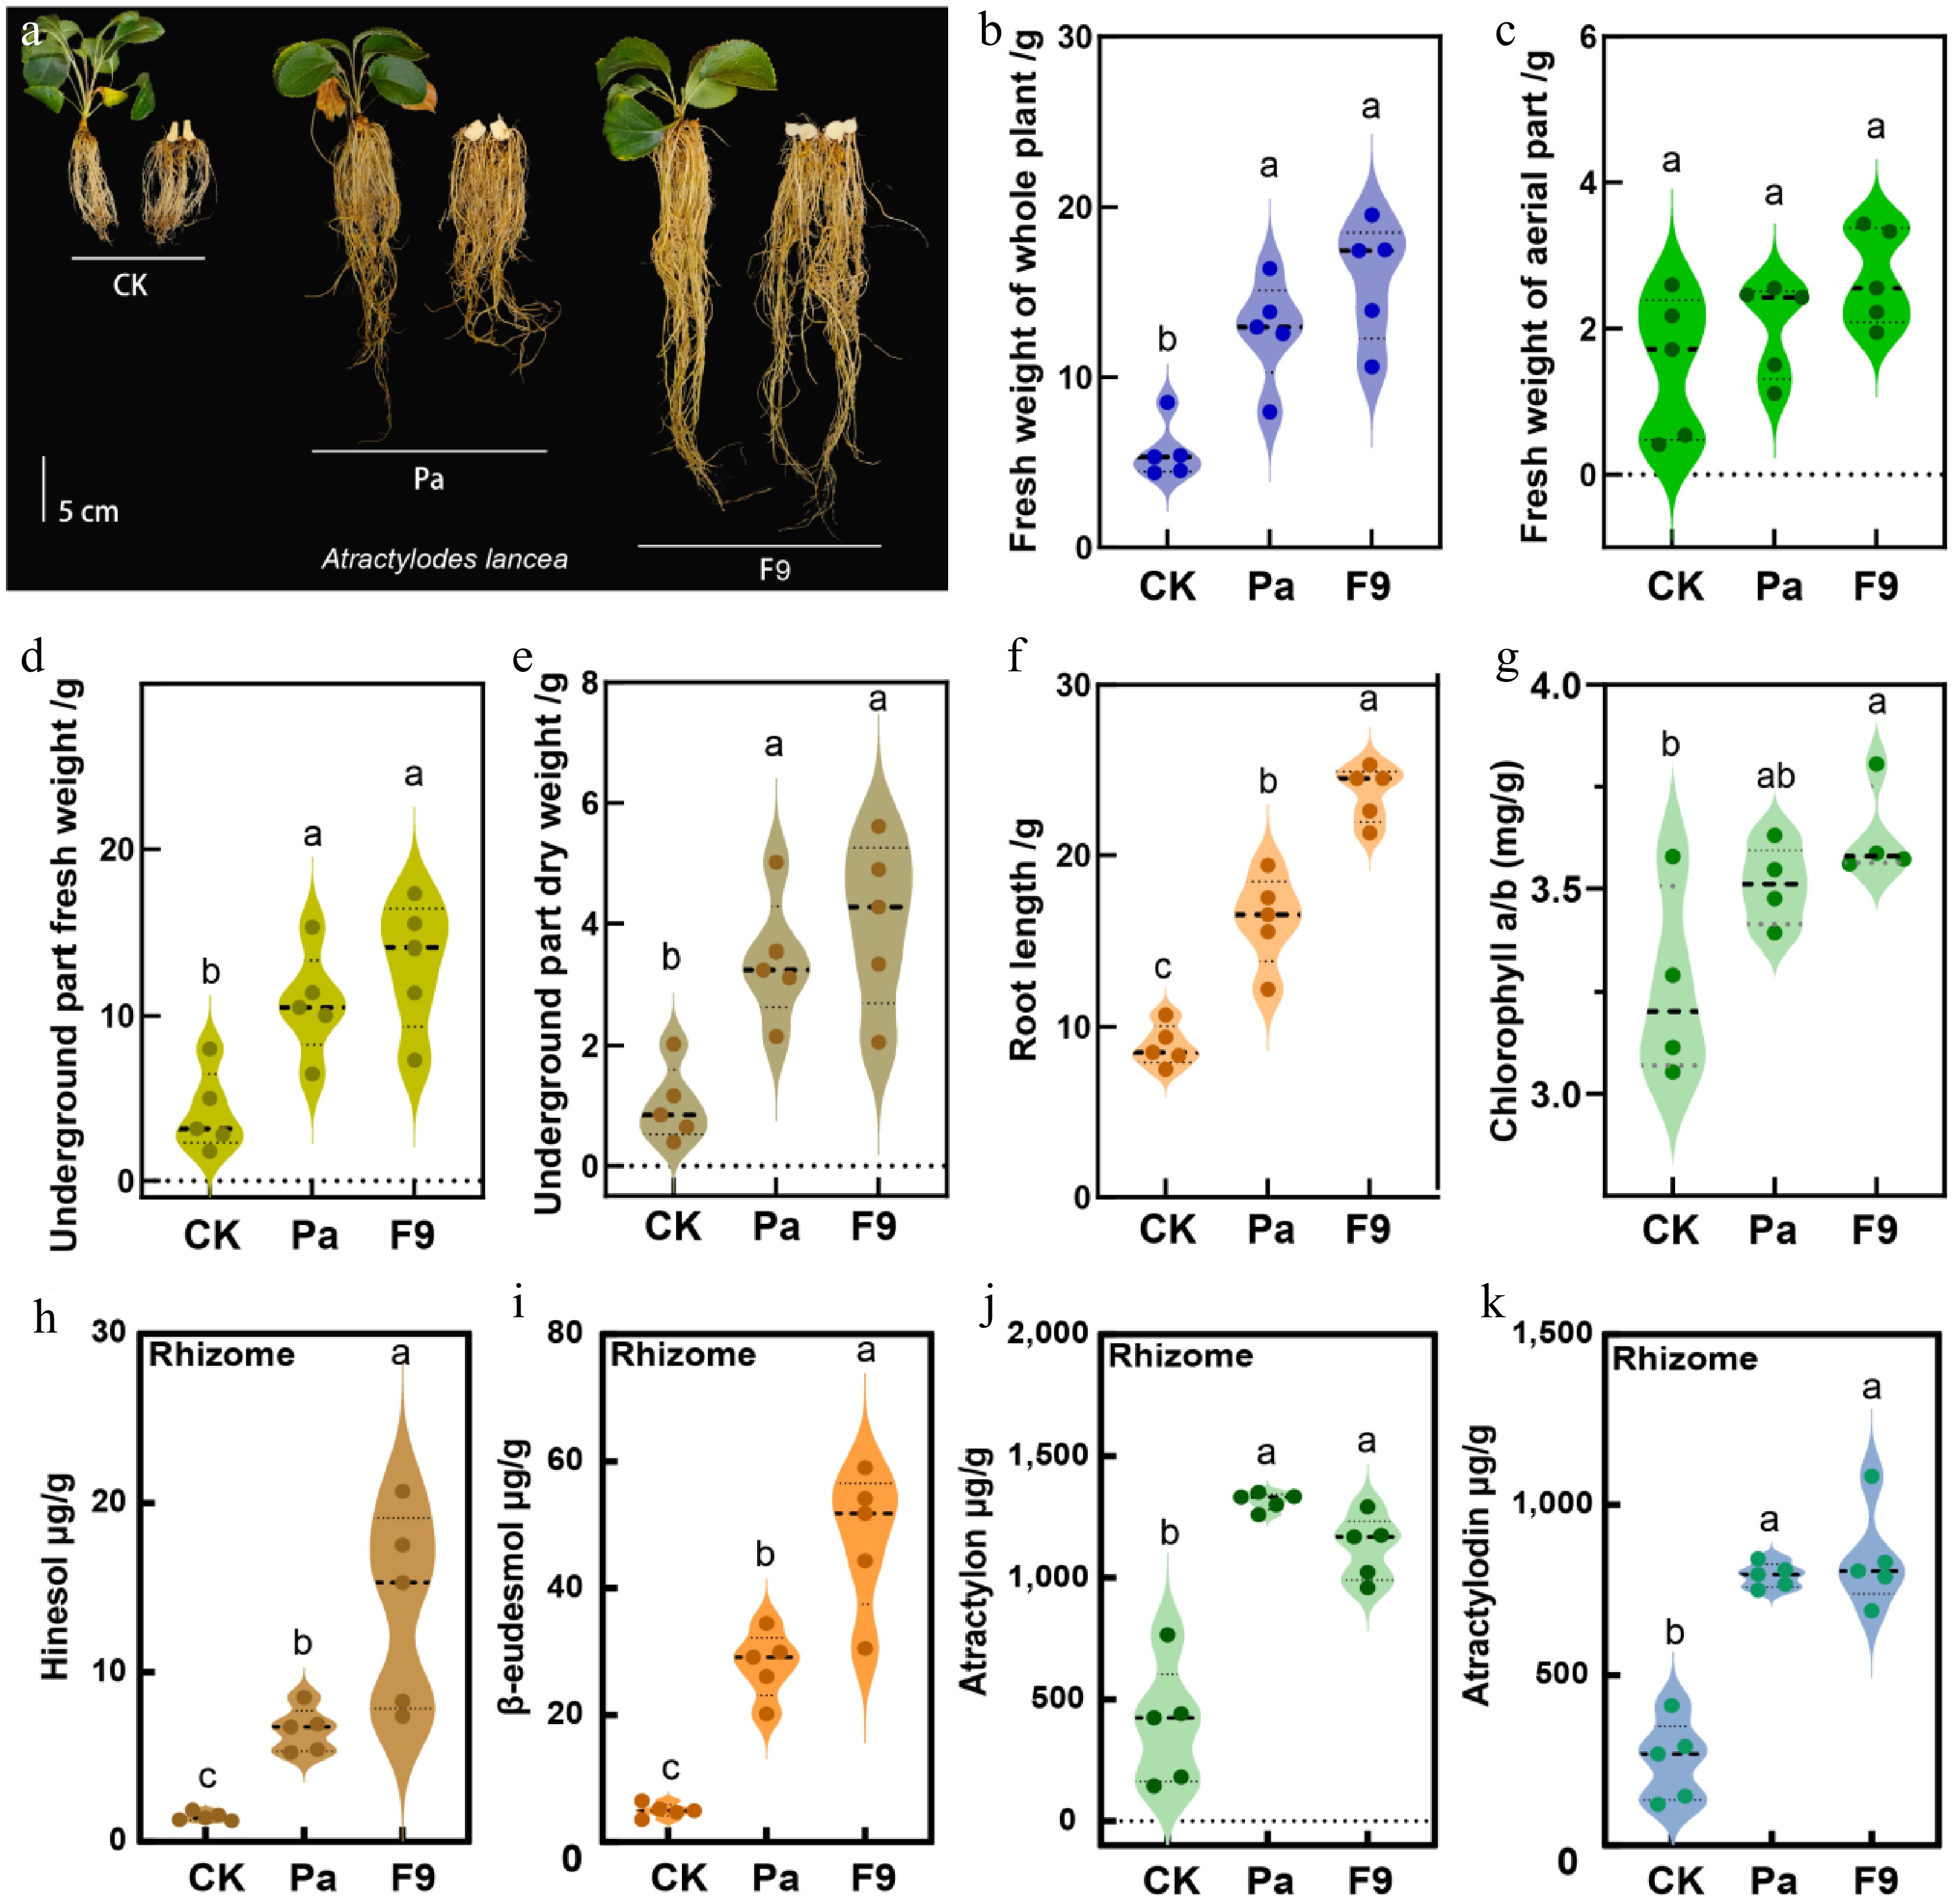
Figure 1.
The effect of inoculation with F9 and Pa on traits of A. lancea. The changes in (a) morphology and (b) fresh weight of the whole plant, (c) aerial part fresh weight, (d) underground part fresh weight, (e) underground part dry weight, (f) root length, (g) chlorophyll a/b ratio. The concentration of four medical compounds in A. lancea rhizomes, including (h) hinesol, (i) β-eudesmol, (j) atractylon, and (k) atractylodin, caused by F9 and Pa inoculation are shown. Different lowercase letters indicate significant differences (one-way ANOVA, p < 0.05, n = 5).
-
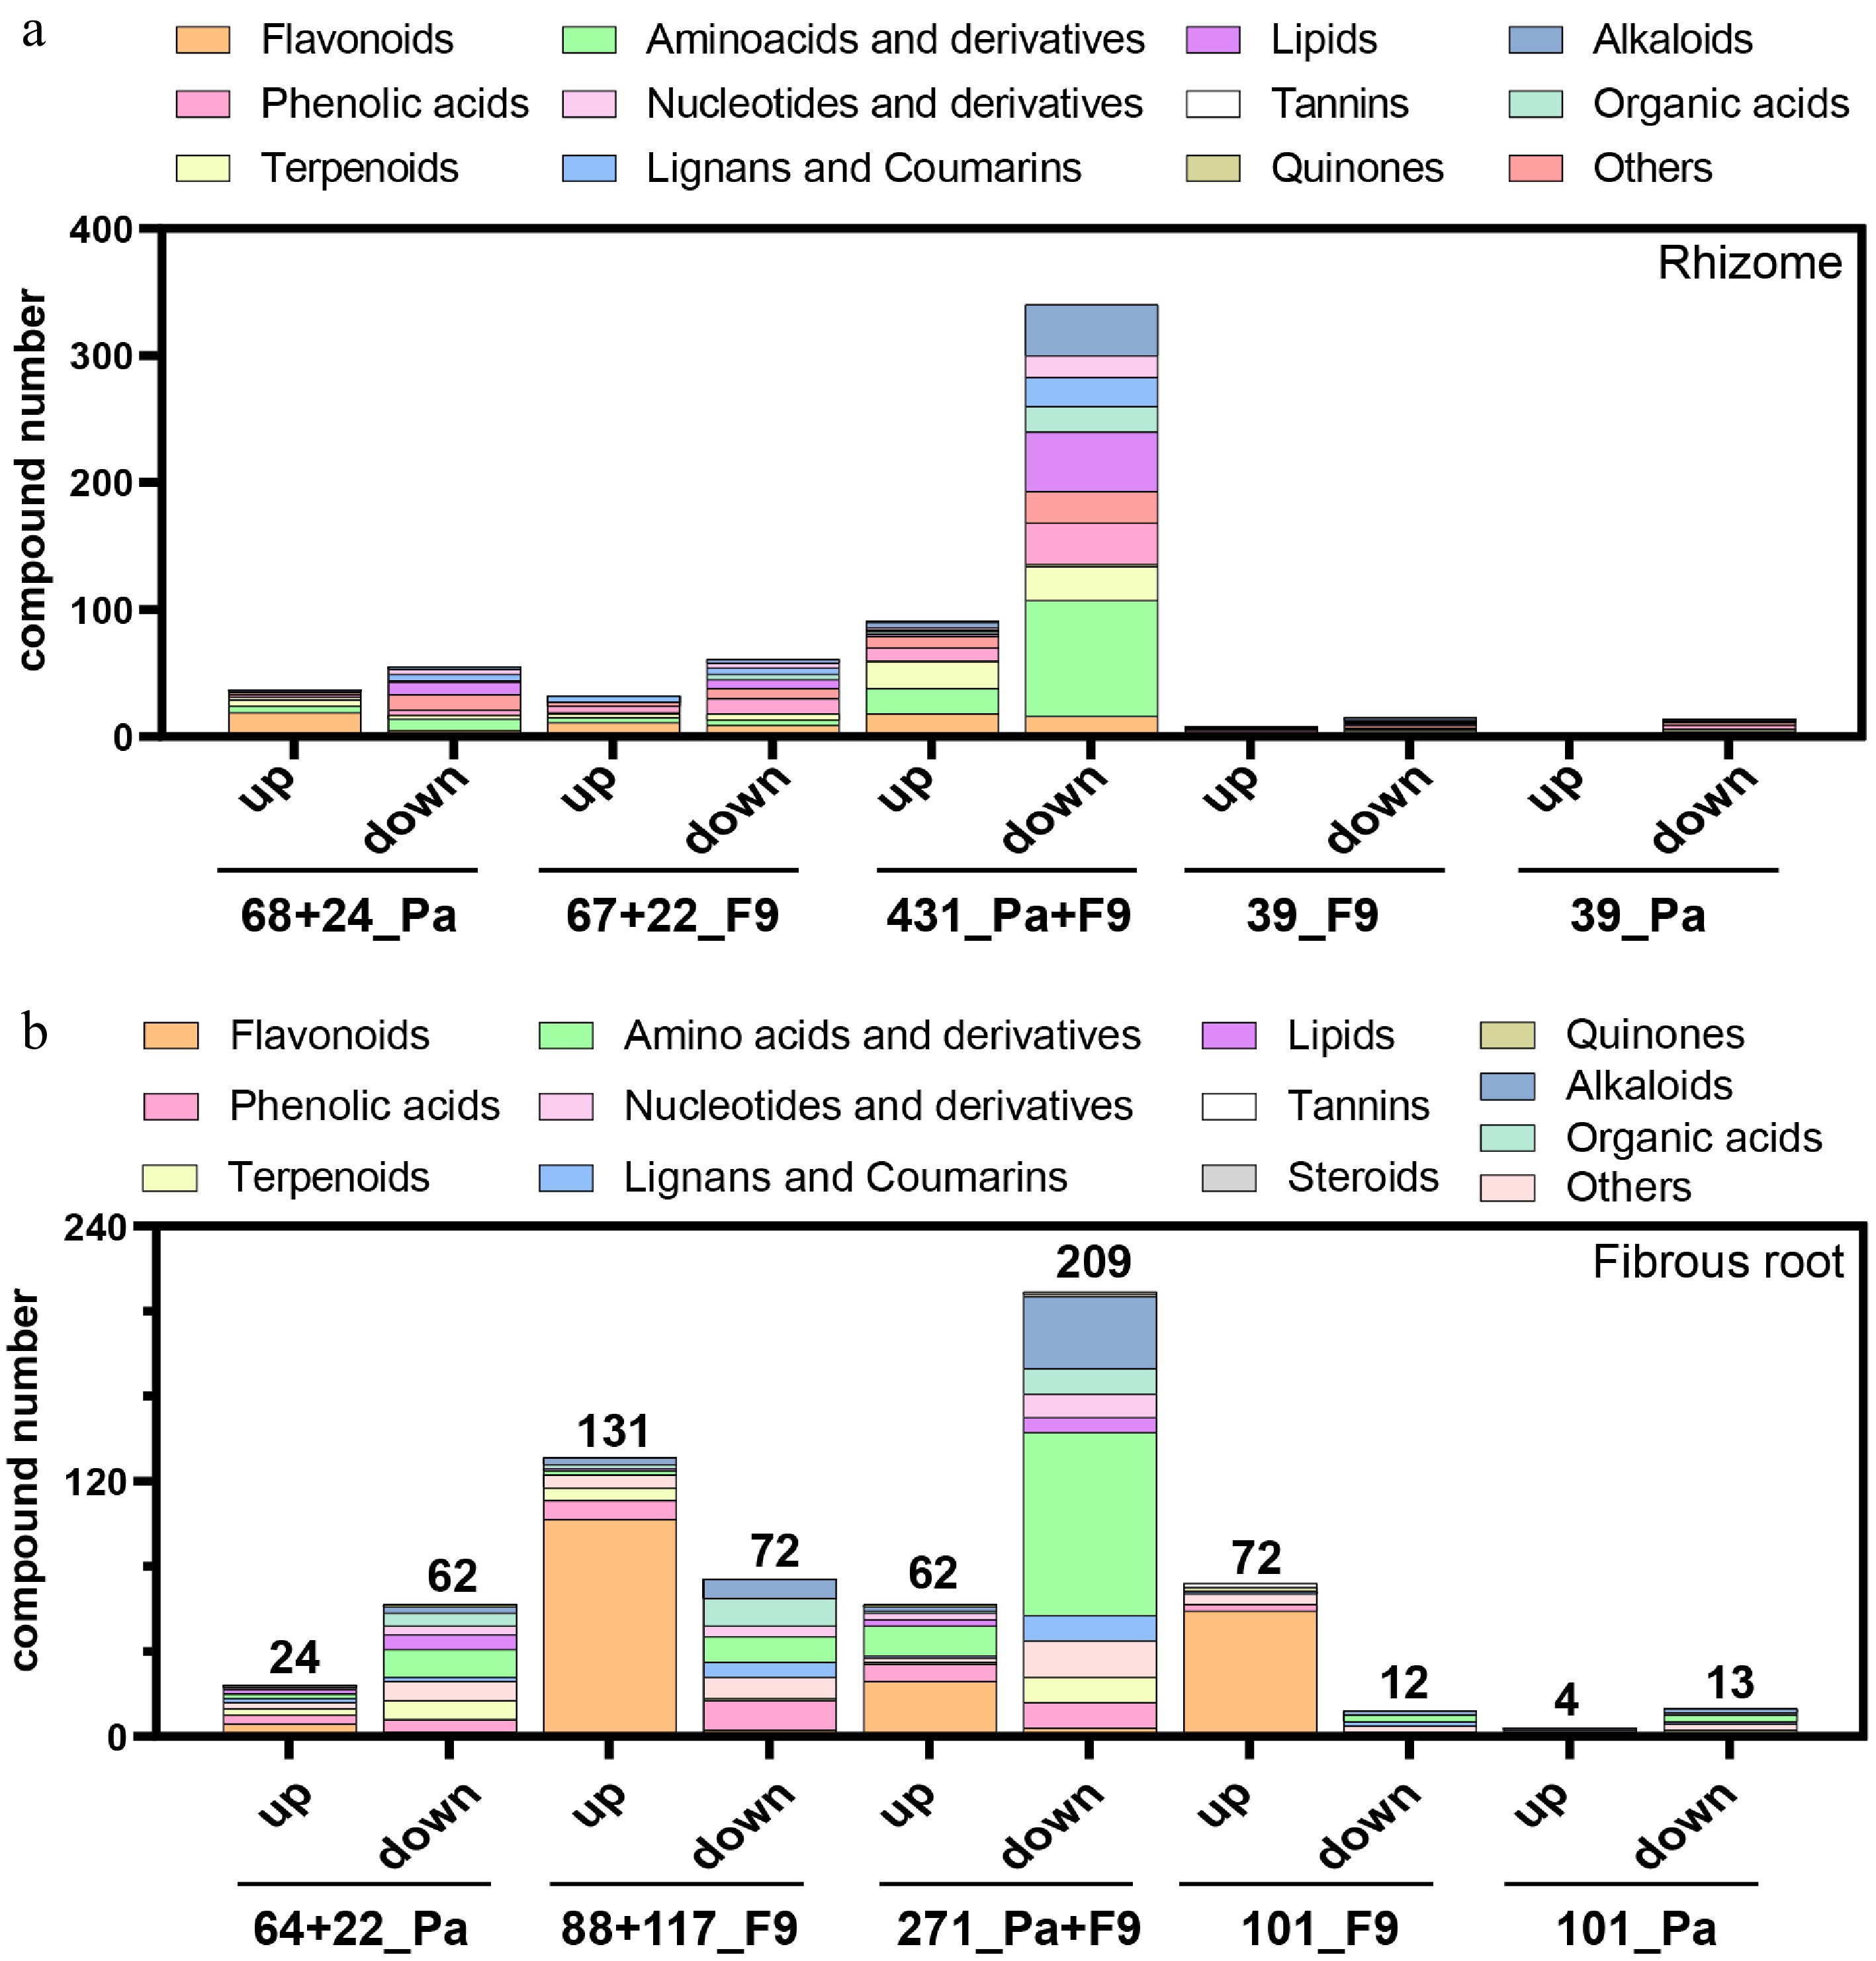
Figure 2.
The distribution of differentially accumulated metabolites (DAMs) in A. lancea (a) rhizomes, or (b) fibrous roots, caused by inoculation with F9 and Pa. (a) 68+24_Pa: the distribution of 92 (68+24) DAMs specifically associated with Pa treatment. 67+24_F9: the distribution of 91 (67+24) DAMs specifically associated with F9 treatment. 431_Pa+F9: the distribution of 431 common DAMs that were influenced by F9 treatment and Pa treatment compared to the control (CK). 39_F9 and 39_Pa: the distribution of 39 DAMs specifically caused by F9 or Pa inoculation, which obtained by pairwise comparison (F9r vs CKr, Par vs CKr, and Par vs F9r). The above numbers for (a) refer to Supplementary Fig. S4. (b) The meaning represented by the horizontal axis from left to right is the same as that in (a) except that the samples in (b) comes from A. lancea fibrous roots instead of the rhizomes. The above numbers for (b) refer to Supplementary Fig. S5. 'r', rhizome; 'fr', fibrous root; 'up', metabolite contents increased by F9 treatment or Pa treatment compared to the control; 'down', metabolite contents reduced by F9 treatment or Pa treatment compared to the control.
-
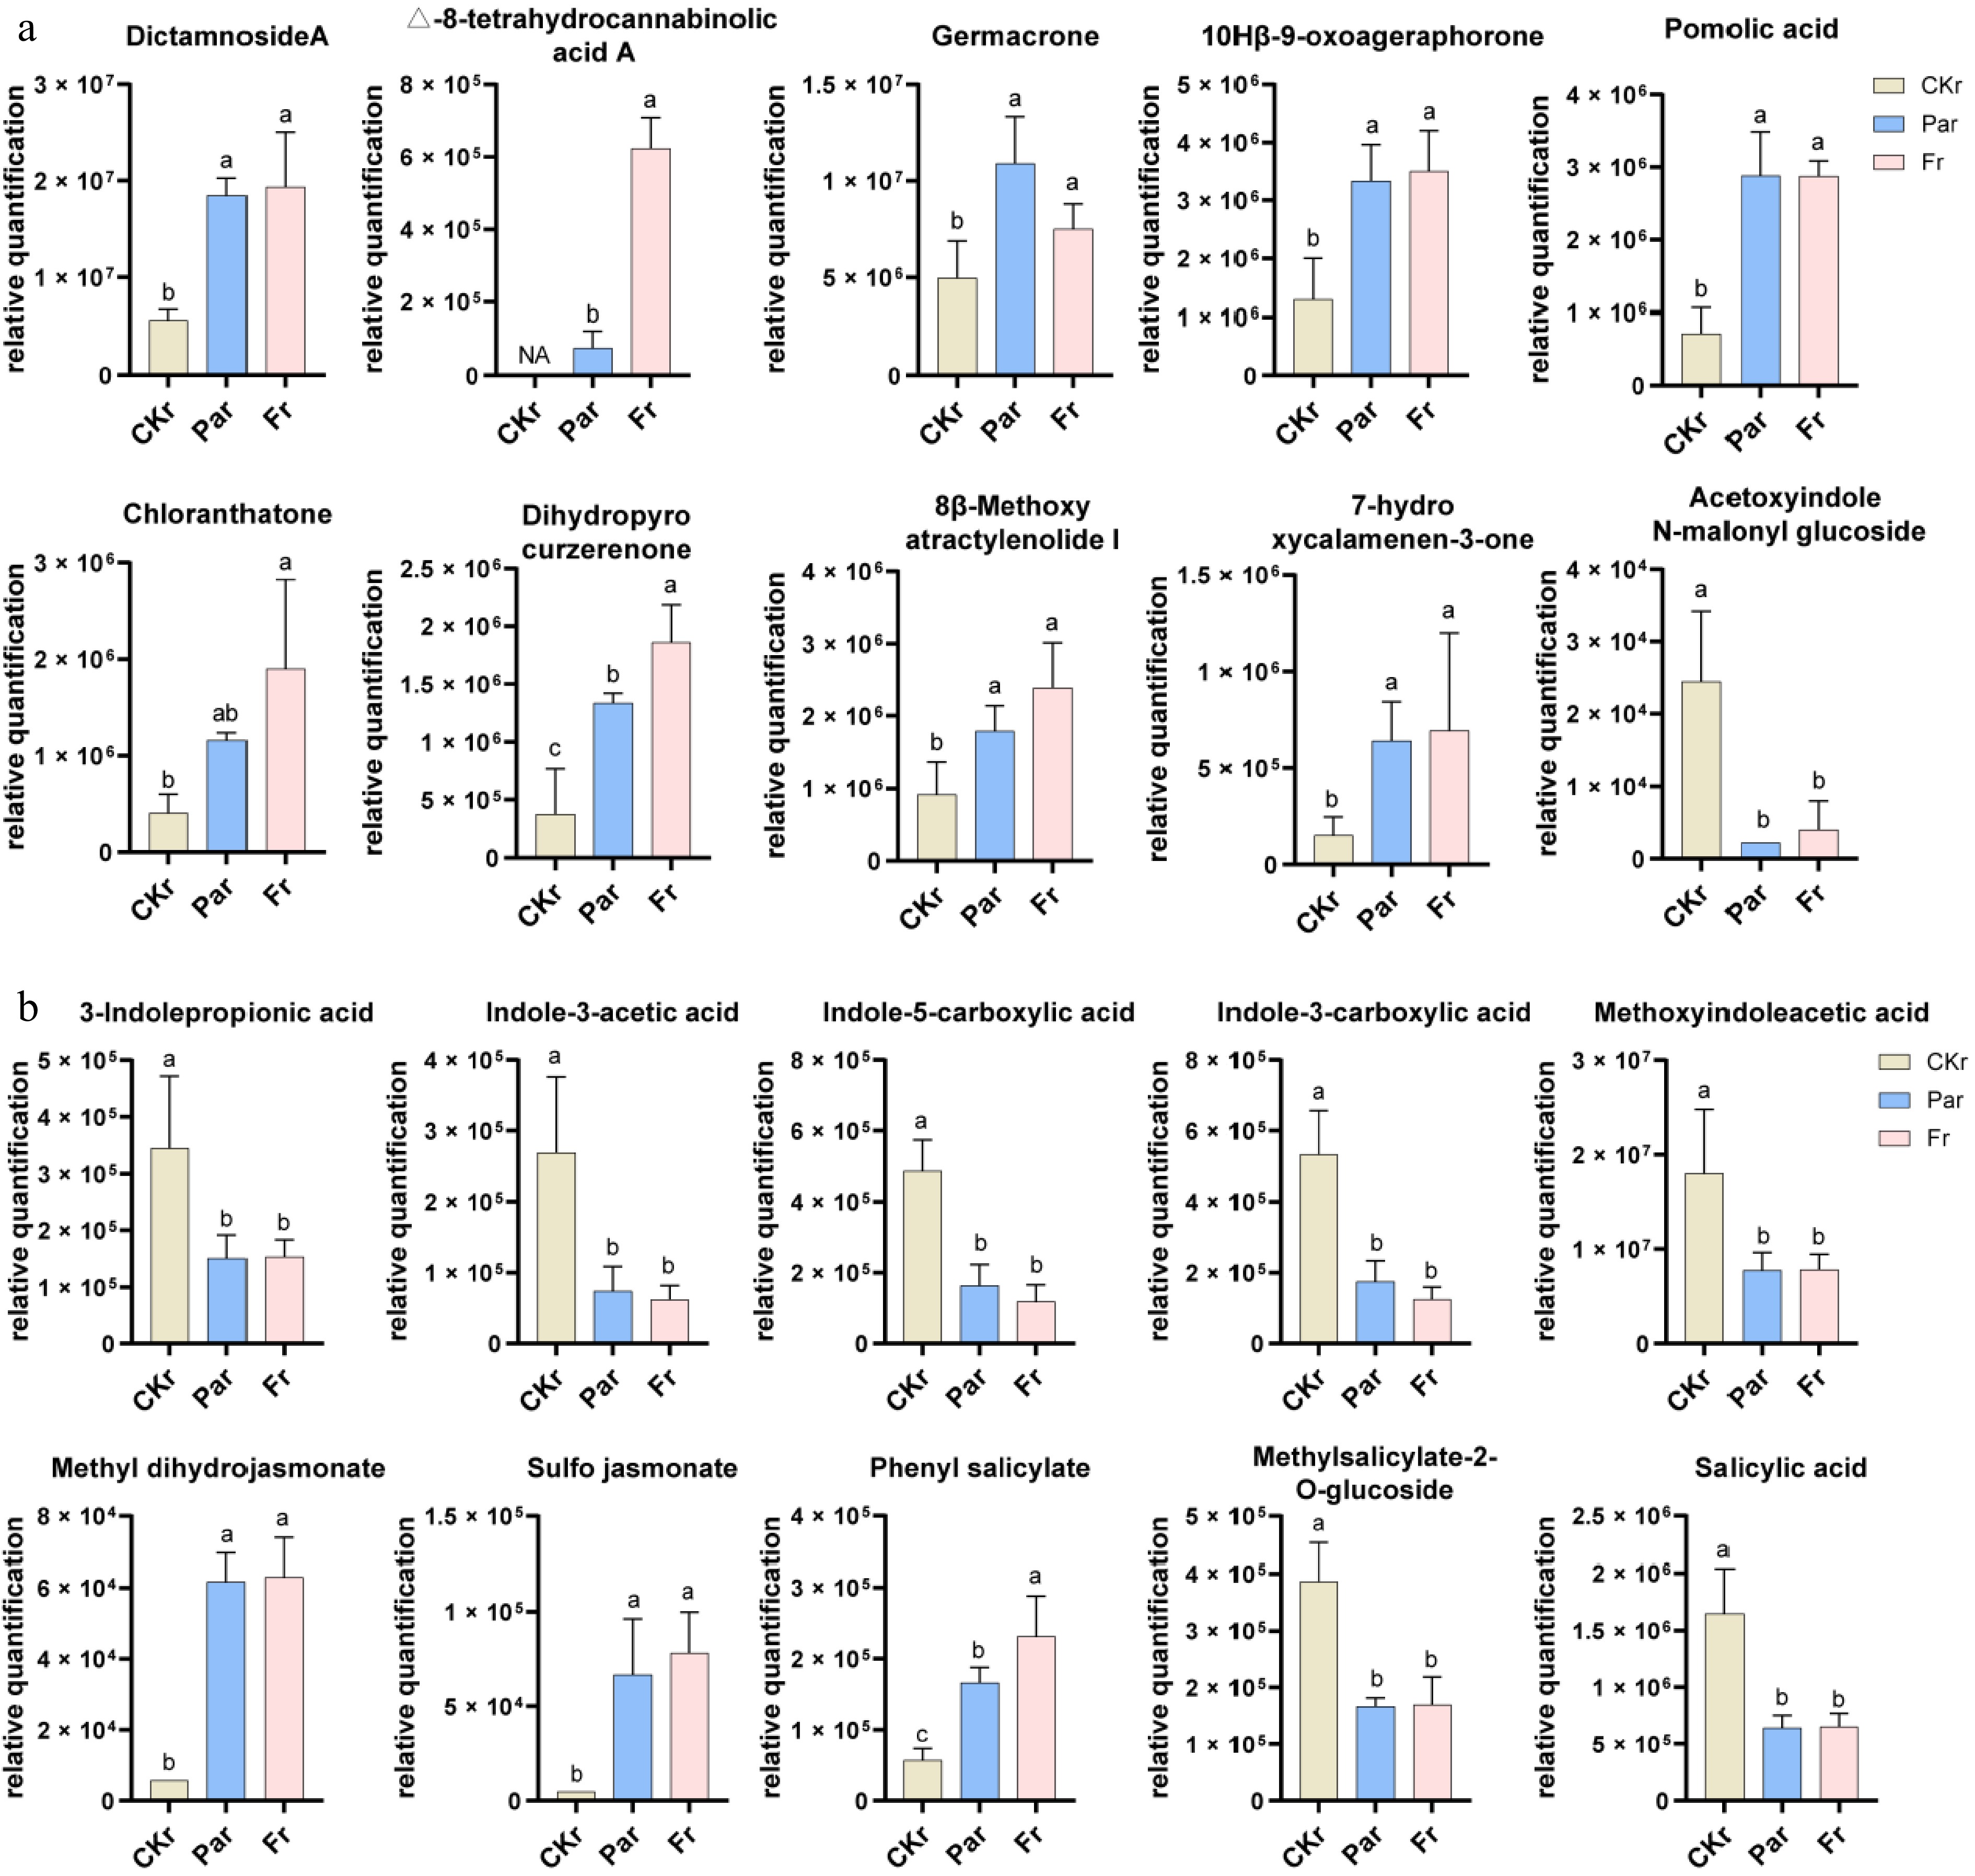
Figure 3.
(a) The bar chart displays the change of the top 10 compounds in content based on differentially accumulated metabolites (DAMs) in A. lancea rhizome among the F9 inoculation group, the Pa inoculation group, the free-F9, and the Pa inoculation group. Bar graphs represented as mean ± SEM. The alterations in the levels of plant growth and metabolism-associated hormones, as derived from the DAMs, are quantified and depicted in (b). Different lowercase letters indicate significant differences (one-way ANOVA, p < 0.05, n = 5).
-
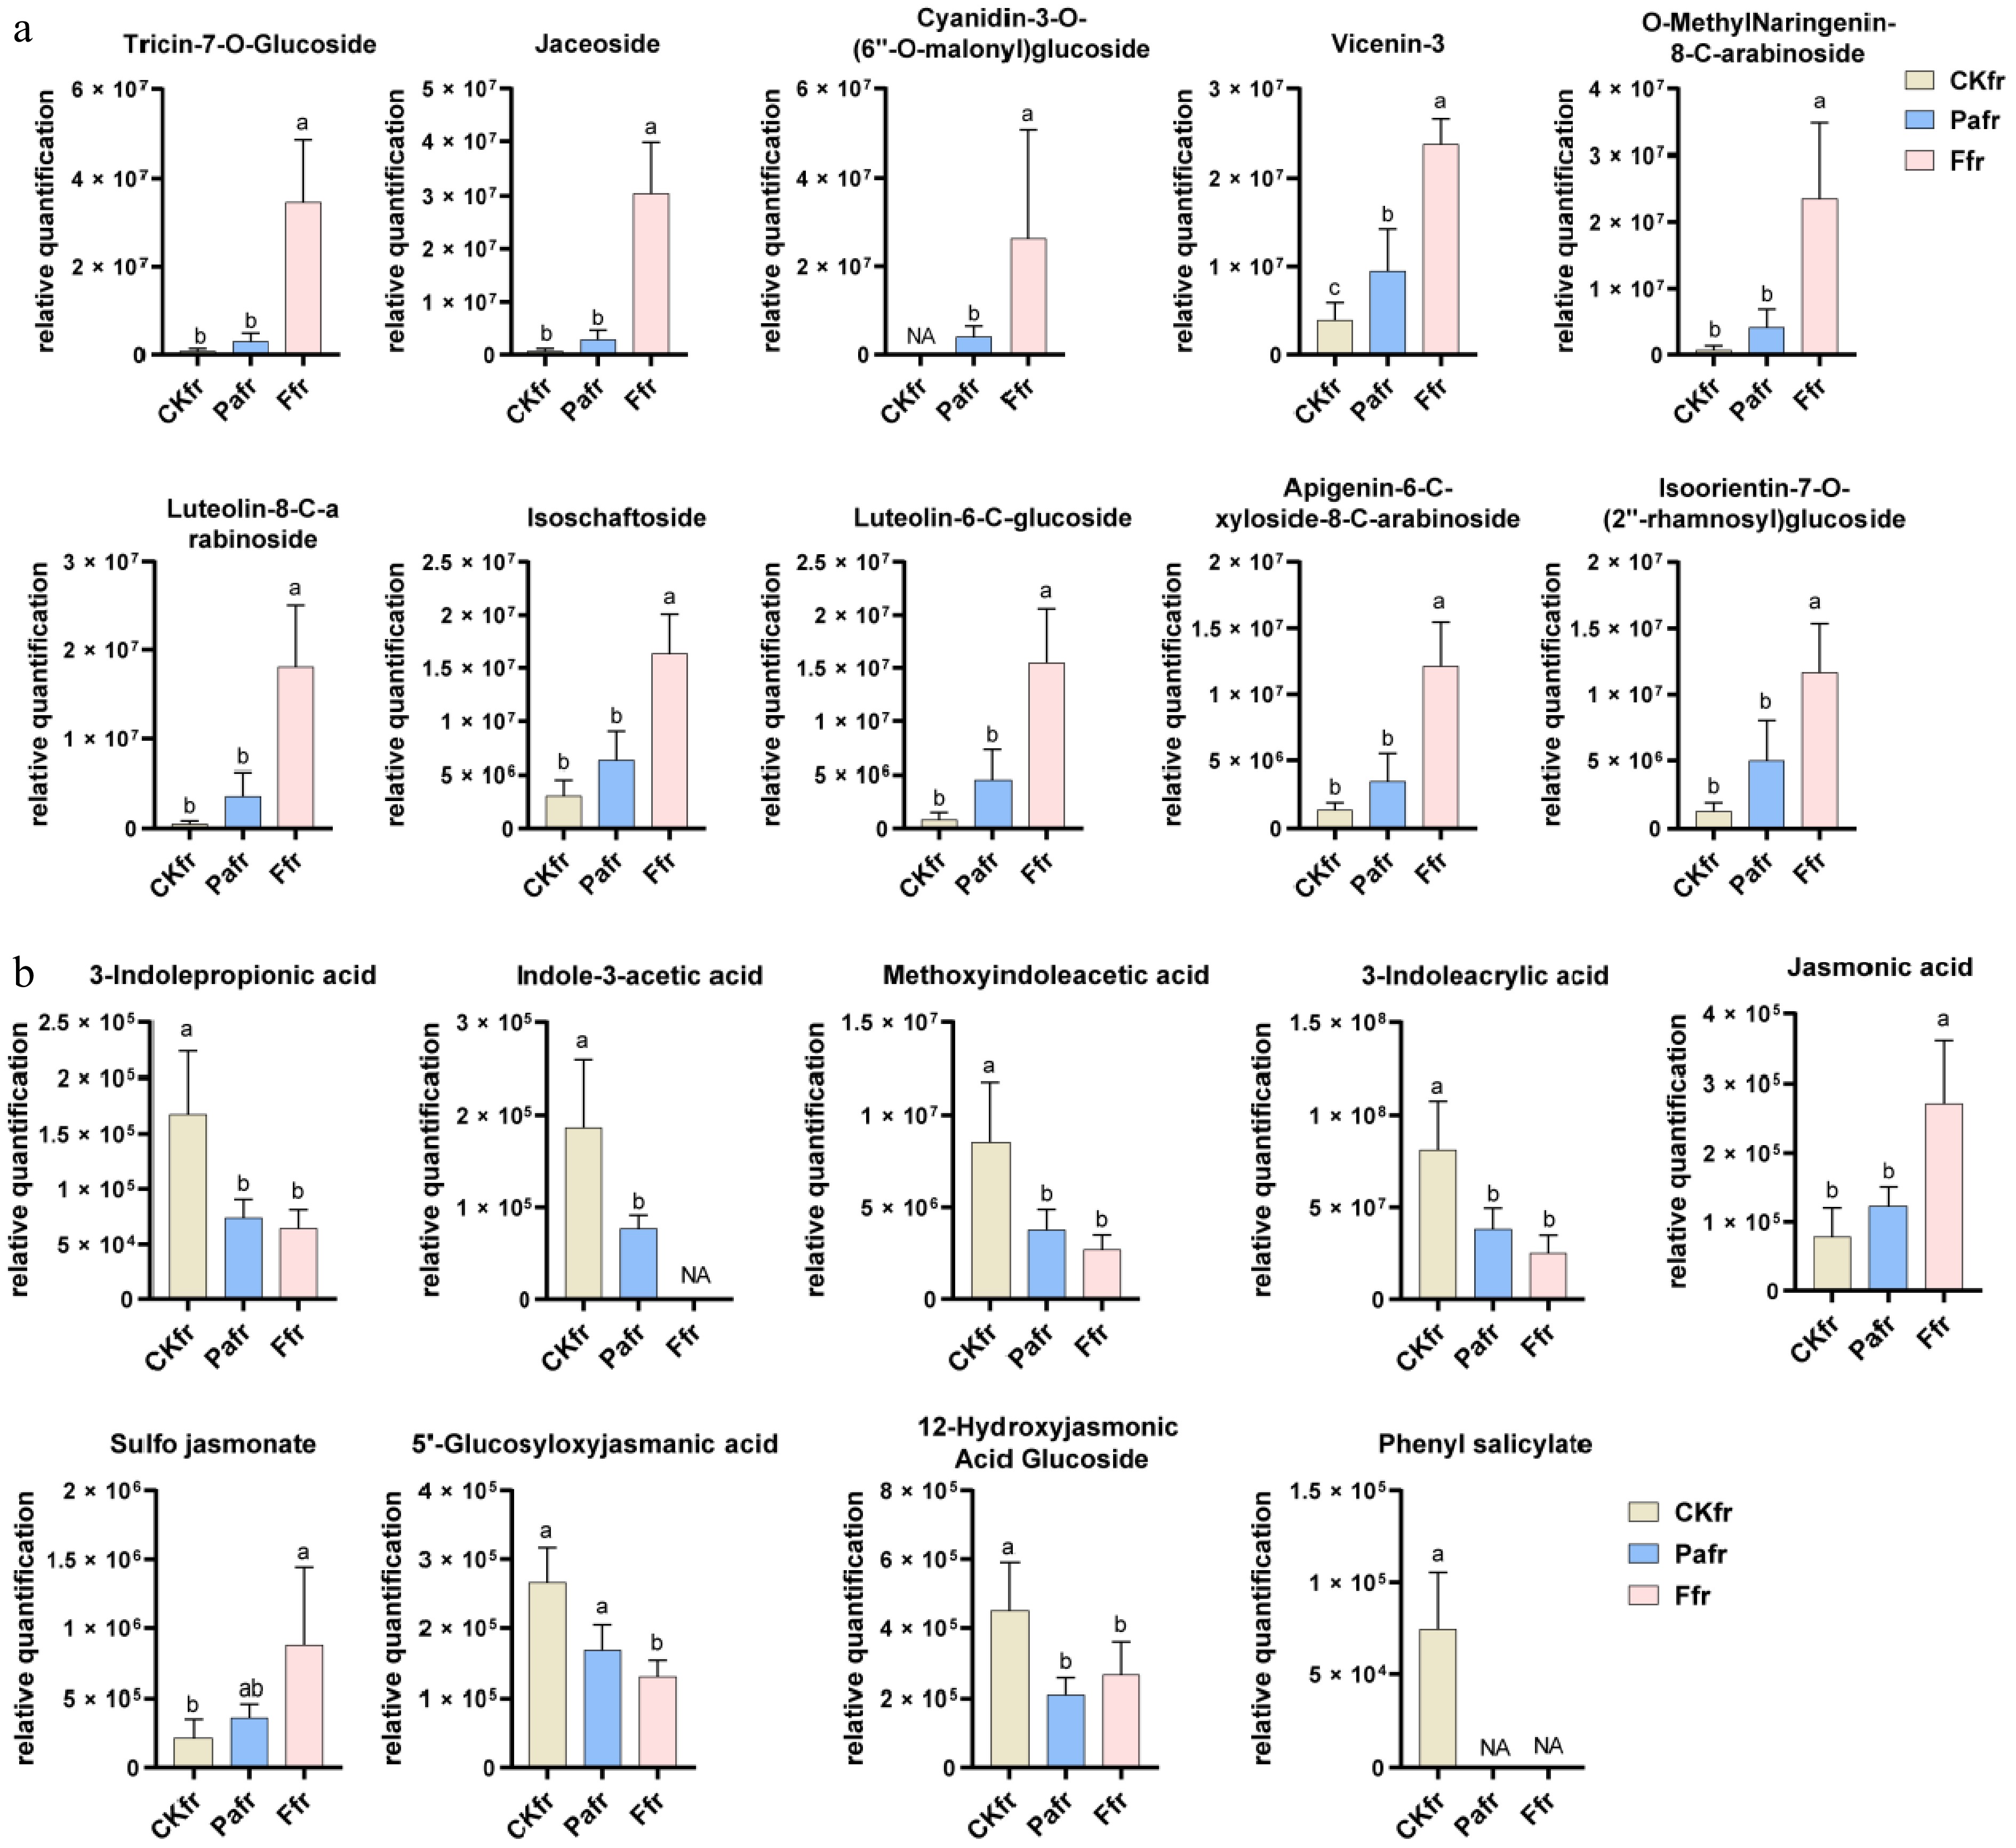
Figure 4.
(a) The bar chart displays the change of the top 11 compounds in content based on differentially accumulated metabolites (DAMs) in A. lancea fibrous roots among the F9 inoculation group, the Pa inoculation group, the free-F9, and the Pa inoculation group. Bar graphs represented as mean ± SEM. The alterations in the levels of plant growth and metabolism-associated hormones, as derived from the DAMs, are quantified and depicted in (b). Different lowercase letters indicate significant differences (one-way ANOVA, p < 0.05, n = 5).
-
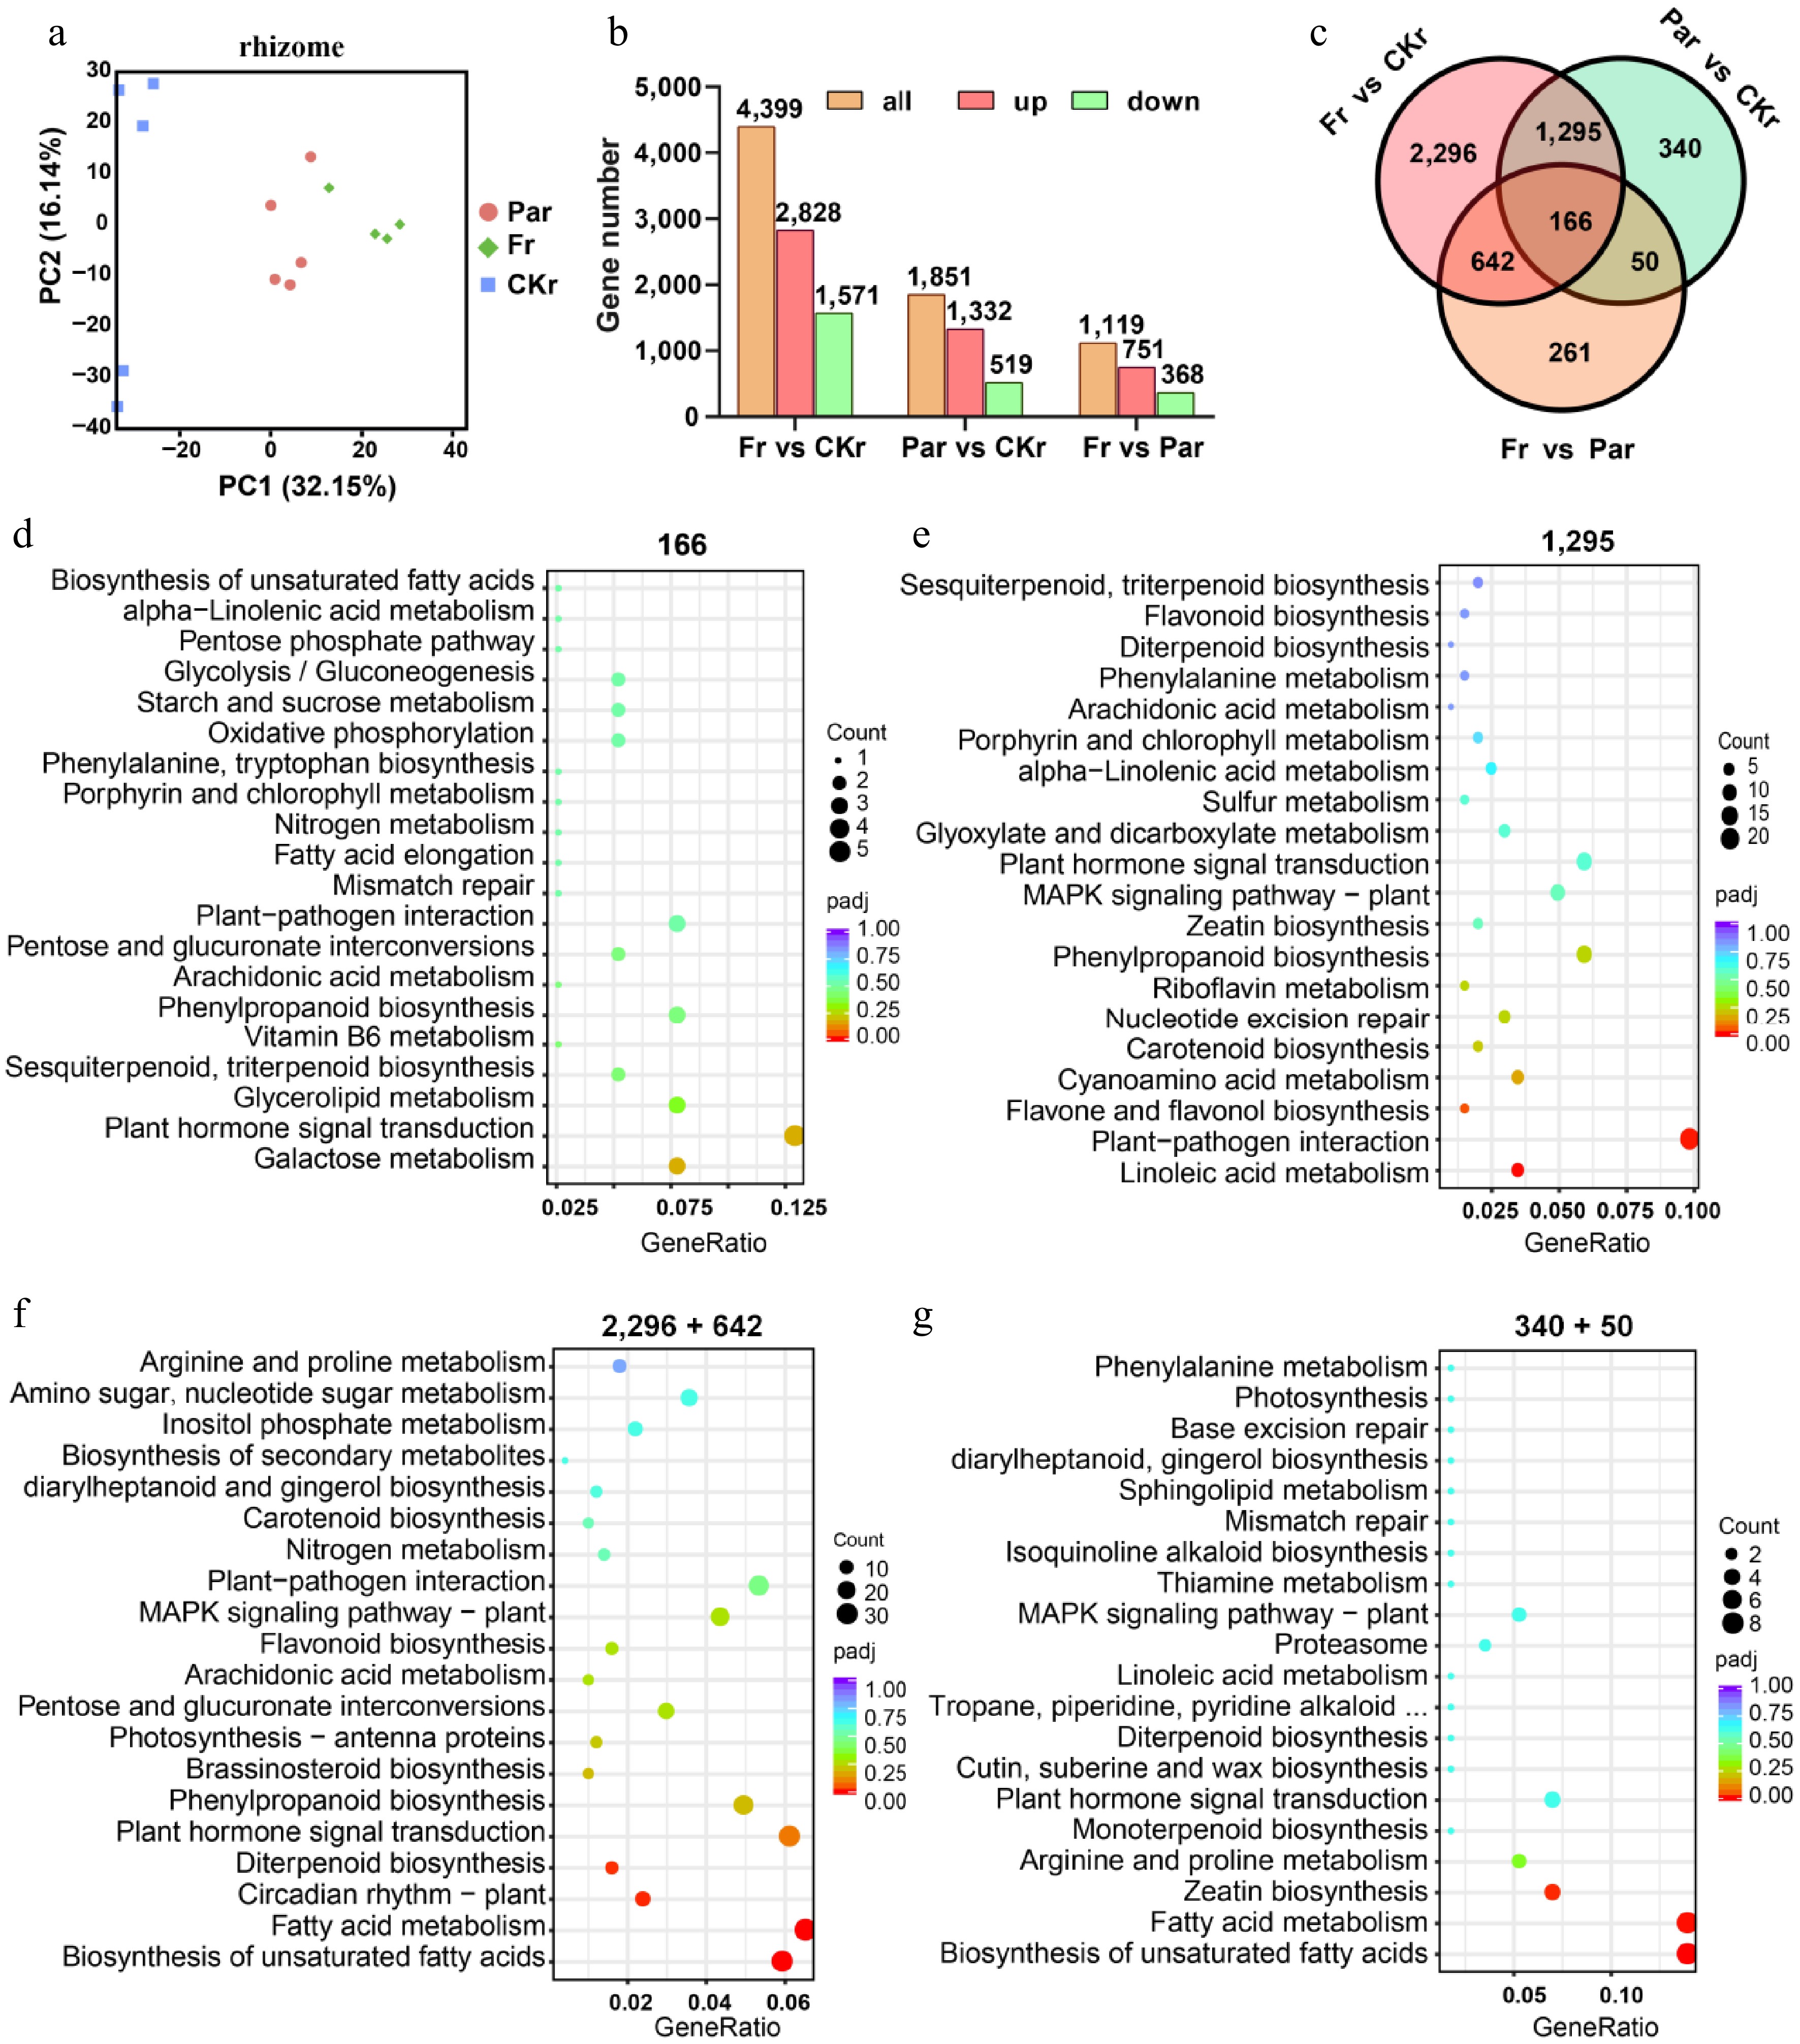
Figure 5.
Differentially expressed genes (DEGs) and Kyoto Encyclopedia of Genes and Genomes (KEGG) pathway enrichment analysis of transcriptional levels in A. lancea rhizome following F9 and Pa inoculation. (a) Principal component analysis (PCA) based on transcriptional data from samples treated with F9 inoculation (Fr), Pa inoculation (Par), or without inoculation (CKr). (b) Statistical analysis of DEGs (p < 0.05, |Log2Foldchange| > 1) comparing Fr vs CKr, Par vs CKr, and Fr vs Par, revealing a total of 5,050 DEGs. (c) Venn diagram classifying DEGs into seven groups based on their expression levels across the three treatment conditions. (d)–(g) KEGG pathway enrichment analysis was performed on six of the seven categories, including 1,295, 166, 2,296 and 642, 340 and 50. The 1,295 genes showed similar expression levels between the F9 and Pa inoculation groups; 166 genes exhibit significant differences in expression between these two groups; 2,296 and 642 genes are specifically affected by F9 but not by Pa inoculation; 340 and 50 genes are specifically affected by Pa but not by F9 inoculation.
-
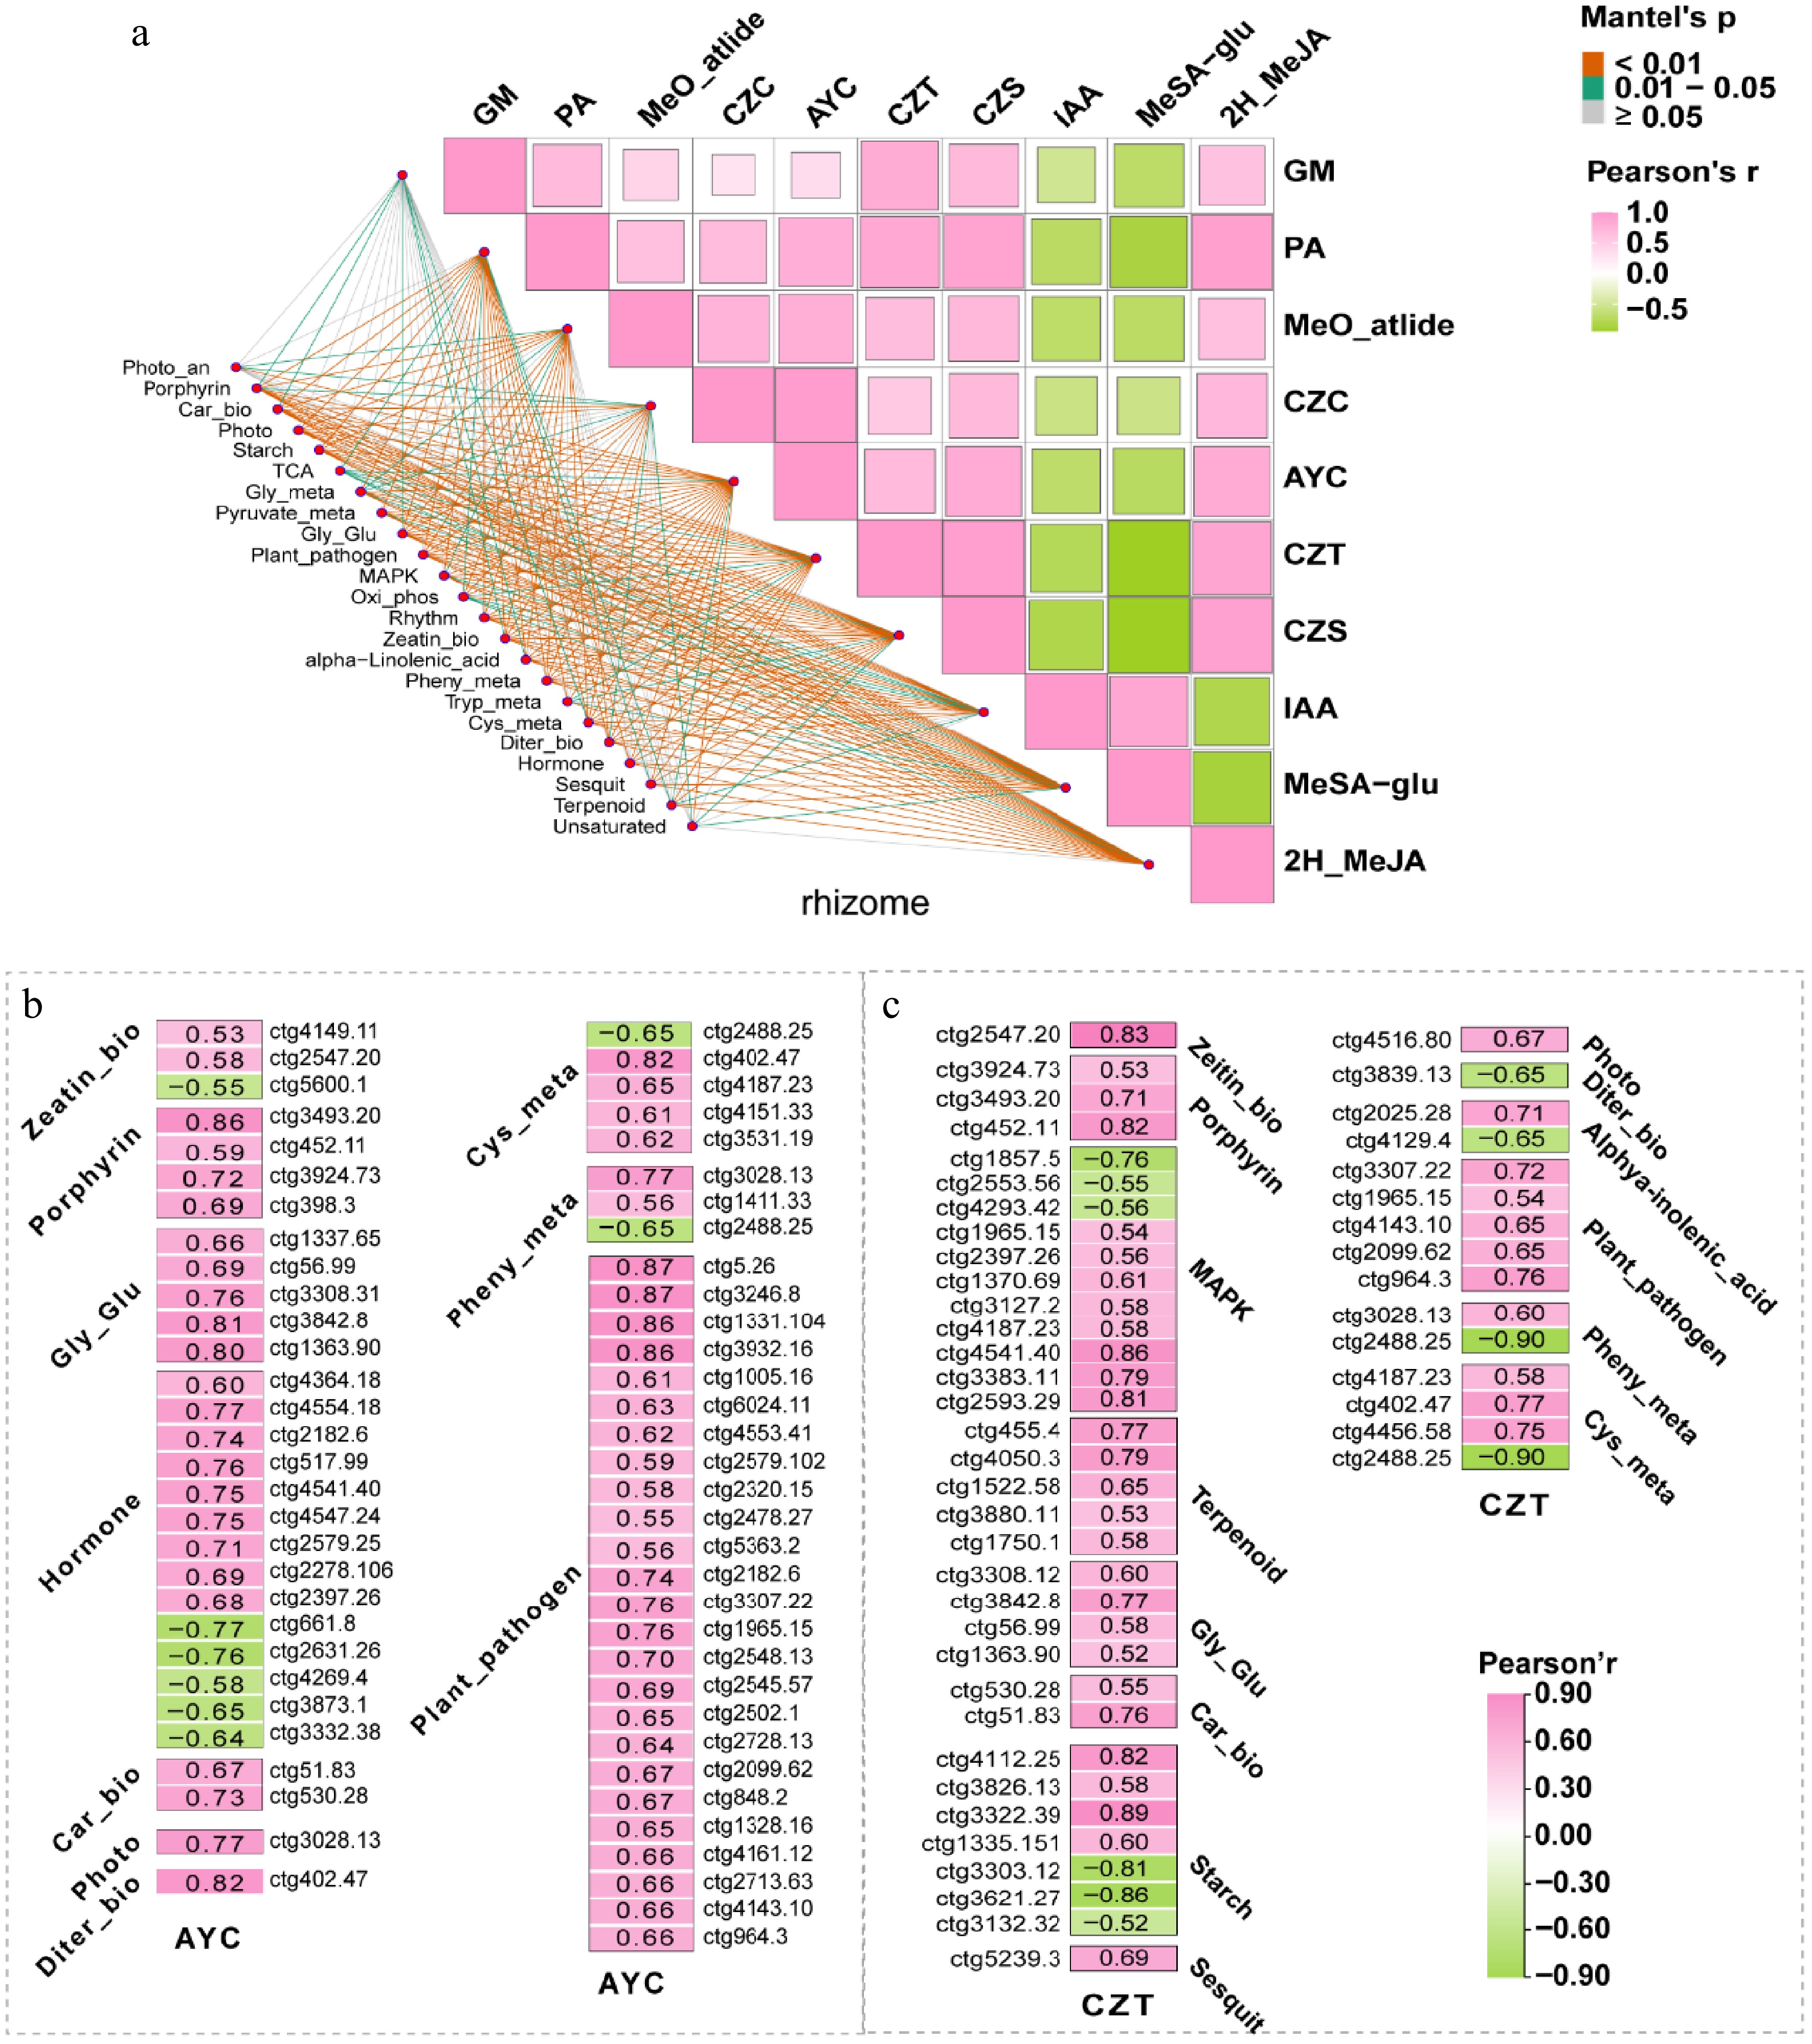
Figure 6.
(a) Matrix correlation analysis between traits, including metabolites and growth phenotypes, in response to F9 and Pa inoculation, and the KEGG enrichment pathway in A. lancea rhiozme. (b) Pearson correlation analysis was also performed between two medicinal terpenoids (AYC and CZT) and the genes within the screened KEGG enrichment pathway in the rhizome of A. lancea. Abbreviation: GM: Germacrone; PA: Pomolic acid; CZC: Hinesol; AYC: β-eudesmol; CZT: Atractylon; CZS: Atractylodin; IAA: Indole-3-acetic acid; MeSA-glu: Methylsalicylate-2-O-glucoside; 2H_MeJA: Methyl dihydrojasmonate. Zeatin_bio: Zeatin biosynthesis, Porphyrin: Porphyrin and chlorophyll metabolism, Gly_Glu: Glycolysis/Gluconeogenesis, Hormone: Plant hormone signal transduction, Car_bio: Carotenoids biosynthesis, Photo: Photosynthesis, Diter_bio: Diterpenoid biosynthesis, Cys_meta: Cysteine and methionine metabolism, Plant-pathogen: Plant-pathogen interaction, MAPK: MAPK signaling pathway, Terpenoid: Terpenoid backbone biosynthesis, Pheny_bio: Phenylpropanoid biosynthesis, Starch: Starch and sucrose metabolism, Sesquit: Sesquiterpenoid and triterpenoid biosynthesis, Alpha-Linolenic_acid: alpha-Linolenic acid metabolism.
-
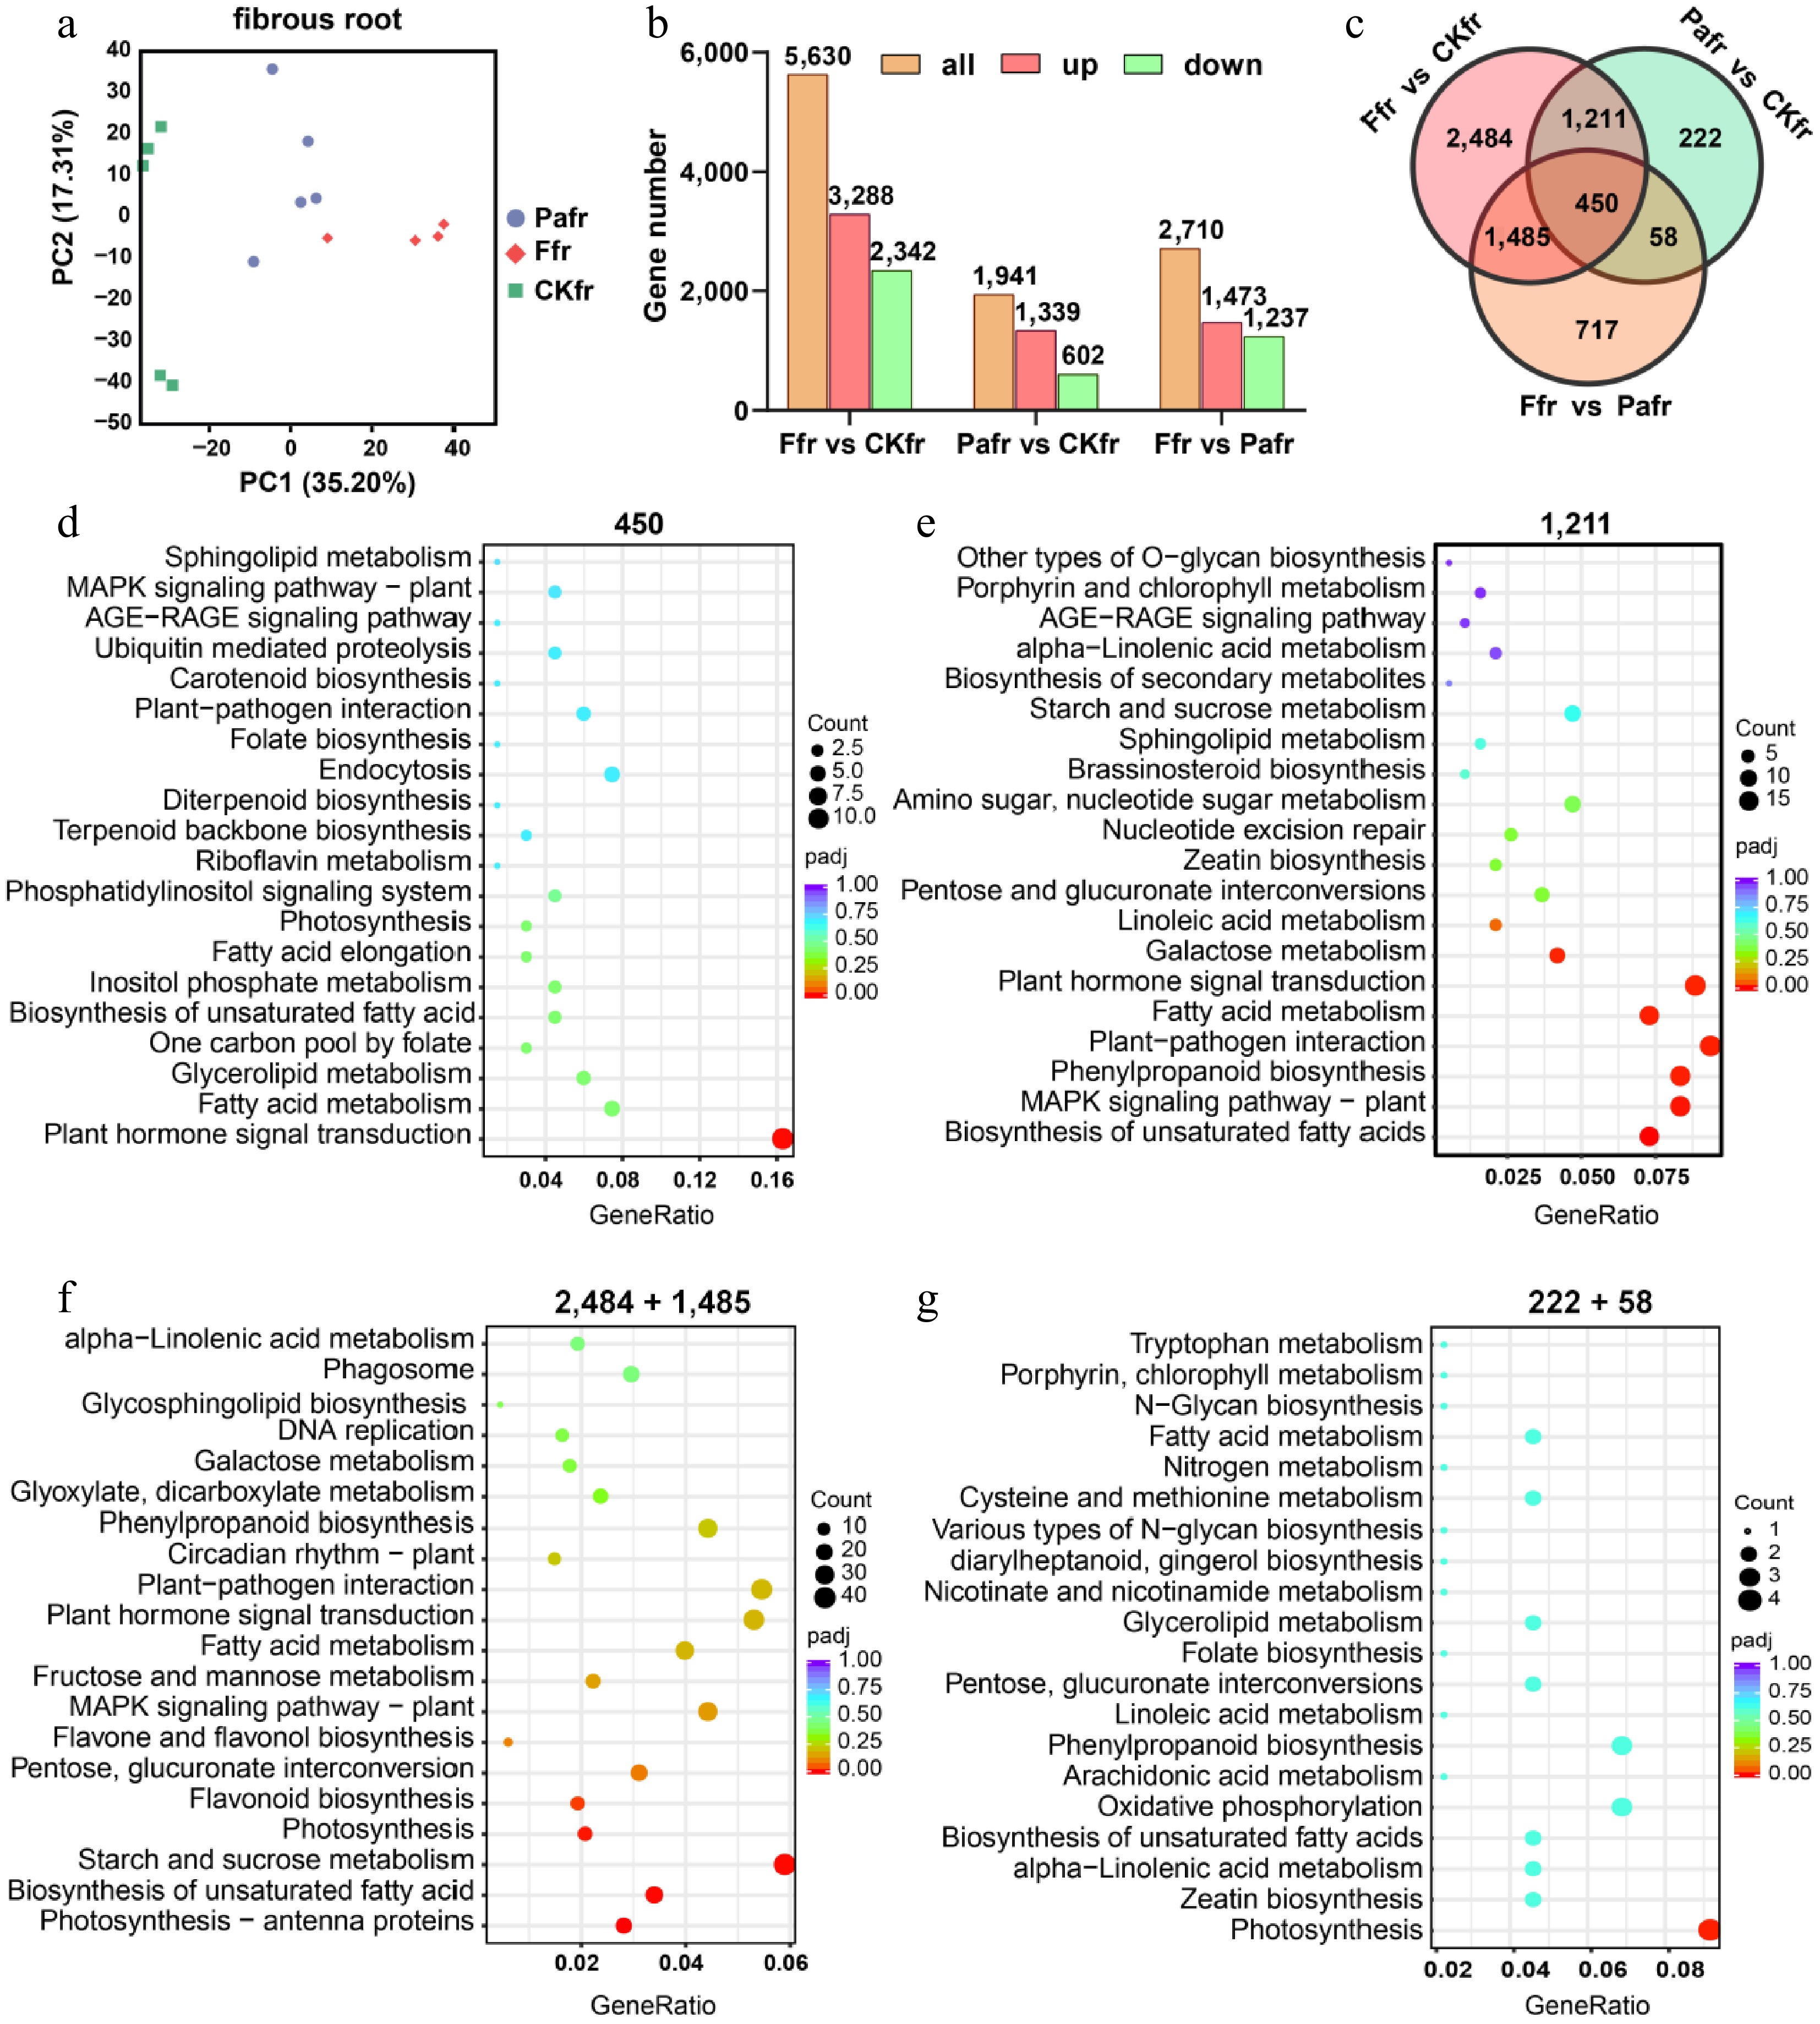
Figure 7.
Differentially expressed genes (DEGs) and enrichment analysis of Kyoto Encyclopedia of Genes and Genomes (KEGG) pathways in A. lancea fibrous roots affected by F9 and Pa inoculation. (a) Principal component analysis (PCA) of transcriptional data from samples treated with F9 inoculation (Ffr), Pa inoculation (Pafr), and without inoculation (CKfr). (b) Statistical analysis of DEGs (p < 0.05, |Log2Foldchange| > 1) from comparisons of Fr vs CKfr, Pafr vs CKfr, and Ffr vs Pafr, identifying a total of 6,627 DEGs. (c) Venn diagram classifying DEGs into seven groups based on their expression patterns across the three treatments. (d)–(g) Kyoto Encyclopedia of Genes and Genomes (KEGG) pathway enrichment analysis was performed on six of the seven categories, representing 1,211, 450, 2,484 and 1,485, 222, and 58 DEGs. The 1,211 DEGs show similar expression levels between the F9 and Pa inoculation groups; 450 DEGs show significant differences between these groups; 2,484 and 1,485 DEGs are specifically affected by F9 but not by Pa inoculation; 222 and 58 DEGs are specifically affected by Pa but not by F9 inoculation.
-
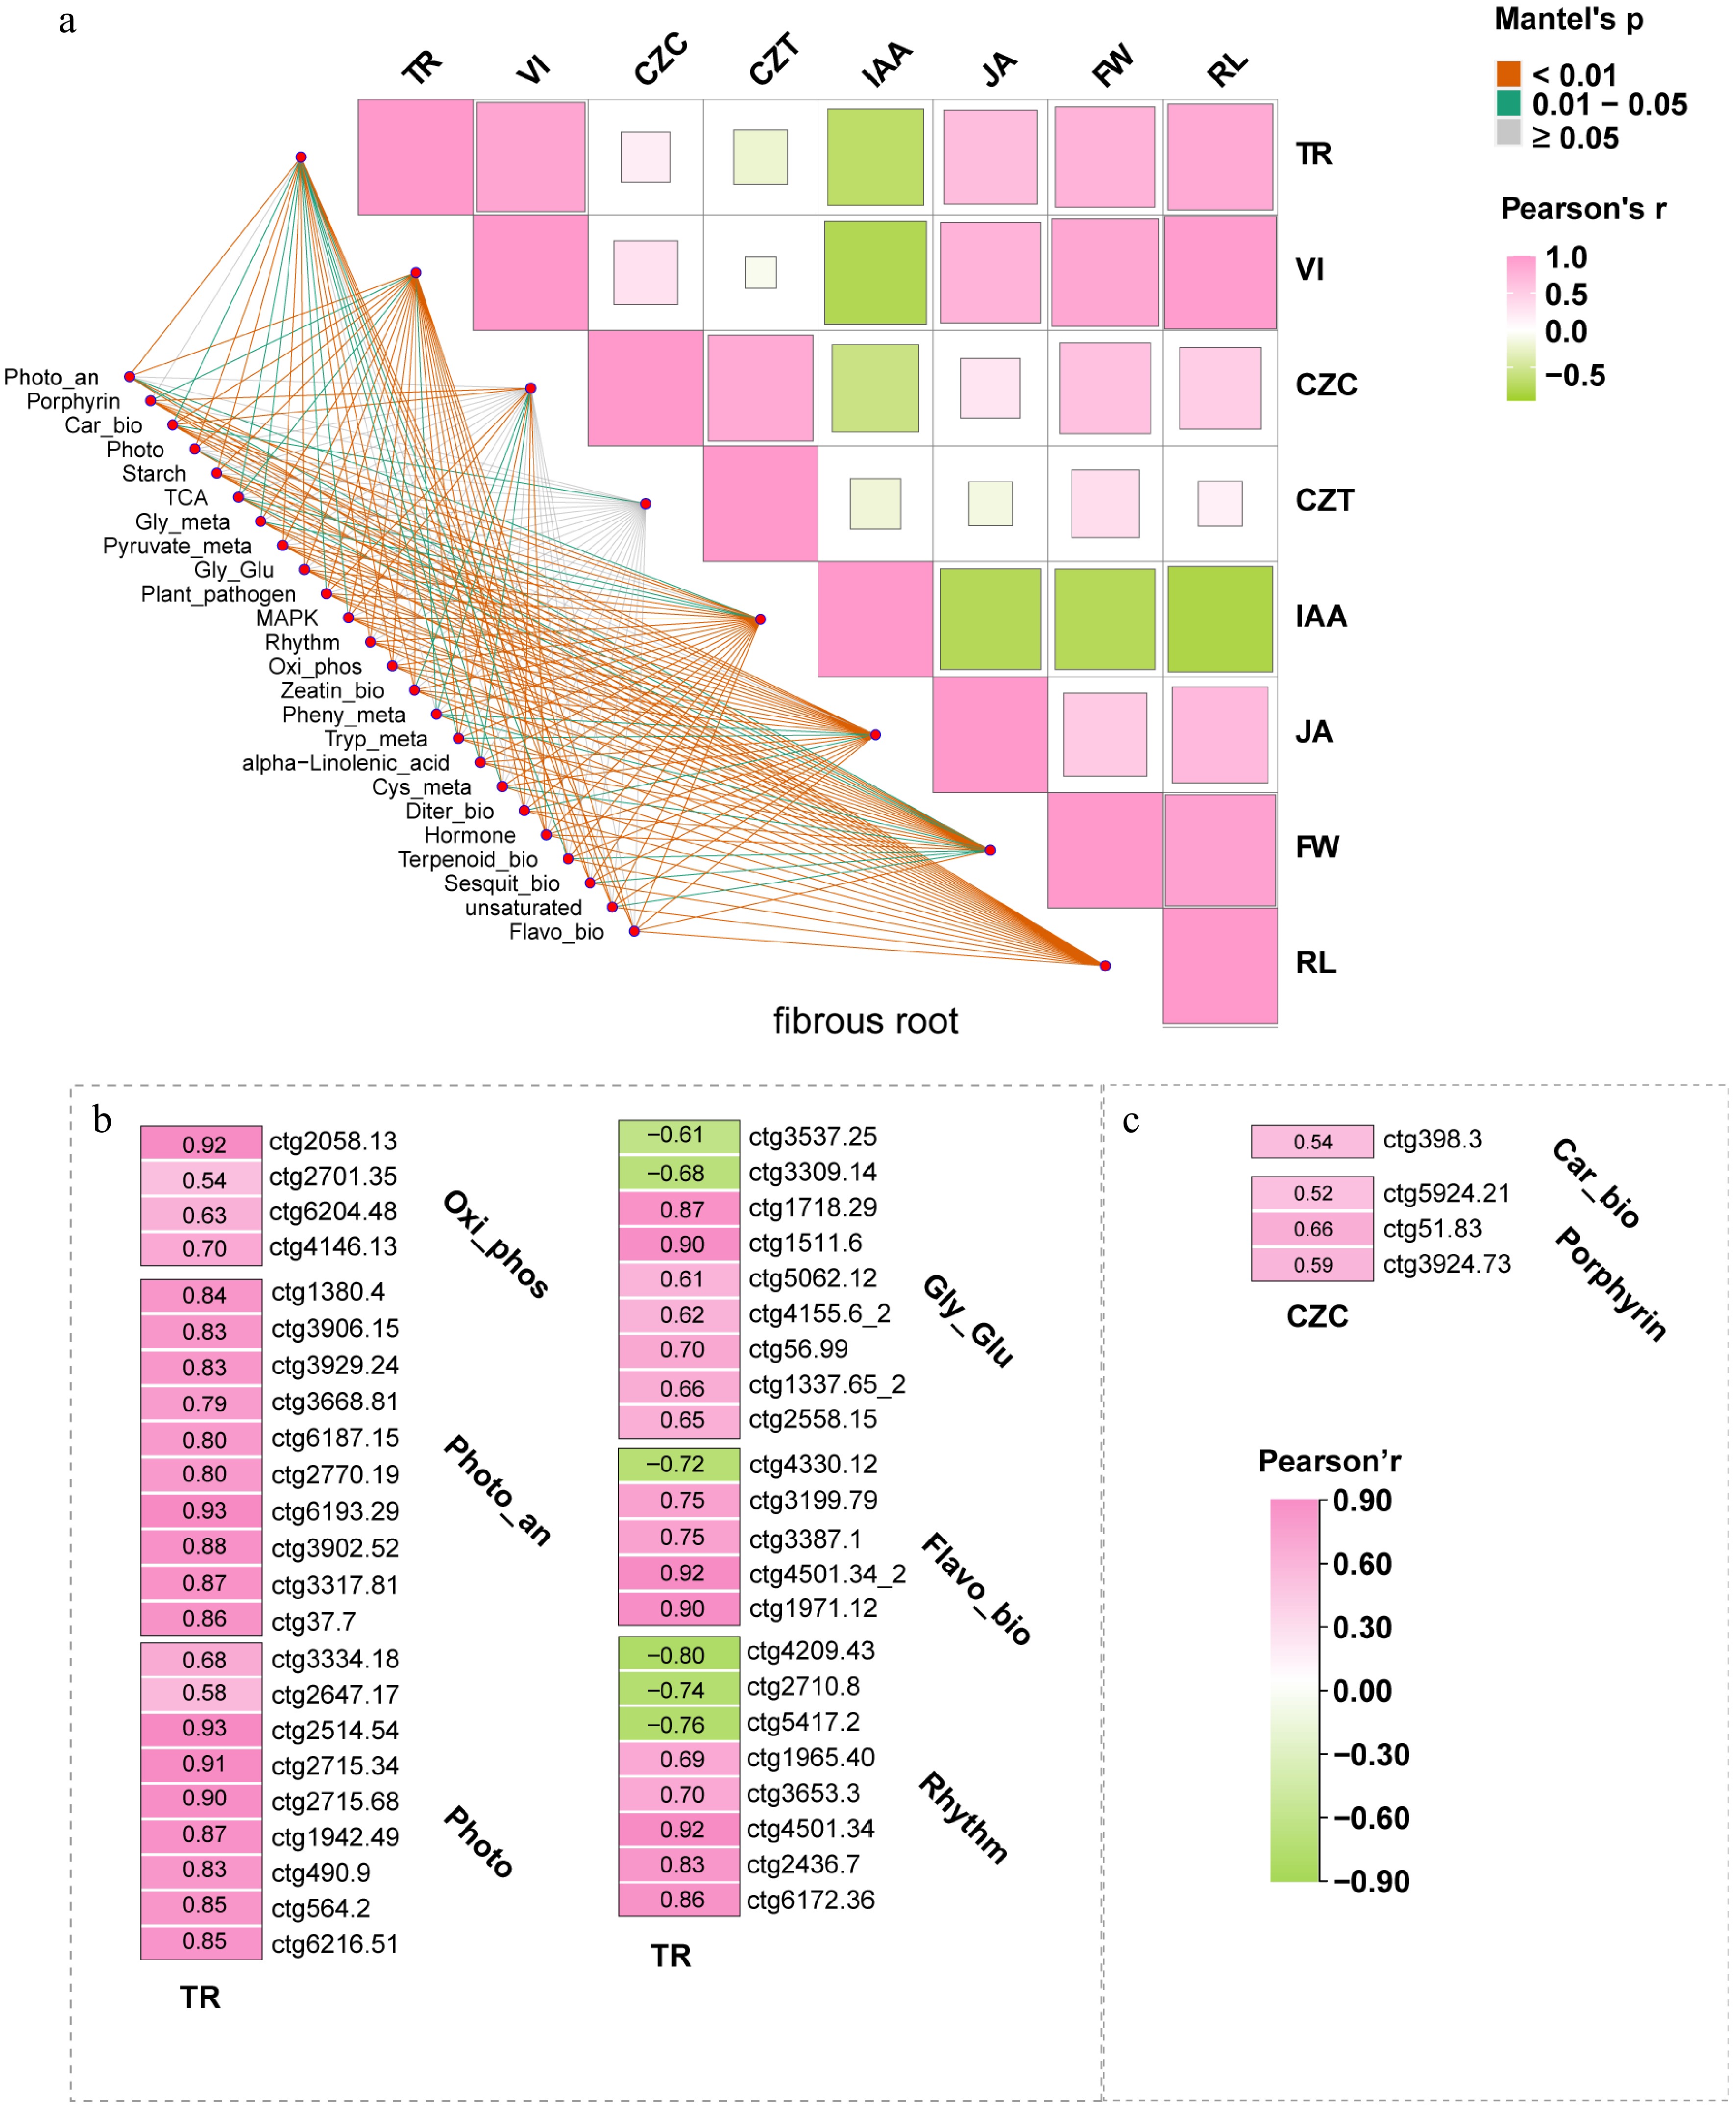
Figure 8.
(a) Matrix correlation analysis between traits, including metabolites and growth phenotypes, in response to F9 and Pa inoculation, and the KEGG enrichment pathway in A. lancea fibrous roots. (b) Pearson correlation analysis was also performed between two key metabolites (TR and CZC) and the genes within the screened KEGG enrichment pathway in the fibrous roots of A. lancea. Abbreviation: TR: Tricin-7-O-Glucoside; VI: Vicenin-3; CZC: Hinesol; CZT: Atractylon; IAA: Indole-3-acetic acid; JA: Jasmonic acid; FW: fresh weight of the whole plant; RL: root lengths; Oxi_phos: Oxidative phosphorylation; Photo-an: Photosynthesis-antenna proteins; Photo: Photosynthesis; Gly_Glu: Glycolysis/Gluconeogenesis; Flavo_bio: Flavonoid biosynthesis; Rhythm: Circadian rhythm-plant; Car_bio: Carotenoids biosynthesis; Porphyrin: Porphyrin and chlorophyll metabolism.
-

Figure 9.
(a) The different transcription families based on the number of transcriptional regulatory genes from differentially expressed genes (from high to low). The number of transcription factors in each family was recorded. (b) Correlation analysis was performed between traits and the express level of transcriptional factors. 2H_MeJA: Methyl dihydrojasmonate; GM: Germacrone; CZC: Hinesol; AYC: β-eudesmol; CZT: Atractylon; CZS: Atractylodin; IAA: Indole-3-acetic acid; MeSA_glu: Methylsalicylate-2-O-glucoside; PA: Pomolic acid; FW: fresh weight of the whole plant; RL: root lengths; TR: Tricin-7-O-Glucoside; RL: root lengths; VI: Vicenin-3; JA: Jasmonic acid.
-
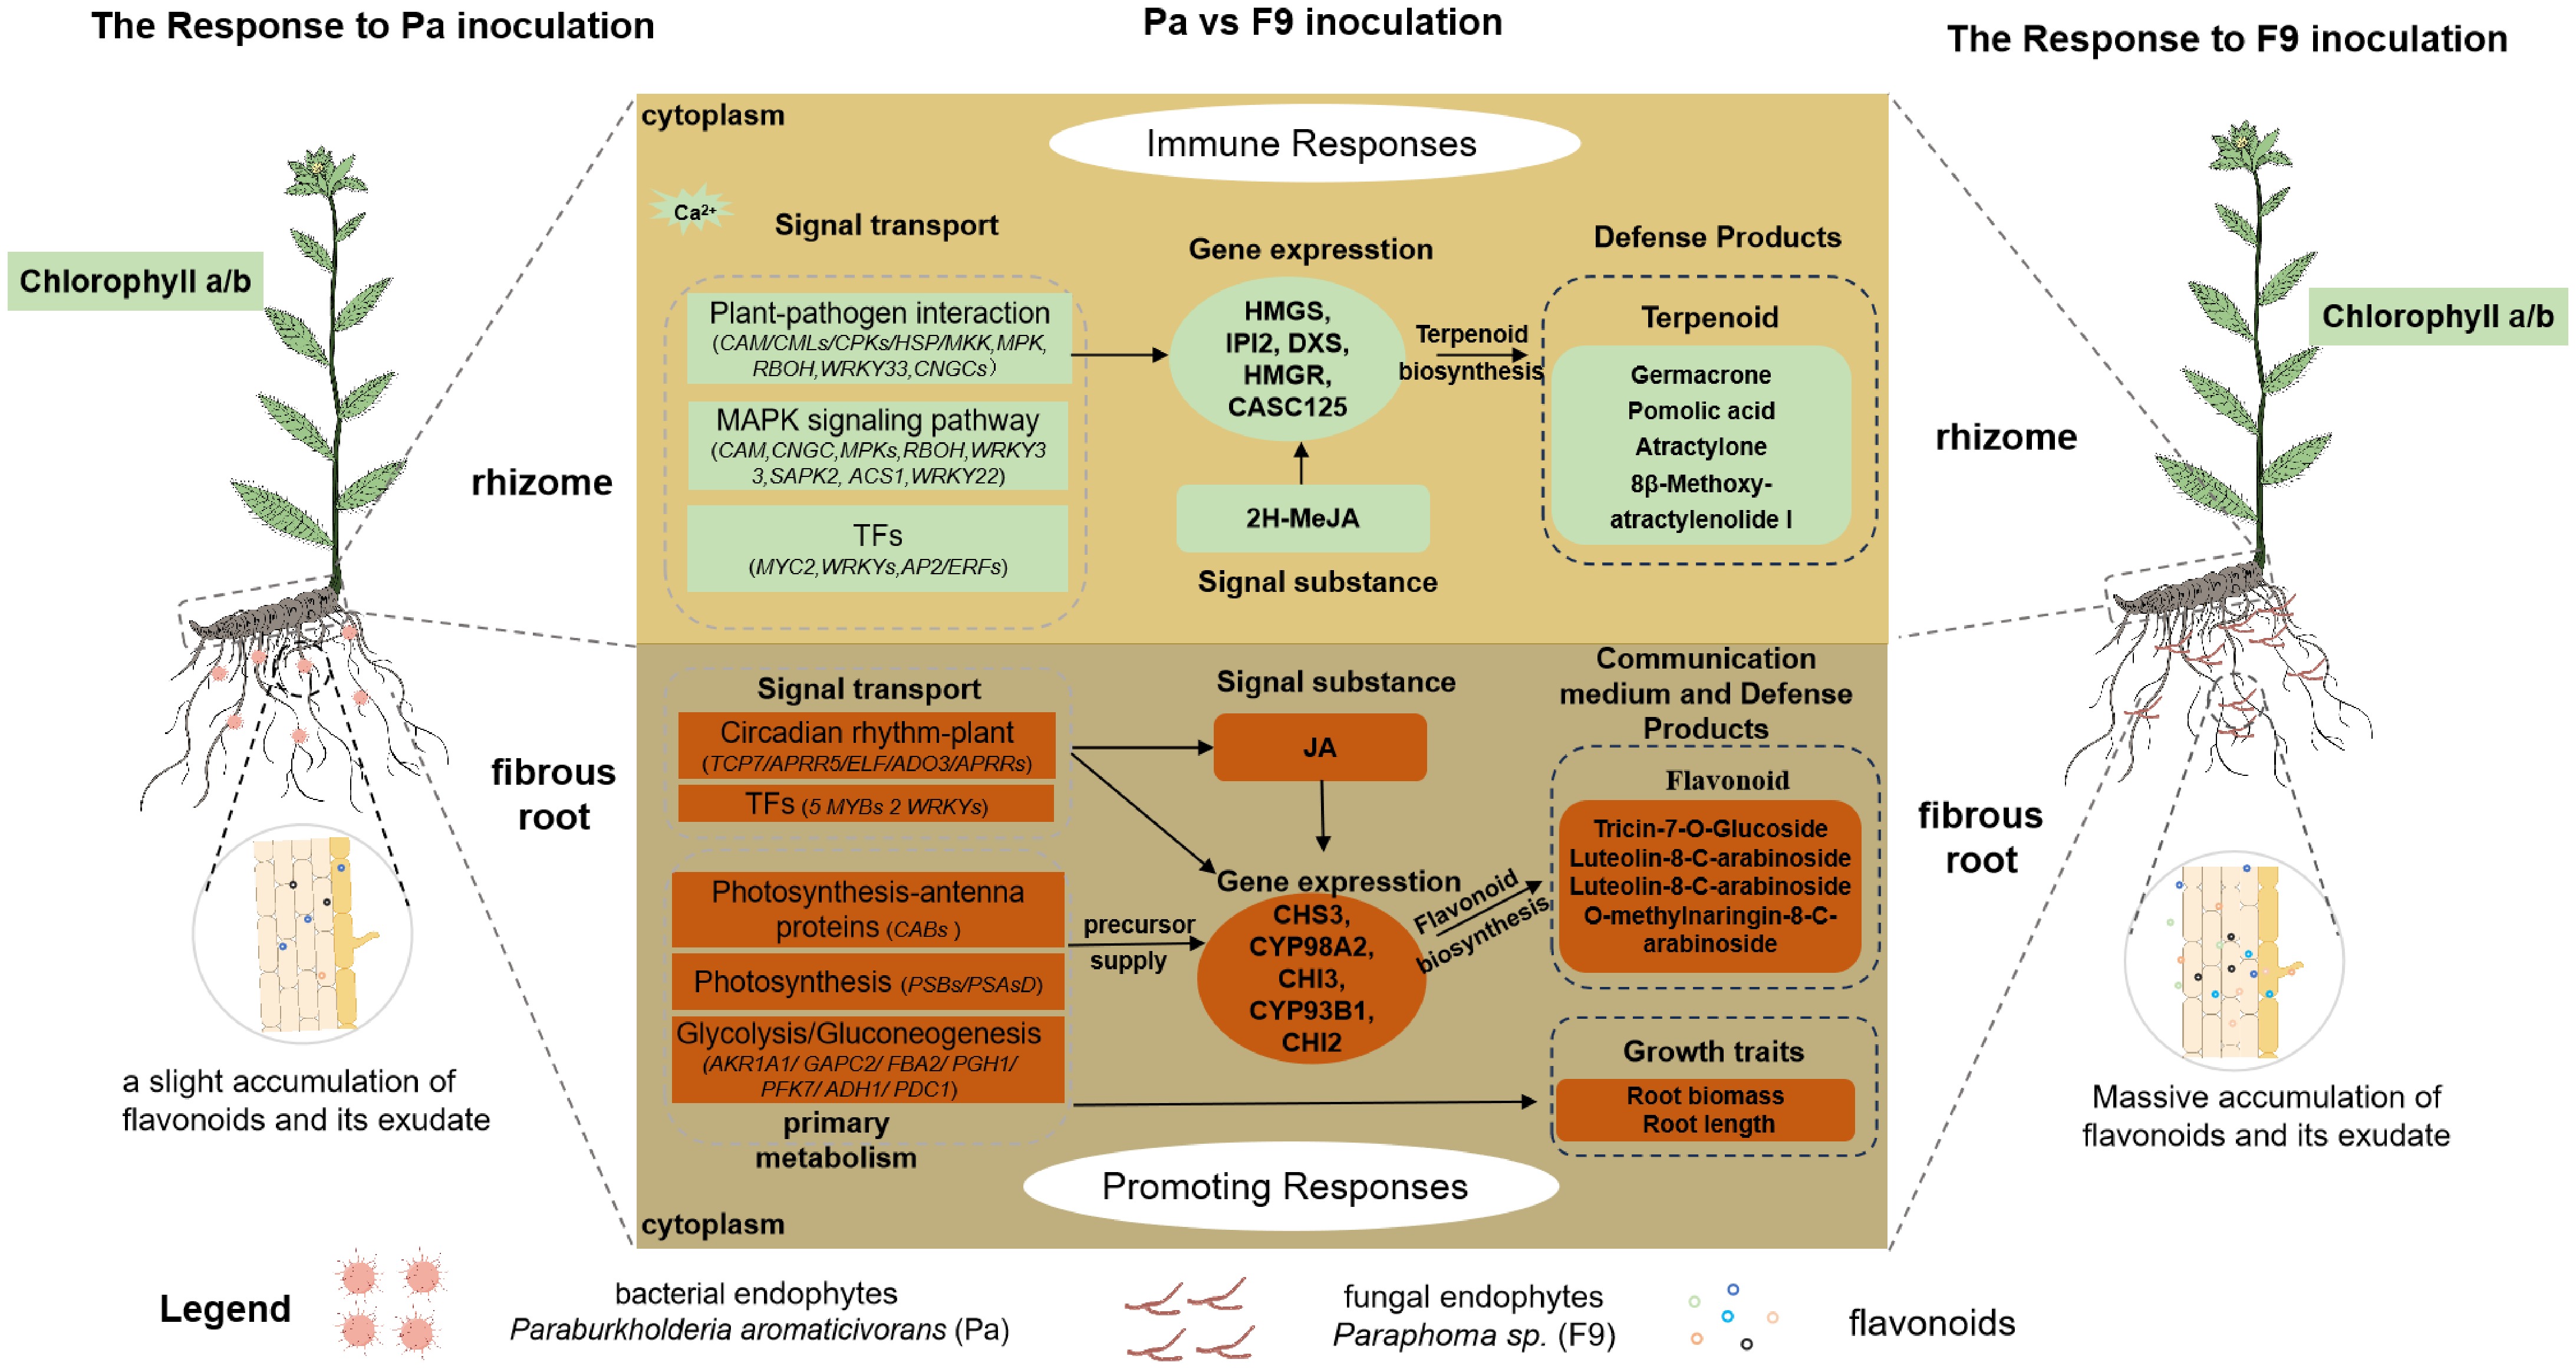
Figure 10.
Simplified schematic summary of the differential mechanisms promoting host growth and metabolism in A. lancea at the transcriptional level in response to the endophytic fungus Paraphoma sp. (F9) and the endophytic bacterium Paraburkholderia aromaticivorans (Pa). The white oval box represents the primary transcriptional responses, including immune and growth-promoting responses, following endophyte inoculation. The mint green box highlights a significant increase in immune response and terpenoid production in A. lancea rhizomes after inoculation with F9 or Pa, compared to the control (F9-free and Pa-free inoculation). However, the magnitude of the immune response is similar between the F9 and Pa treatments. The brownish-red box indicates that F9 inoculation leads to stronger signal transduction, primary metabolism, gene expression, flavonoid accumulation, and overall growth compared to Pa inoculation. The black solid arrow represents promotion. TFs: transcription factors, JA: jasmonic acid, 2H_MeJA: methyl dihydrojasmonate.
Figures
(10)
Tables
(0)