-
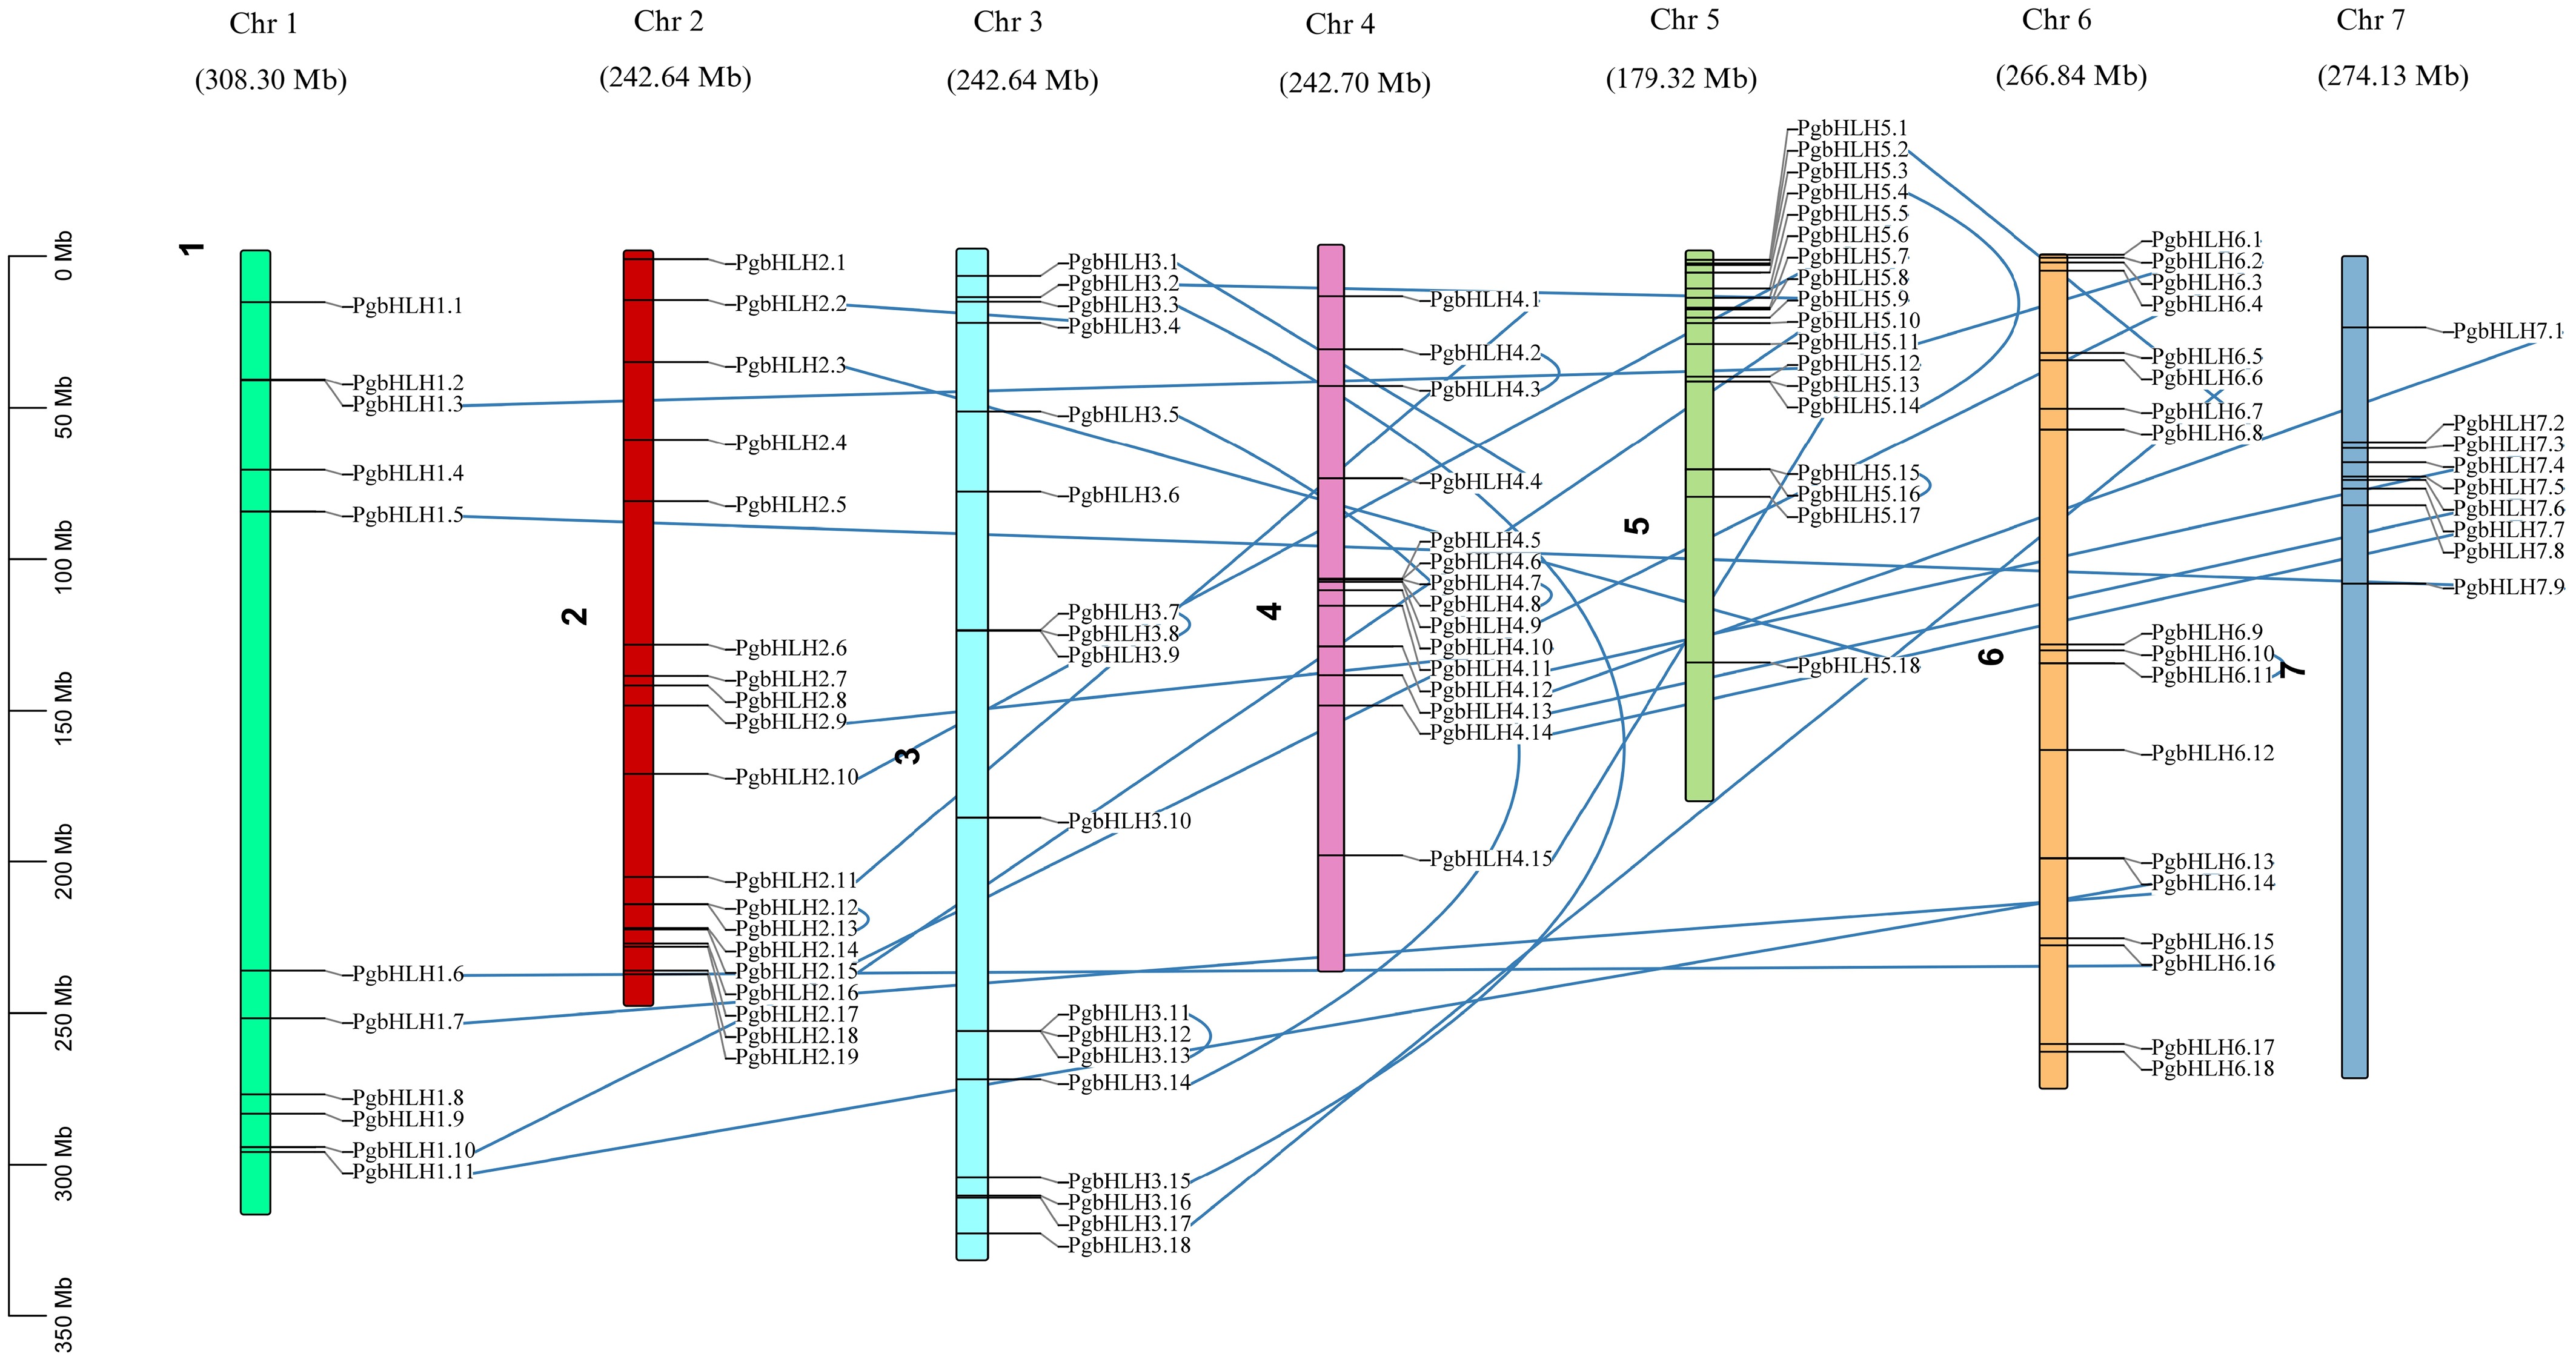
Figure 1.
Arrangement of 110 PgbHLH genes on the seven chromosomes of Pennisetum glaucum. Chromosomal distribution map represented as colored bars, with chromosomes showing different lengths in million base pairs (Mb). The PgbHLH gene distribution is based on the exact location on their respective chromosomes. The blue lines in the map indicate the paralogous genes, highlighting the presence of a gene duplication event within the pearl millet genome.
-
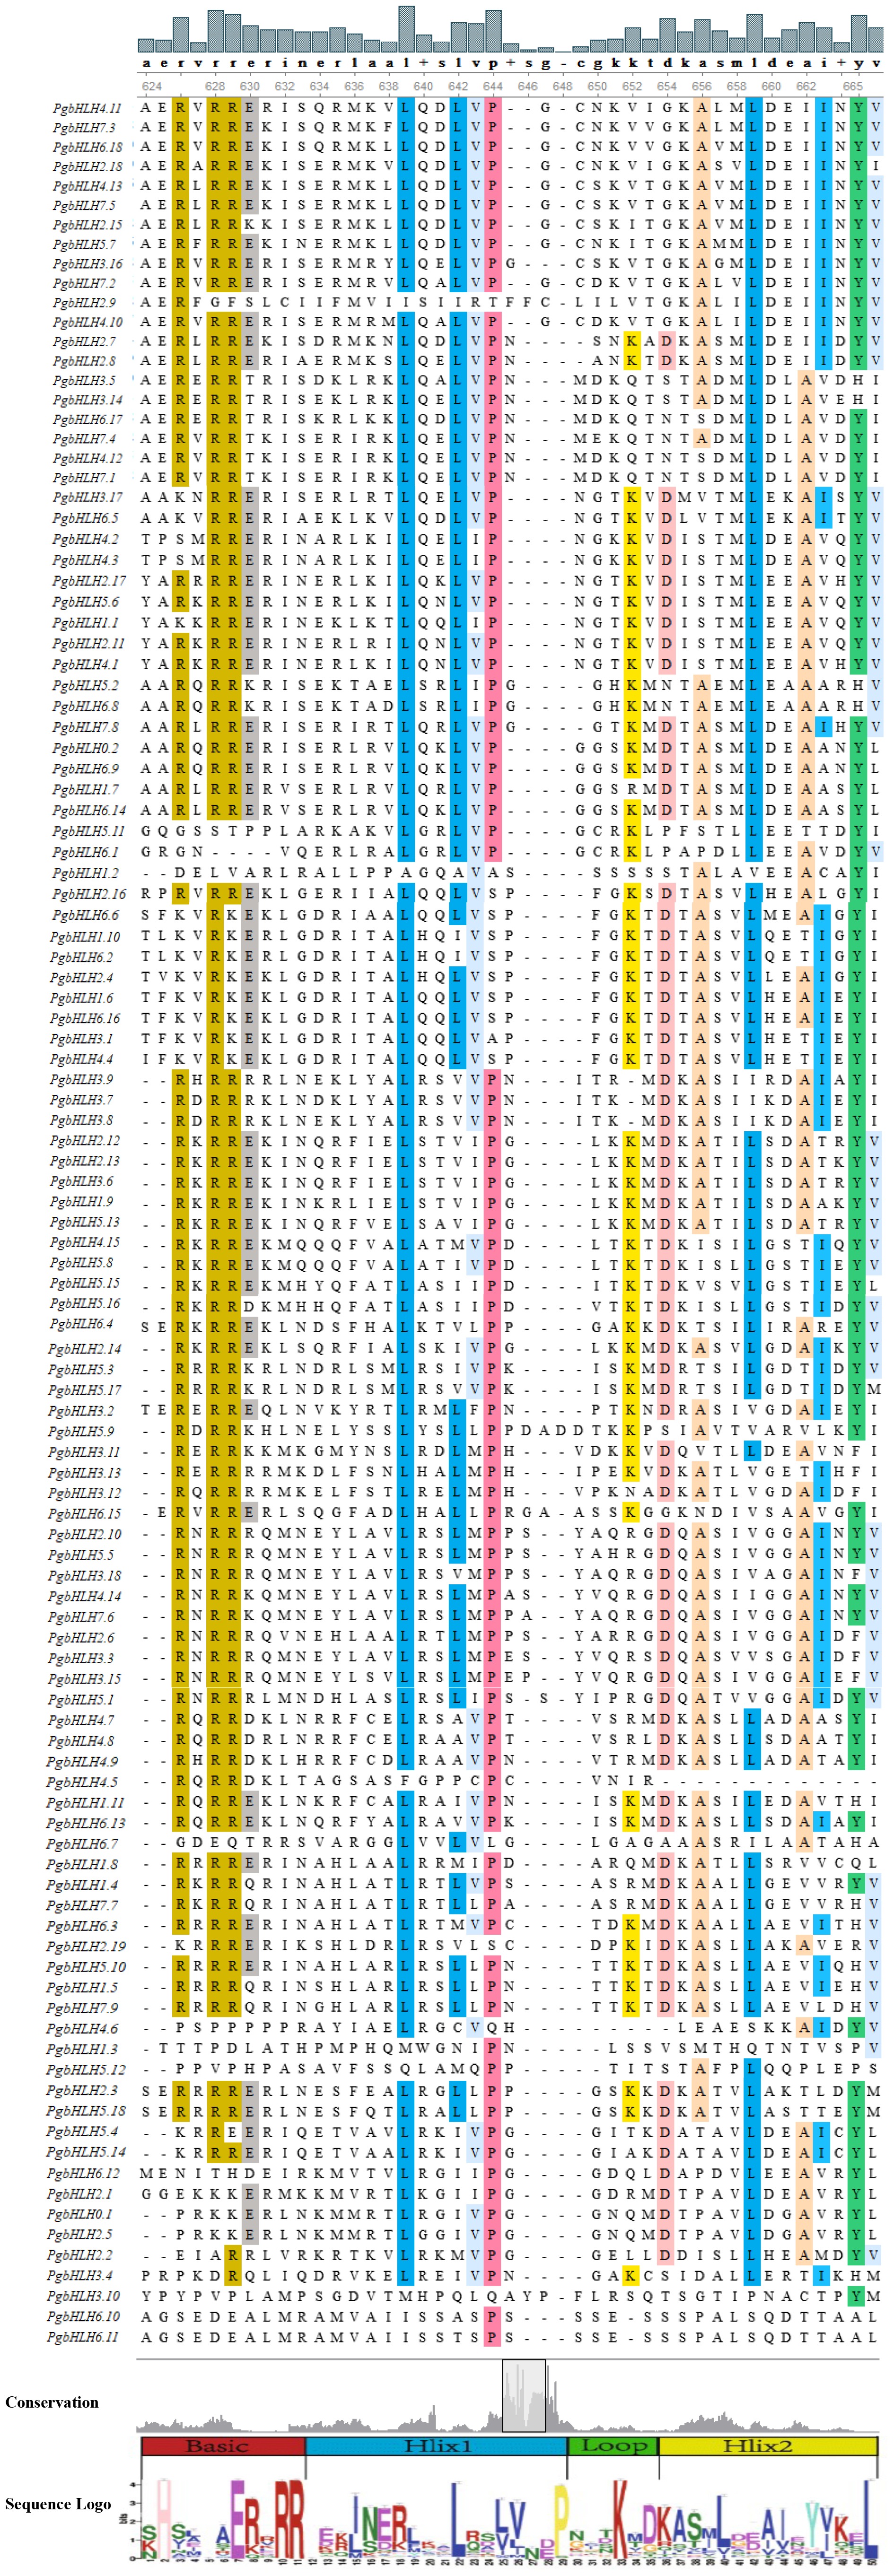
Figure 2.
Multiple sequence alignment of pearl millet PgbHLH TFs. Alignment was created by using the online program CLUSTAL W and displayed using UniGene. The conserved amino acid sequences are shown in different colors. The sequence logo illustrates the conservation of the domain among all 110 PgbHLH genes.
-

Figure 3.
Phylogenetic distribution and protein motif analysis of PgbHLH in pearl millet. (a) Phylogenetic tree is classified into 12 distinct clusters (cluster-I to cluster-XII). All the clusters are shown in different colors. (b) The conserved motifs are arranged according to phylogenetic relationships. (c) The legends list contains 20 different motifs, represented by different colors, allowing the identification of specific patterns.
-

Figure 4.
Gene structure representing the exon-intron structure of the PgbHLHs genes differentiated by the subgroups (cluster-I to cluster-XII). Gene structure display server was used to perform the analysis. CDS shown in red color (exons), dark black lines represent the introns, and dark blue color boxes depict the upstream/downstream regions. Moreover, the x-axis at the bottom provides the scale bar representing the length of the PgbHLH genes. The scale is marked with a numerical value indicating the size in Kilobase pairs (Kb).
-
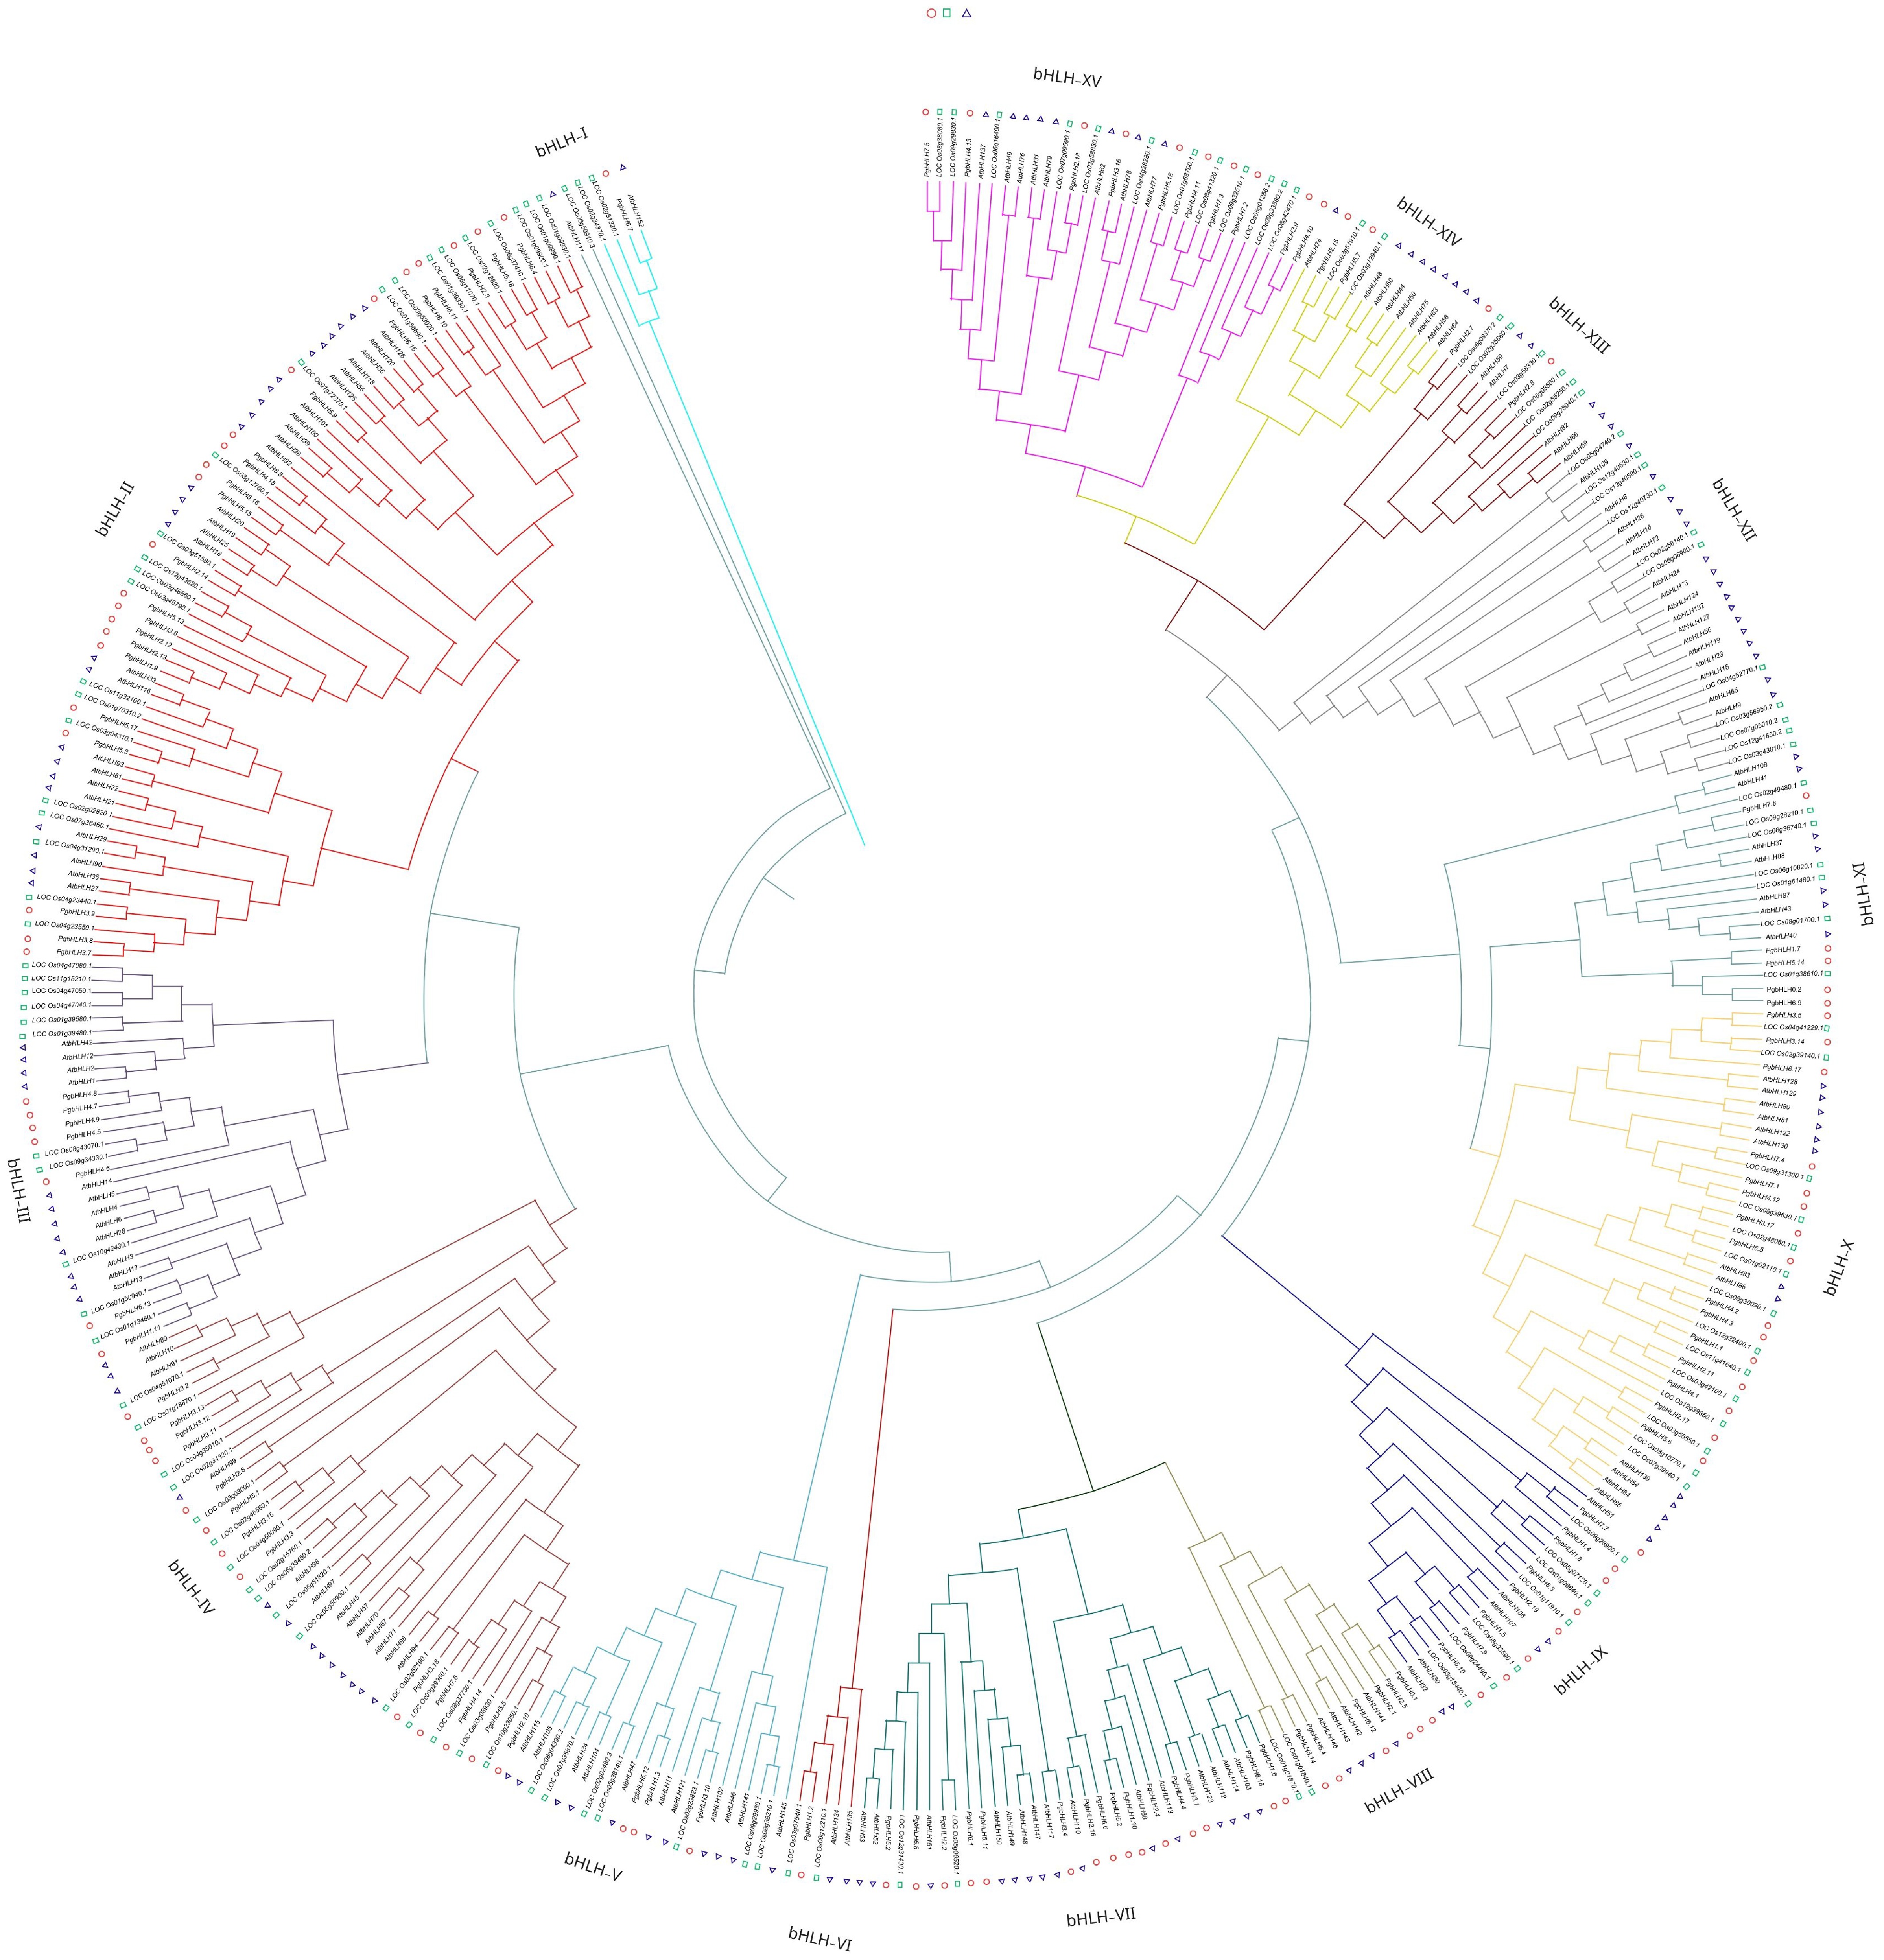
Figure 5.
Multi-species neighbor-joining phylogenetic tree was constructed using Clustal Omega, 1,000 bootstrap replicates to evaluate the validity of the tree, containing bHLH genes of Pennisetum glaucum (110 PgbHLH), Oryza sativa (139 OsbHLH), and Arabidopsis thaliana (145 AtbHLH). All of the bHLH genes were classified into 15 subgroups (bHLH-I to bHLH-XV) highlighted by the different colors in the tree. Circles represent Pennisetum glaucum, triangles represent Arabidopsis thaliana, and squares represent Oryza Sativa.
-

Figure 6.
Collinearity analysis of bHLH genes between Pennisetum glaucum, Setaria italica, Oryza sativa, Zea mays, Solanum lycopersicum, and Arabidopsis thaliana. The green color shows the chromosomes of pearl millet, and their number is mentioned above the boxes. Different colored boxes show the different chromosomes within each species. Red colored lines show the orthologous pairs between the species, and grey lines represent collinearity blocks.
-

Figure 7.
The promoter putative CREs of the PgbHLH, gene which is represented by different colored boxes along the horizontal line, with the gene names listed on the left side of the figure. The top right corner represents the key that explains the different color boxes used to represent various types of putative CREs.
-
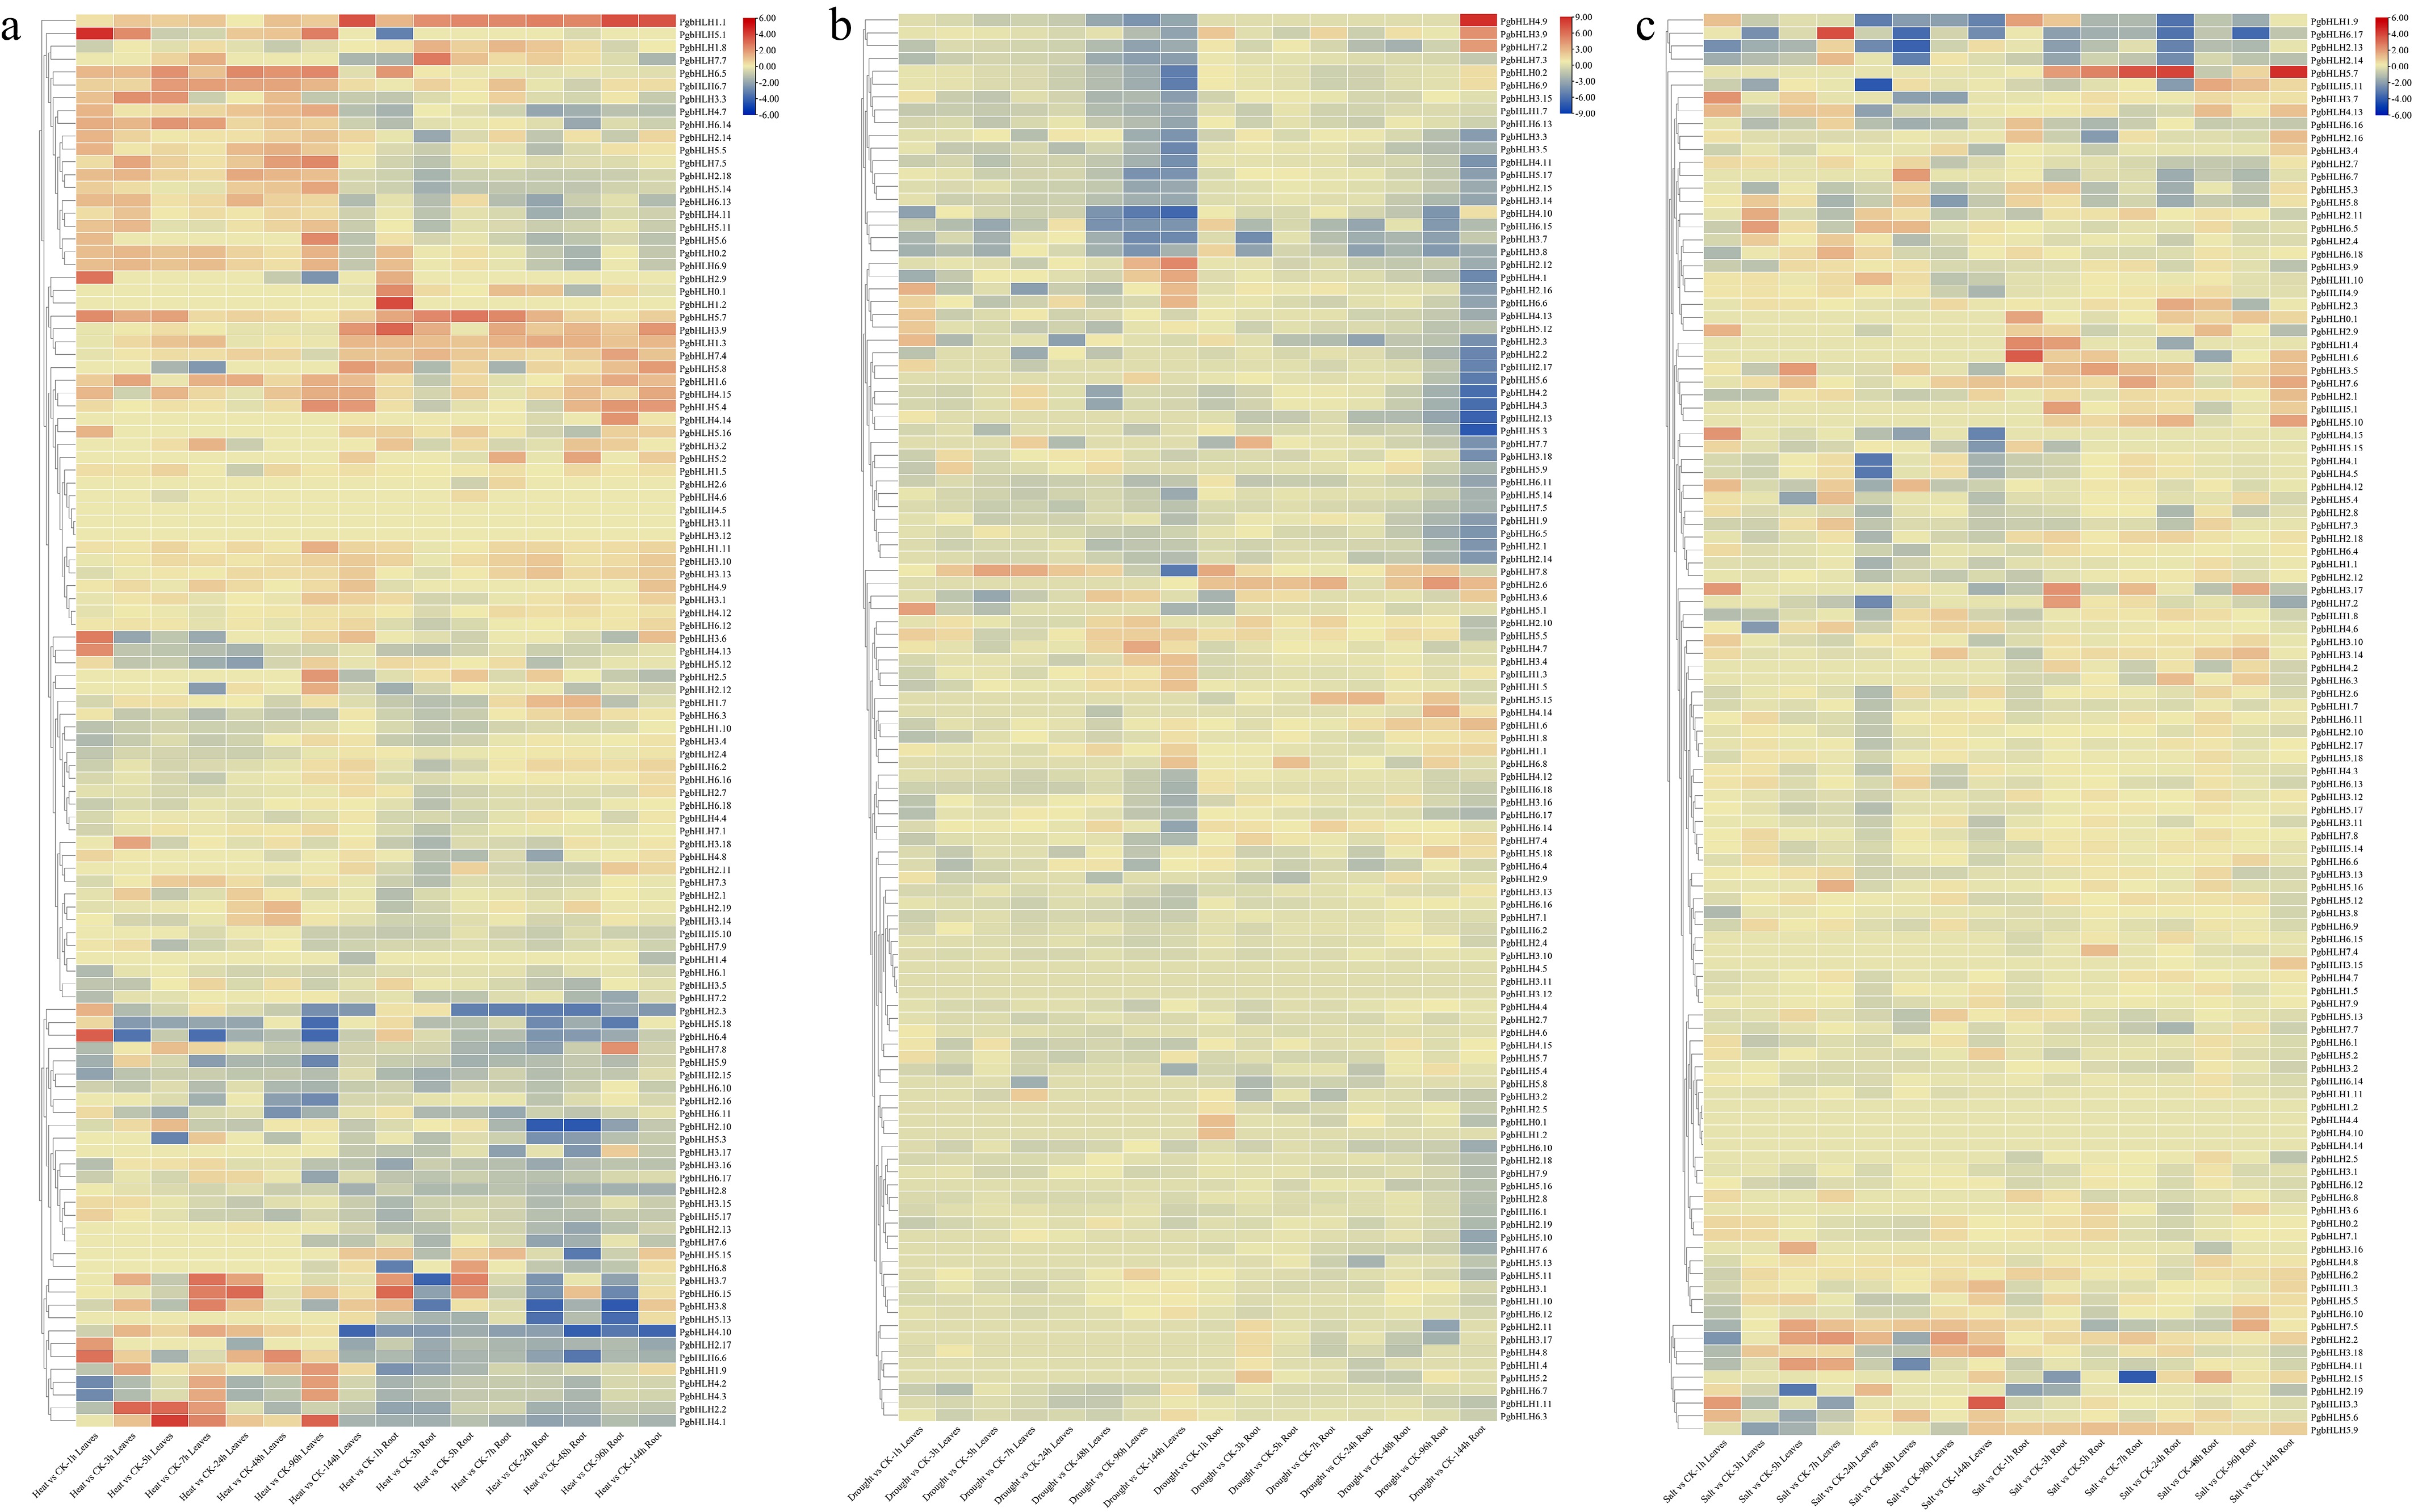
Figure 8.
Expression analysis of 110 PgbHLH genes at various time points (1, 3, 5, 7, 24, 48, 96, and 144 h) compared with control (CK), heat maps as per the k-means clustering. Clustering of PgbHLH genes in the rows under different abiotic stresses (a) heat stress, (b) drought stress, and (c) salinity stress. Scale on the upper right corner represents the value of expressions, which shows the value of decreased expression level in blue color and increased expression level in red color.
Figures
(8)
Tables
(0)