-
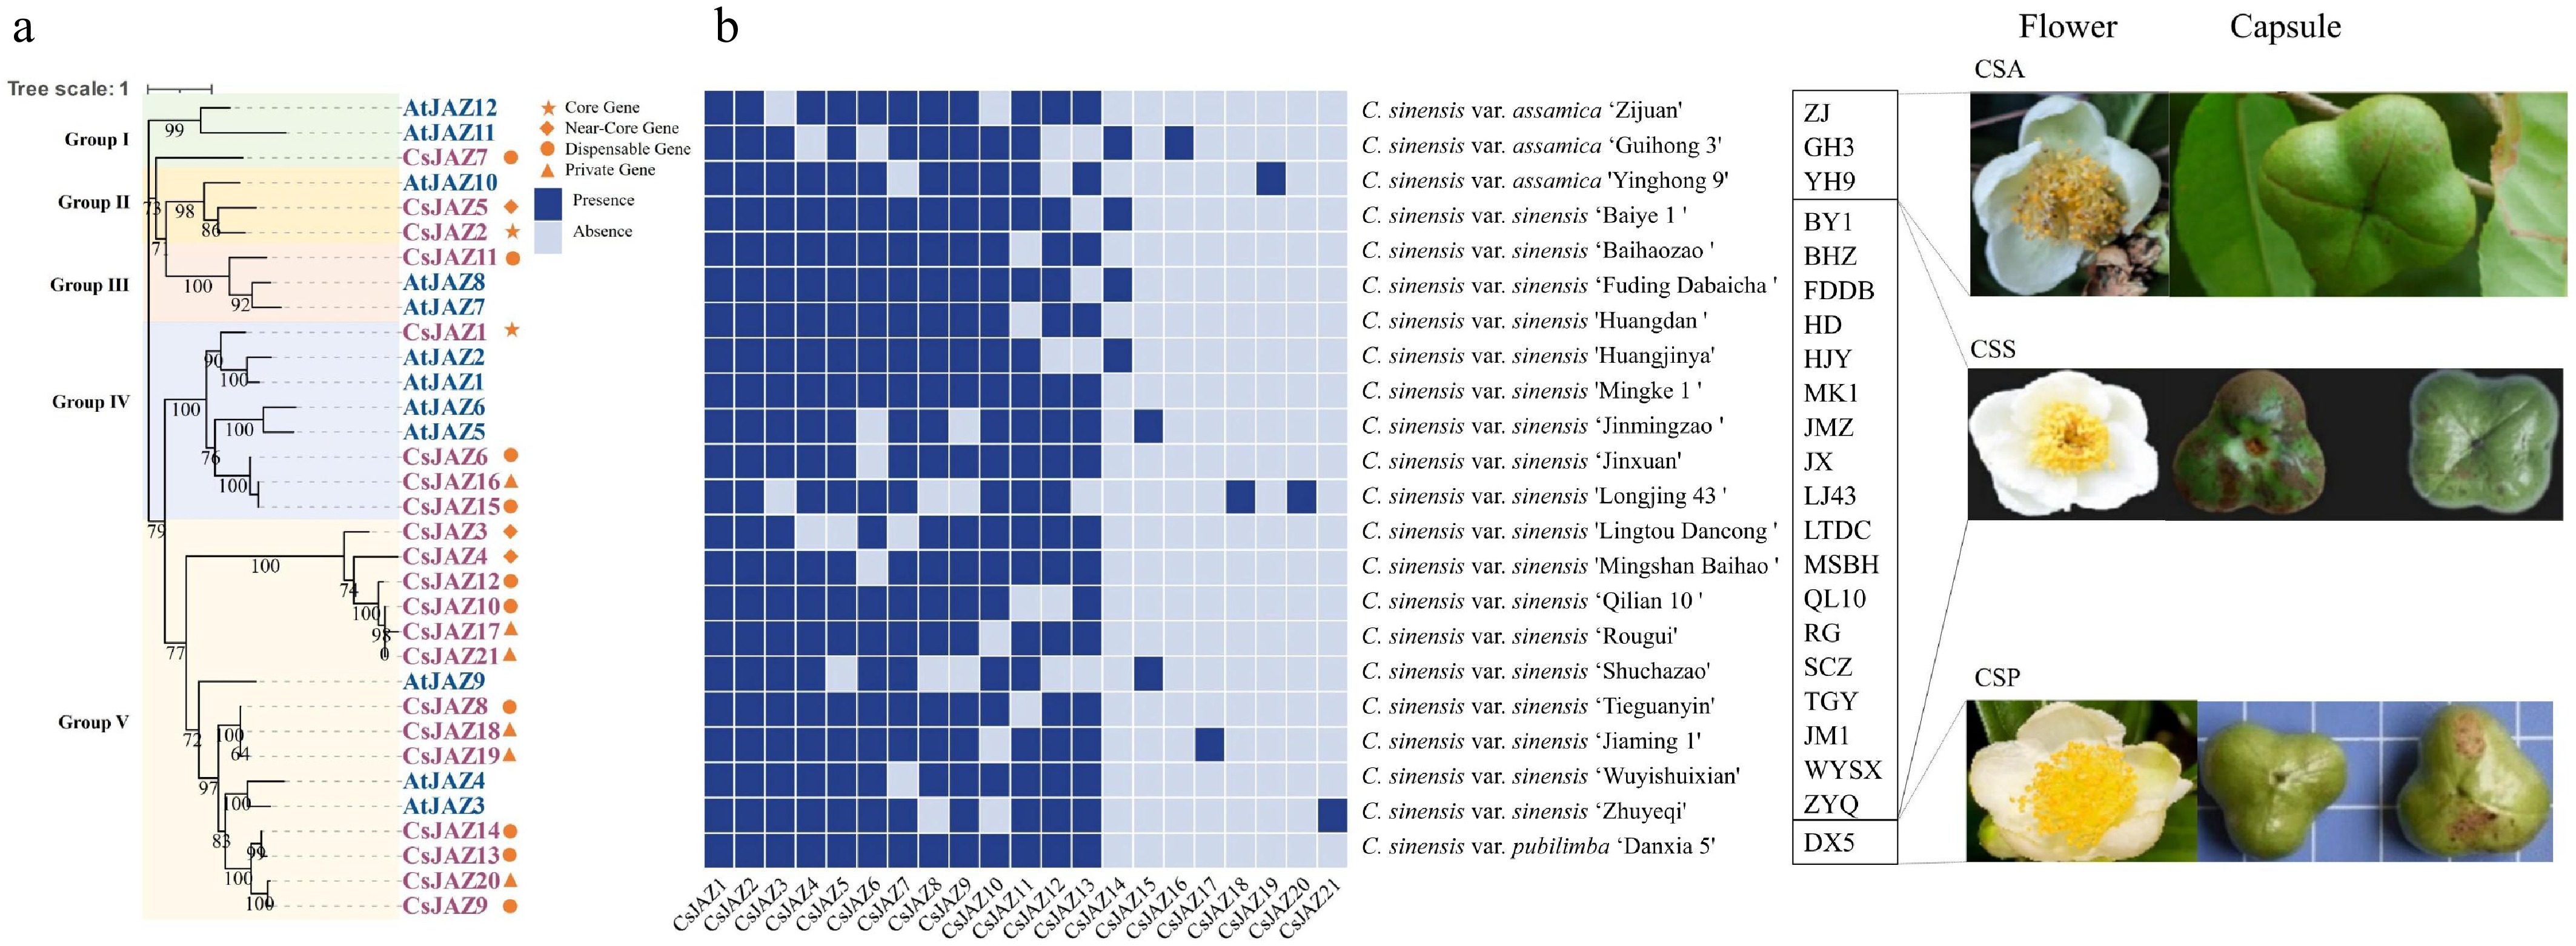
Figure 1.
(a) Phylogenetic tree of JAZ gene family in tea plant and Arabidopsis. (b) Heatmap of the presence and absence of 21 JAZs in 22 tea plant cultivars.
-
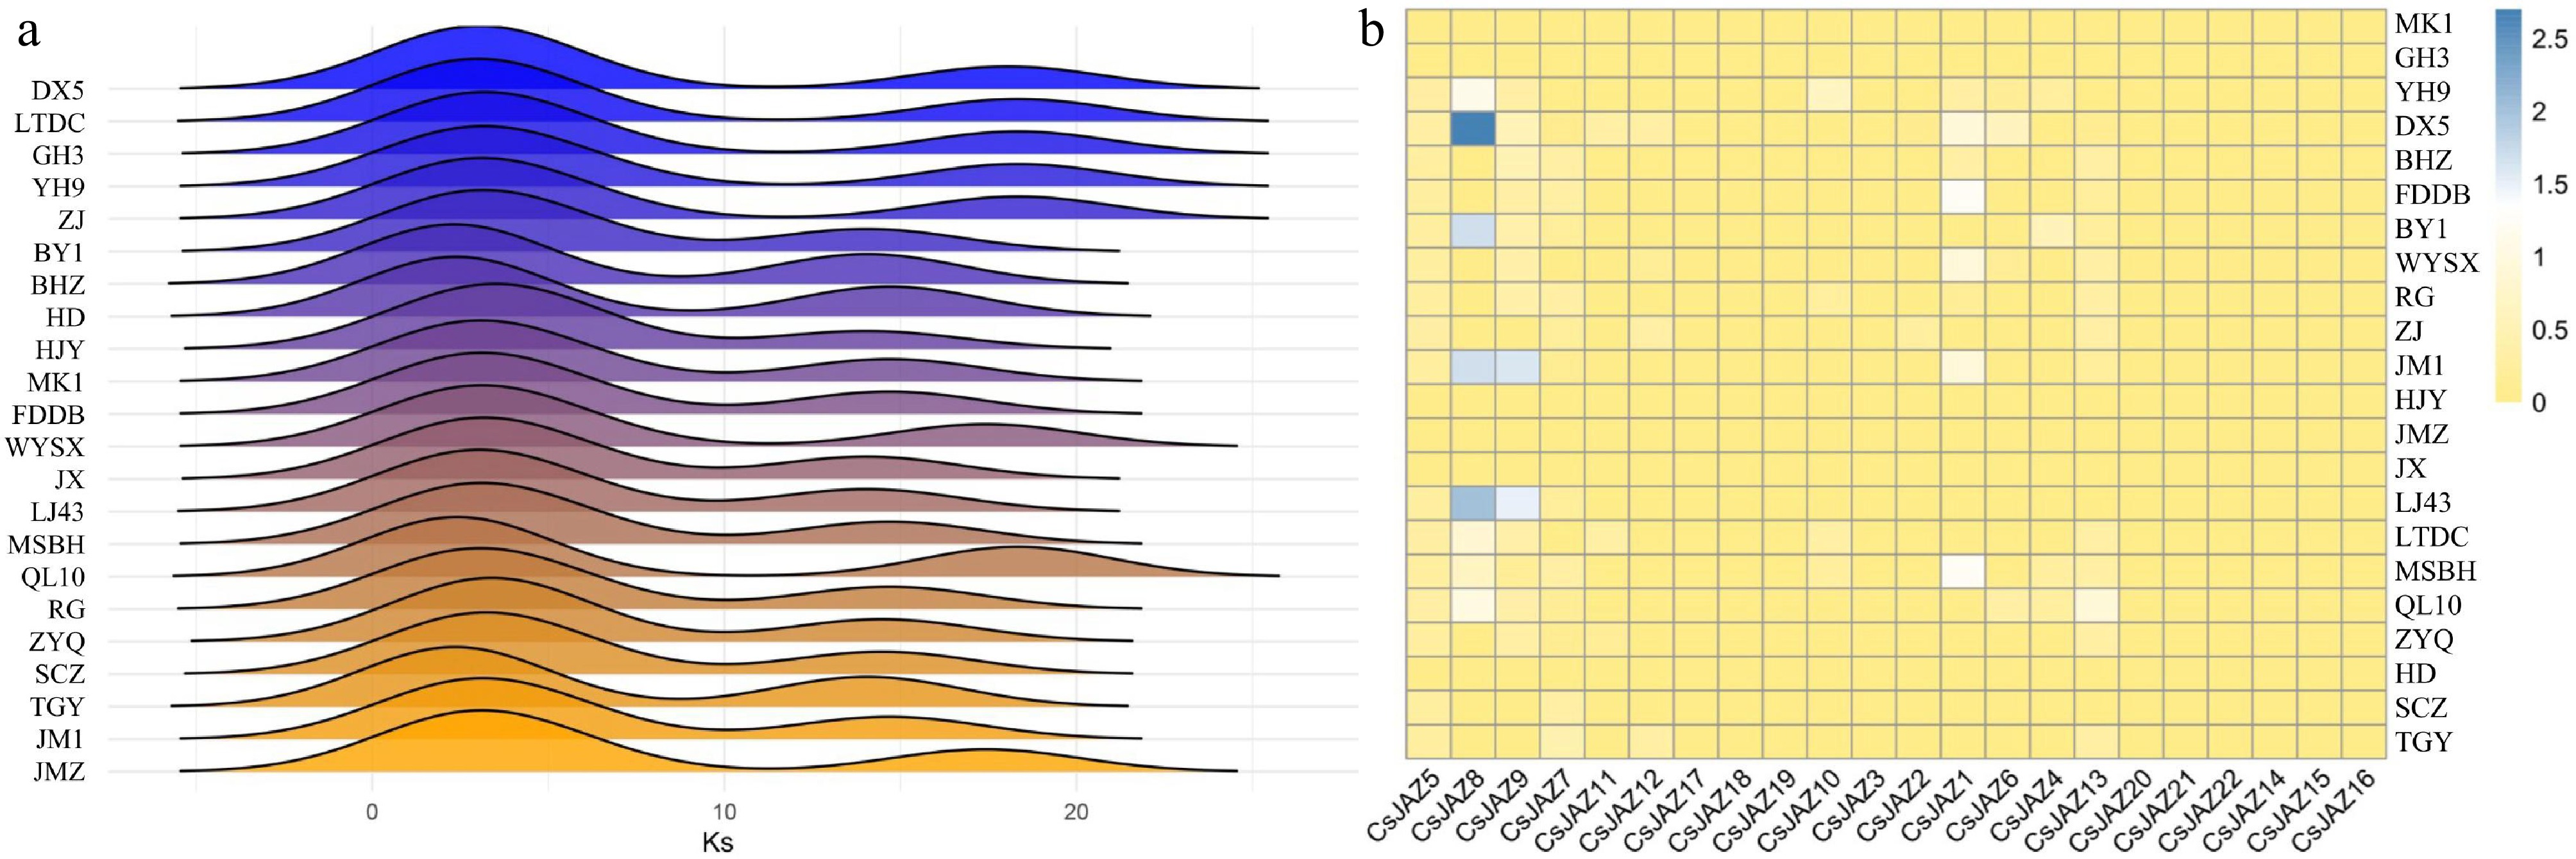
Figure 2.
Ka/Ks values of CsJAZ. (a) Distribution of Ks values of CsJAZ in 22 tea plant cultivars. (b) Heatmap of the frequency of occurrence of different tea plant cultivars at each JAZ.
-
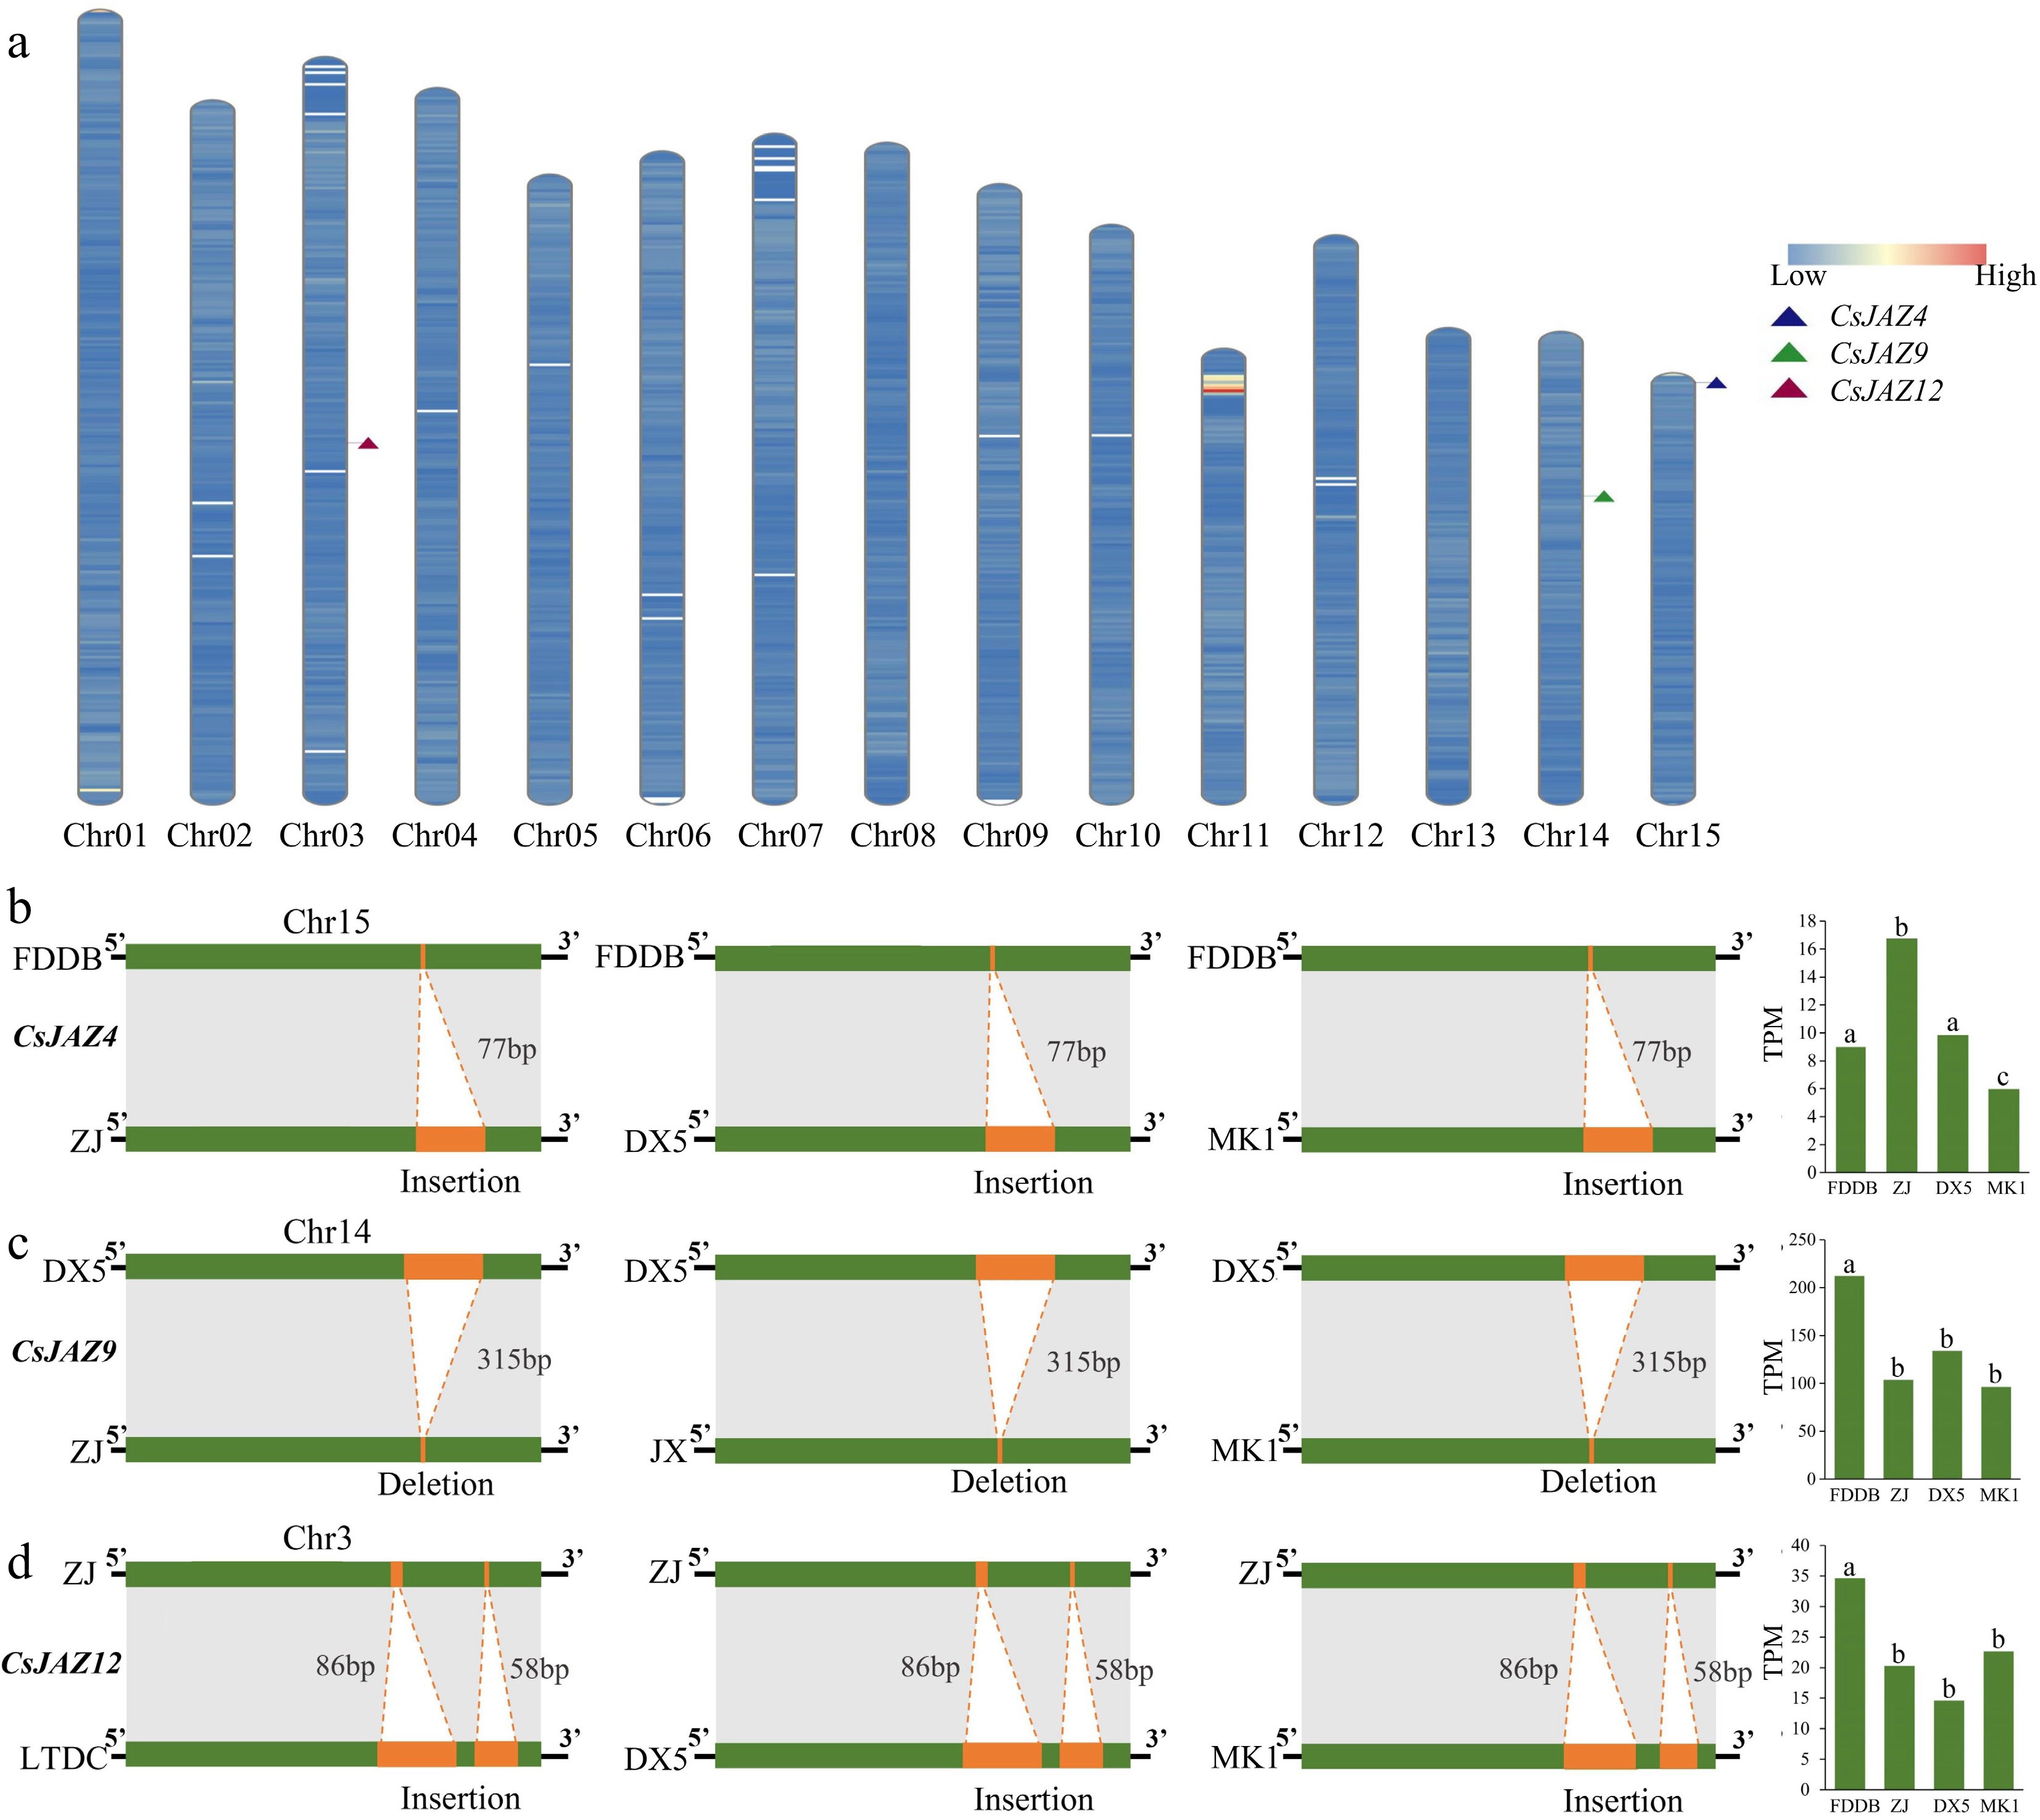
Figure 3.
Effect of SVs on genes. (a) Location of genes on chromosomes, using the 'MK1' genome as a template. (b) Effect of SV insertion and deletion on CsJAZ4 and significant effect of SVs on the expression of JAZ4 in different tea plant cultivars. (c) Effect of SV insertion and deletion on CsJAZ9 and significant effect of SVs on the expression of JAZ9 in different tea plant cultivars. (d) Effect of SV insertion and deletion on CsJAZ12 and significant effect of SVs on the expression of JAZ12 in different tea plant cultivars. The bar graph shows the TPM expression matrix of tea plant leaves.
-
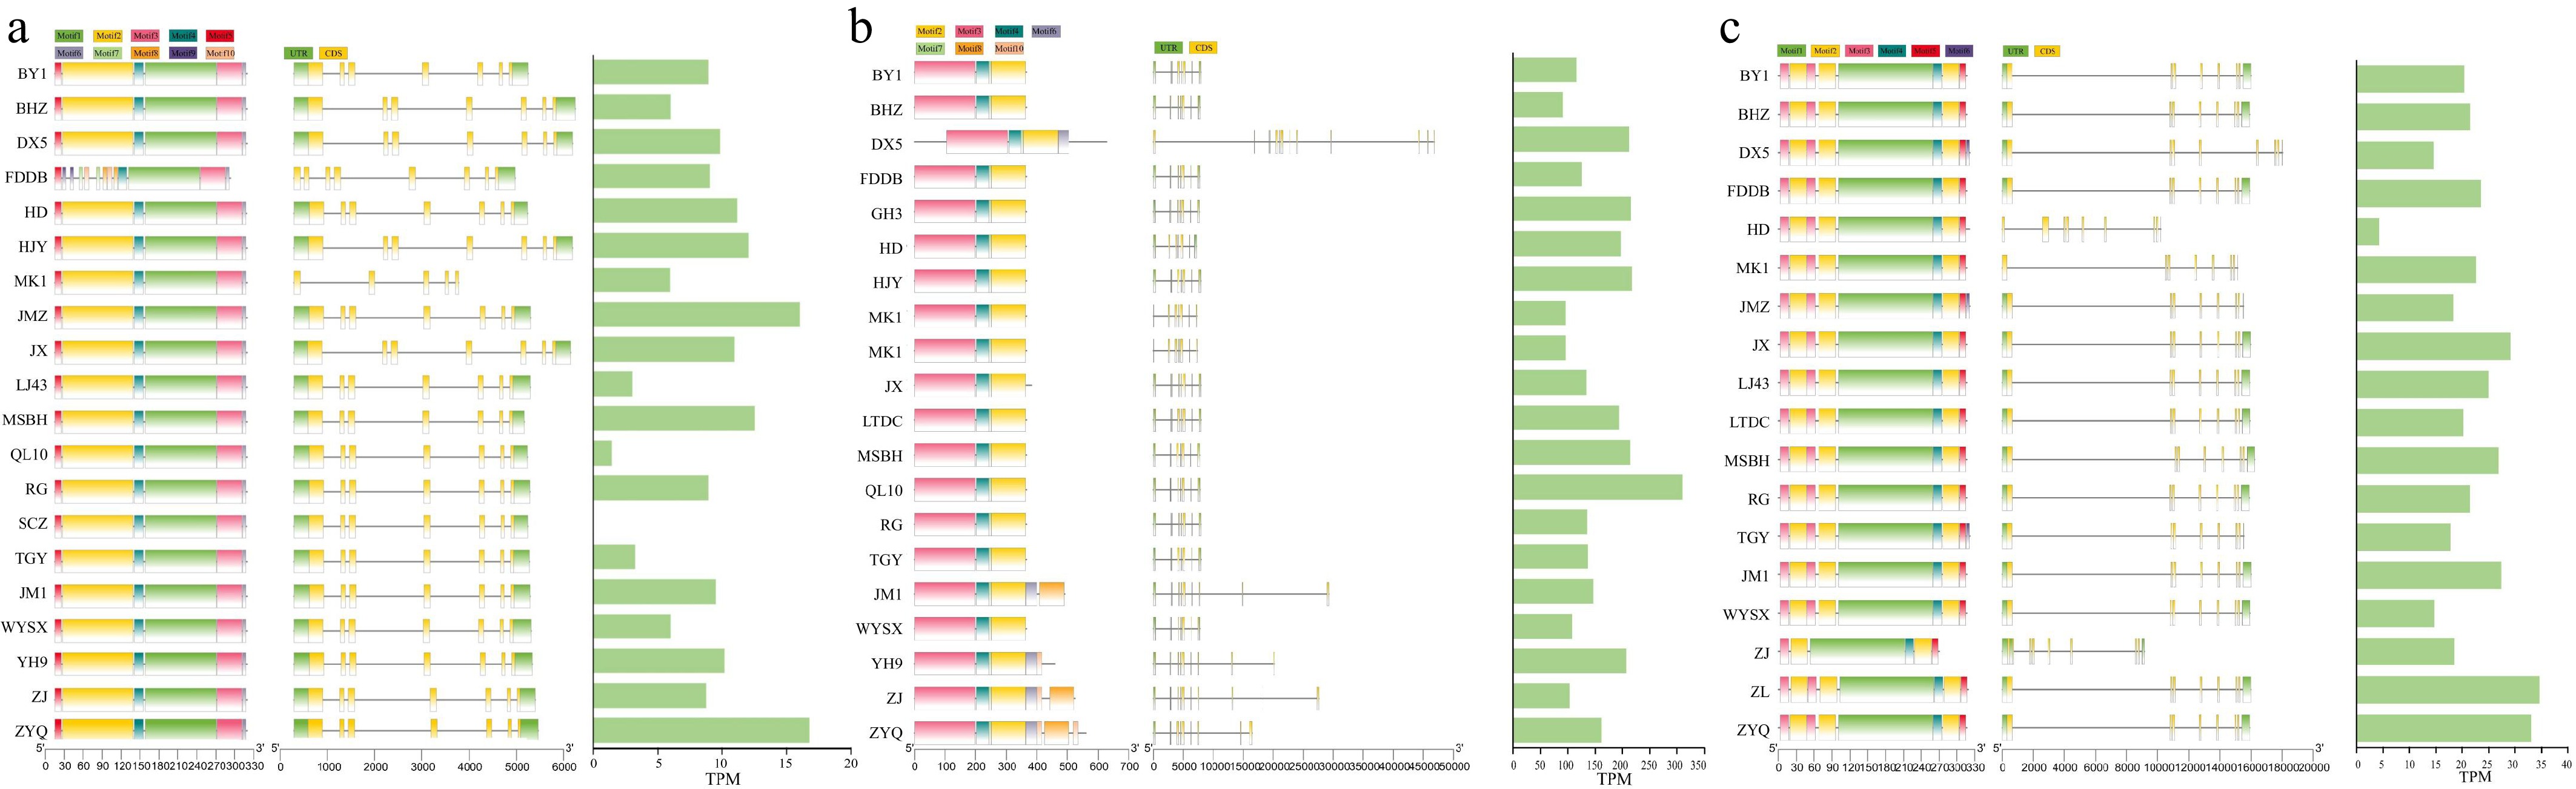
Figure 4.
Gene structure and TPM values in 22 tea plant genomes. (a) Gene structure and TPM values of CsJAZ4 in 22 tea plant genomes. (b) Gene structure and TPM values of CsJAZ9 in 22 tea plant genomes. (c) Gene structure and TPM values of CsJAZ12 in 22 tea plant genomes. TPM values represent transcript abundance in leaf tissue, which was used as a representative condition for assessing expression variation across accessions, where 'QL10' and 'SCZ' are mixed tissues (containing leaves).
-
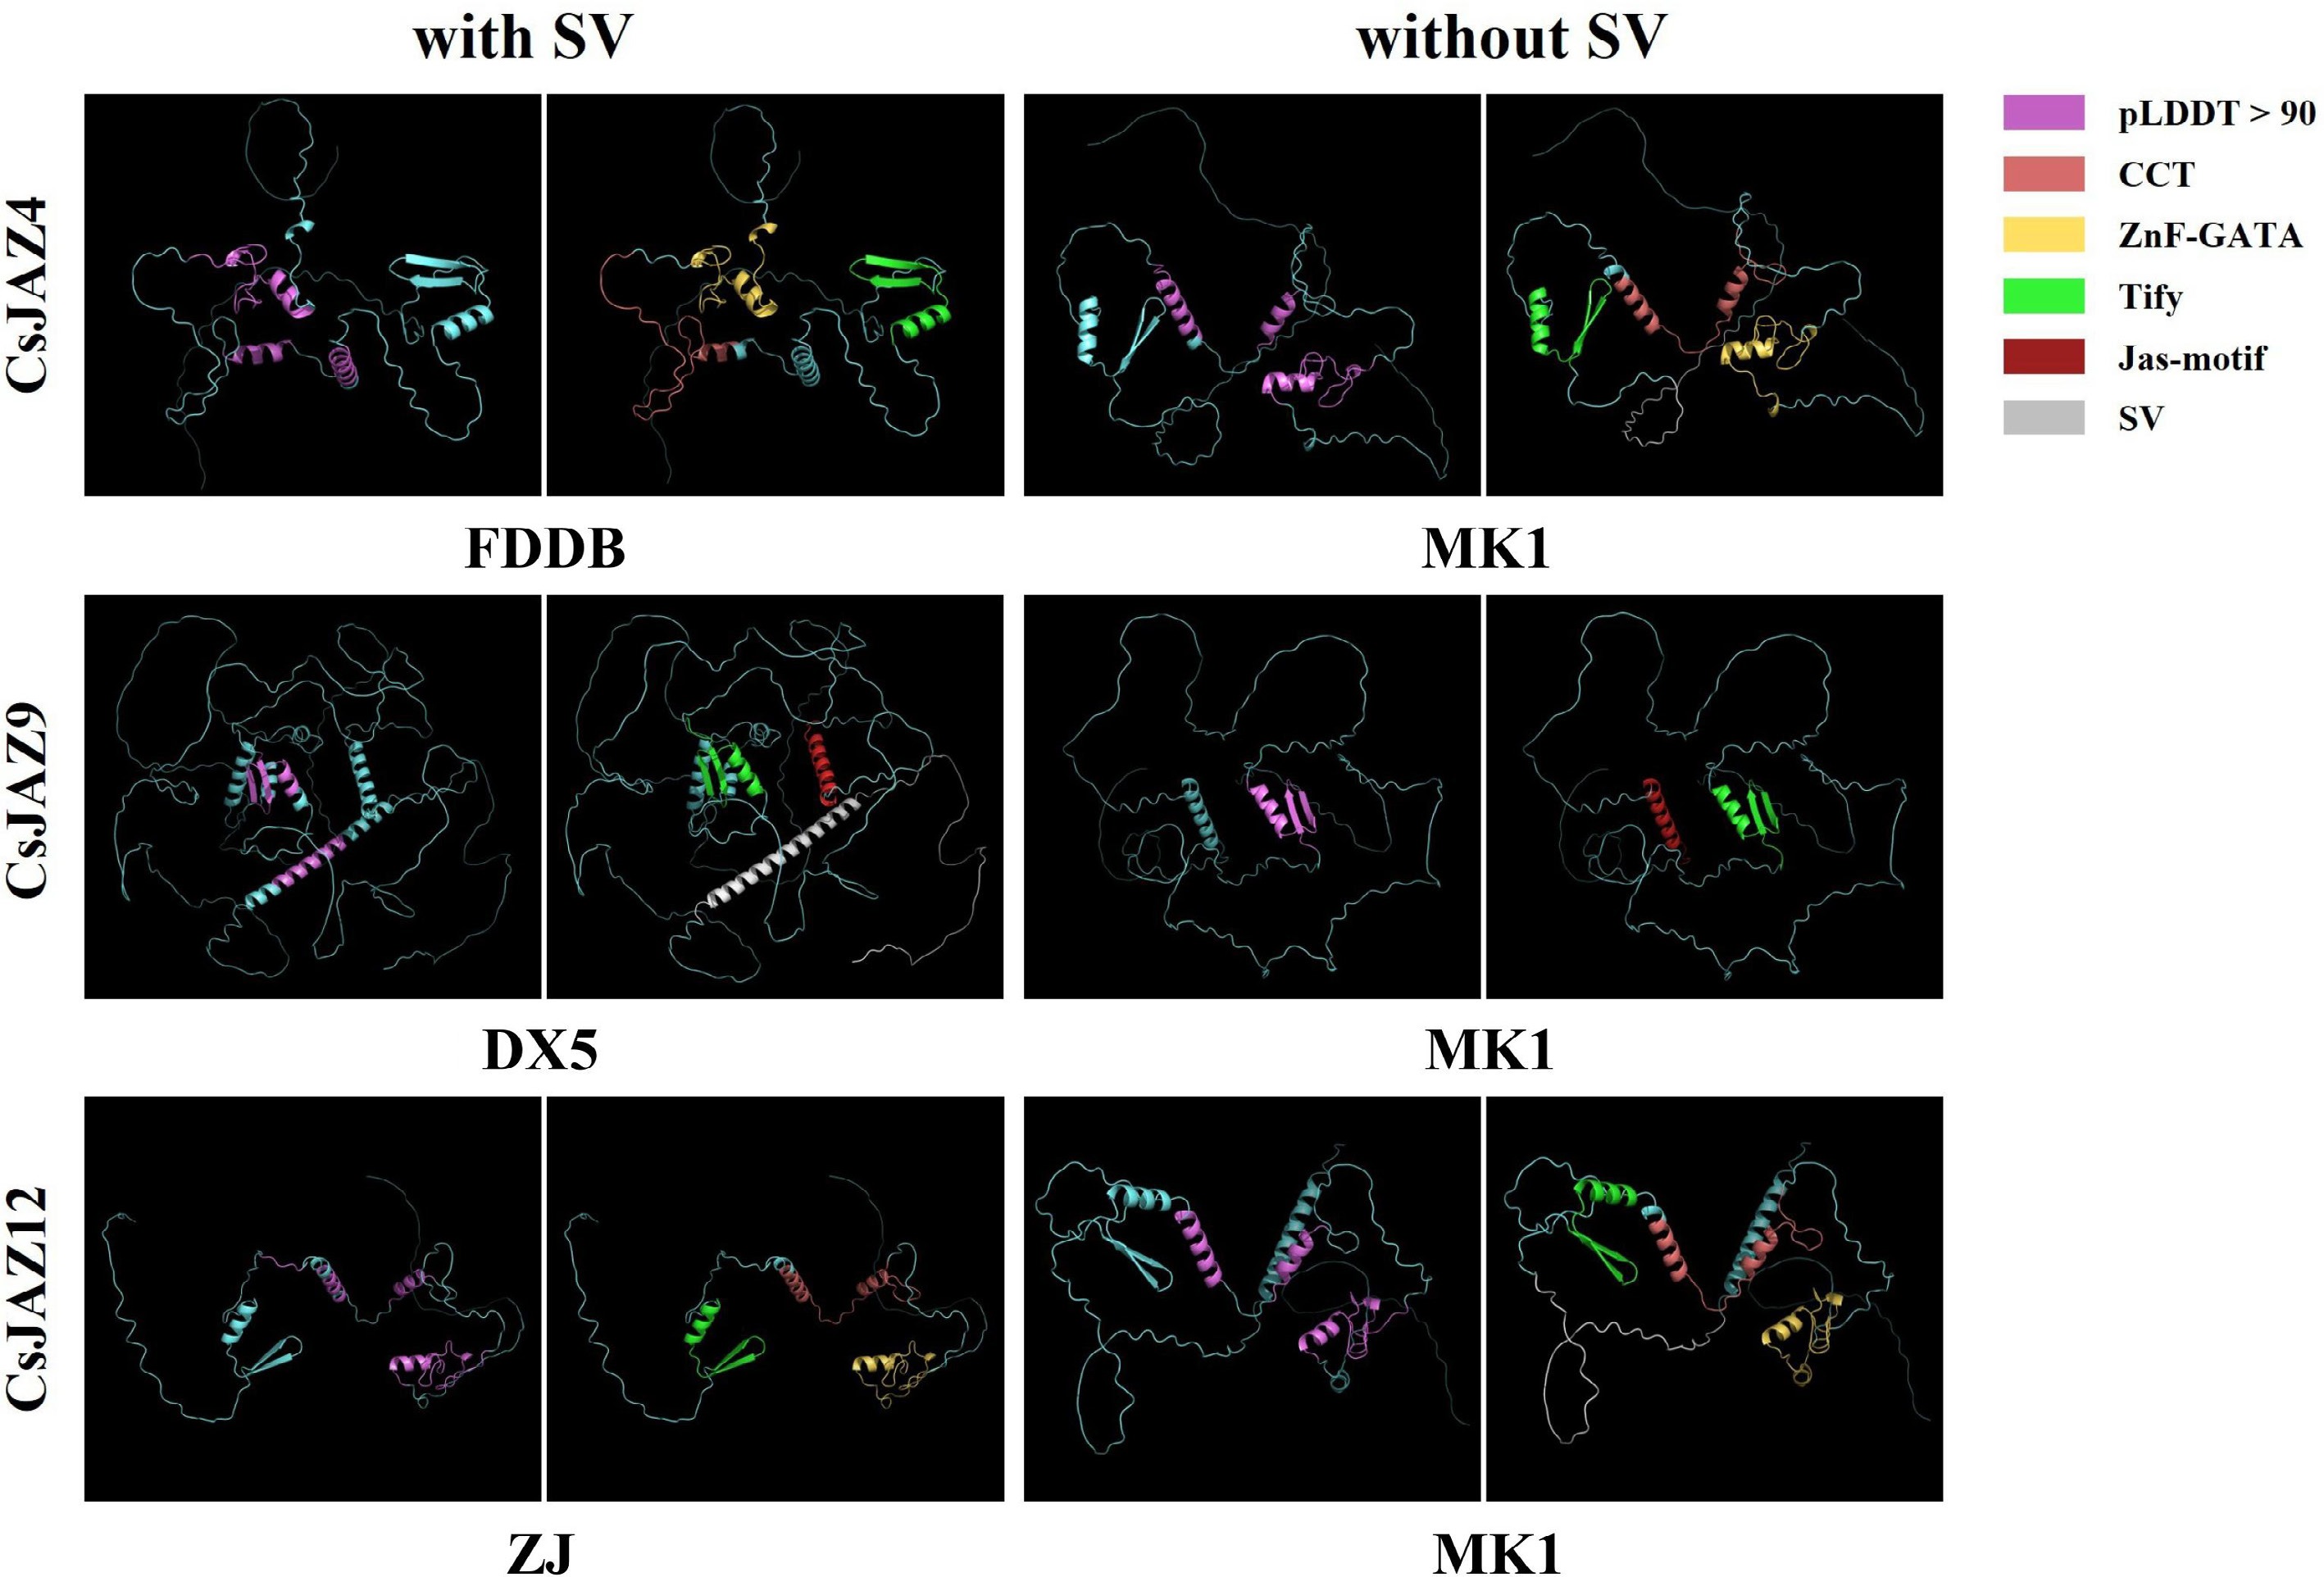
Figure 5.
Protein tertiary structure of JAZs under the influence of SV. Purple represents pLDDT > 90 indicating that the residue has a very high model confidence; pink represents the CCT motif, yellow represents the ZnF-GATA, green represents the Tify domain, red represents the Jas-motif domain, grey represents SV, and blue represents the amino acid sequence.
-
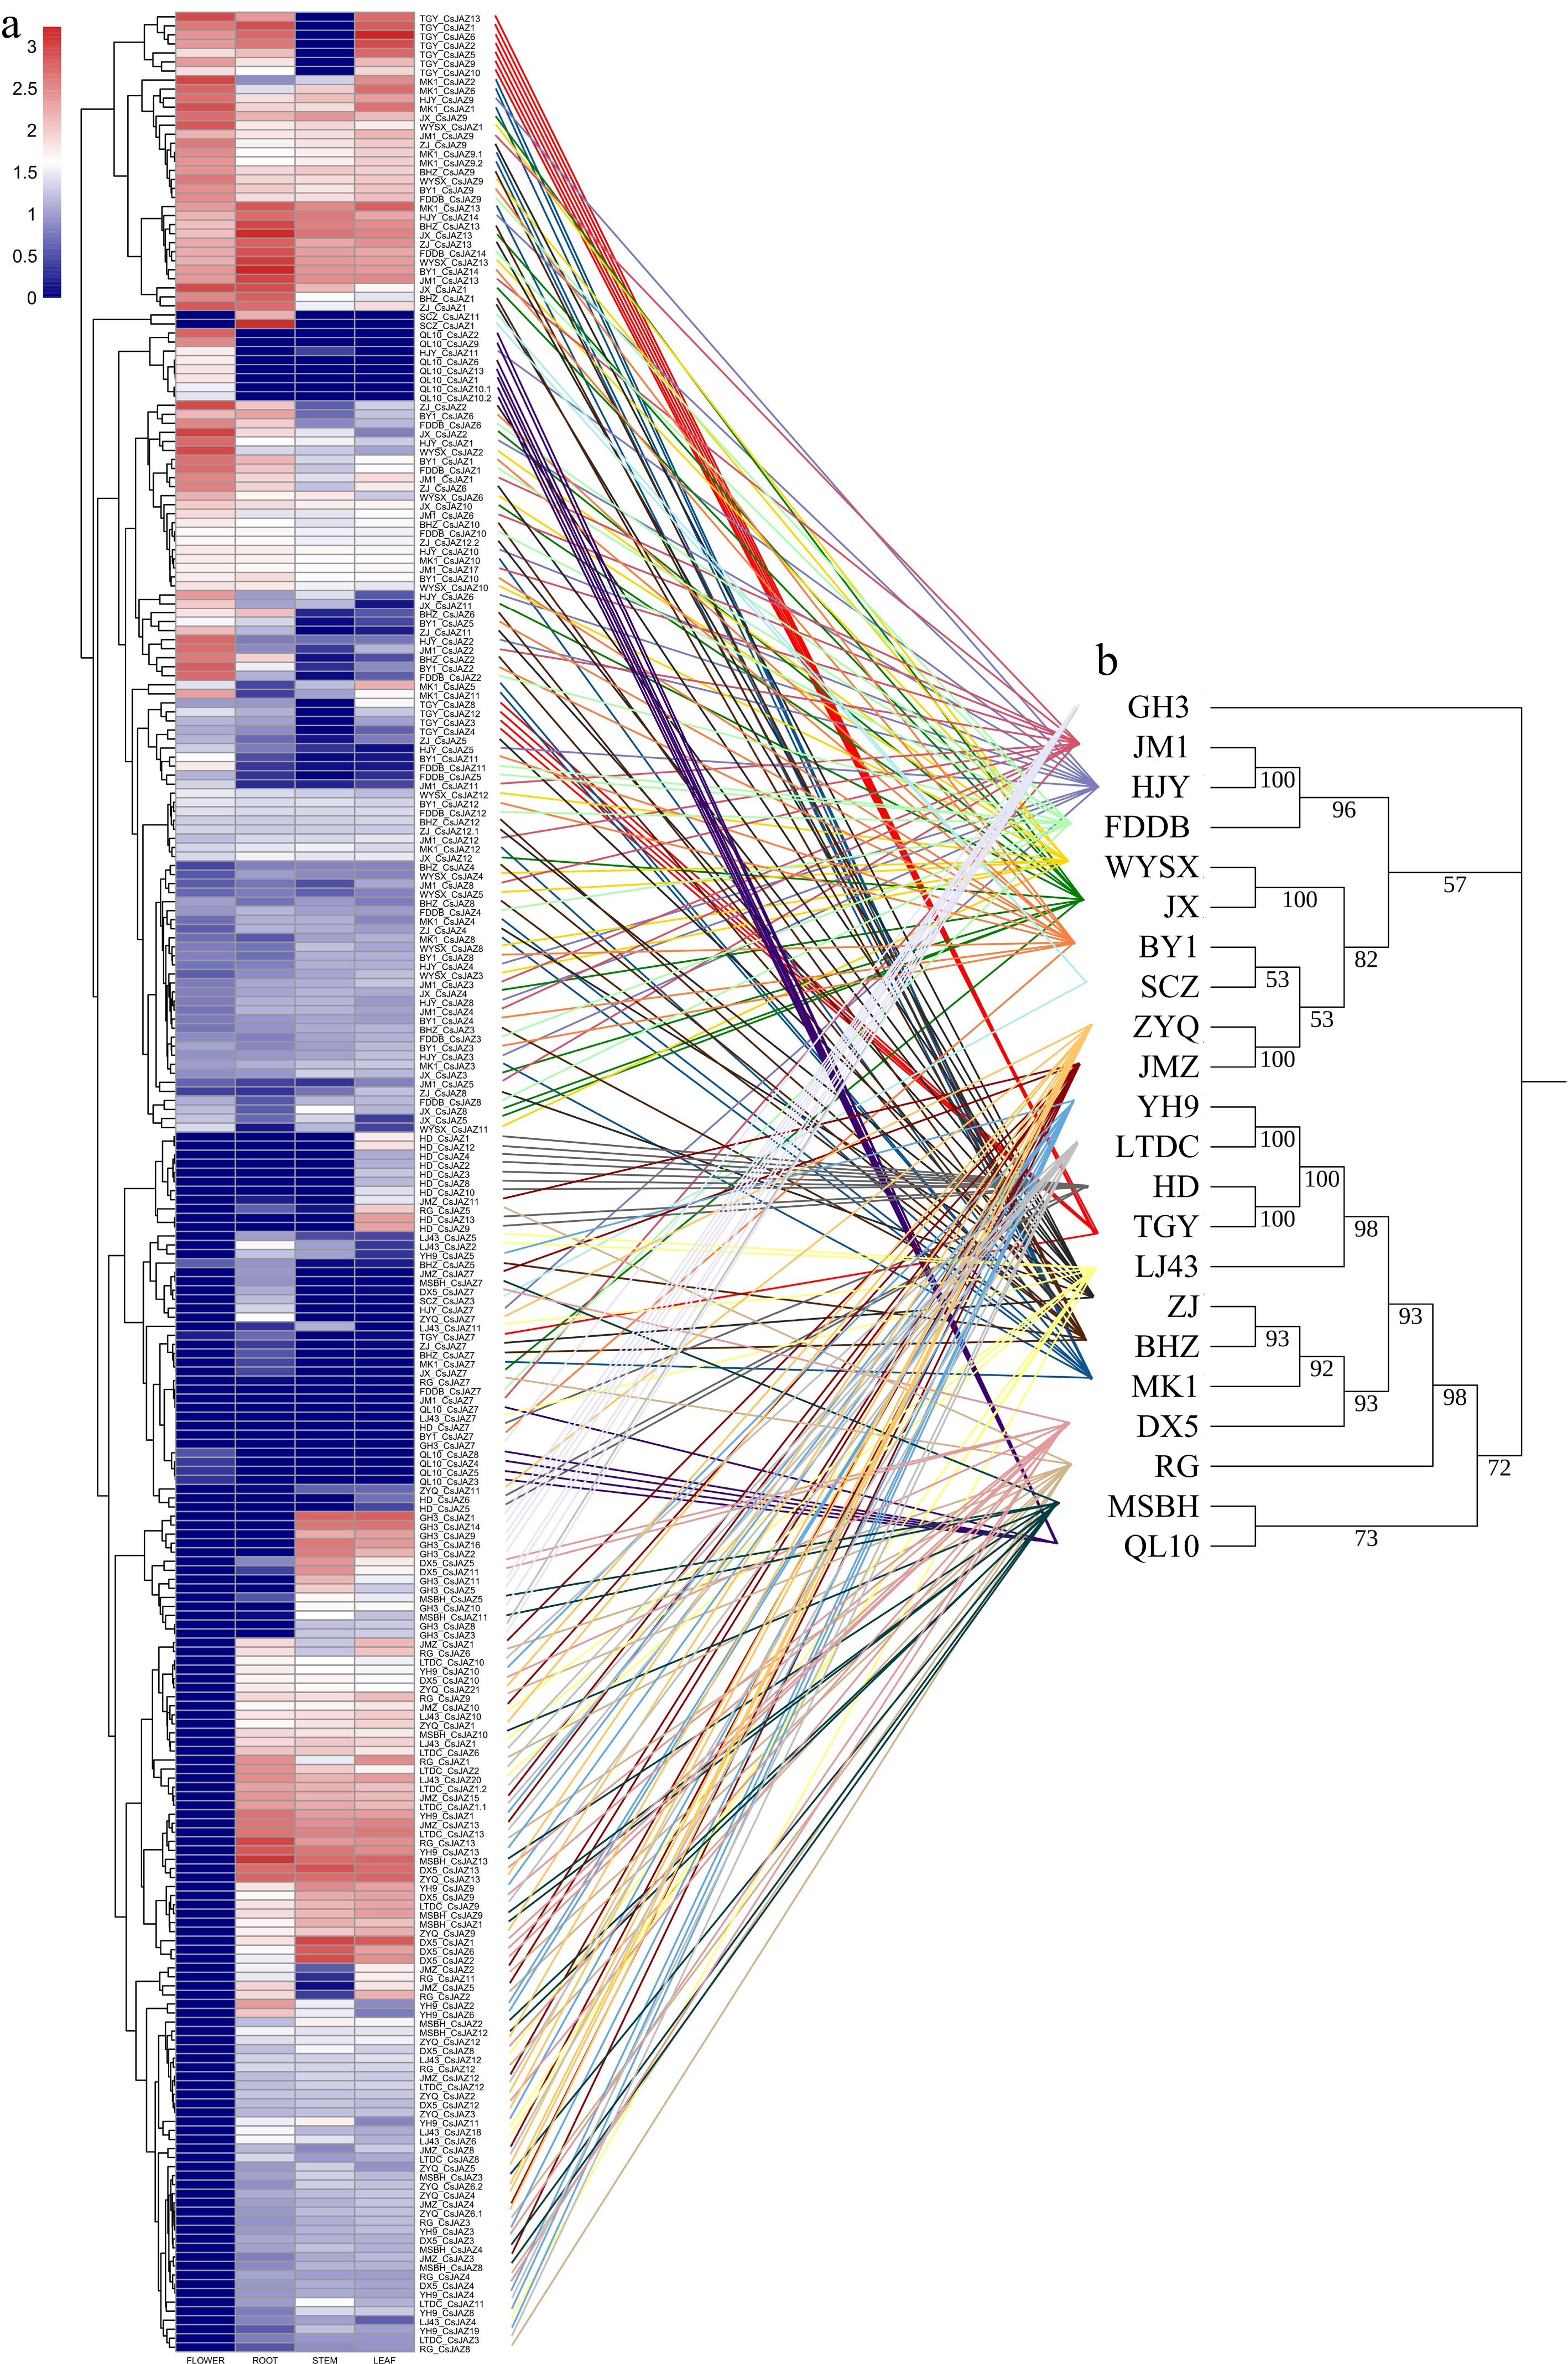
Figure 6.
(a) The heatmap of expression profile clustering in the pangenome of CsJAZs from 22 tea plant cultivars in four tissues (flower, root, stem, leaf). (b) Species phylogeny tree. Gene expression values were normalized using log10(TPM + 1) transformation. Comparison of gene expression clustered branching plots (left tree) with species phylogenies (right tree) via connecting lines (different species highlighted in different colors).
Figures
(6)
Tables
(0)