-
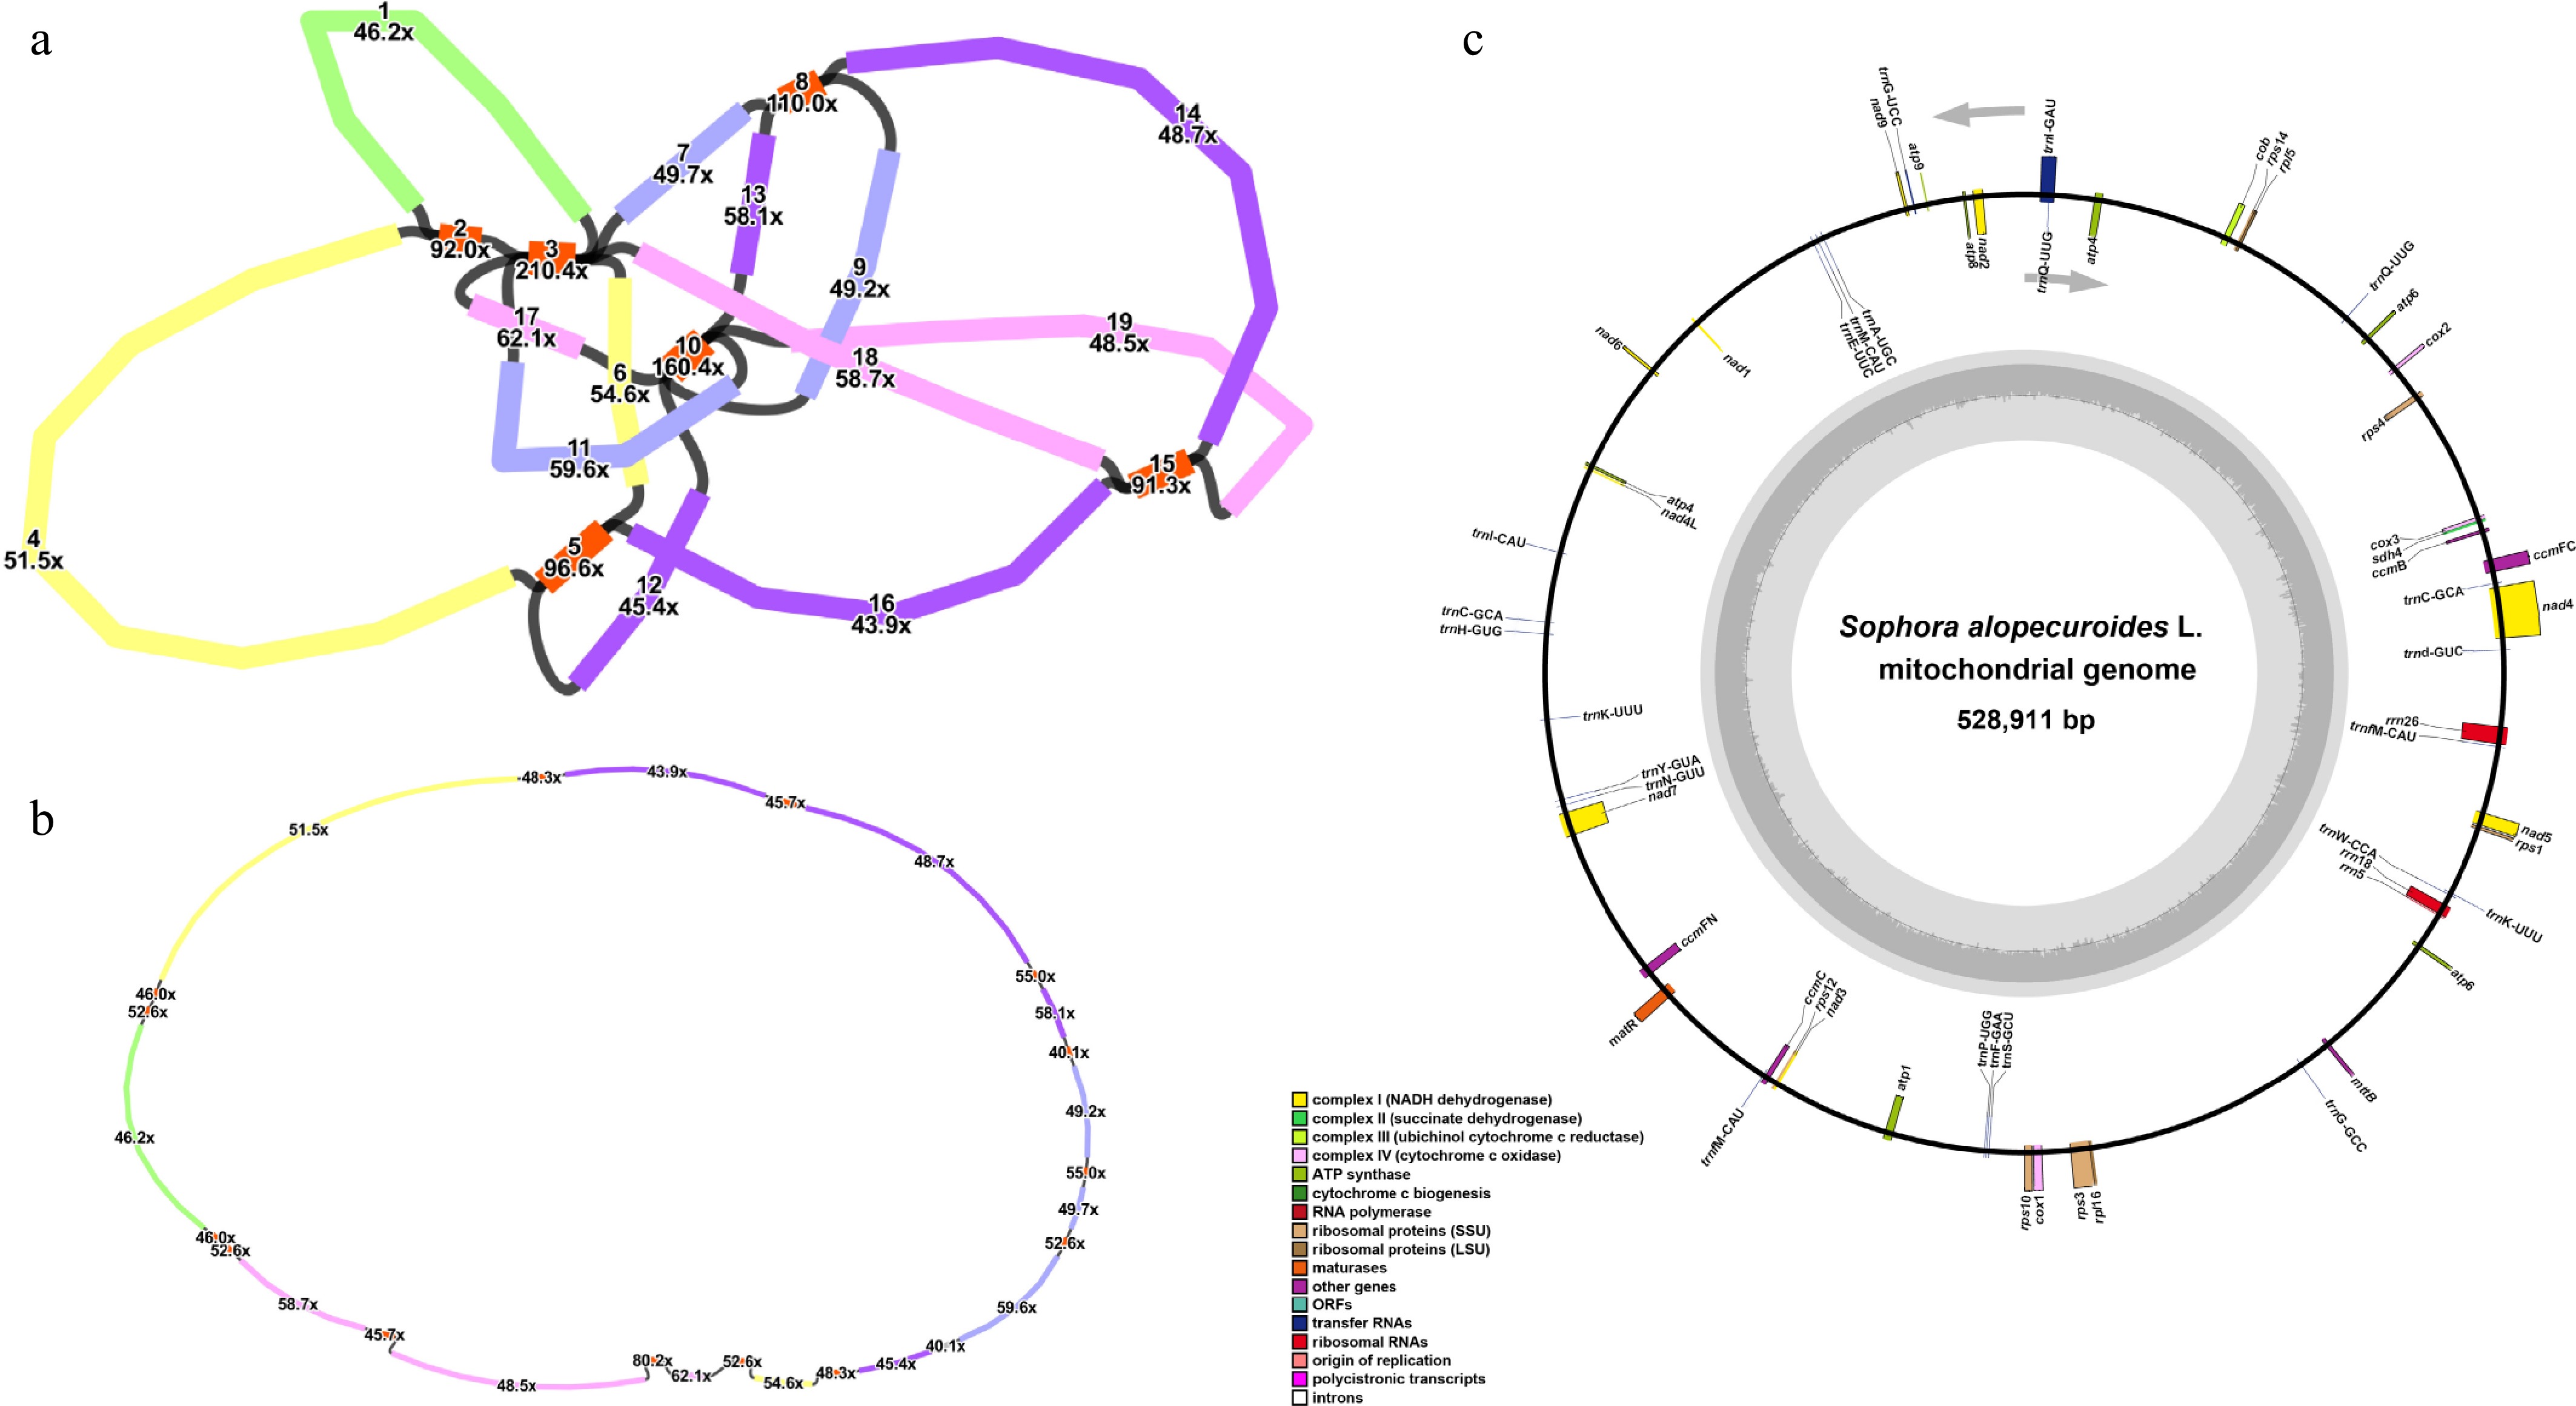
Figure 1.
Assembly and annotation of S. alopecuroides mitogenome. (a) The preliminary assembly graph of the mitogenome, with the contigs numbered separately. The red contigs indicate the repetitive fragments. (b) The structure of the "master circle" after debranching the initial assembly. (c) Mitogenomic annotation. Genes from different functional categories are shown in different colors.
-
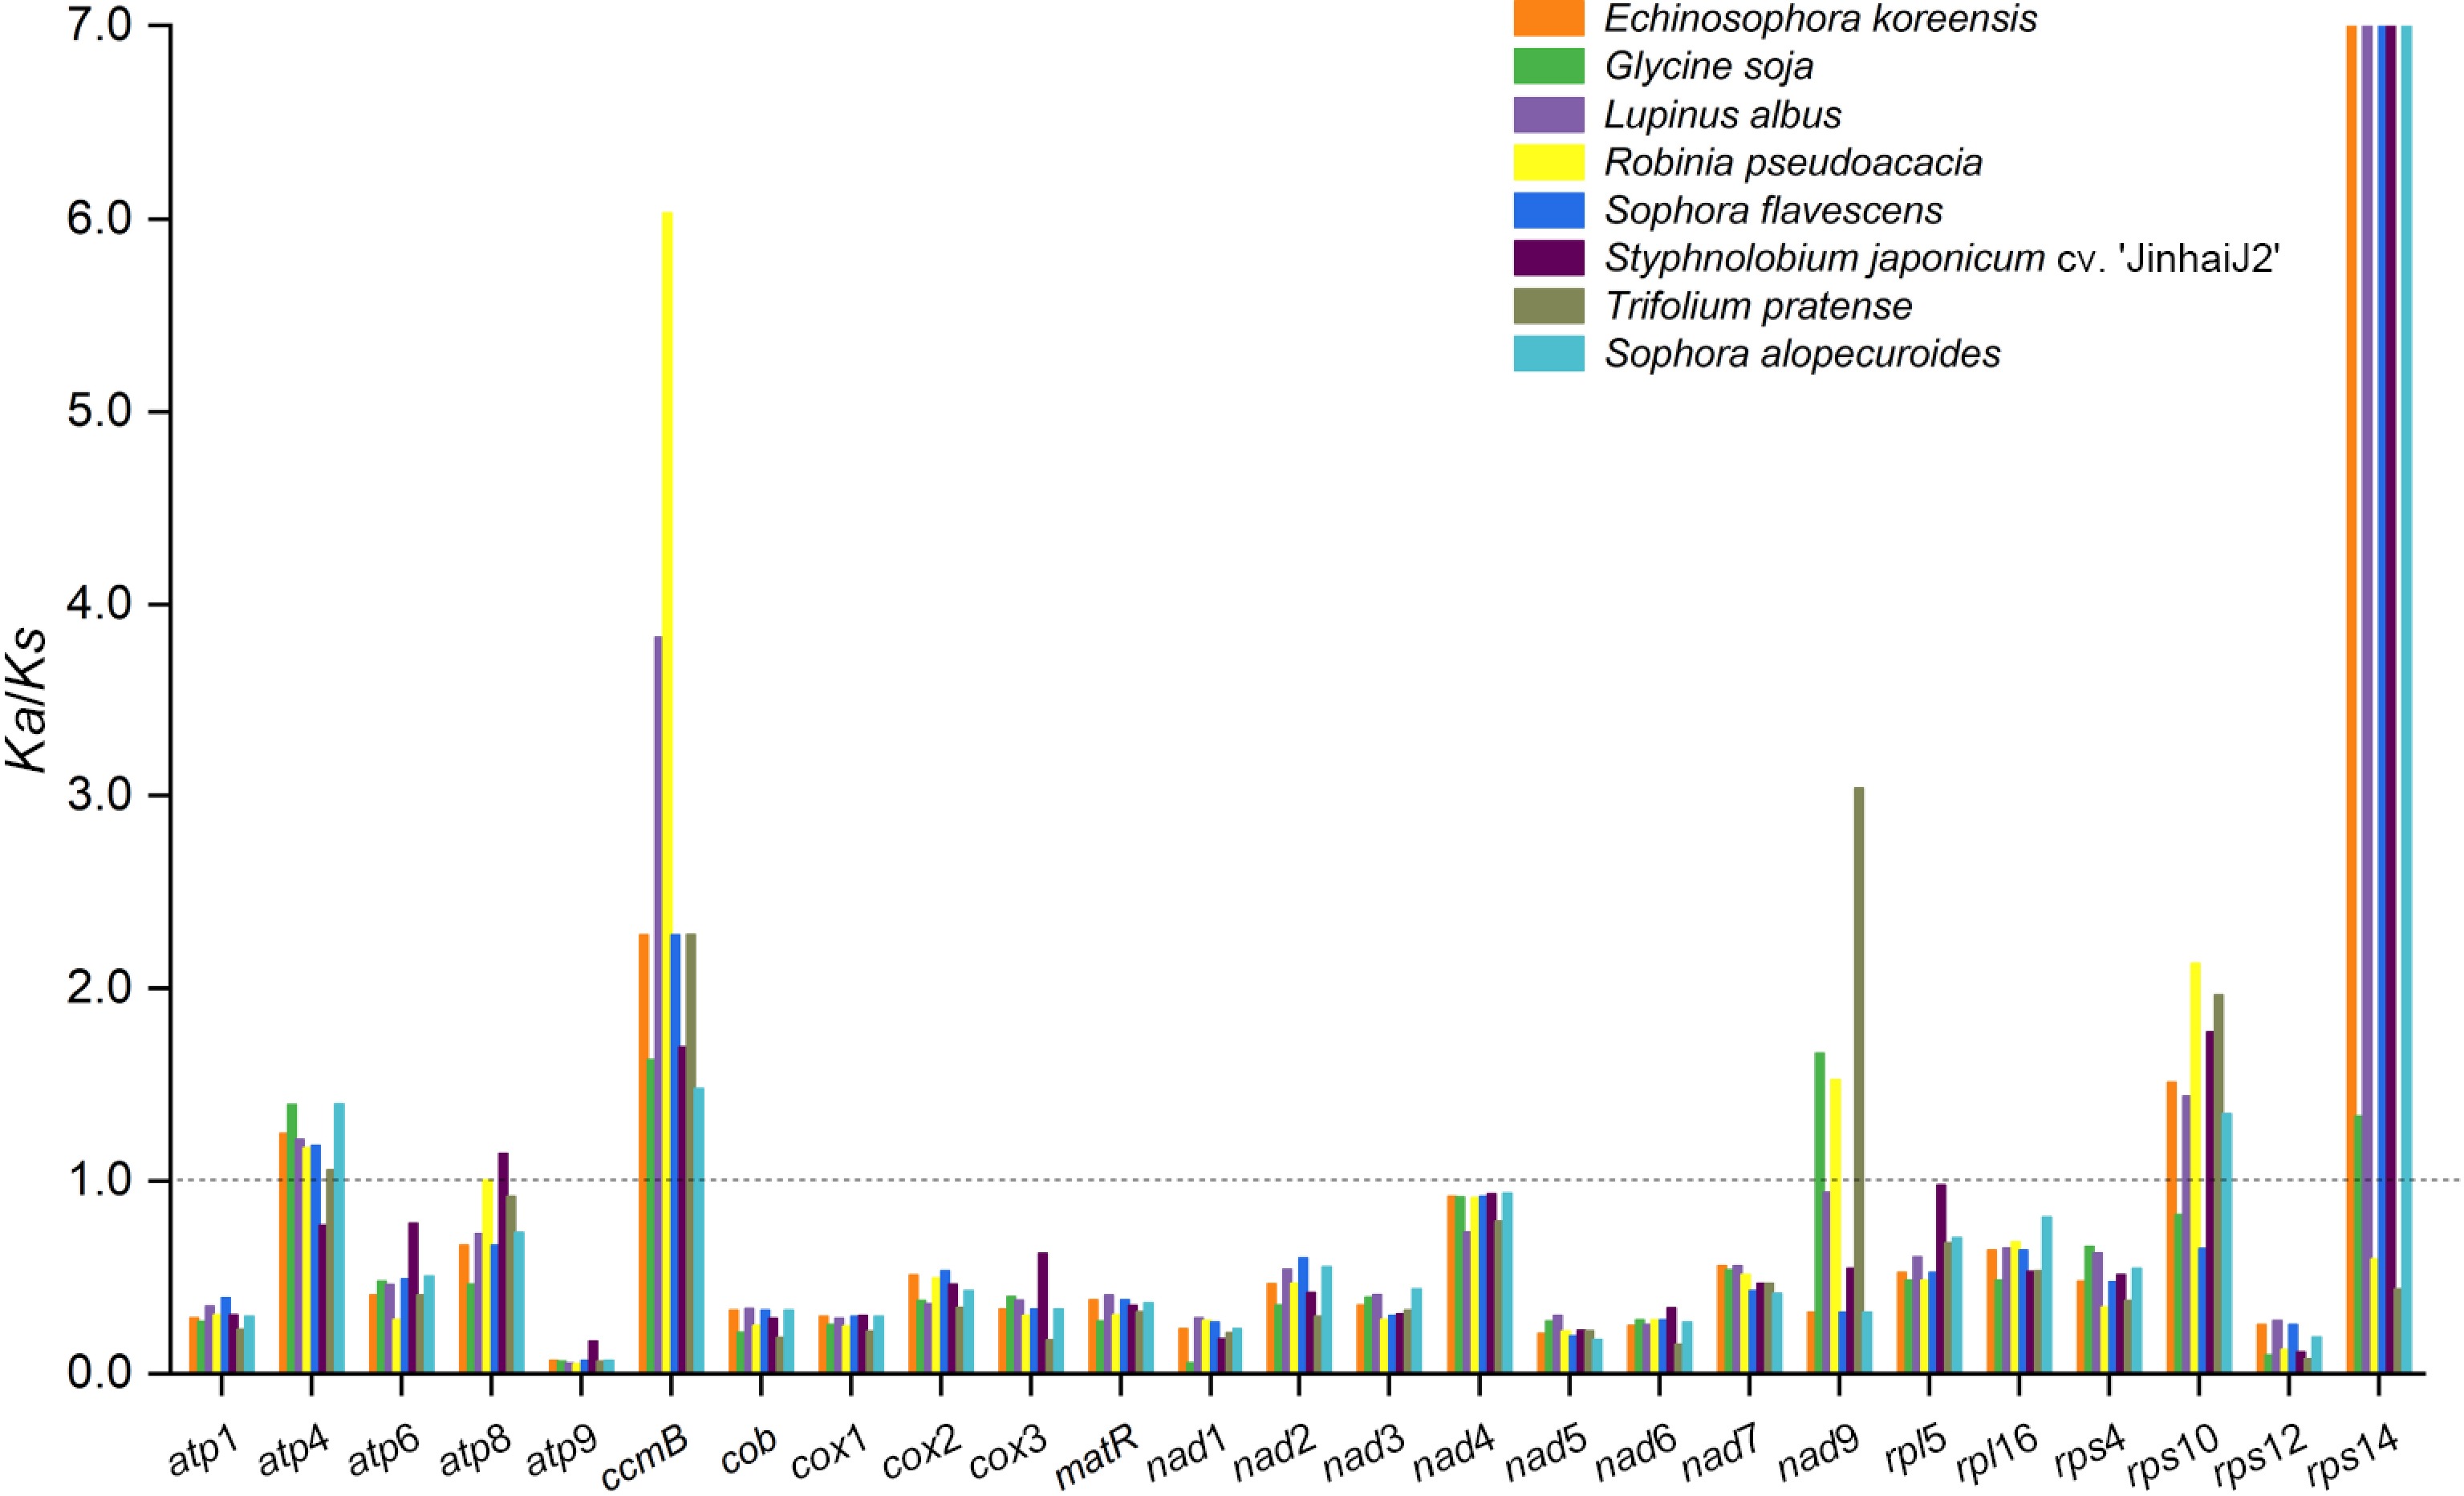
Figure 2.
Ka/Ks ratio calculated for the 25 shared genes from the mitogenome of nine Fabales species. Different species are represented by different colors.
-
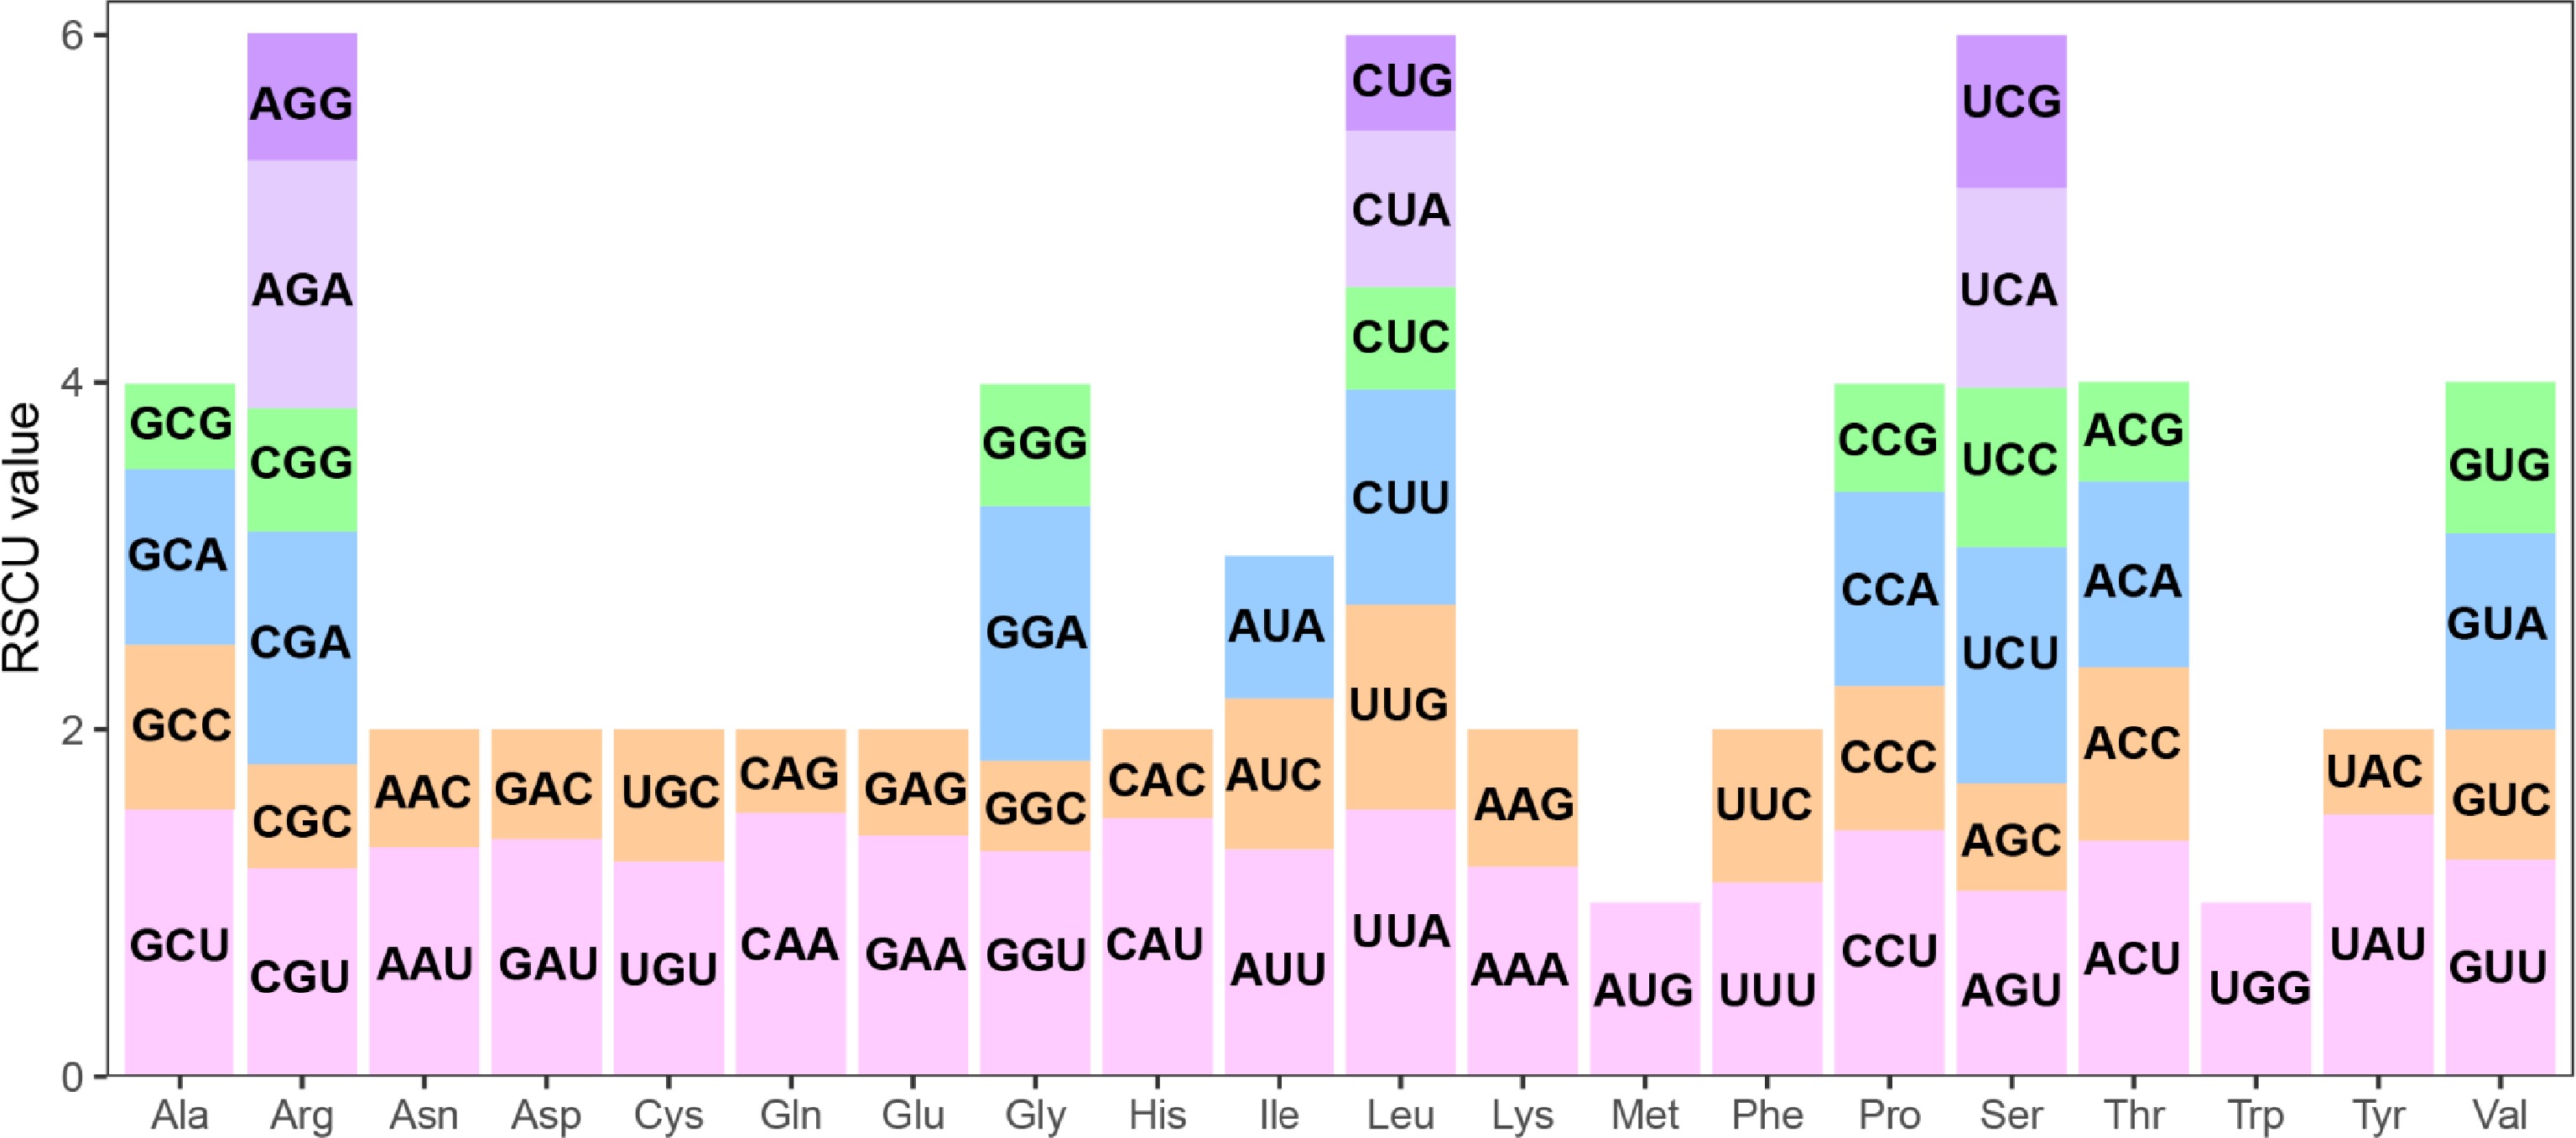
Figure 3.
The relative synonymous codon usage (RSCU) in the S. alopecuroides mitogenome. The x-axis represents the type of amino acid. The y-axis represents the RSCU value. Each amino acid is encoded by multiple codons, represented by differently colored bars in the histogram.
-
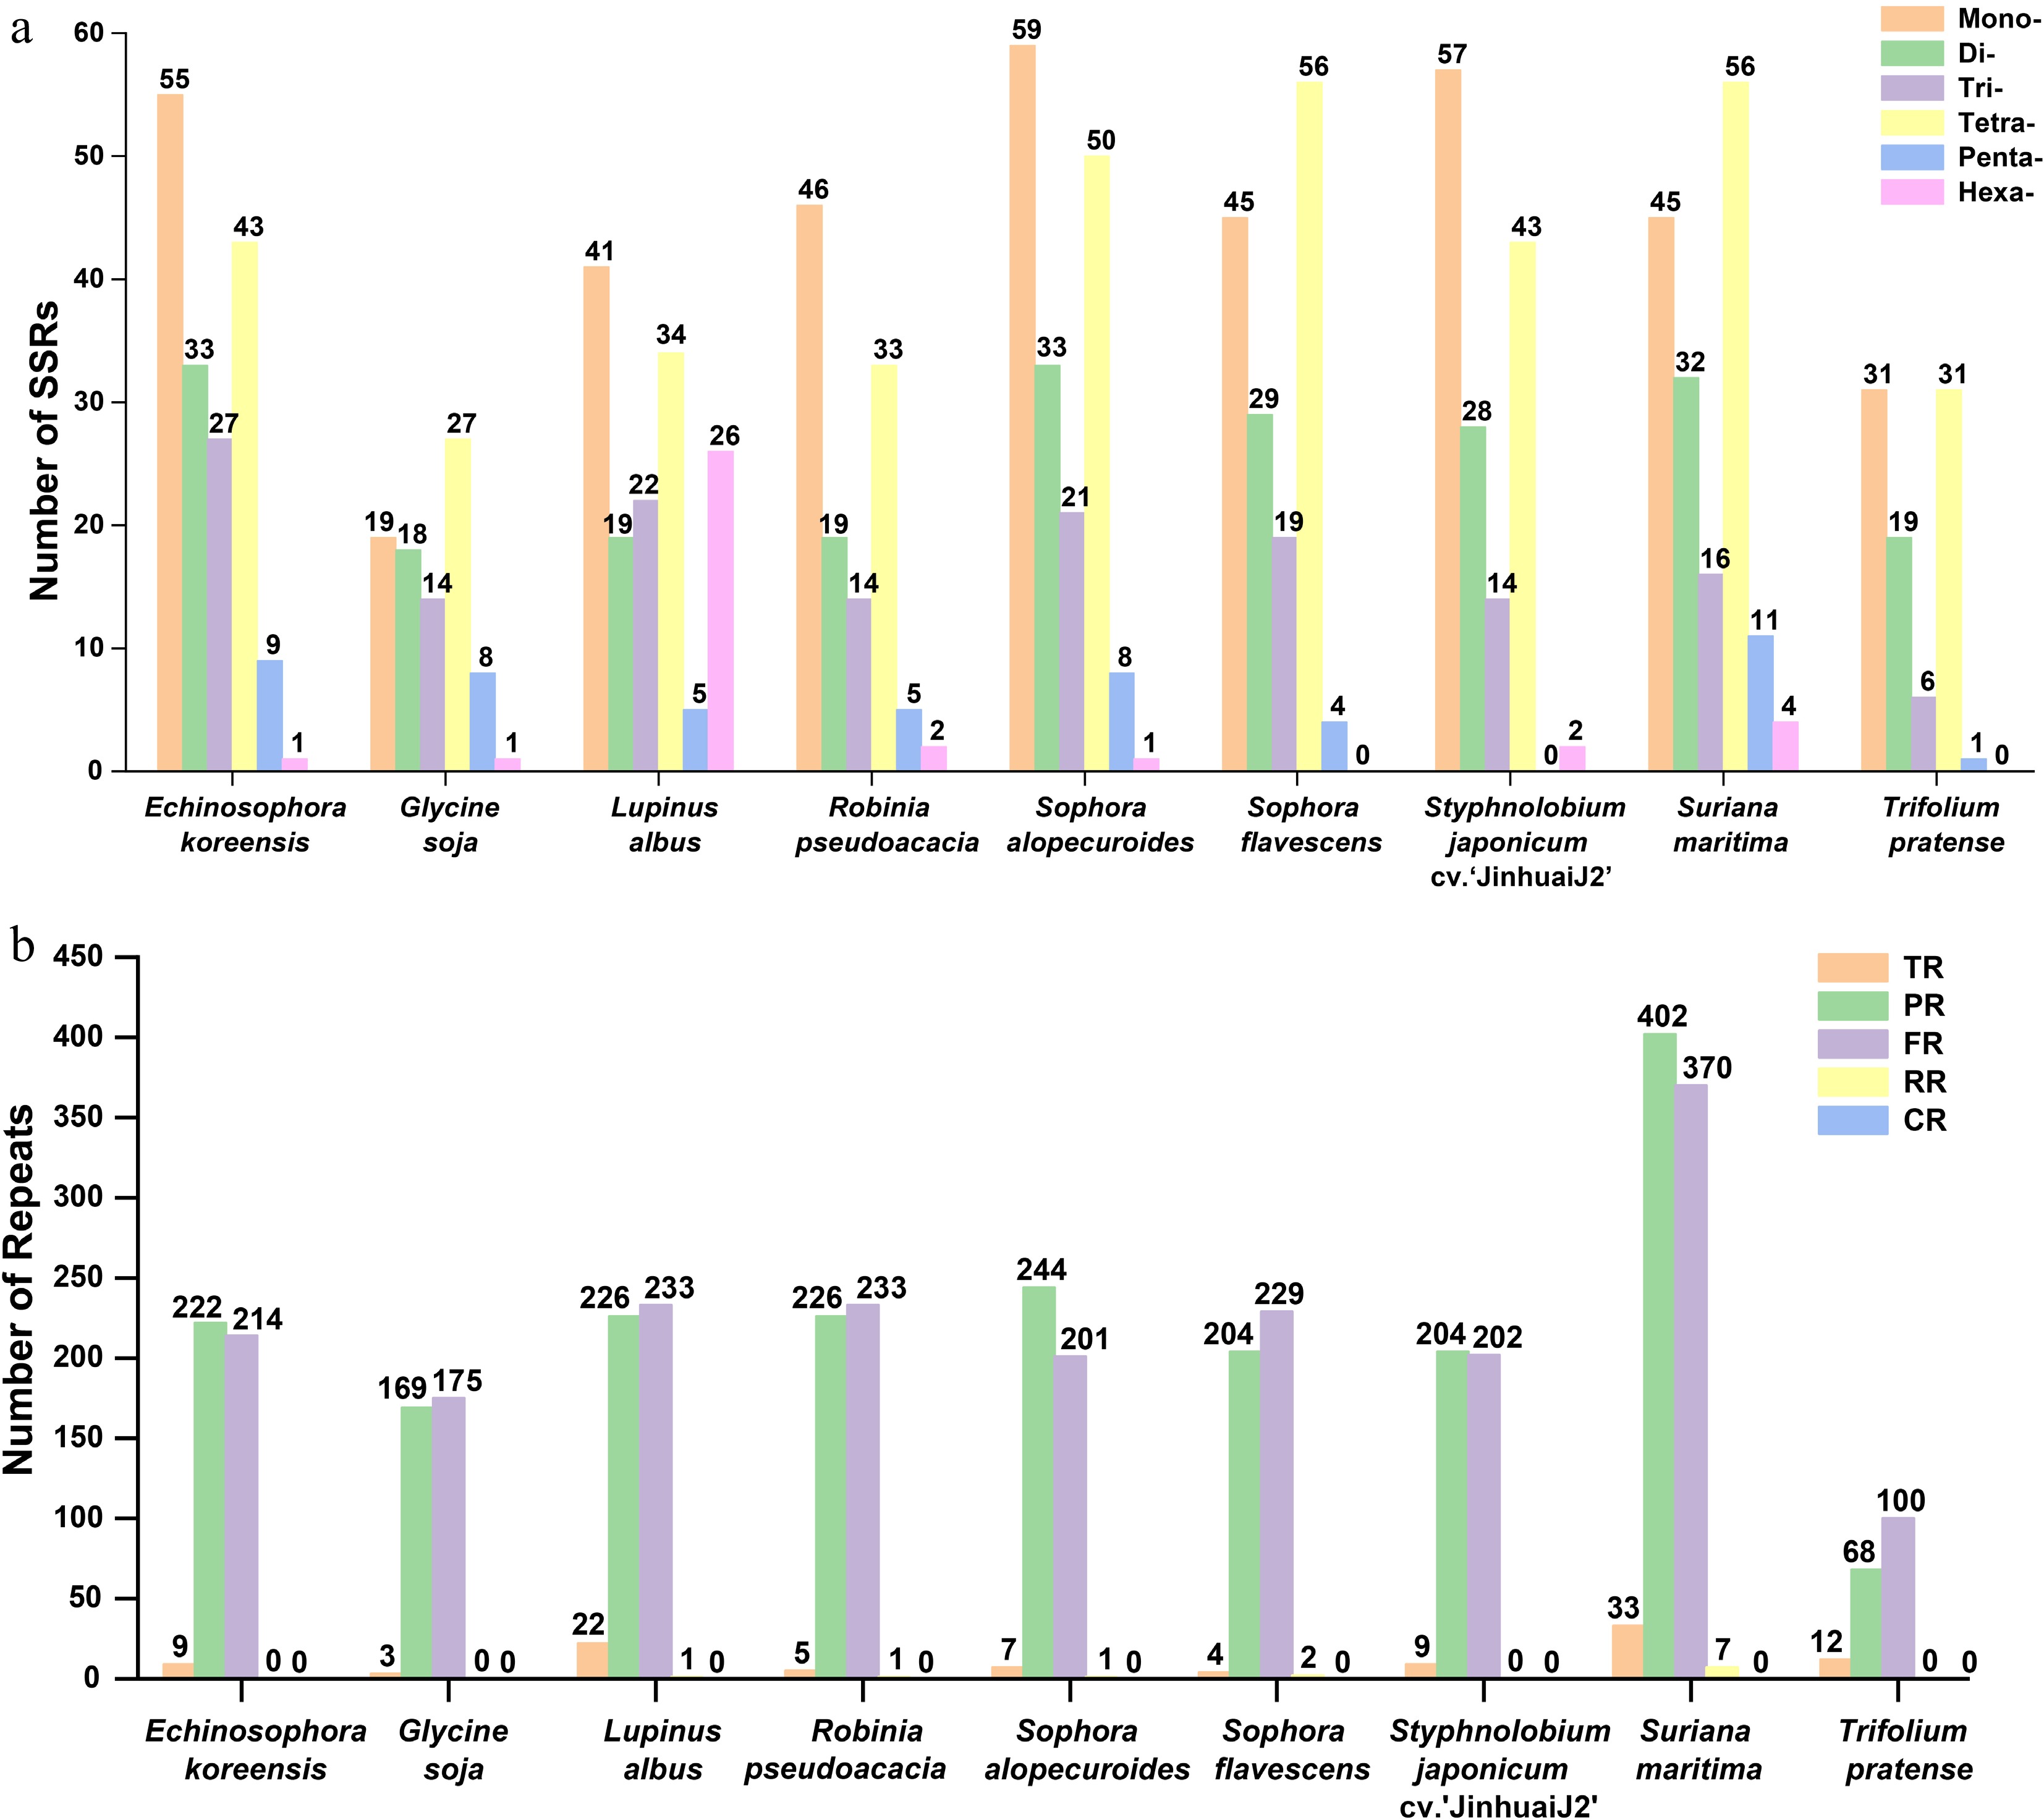
Figure 4.
The simple sequence repeats (SSRs), tandem repeats, and dispersed repeats of the nine Fabales plants. (a) Comparison of the numbers of SSRs among the nine Fabales plants. (b) Comparison of the numbers of tandem repeats and dispersed repeats of the nine Fabales plants. The x-axis shows the different species. Columns with different colors represent different types of repeat units. The number of a particular type of repeat is shown above the corresponding column.
-
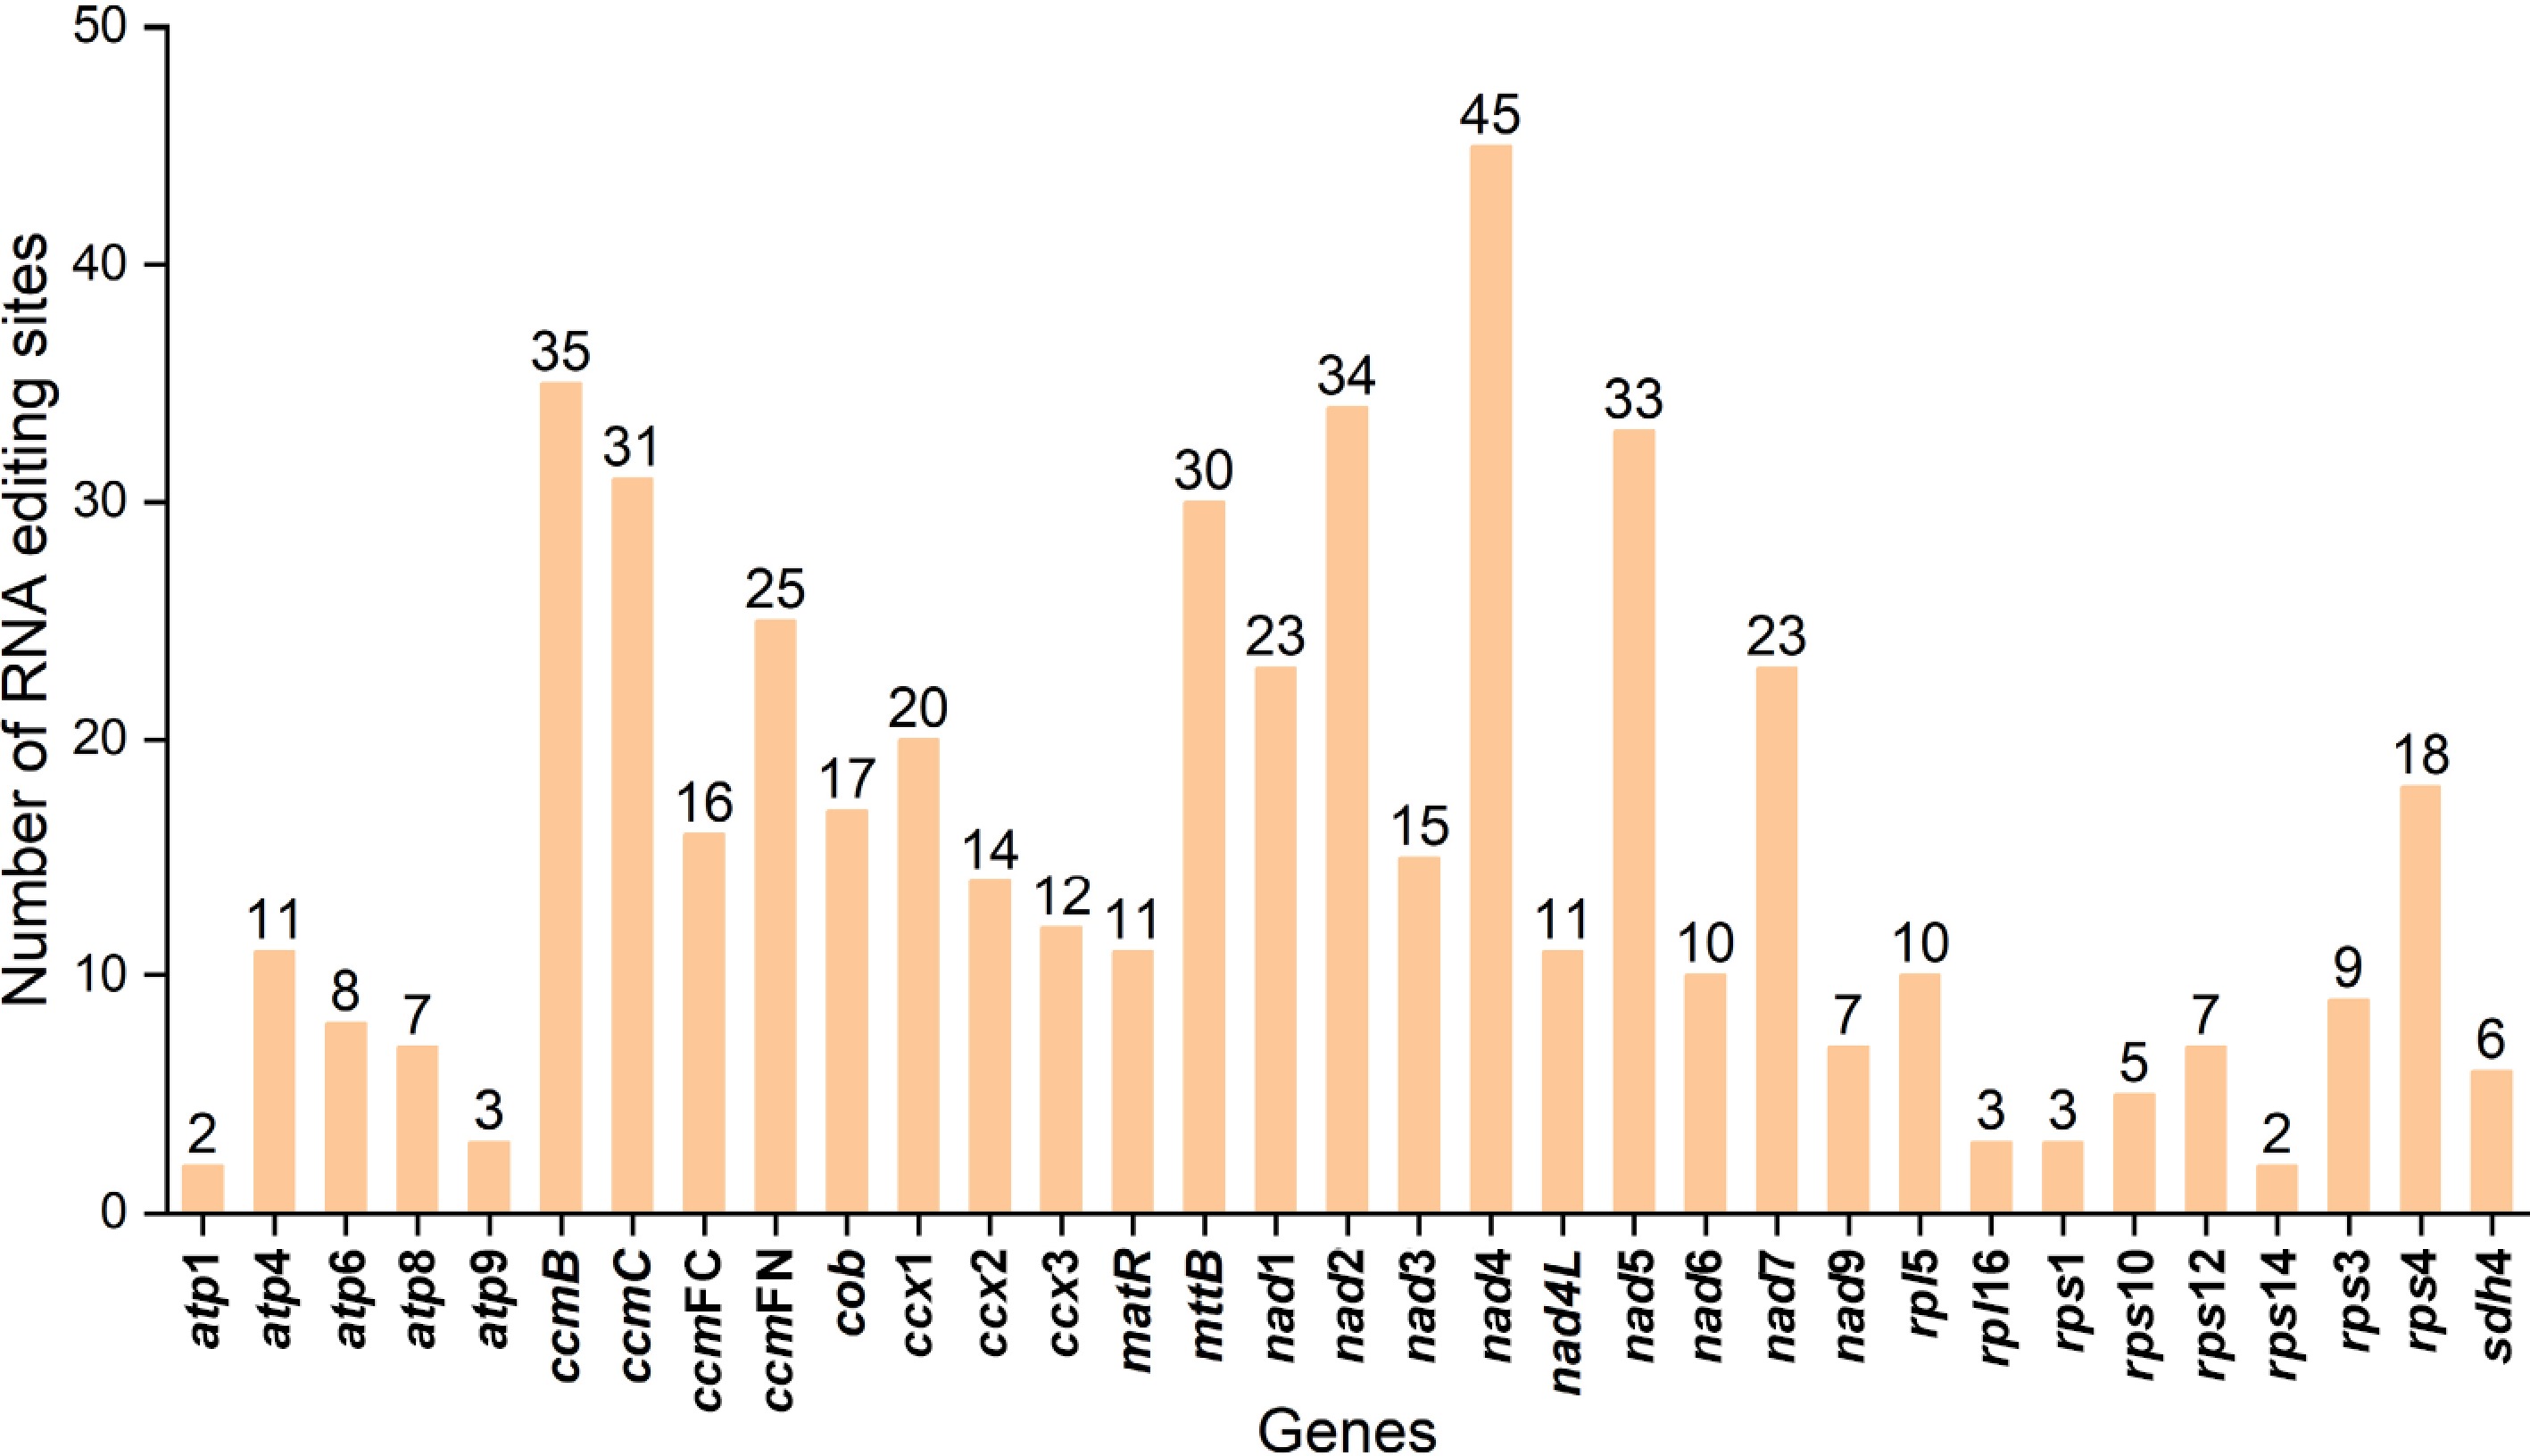
Figure 5.
Prediction of RNA editing sites in the PCGs.
-
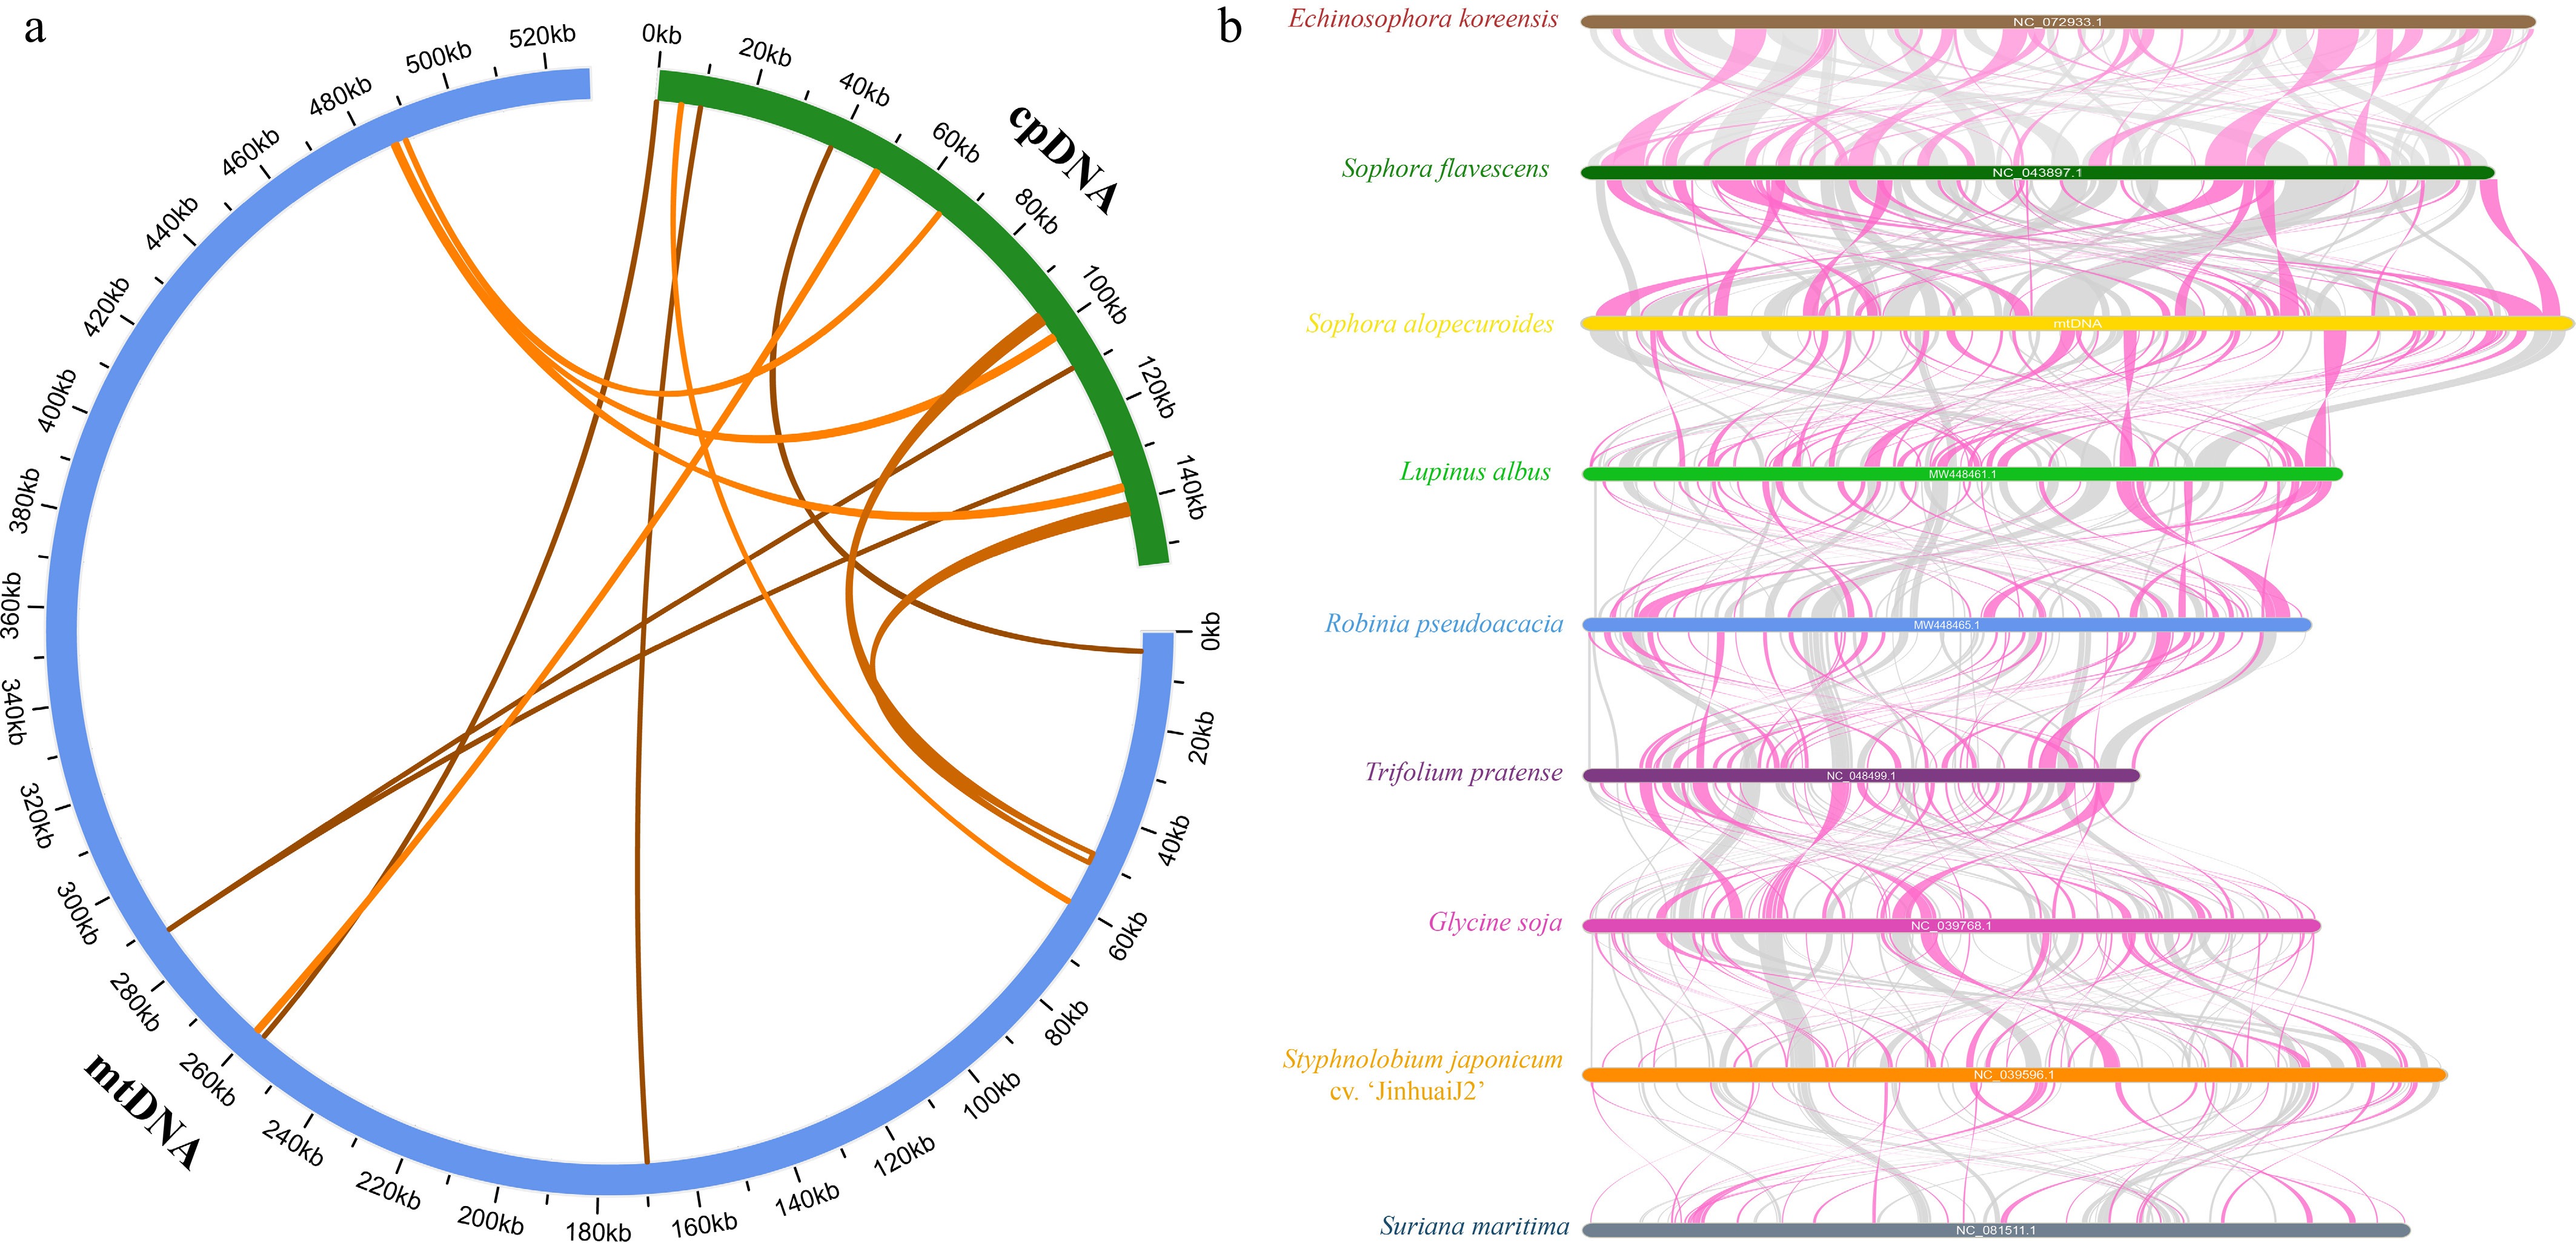
Figure 6.
Analysis of homology based on the different organelles and collinear analysis of nine Fabales species. (a) The blue arc represents the mitogenome. The green arc represents the chloroplast genome. The homologous fragments are indicated by yellow lines connecting the blue and green arcs. (b) Red arcs indicate inverted regions, and gray arcs indicate well-conserved homologous regions.
-
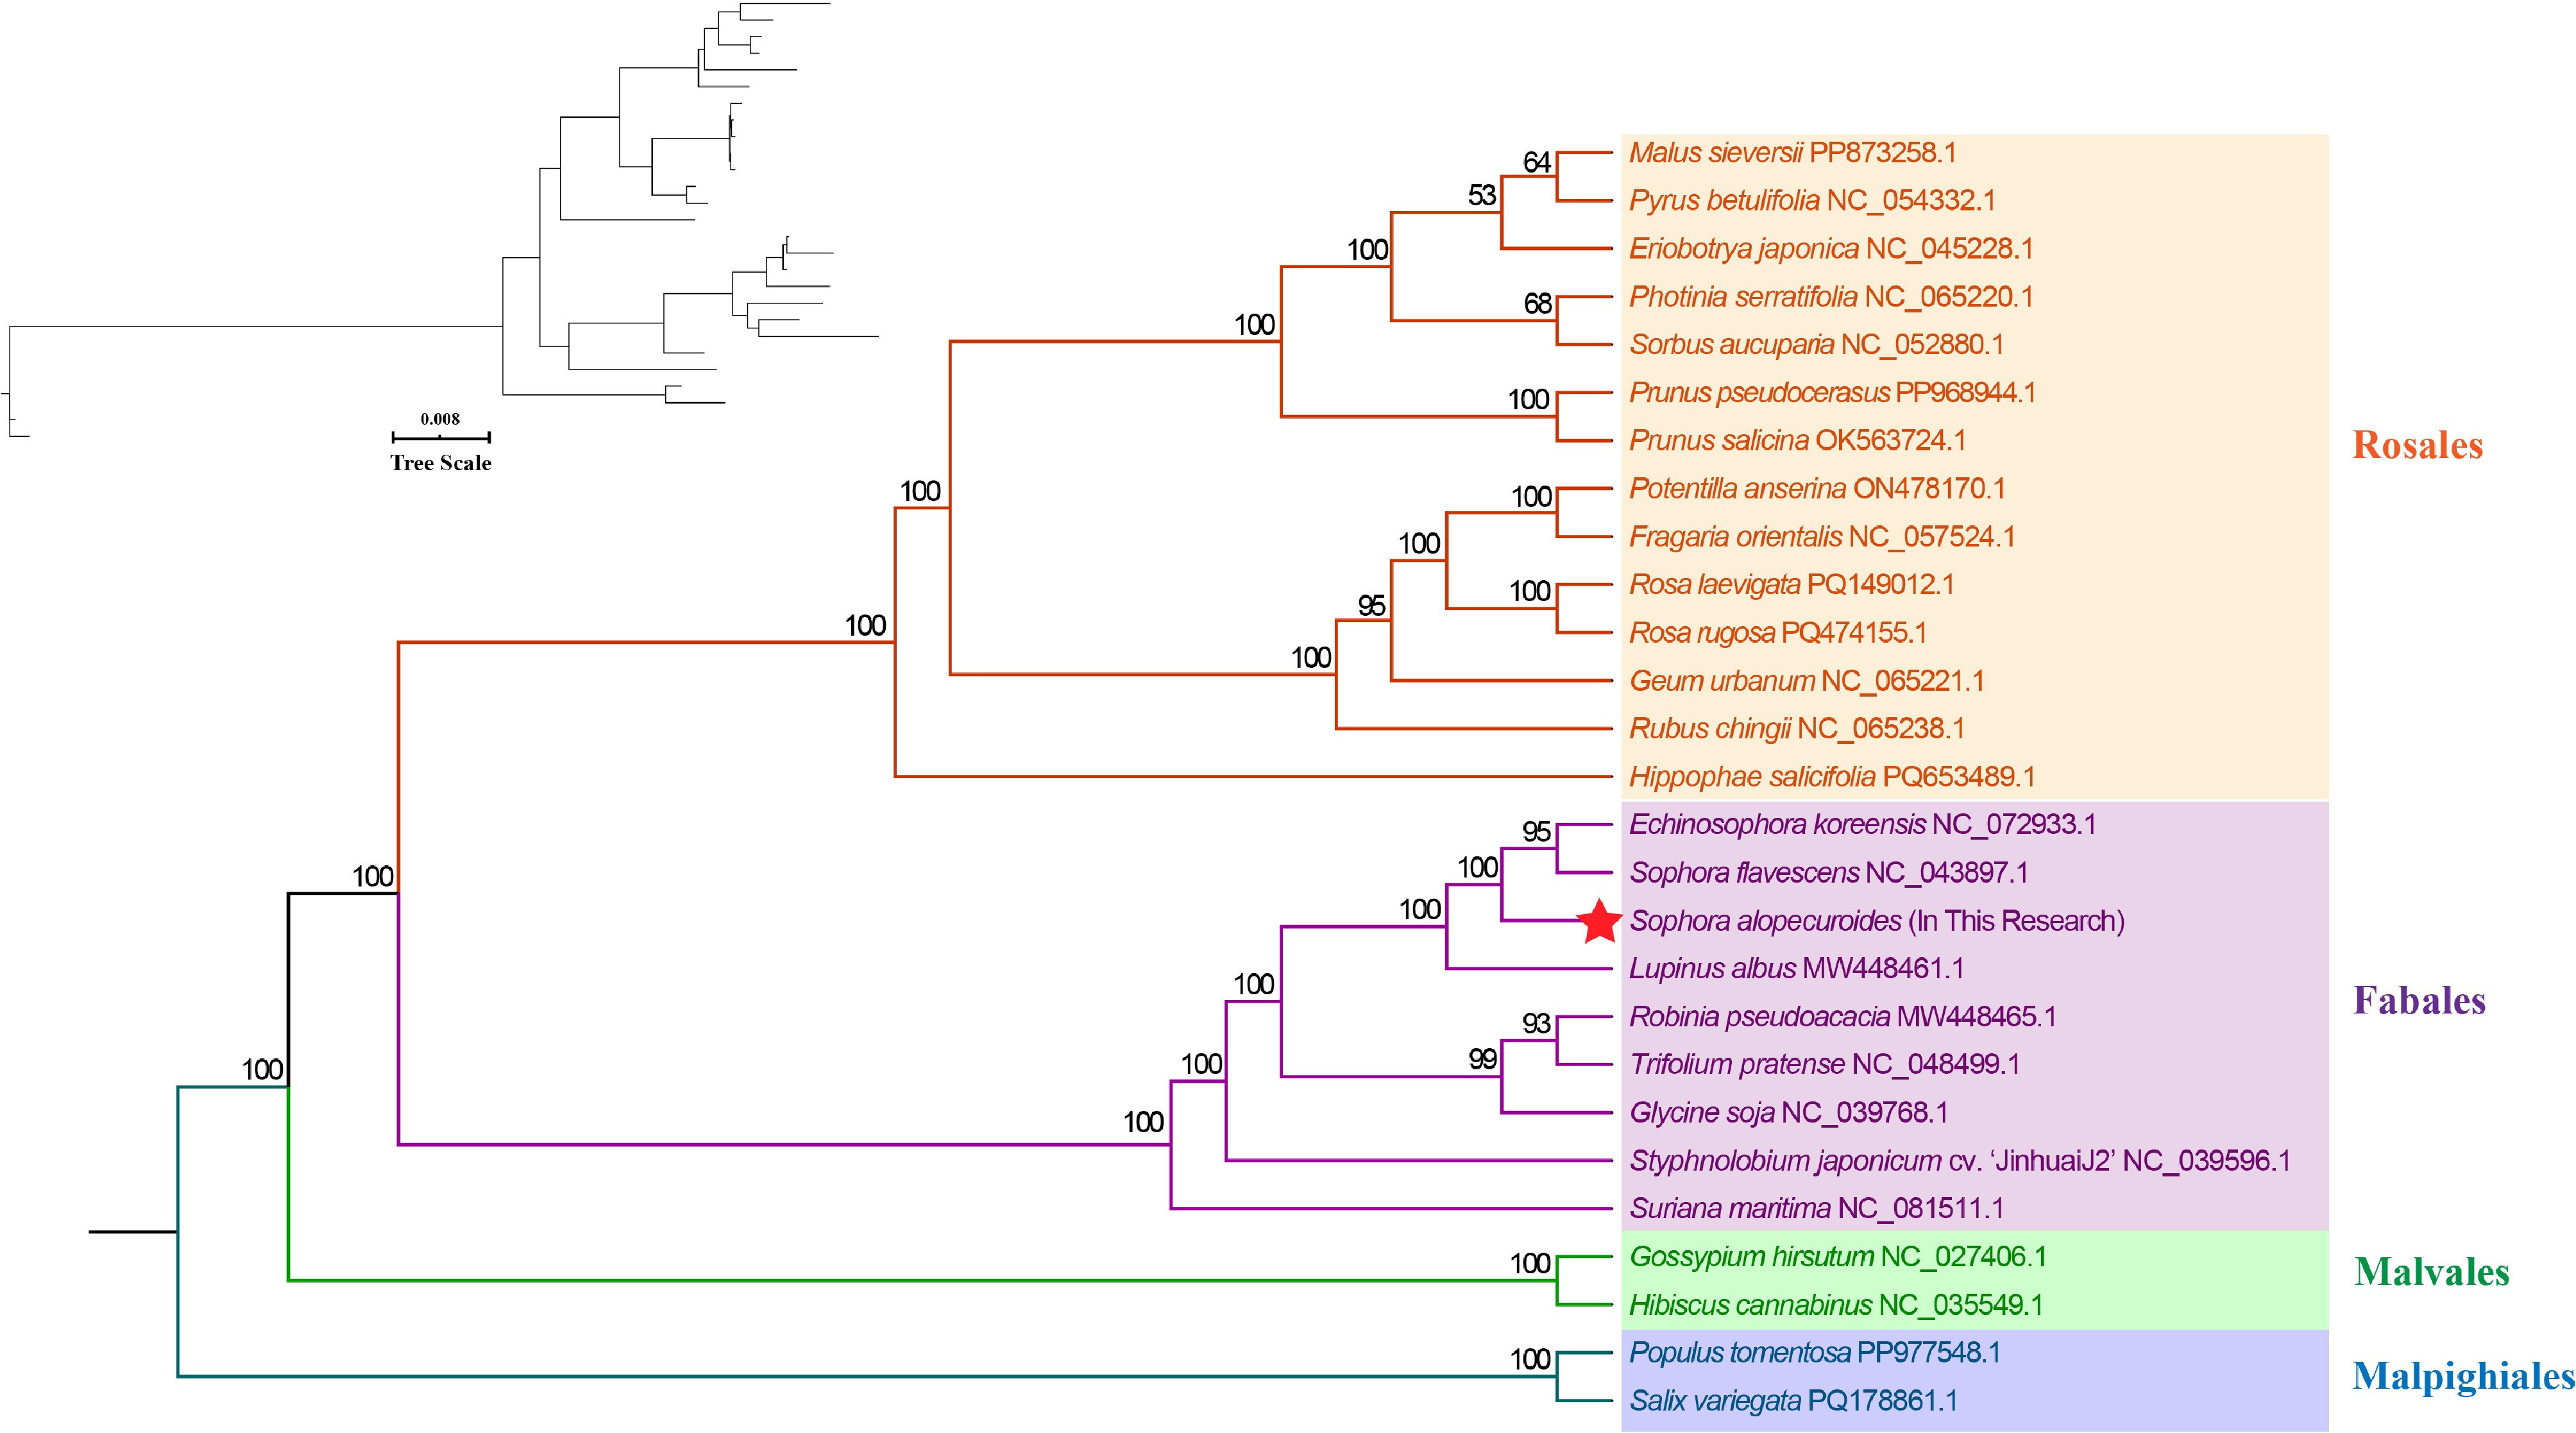
Figure 7.
Maximum likelihood tree constructed using 27 species.
-
Species Accession no. Size (bp) GC% GC1 GC2 GC3 ENC Genes tRNAs rRNAs Protein-coding
genesEchinosophora koreensis NC_072933.1 519,841 44.49% 44.37% 44.45% 44.66% 58.08% 56 16 3 37 Glycine soja NC_039768.1 402,545 45.03% 44.84% 45.32% 44.93% 58.20% 49 14 2 33 Lupinus albus MW448461.1 405,579 44.67% 44.92% 44.44% 44.64% 57.99% 51 15 3 33 Robinia pseudoacacia MW448465.1 396,058 45.24% 45.20% 45.38% 45.15% 58.23% 53 17 3 33 Sophora alopecuroides PV765881.1 528,911 44.92% 44.95% 44.98% 44.84% 58.07% 55 19 3 33 Sophora flavescens NC_043897.1 494,369 44.86% 45.00% 44.74% 44.85% 58.02% 51 16 3 32 Styphnolobium japonicum cv. 'JinhuaiJ2' NC_039596.1 484,916 45.45% 45.52% 45.24% 45.58% 58.36% 56 21 3 32 Suriana maritima NC_081511.1 458,738 43.47% 43.67% 43.51% 43.22% 57.81% 61 20 3 38 Trifolium pratense NC_048499.1 301,823 45.20% 45.07% 45.42% 45.12% 58.63% 50 15 3 32 Table 1.
General features of nine Fabales mitogenomes.
-
Group of genes Name of genes ATP synthase atp1(x2), atp4, atp6(x2), atp8, atp9 NADH dehydrogenase nad1****, nad2****, nad3, nad4***, nad4L, nad5****, nad6, nad7***, nad9 Cytochrome b cob Cytochrome c biogenesis ccmB, ccmC, ccmFc*, ccmFN Cytochrome c oxidase cox1, cox2, cox3 Maturase matR Transport membrane protein mttB Large subunit of ribosome rpl5, rpl16 Small subunit of ribosome rps1, rps3*, rps4, rps10*, rps12, rps14 Succinate dehydrogenase sdh4 Ribosome RNA rrn5, rrn18, rrn26 Transfer RNA trnA-UGC, trnG-UCC*, trnI-GAU*,
trnQ-UUG(x3)*, trnC-GCA(x2), trnD-GUC, trnE-UUC, trnF-GAA, trnG-GCC, trnH-GUG, trnK-UUU, trnI-CAU, trnfM-CAU(x2),
trnM-CAU, trnN-GUU, trnP-UGG, trnS-GCU, trnW-CCA, trnY-GUAGenes with introns are denoted with *. The numbers in brackets represent the copy number of the gene. Table 2.
Annotated genes in the mitogenome of S. alopecuroides.
Figures
(7)
Tables
(2)