-
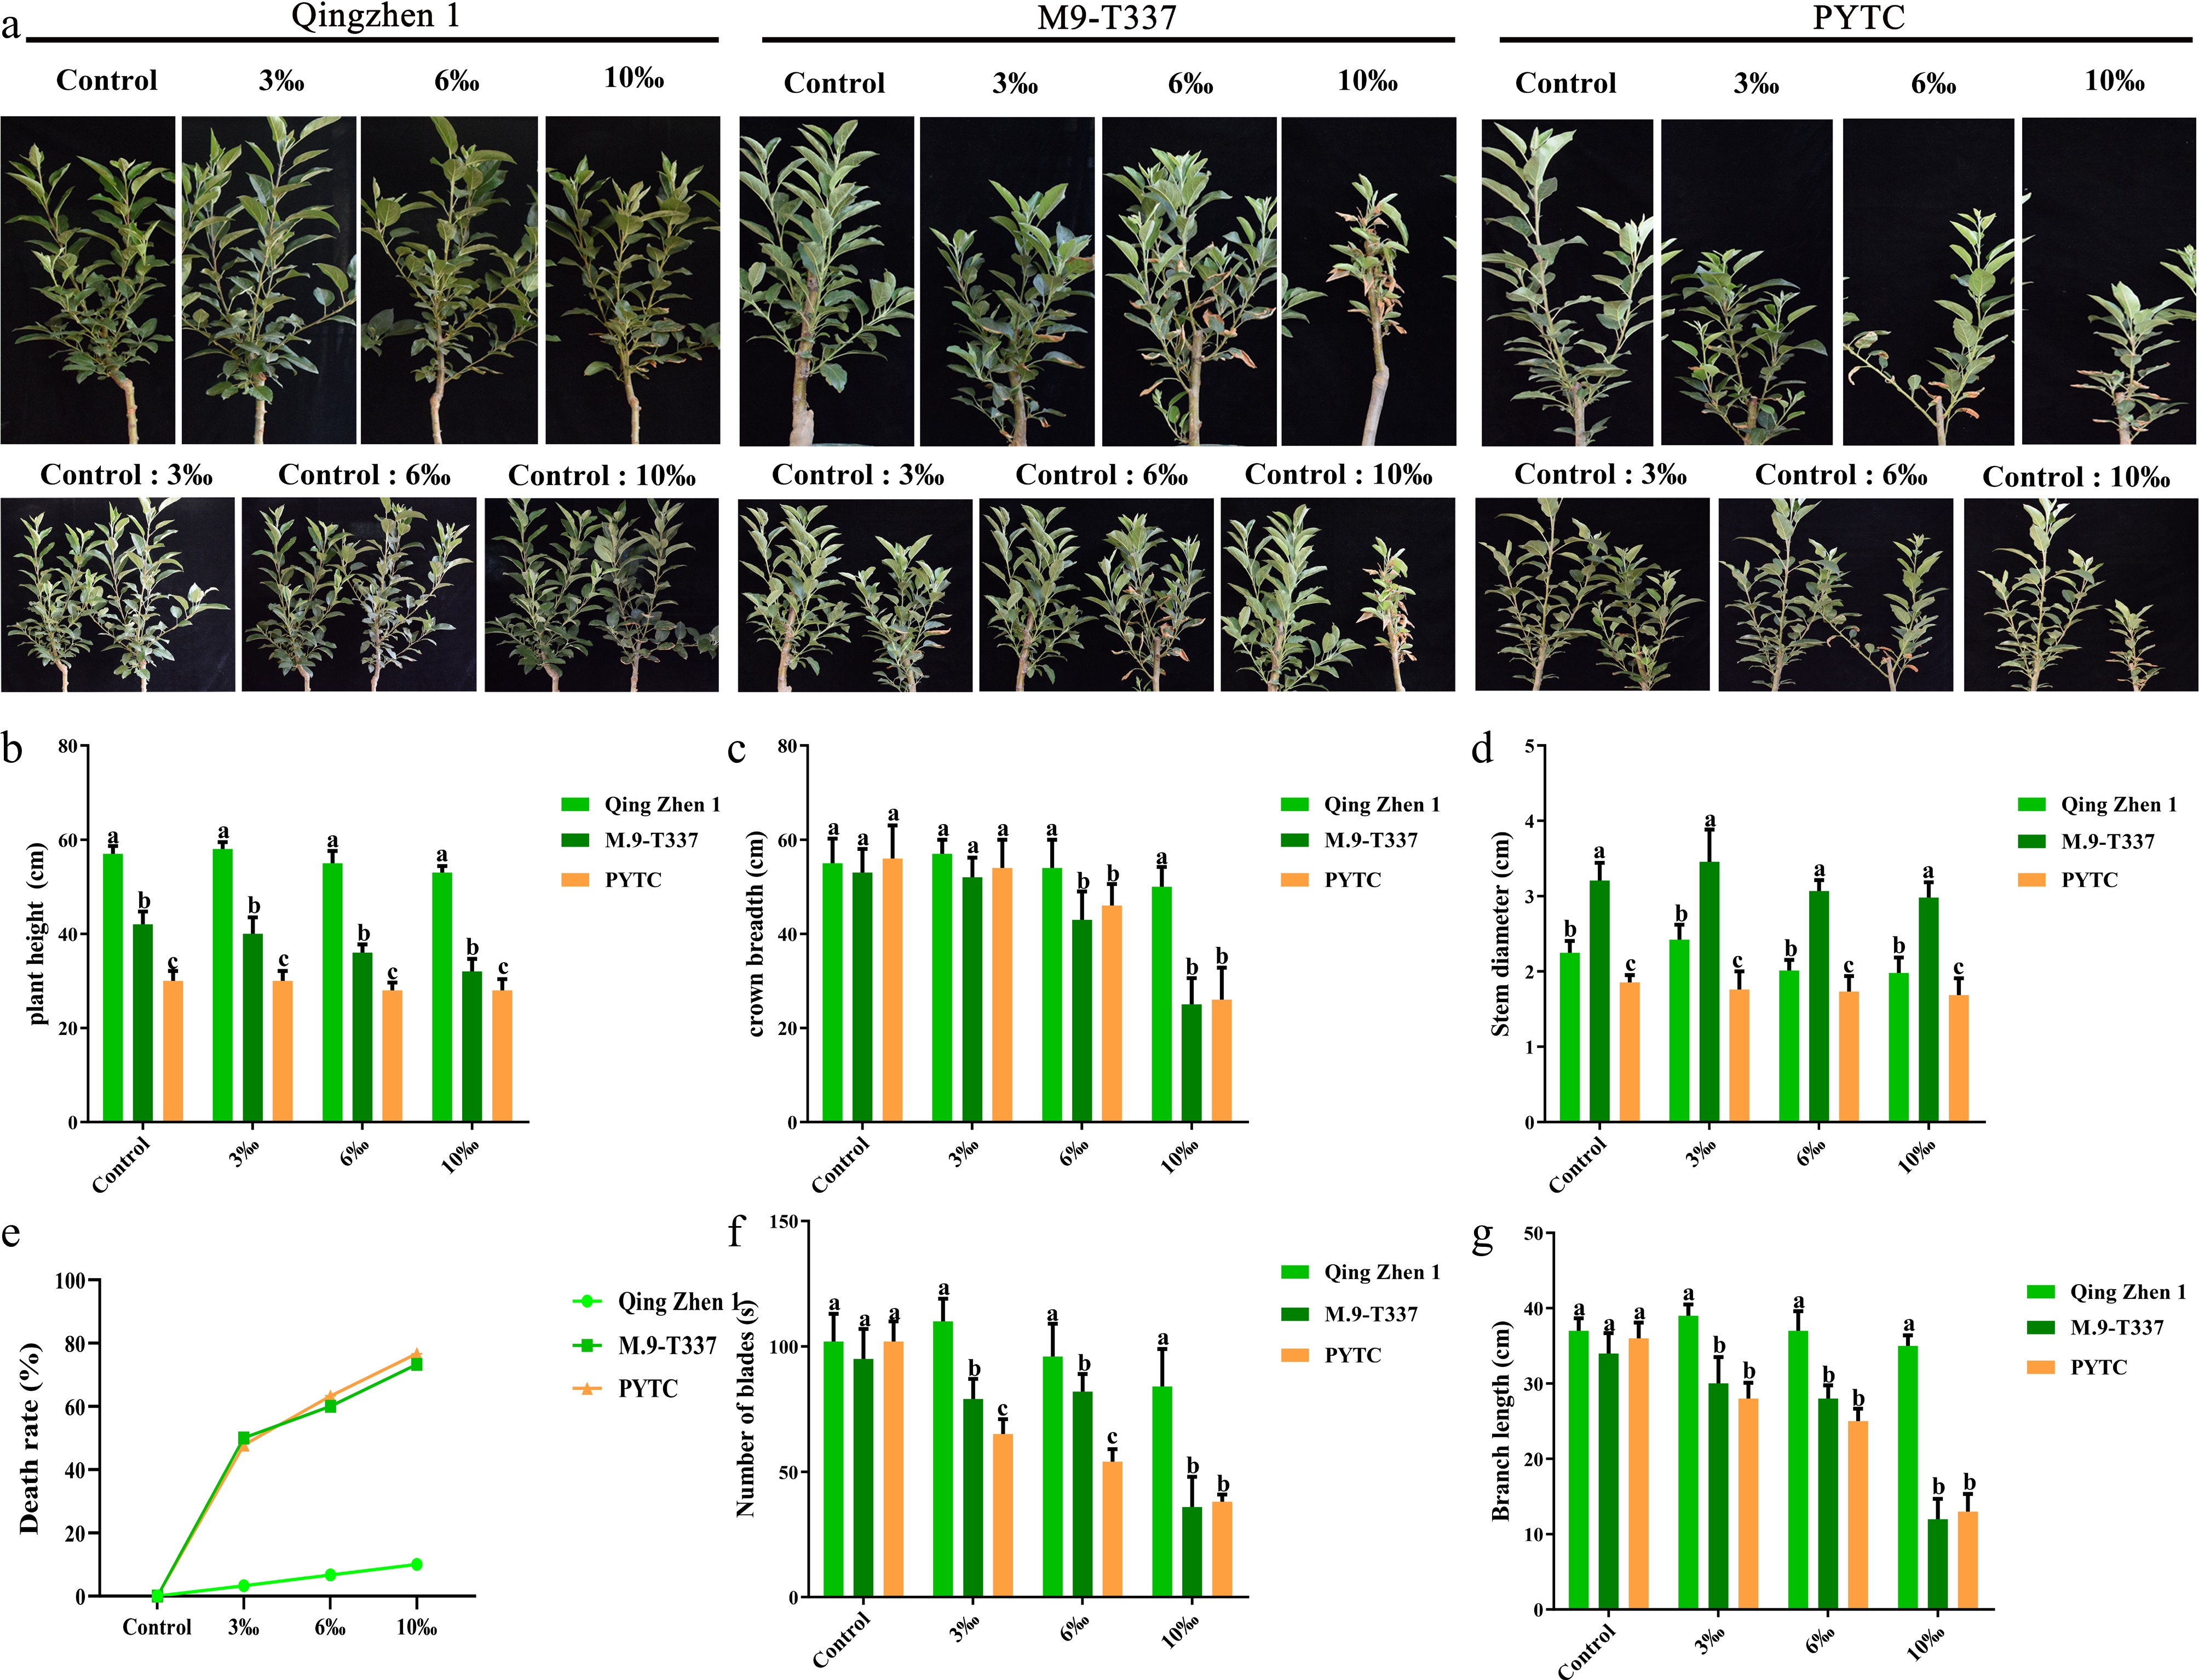
Figure 1.
Plant growth indicators under salt stress. (a) The growth phenotypes of Luli/Qingzhen-1, Luli/M9-T337, and 'Luli'/PYTC were studied (1 month after transplanting into saline-alkali soil). (b) Plant height, (c) crown width, (d) stem diameter, (e) mortality rate, (g) branch length, the value is the average± standard error (n ≥ 3), and the letter indicates that there is a significant difference at the p < 0.05 level under each concentration treatment.
-
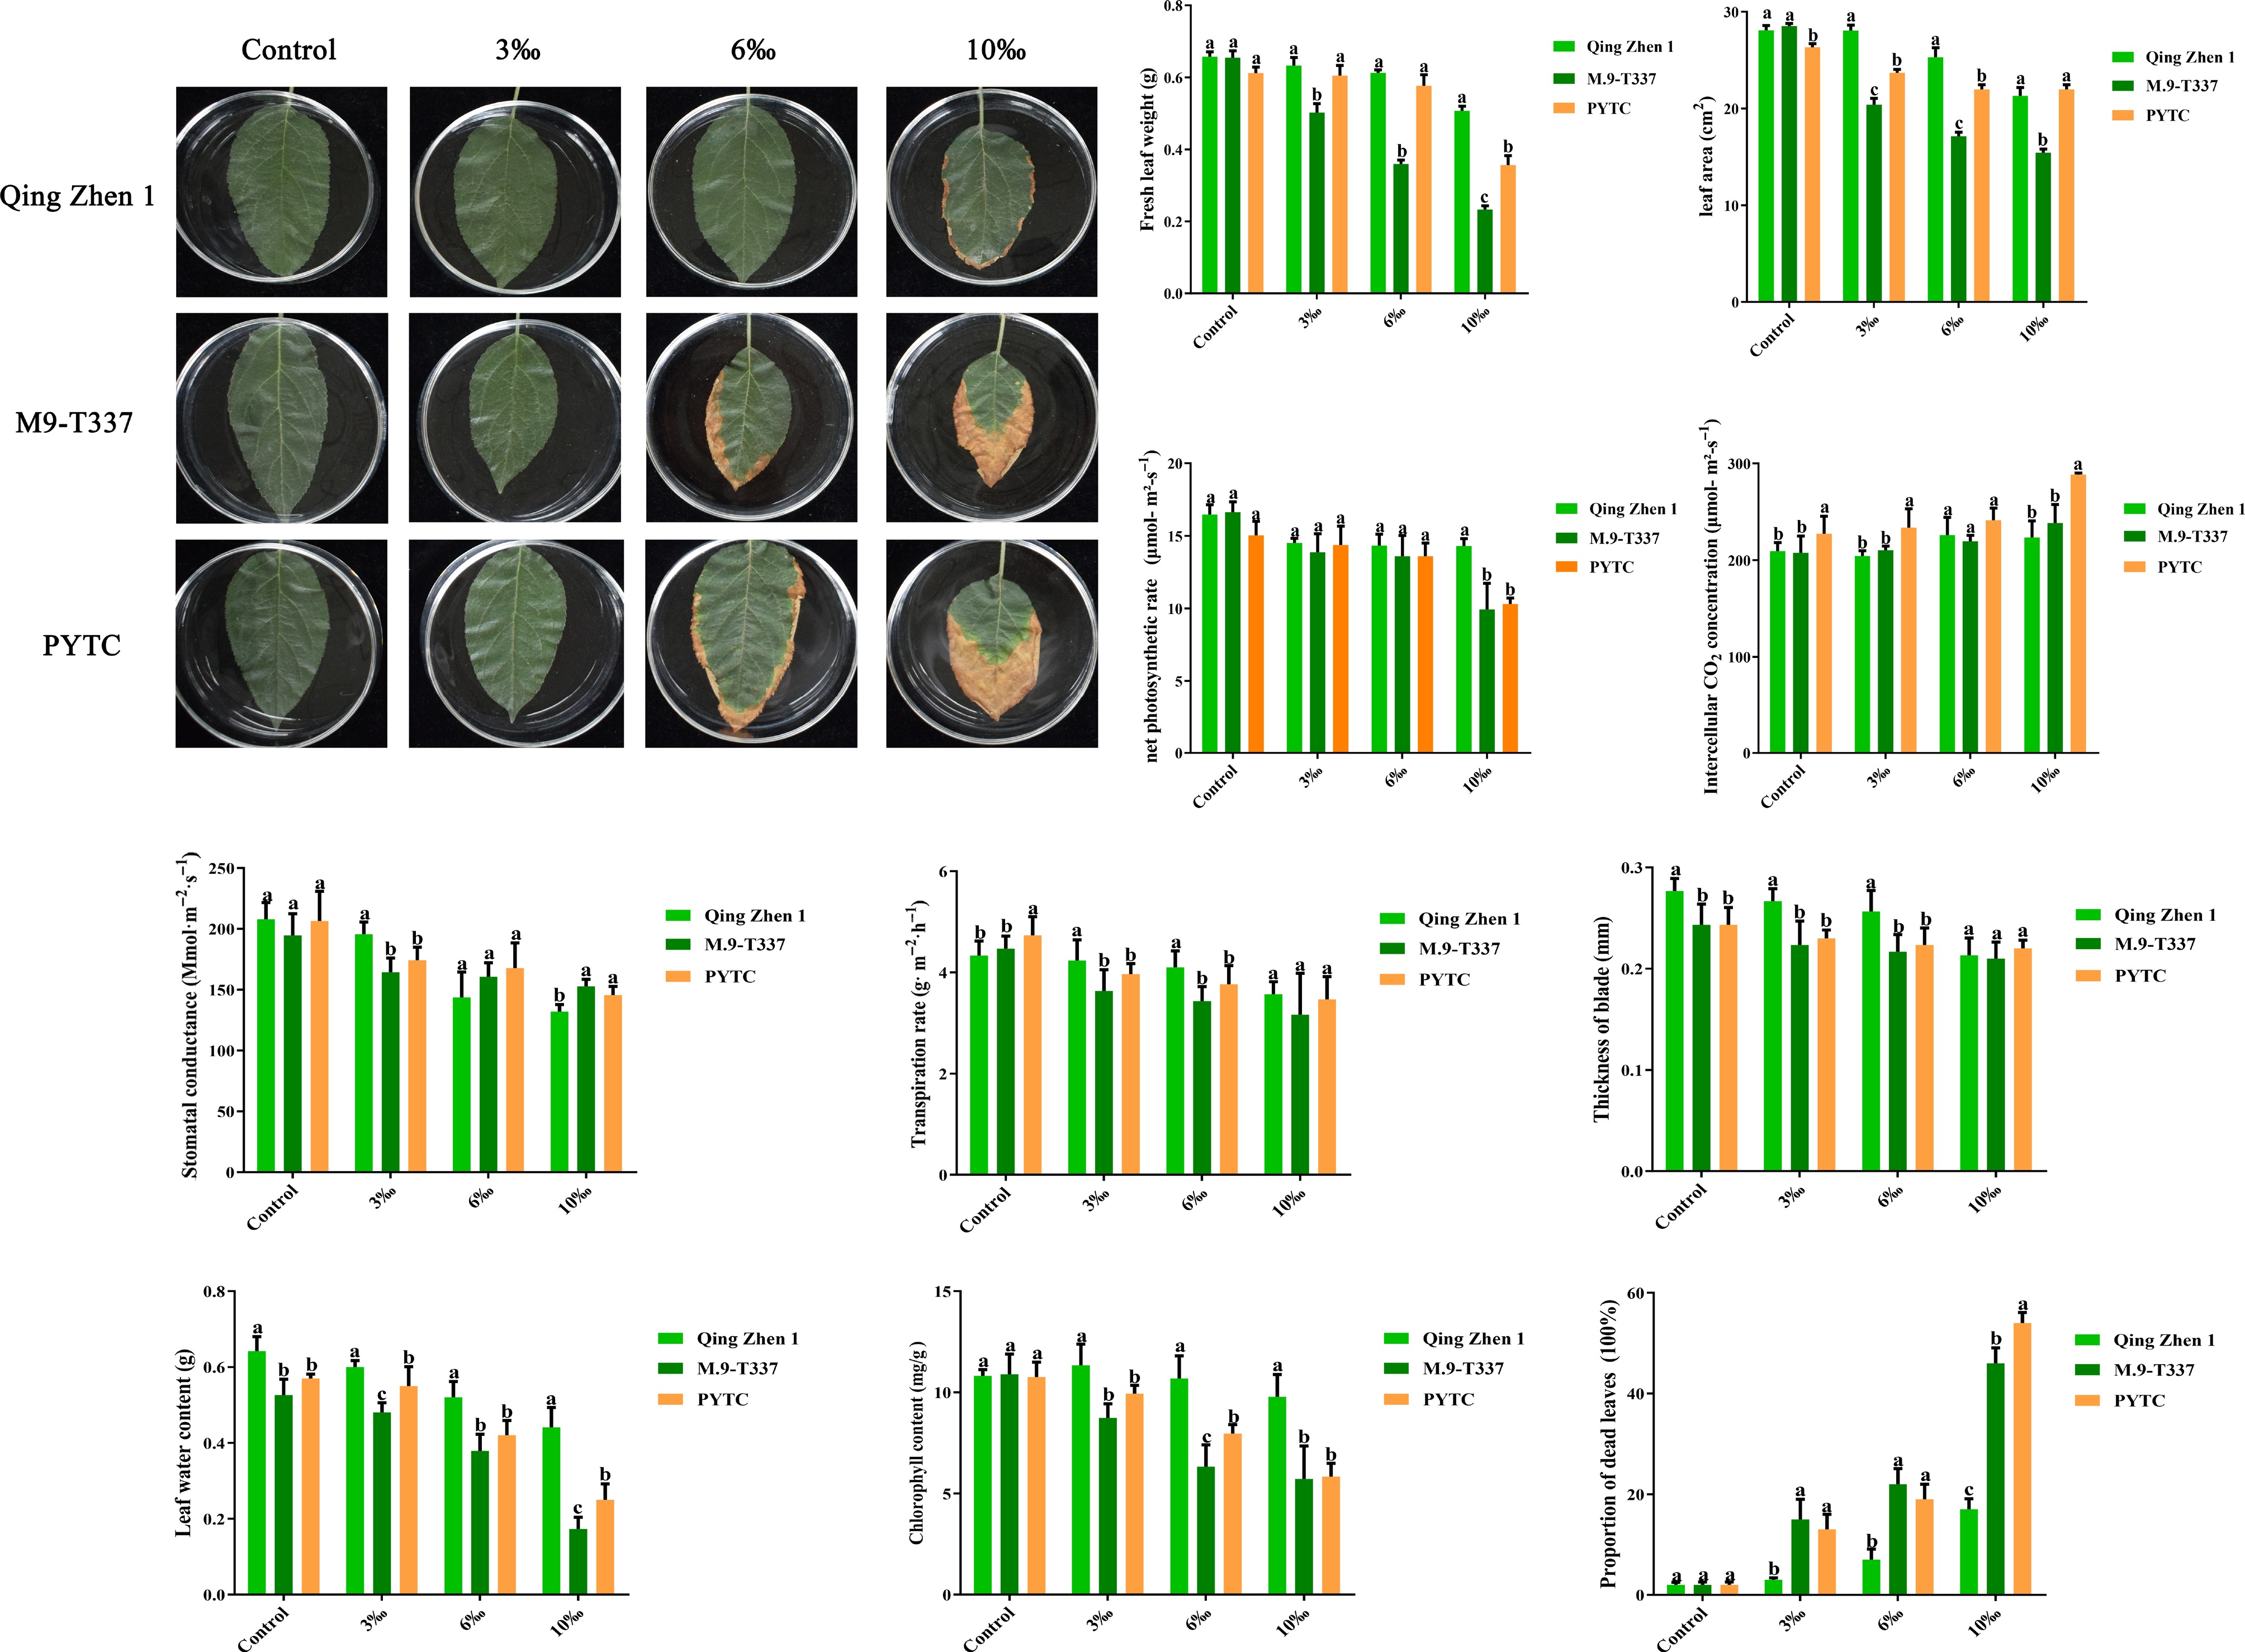
Figure 2.
Effects of salt stress on plant leaves. (a) Leaf damage degree phenotype (2 months after transplanting into saline-alkali soil). (b) Leaf dry weight, (c) leaf area, (d) net photosynthetic rate (Pn), (e) intercellular carbon dioxide concentration (Ci), (f) stomatal conductance (Gs), (g) transpiration rate (E), (h) leaf thickness, (i) leaf water content, (j) chlorophyll, (k) proportion of dead leaves. Values are mean ± standard error (n ≥ 3), and letters indicate significantdifferences at p < 0.05 levels under each concentration treatment.
-
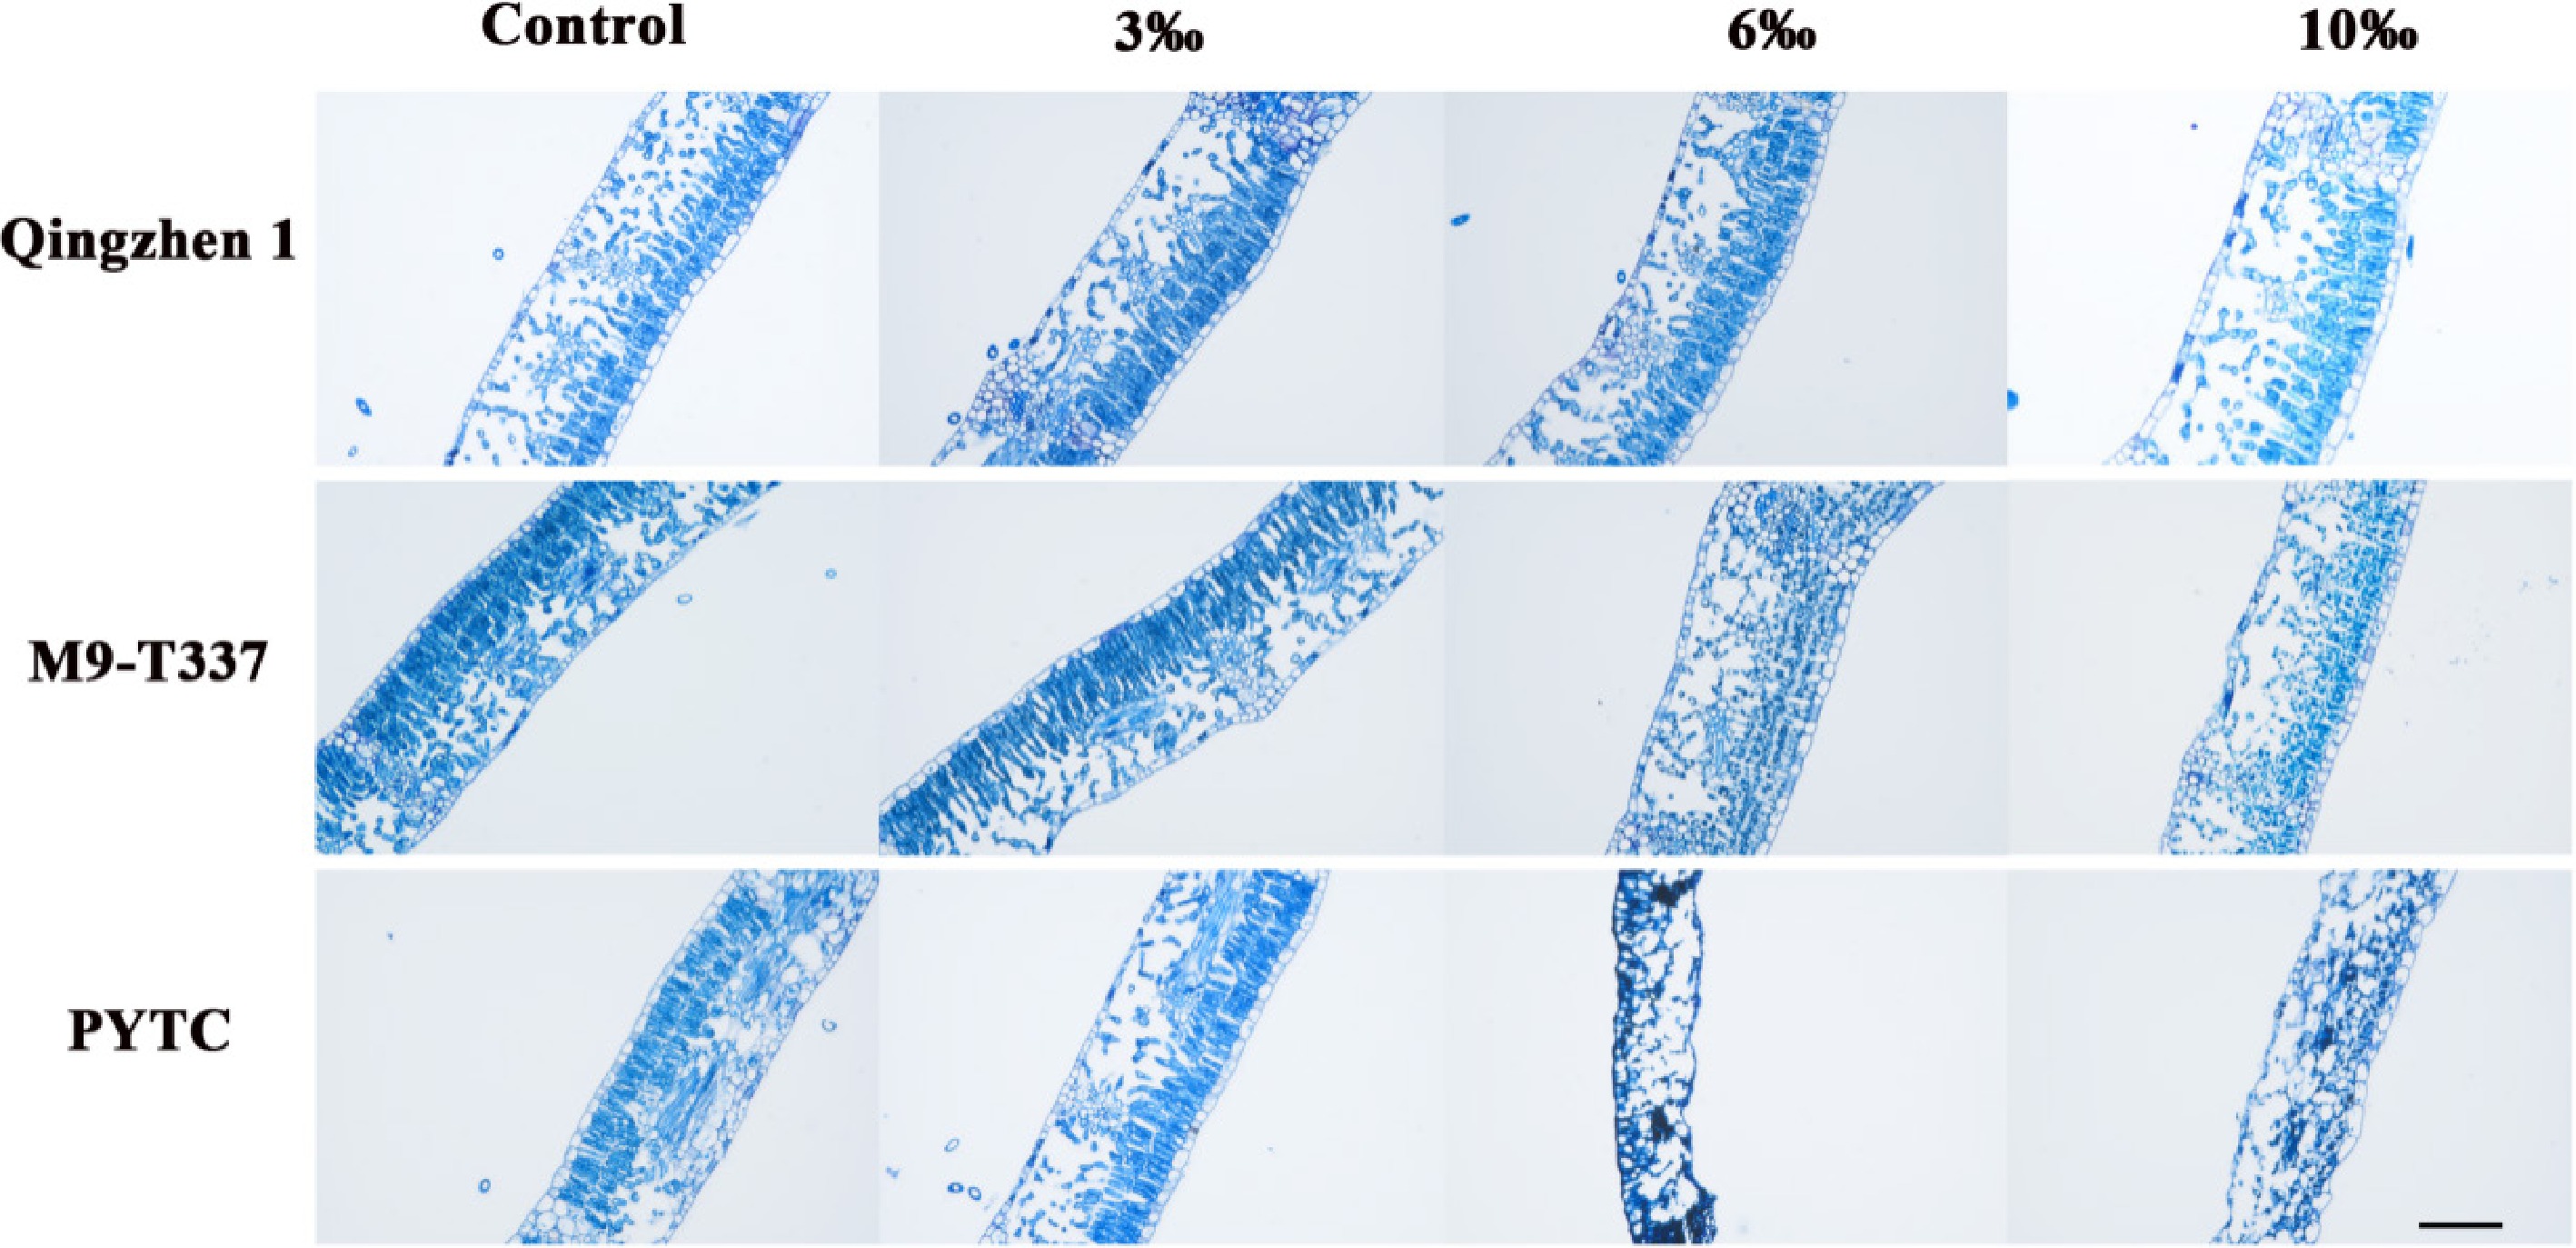
Figure 3.
Effects of salt stress on plant leaf structure. Scale bars: 500 µm (2 months after transplanting into saline-alkali soil).
-
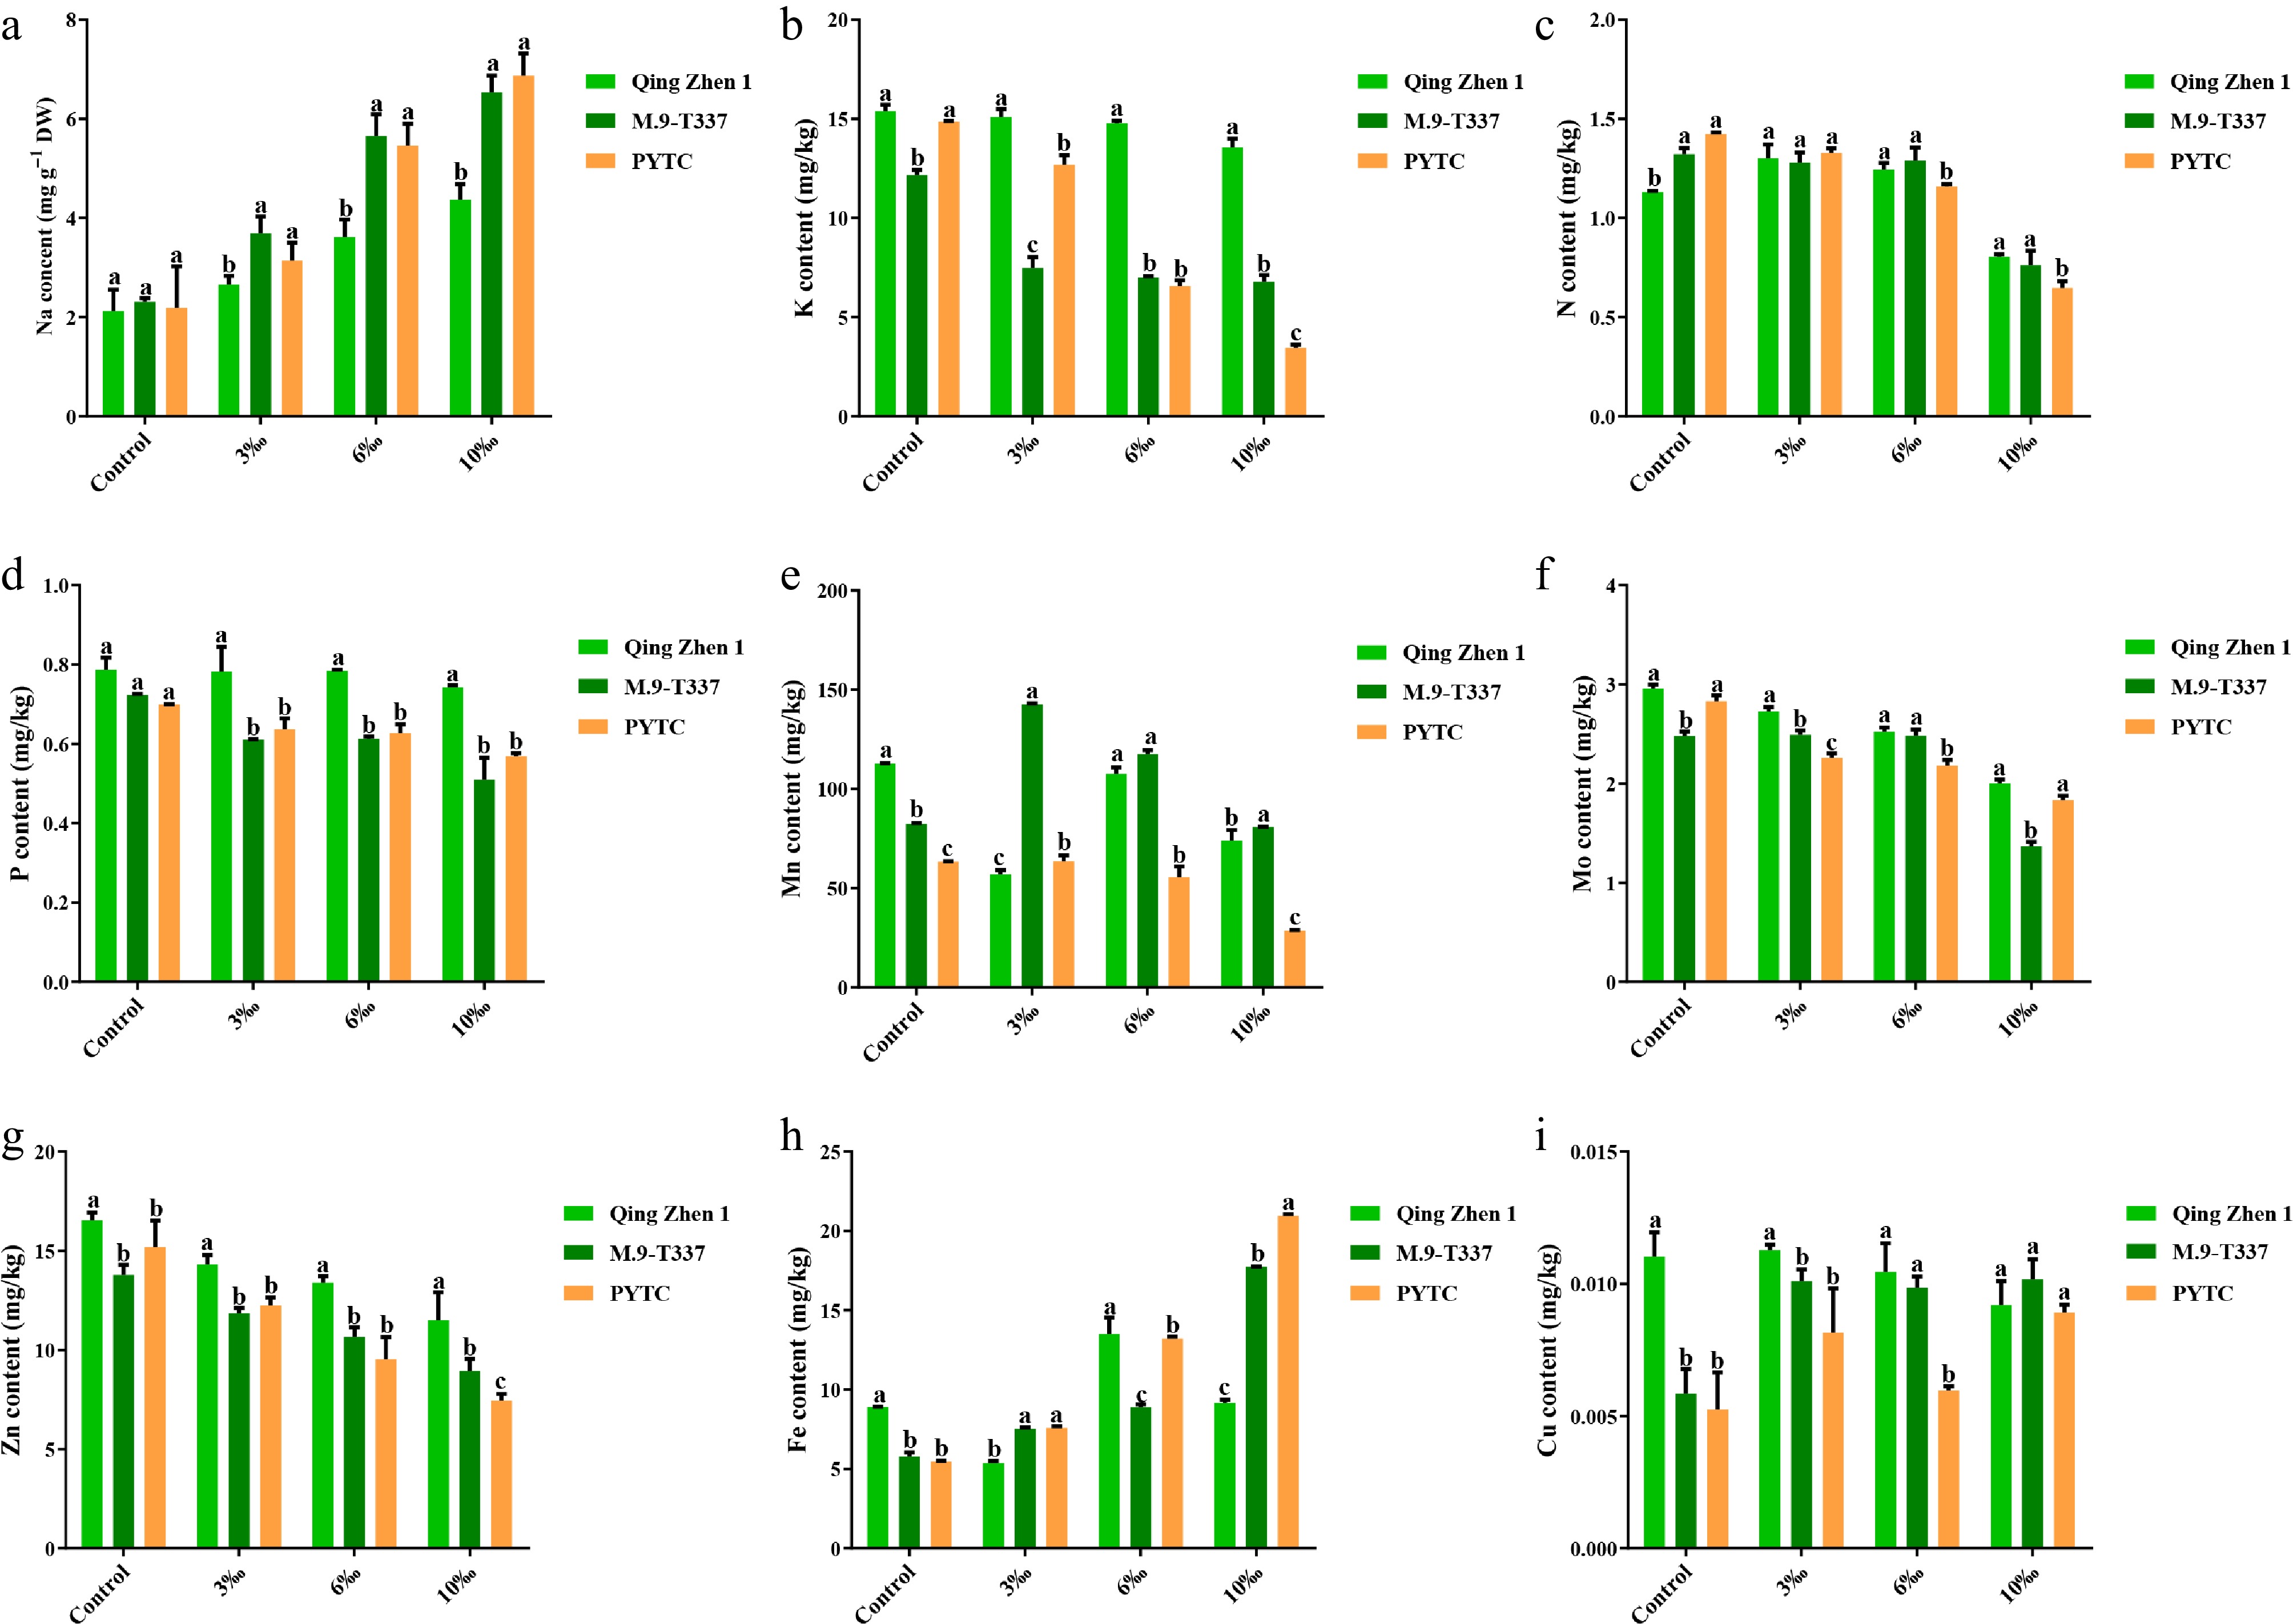
Figure 4.
Metal ion content (2 months after transplanting into saline-alkali soil). (a) Na ion content, (b) K ion content, (c) N ion content, (d) P ion content, (e) Mn ion content, (f) Mo ion content, (g) Zn ion content, (h) Fe ion content, (i) Cu ion content. The value is the average ± standard error (n ≥ 3), the letter indicates that there is a significant difference at the p < 0.05 level under each concentration treatment.
-
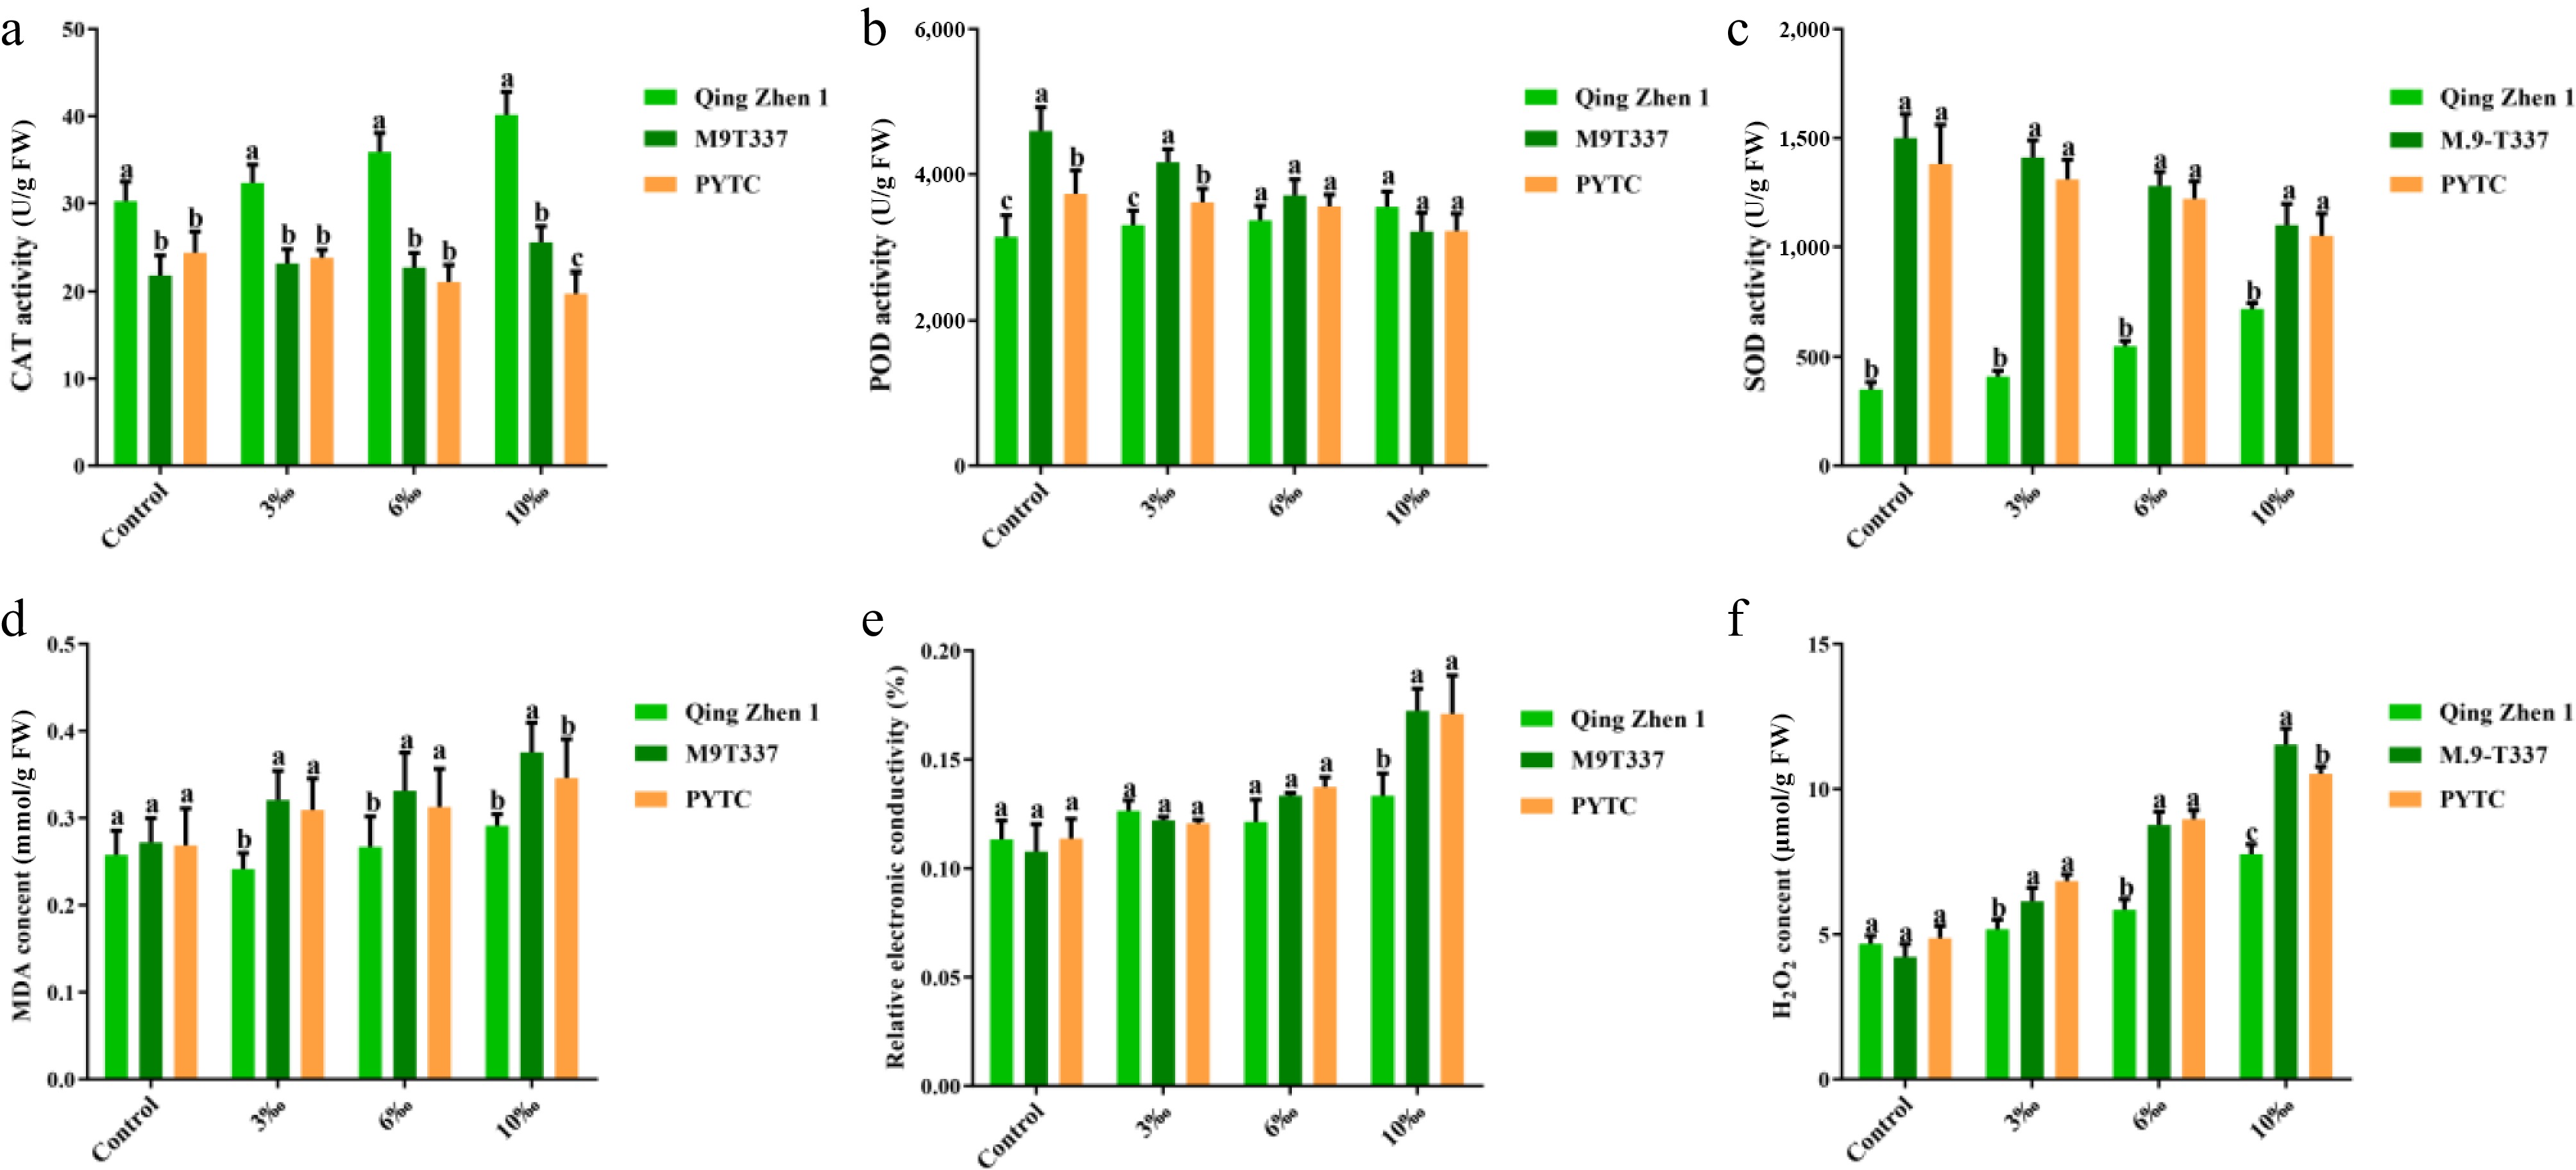
Figure 5.
Activity of antioxidant enzymes and contents of MDA and REC in plants under salt stress (2 months after transplanting into saline-alkali soil). (a) CAT activity, (b) POD activity, (c) SOD activity, (d) MDA content, (e) relative electrolytic leakage, (f) hydrogen peroxide content. The value is the average ± standard error (n ≥ 3), the letter indicates that there is a significant difference in the p < 0.05 level under each concentration treatment.
-
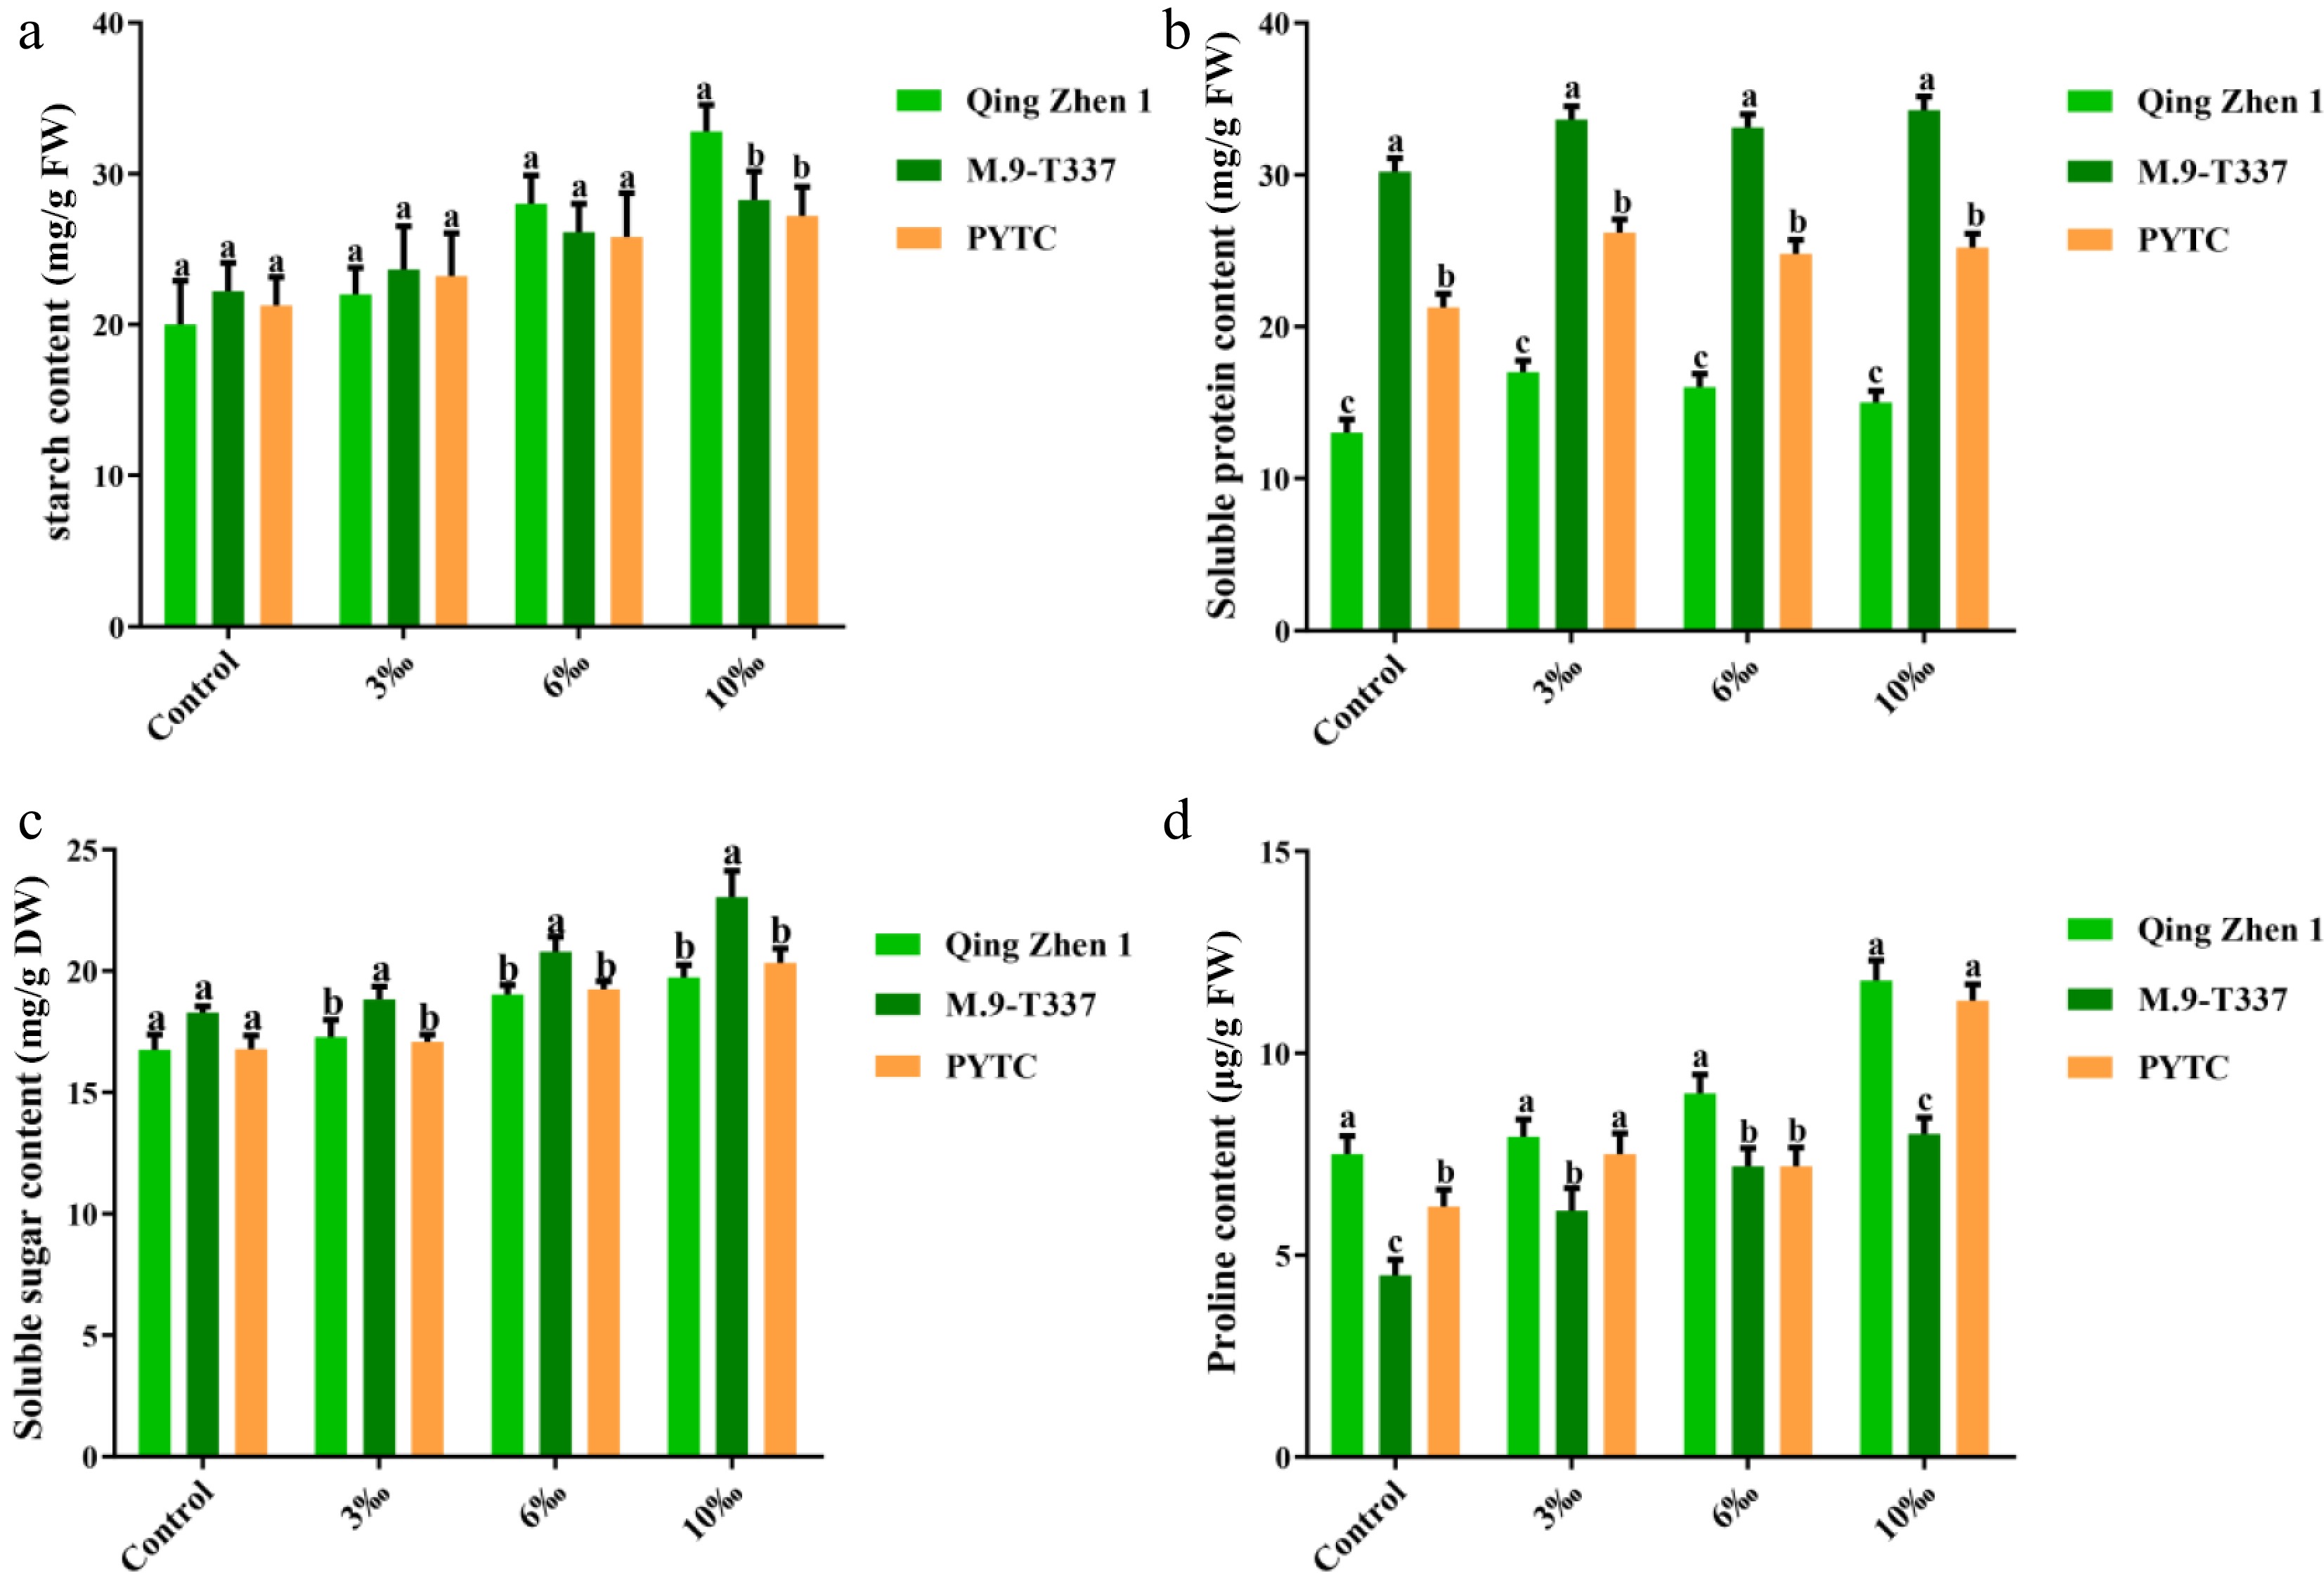
Figure 6.
Contents of osmoregulatory substances in plants under salt stress (2 months after transplanting into saline-alkali soil). (a) Starch content, (b) soluble protein content, (c) soluble sugar content, (d) proline content, the value is the average ± standard error (n ≥ 3), the letter indicates that there is a significant difference in the p < 0.05 level under each concentration treatment.
-
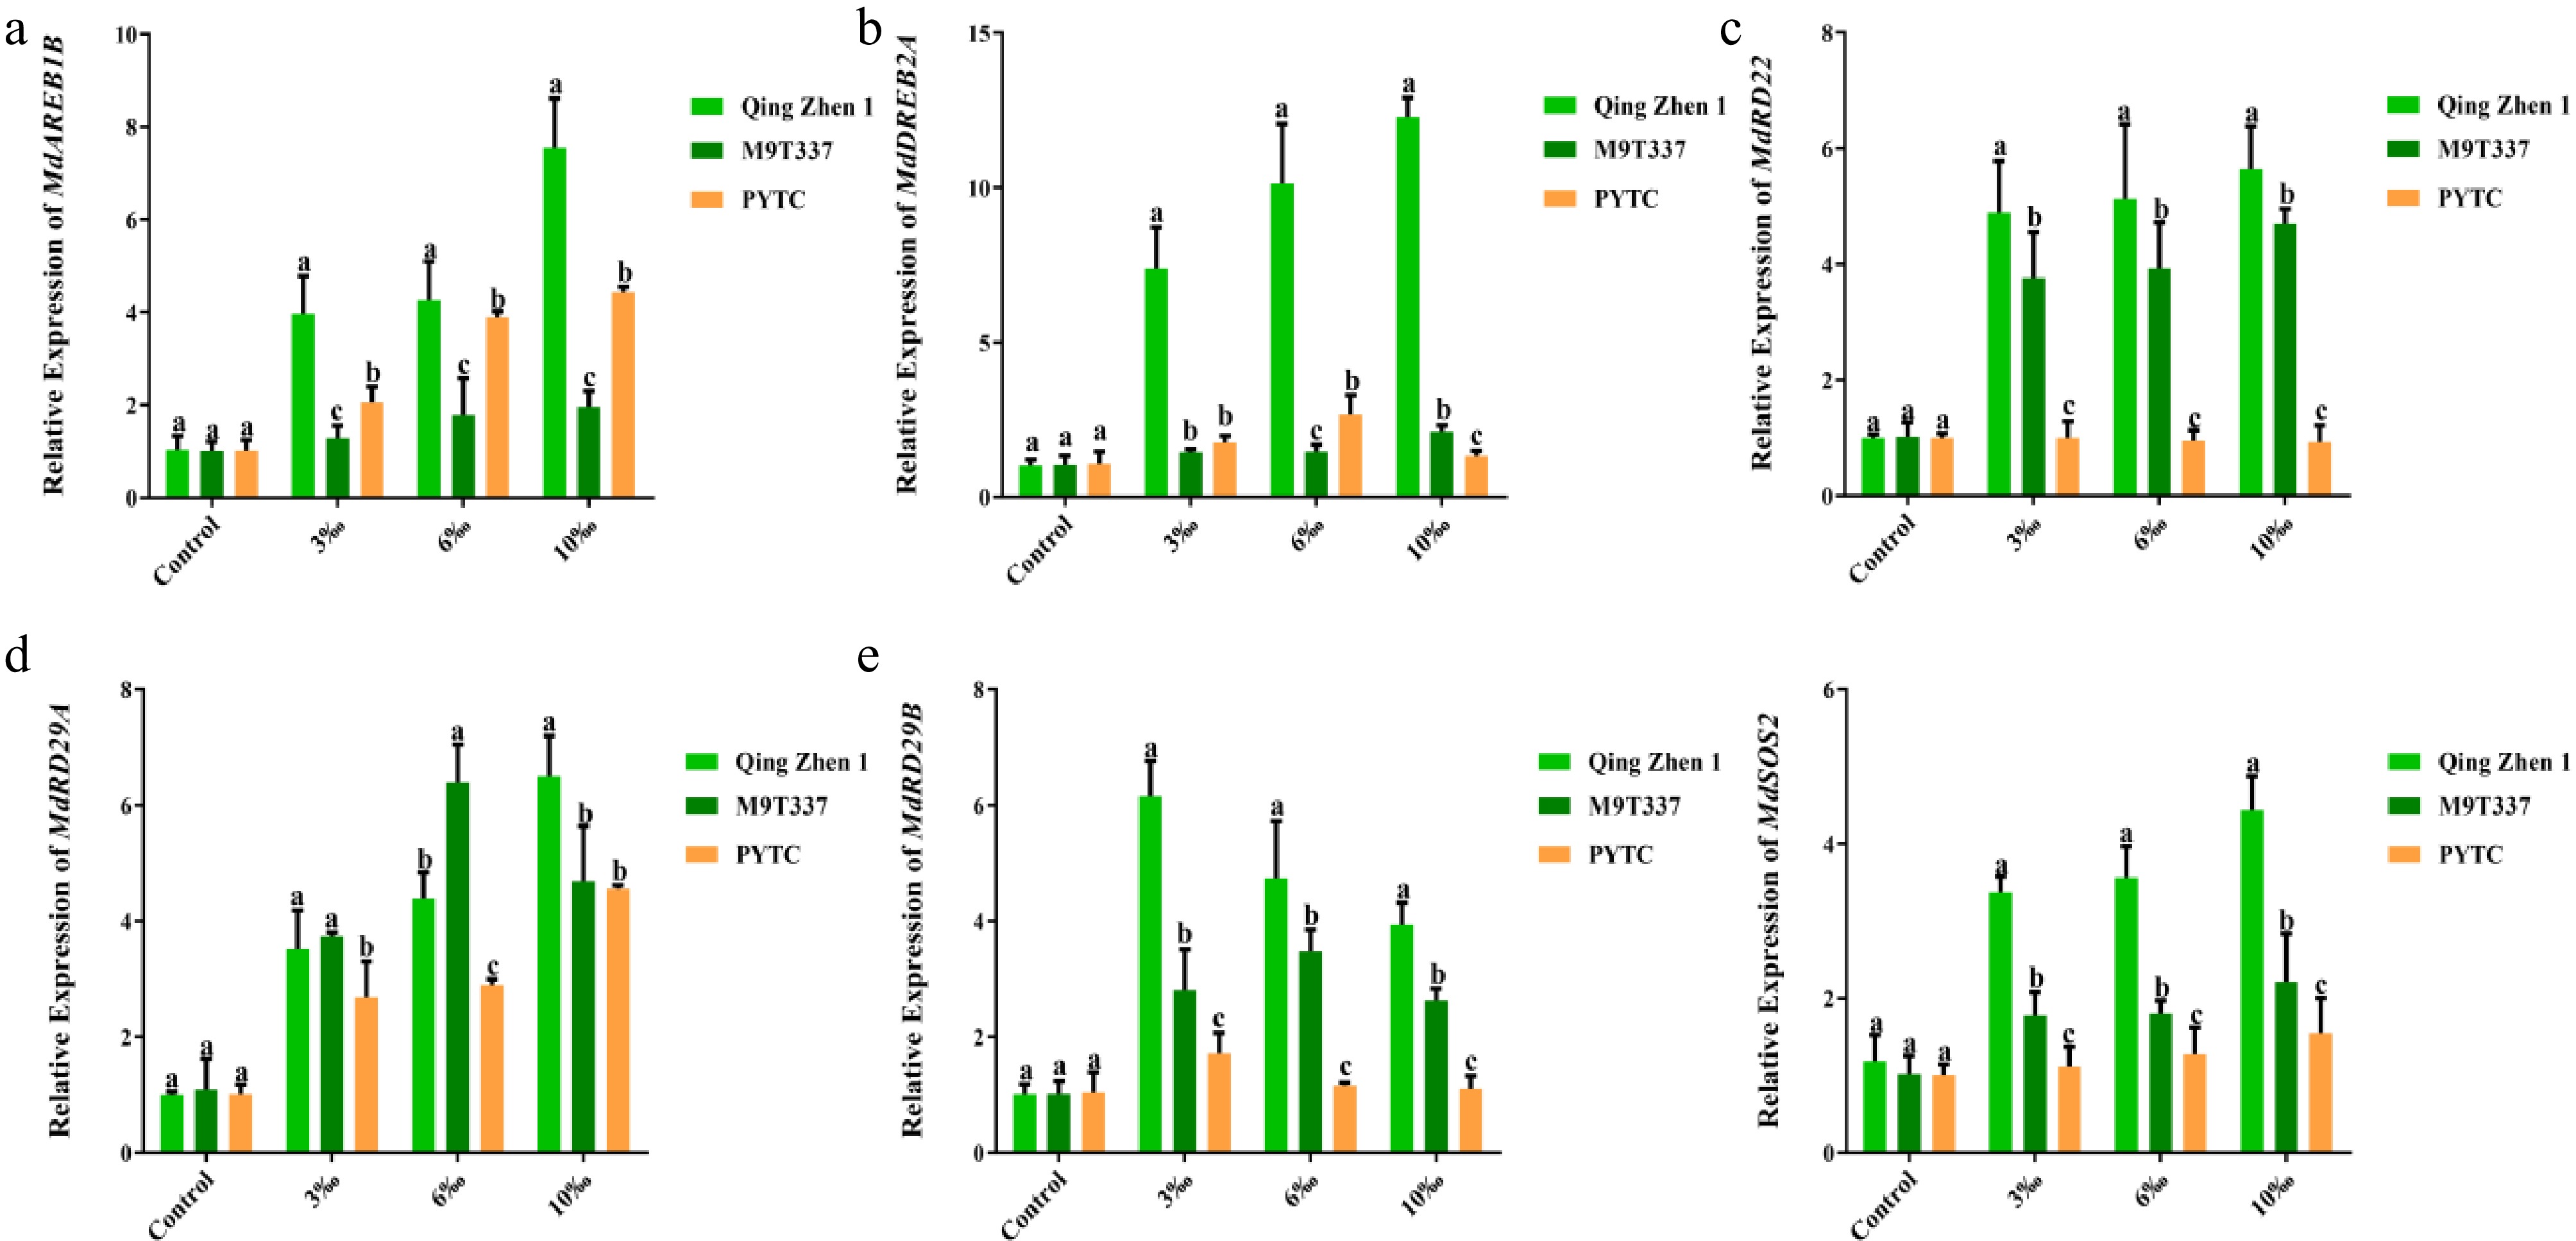
Figure 7.
Expression of related genes in plants under salt stress (2 months after transplanting into saline-alkali soil). Expression of (a) MdAREB1B, (b) MdDREB2A, (c) MdRD22, (d) MdRD29A, (e) MdRD29B, (f) MdSOS2. The value is the mean ± standard error (n ≥ 3), letters indicate significant differences at the p < 0.05 level for each concentration treatment.
-
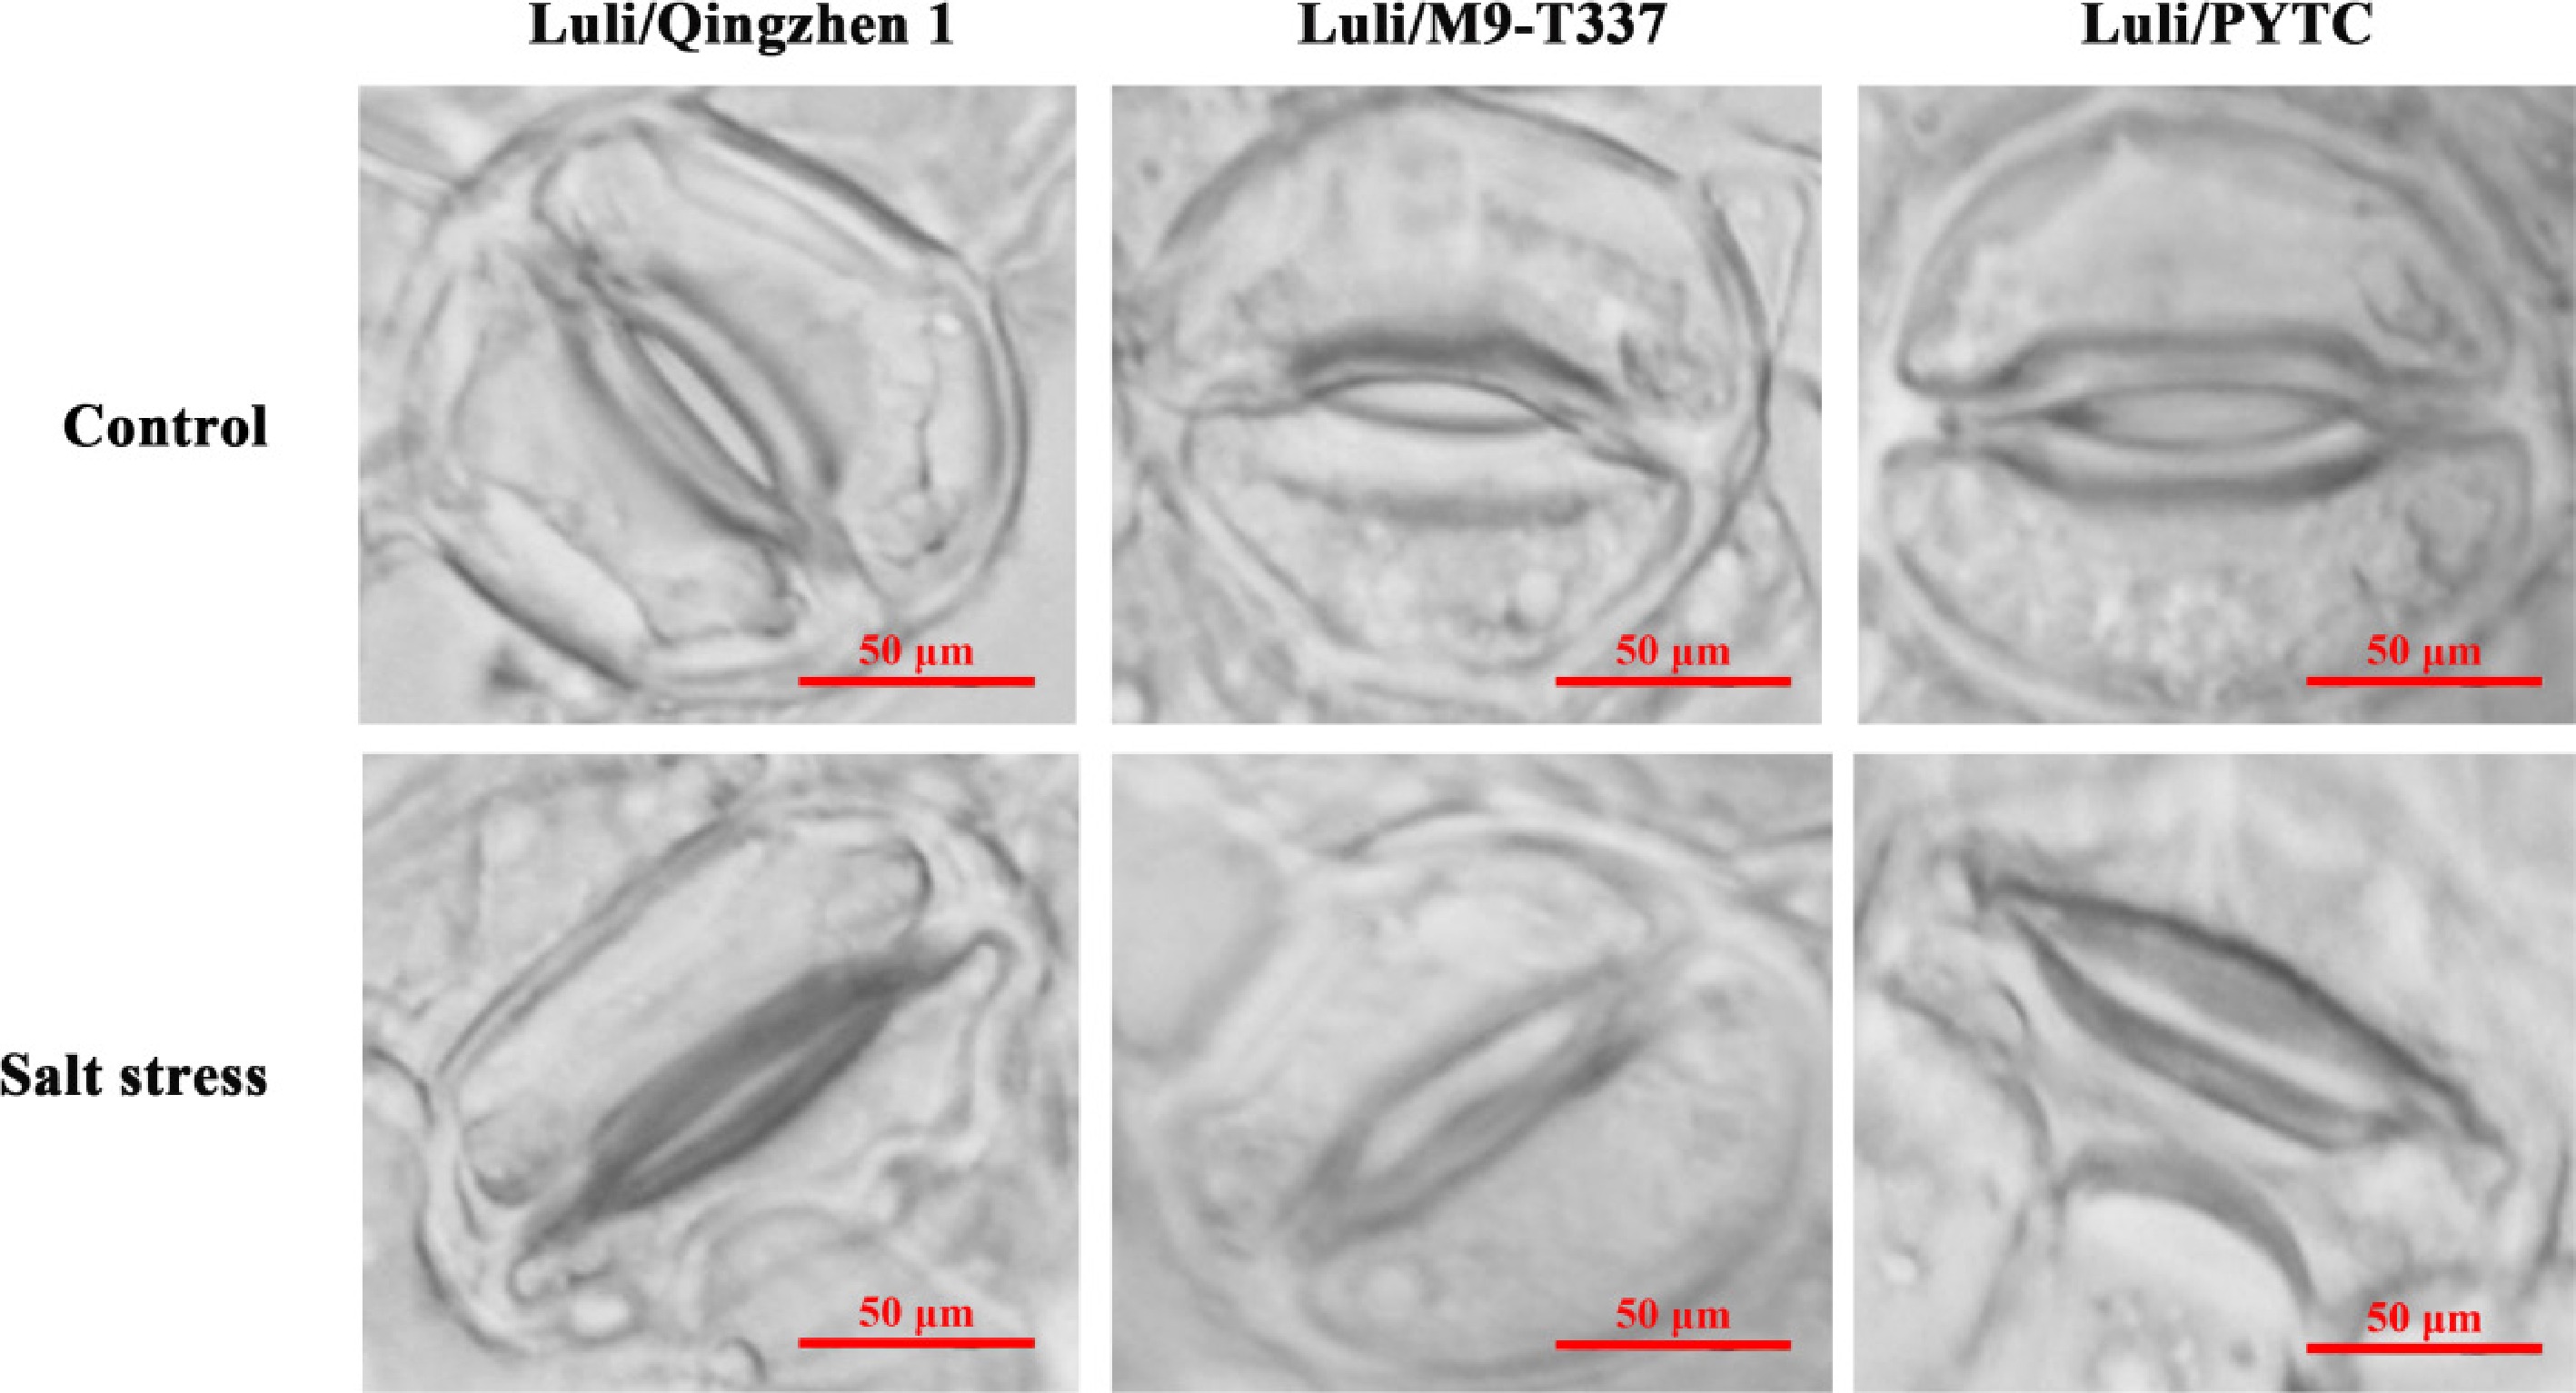
Figure 8.
Effect of salt stress on stomata opening and closing of leaves with different rootstock-scion combination. (Bar = 50 μm) (2 months after transplanting into saline-alkali soil).
-
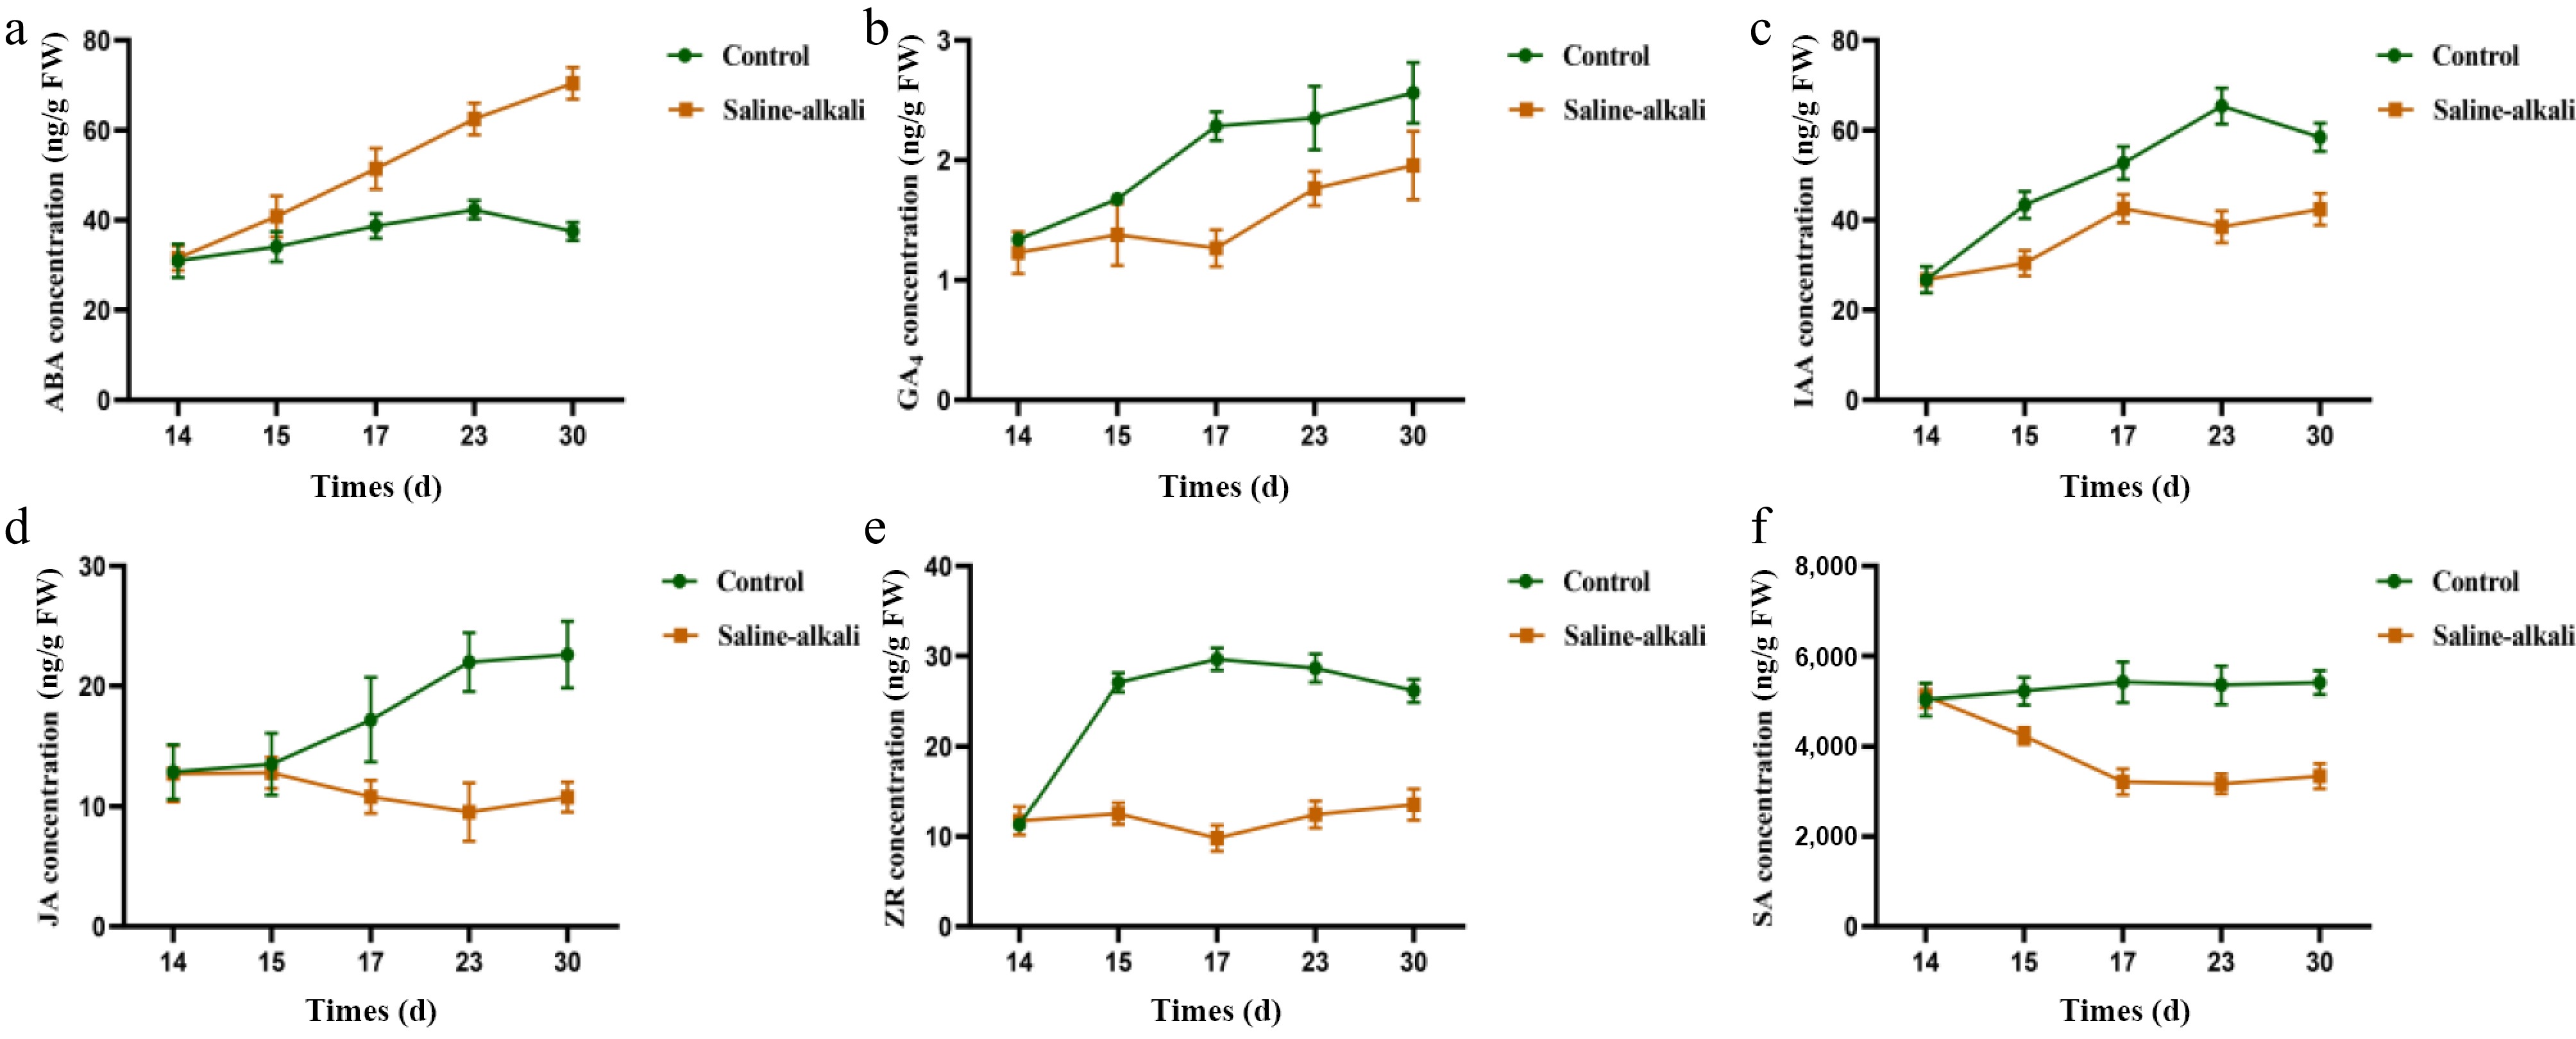
Figure 9.
Effects of more resistant rootstock hormones under salt stress (2 months after transplanting into saline-alkali soil). (a) ABA content, (b) GA4 content, (c) IAA content, (d) JA content, (e) ZR content, (f) SA content. The value is the mean ± standard error (n = 10).
-
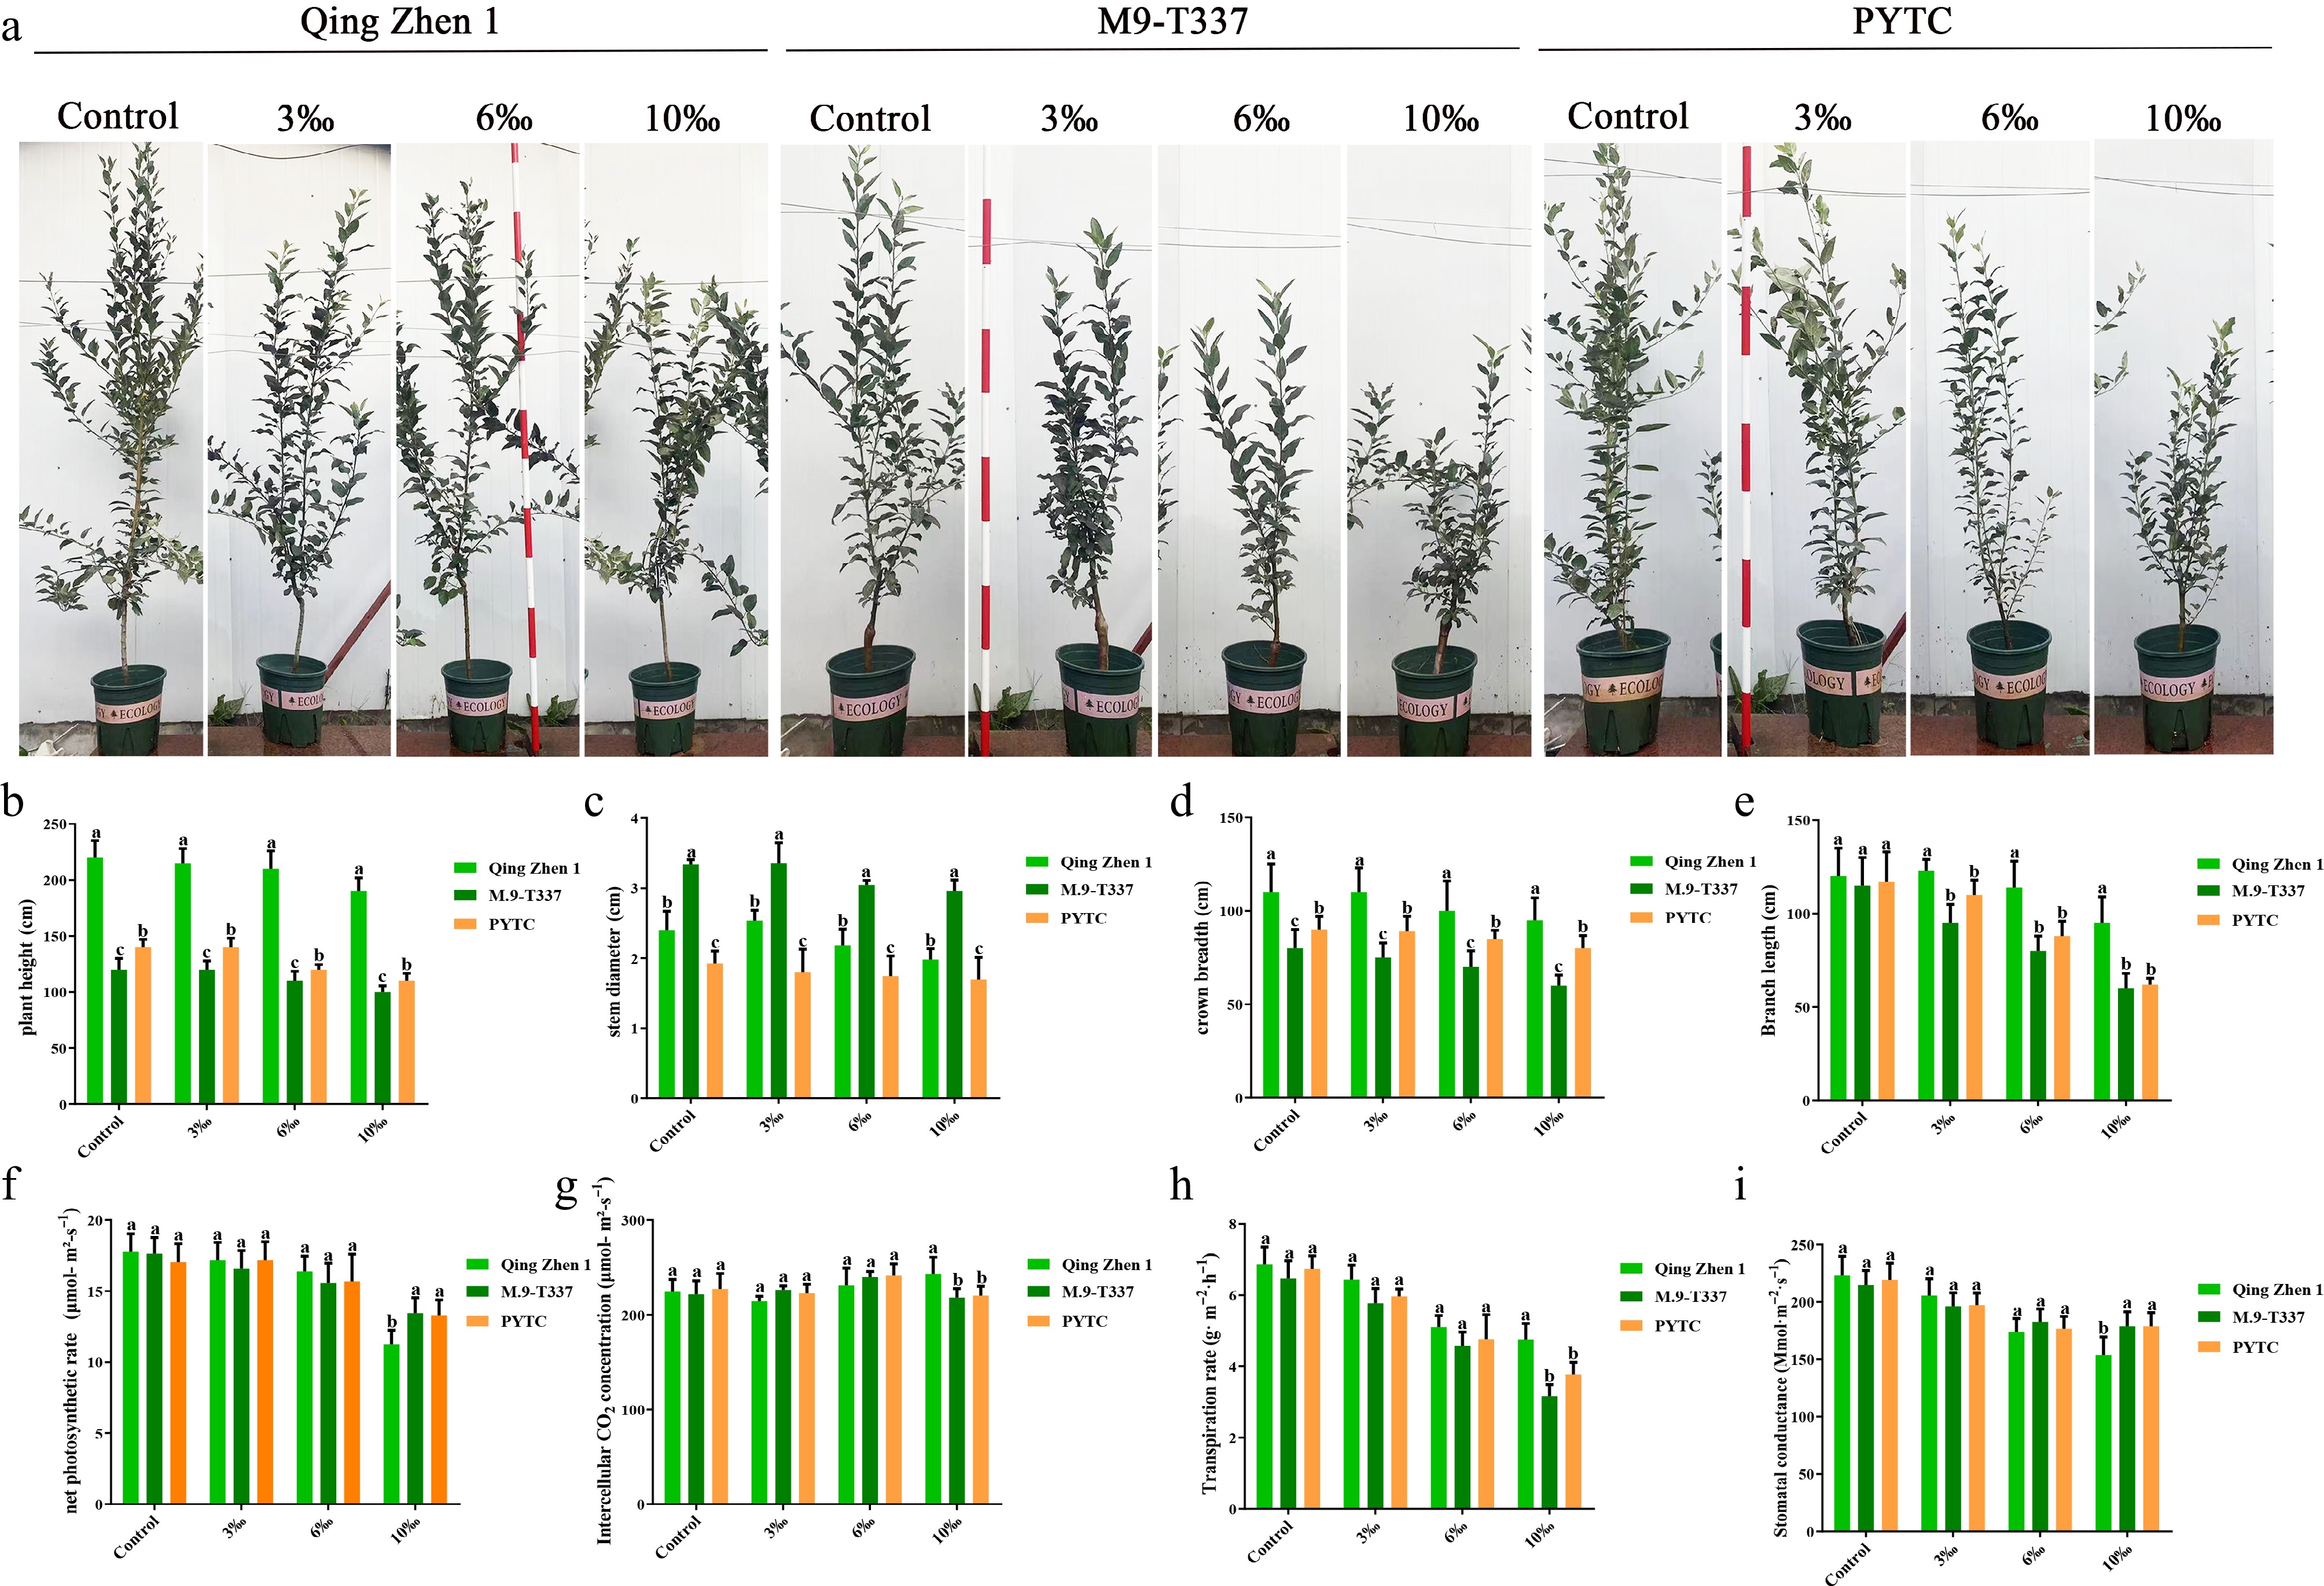
Figure 10.
Effects of salt stress on plant growth after 6 months. (a) Rootstock growth performance in later period, (b) tree height, (c) stem diameter, (d) crown width, (e) branch length, (f) net photosynthetic rate, (g) intercellular carbon dioxide concentration, (h) transpiration rate, (i) stomatal conductance. The value was the average ± standard error (n ≥ 3), letters indicate significant differences at p < 0.05 levels.
-
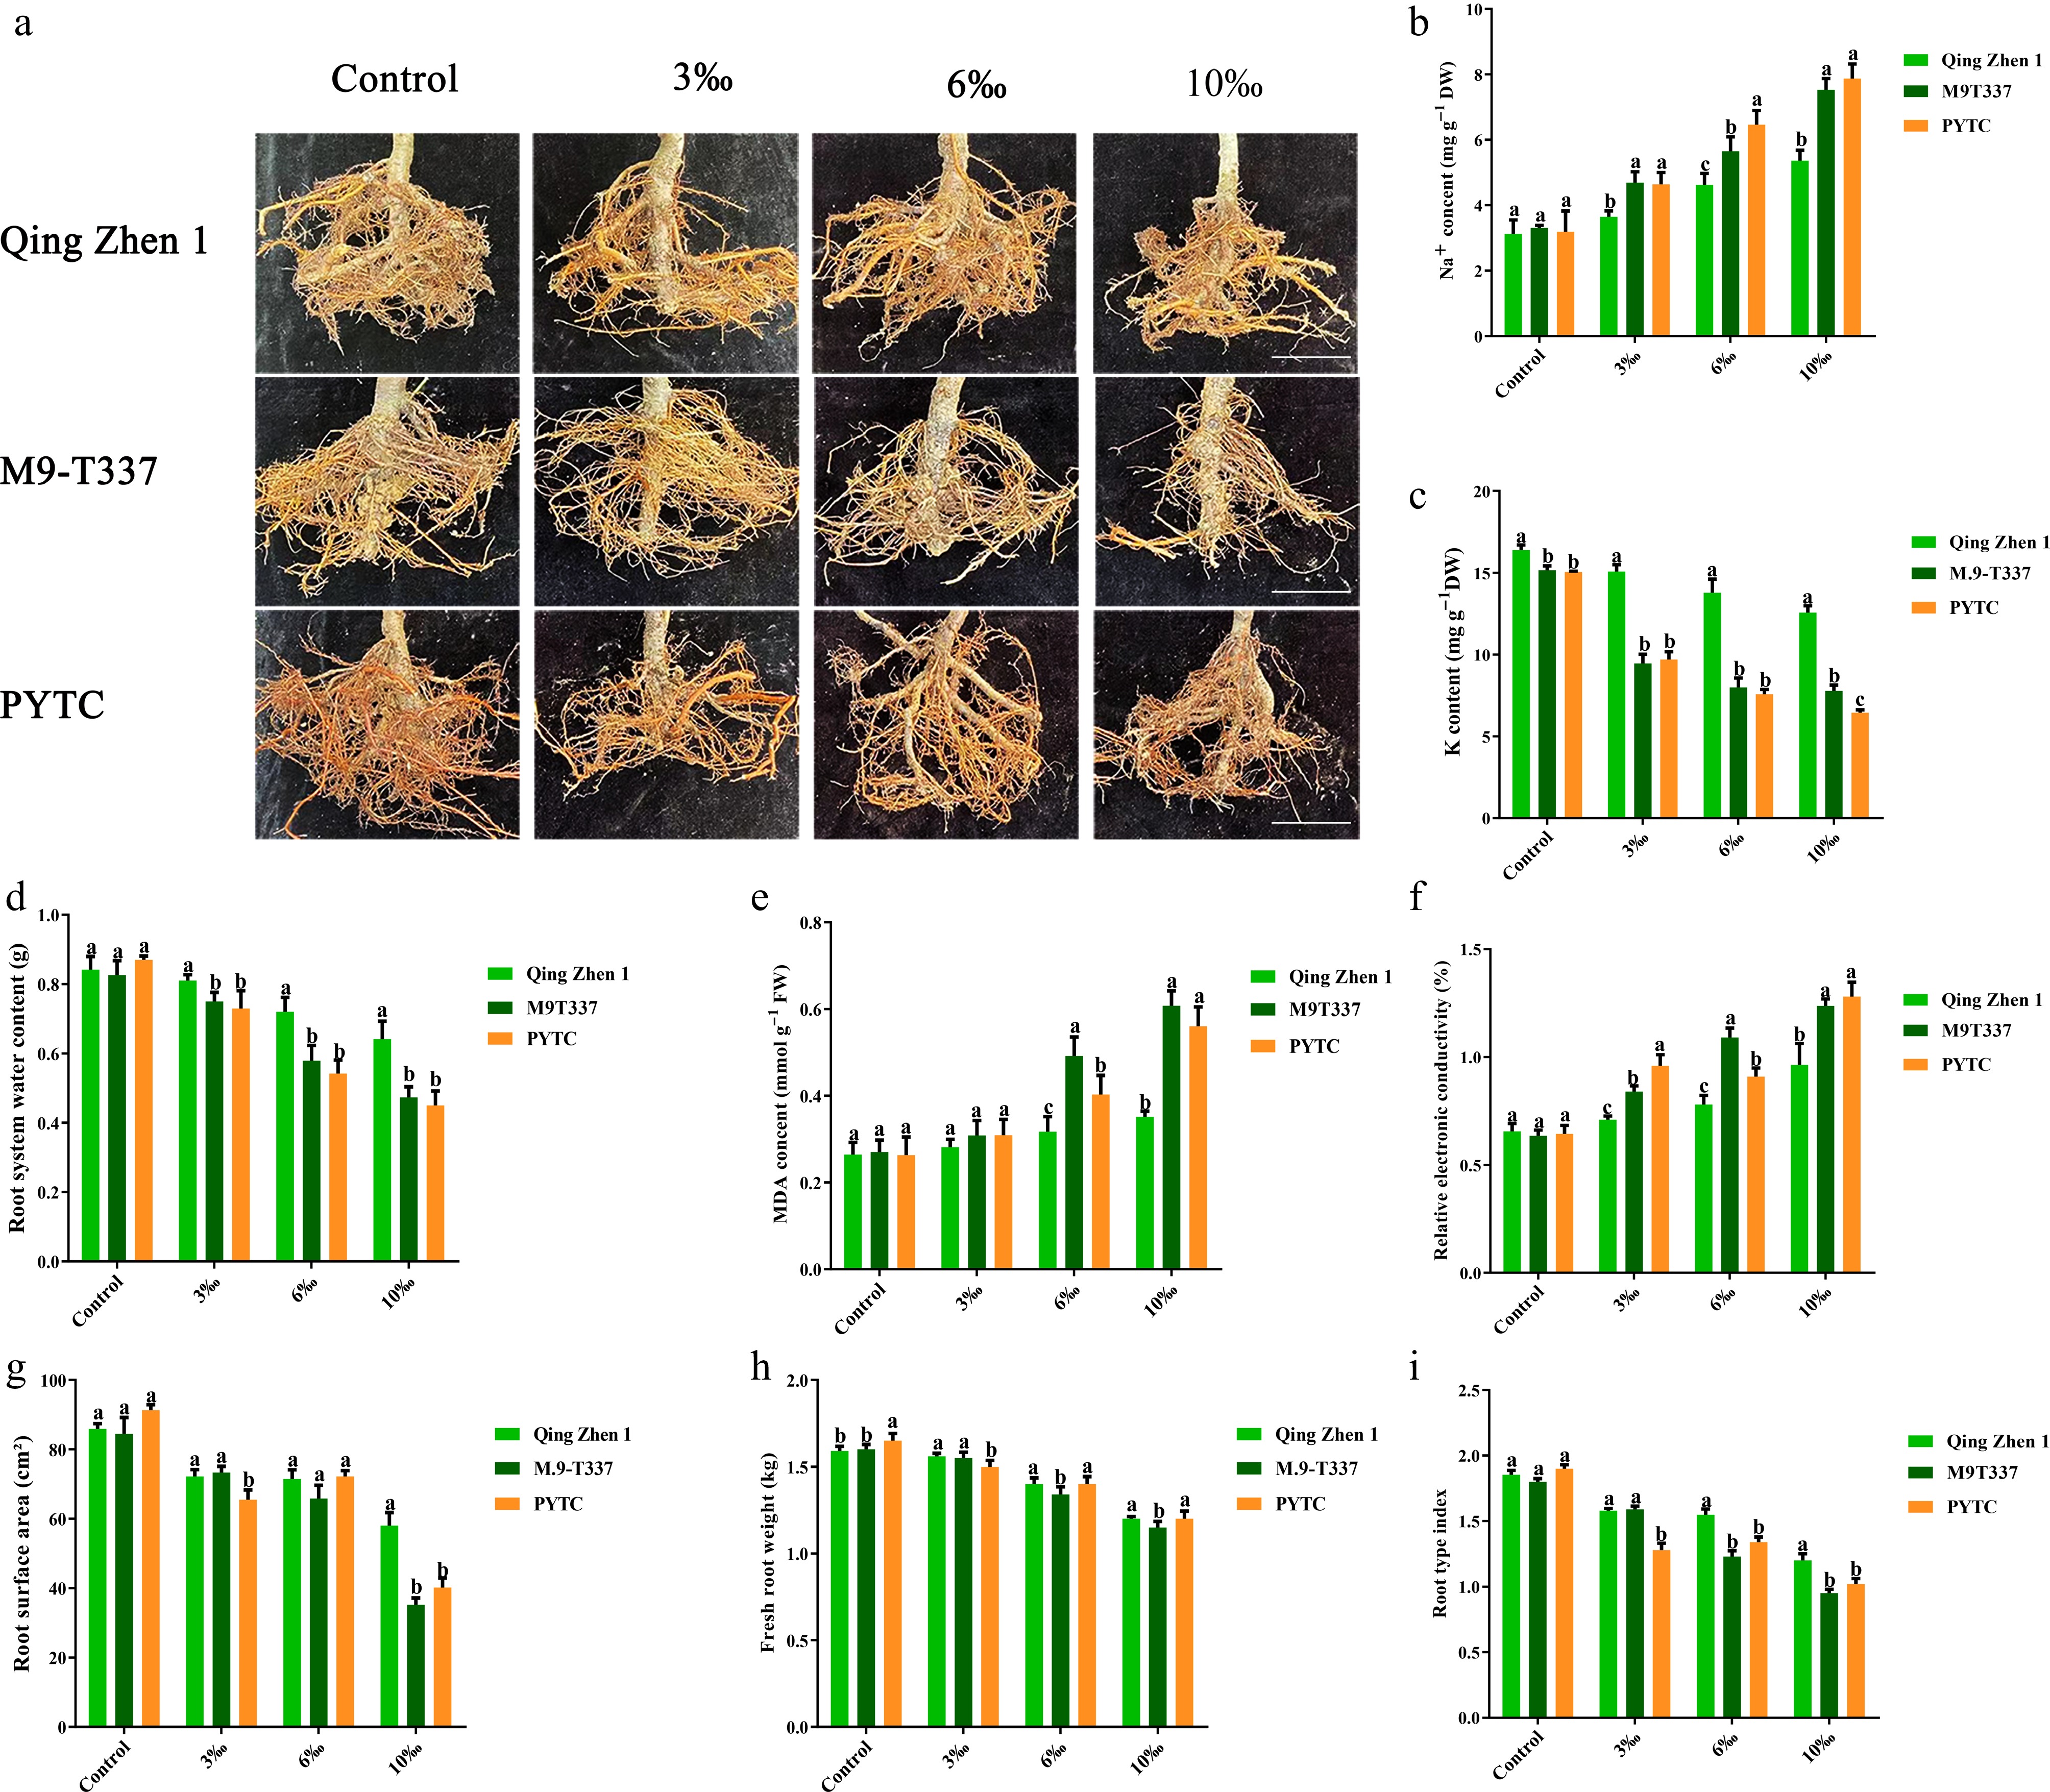
Figure 11.
Effects of salt stress on plant roots. (a) Rootstock root phenotype (effects of salt stress on plant growth after 6 months). (b) Na ion content, (c) K ion content, (d) root water content, (e) malondialdehyde content, (f) relative electrical conductivity, (g) root surface area, (h) fresh root weight, (i) plant type index. The value is the mean ± standard error (n ≥ 3), and the letters indicate significant differences at p < 0.05 levels under each concentration treatment. (Bar = 5 cm).
-
Sample Saltness (‰) N (g/kg) P (g/kg) K (mg/g) Na (mg/kg) pH Organic carbon (g/kg) Organic matter (g/kg) A 1 ± 0.32 1.2 ± 0.3 1.15 ± 0.27 2.1 ± 0.26 140 ± 29 6.8 ± 0.2 8.21 ± 1.14 12.68 ± 1.35 B 10 ± 0.8 0.49 ± 0.11 0.37 ± 0.18 0.35 ± 0.08 738 ± 23 7.4 ± 0.1 5.91 ± 0.58 9.67 ± 1.26 C 6 ± 0.5 0.38 ± 0.09 0.45 ± 0.25 0.42 ± 0.09 426 ± 36 7.3 ± 0.2 6.07 ± 0.56 9.24 ± 1.52 D 3 ± 0.28 0.35 ± 0.076 0.61 ± 0.21 0.56 ± 0.05 316 ± 27 7.3 ± 0.1 6.05 ± 0.42 9.11 ± 1.22 Table 1.
Soil salt concentration and organic matter content.
-
Saline
concentrationApple variety (plant/pot) Subtotal Luli/Qing Zhen 1 Luli/M9-T337 Luli/PYTC 1‰ (CK) 30 30 30 90 3.0‰ 30 30 30 90 6.0‰ 30 30 30 90 10.0‰ 30 30 30 90 Total 120 120 120 360 Table 2.
Test design table.
Figures
(11)
Tables
(2)