-
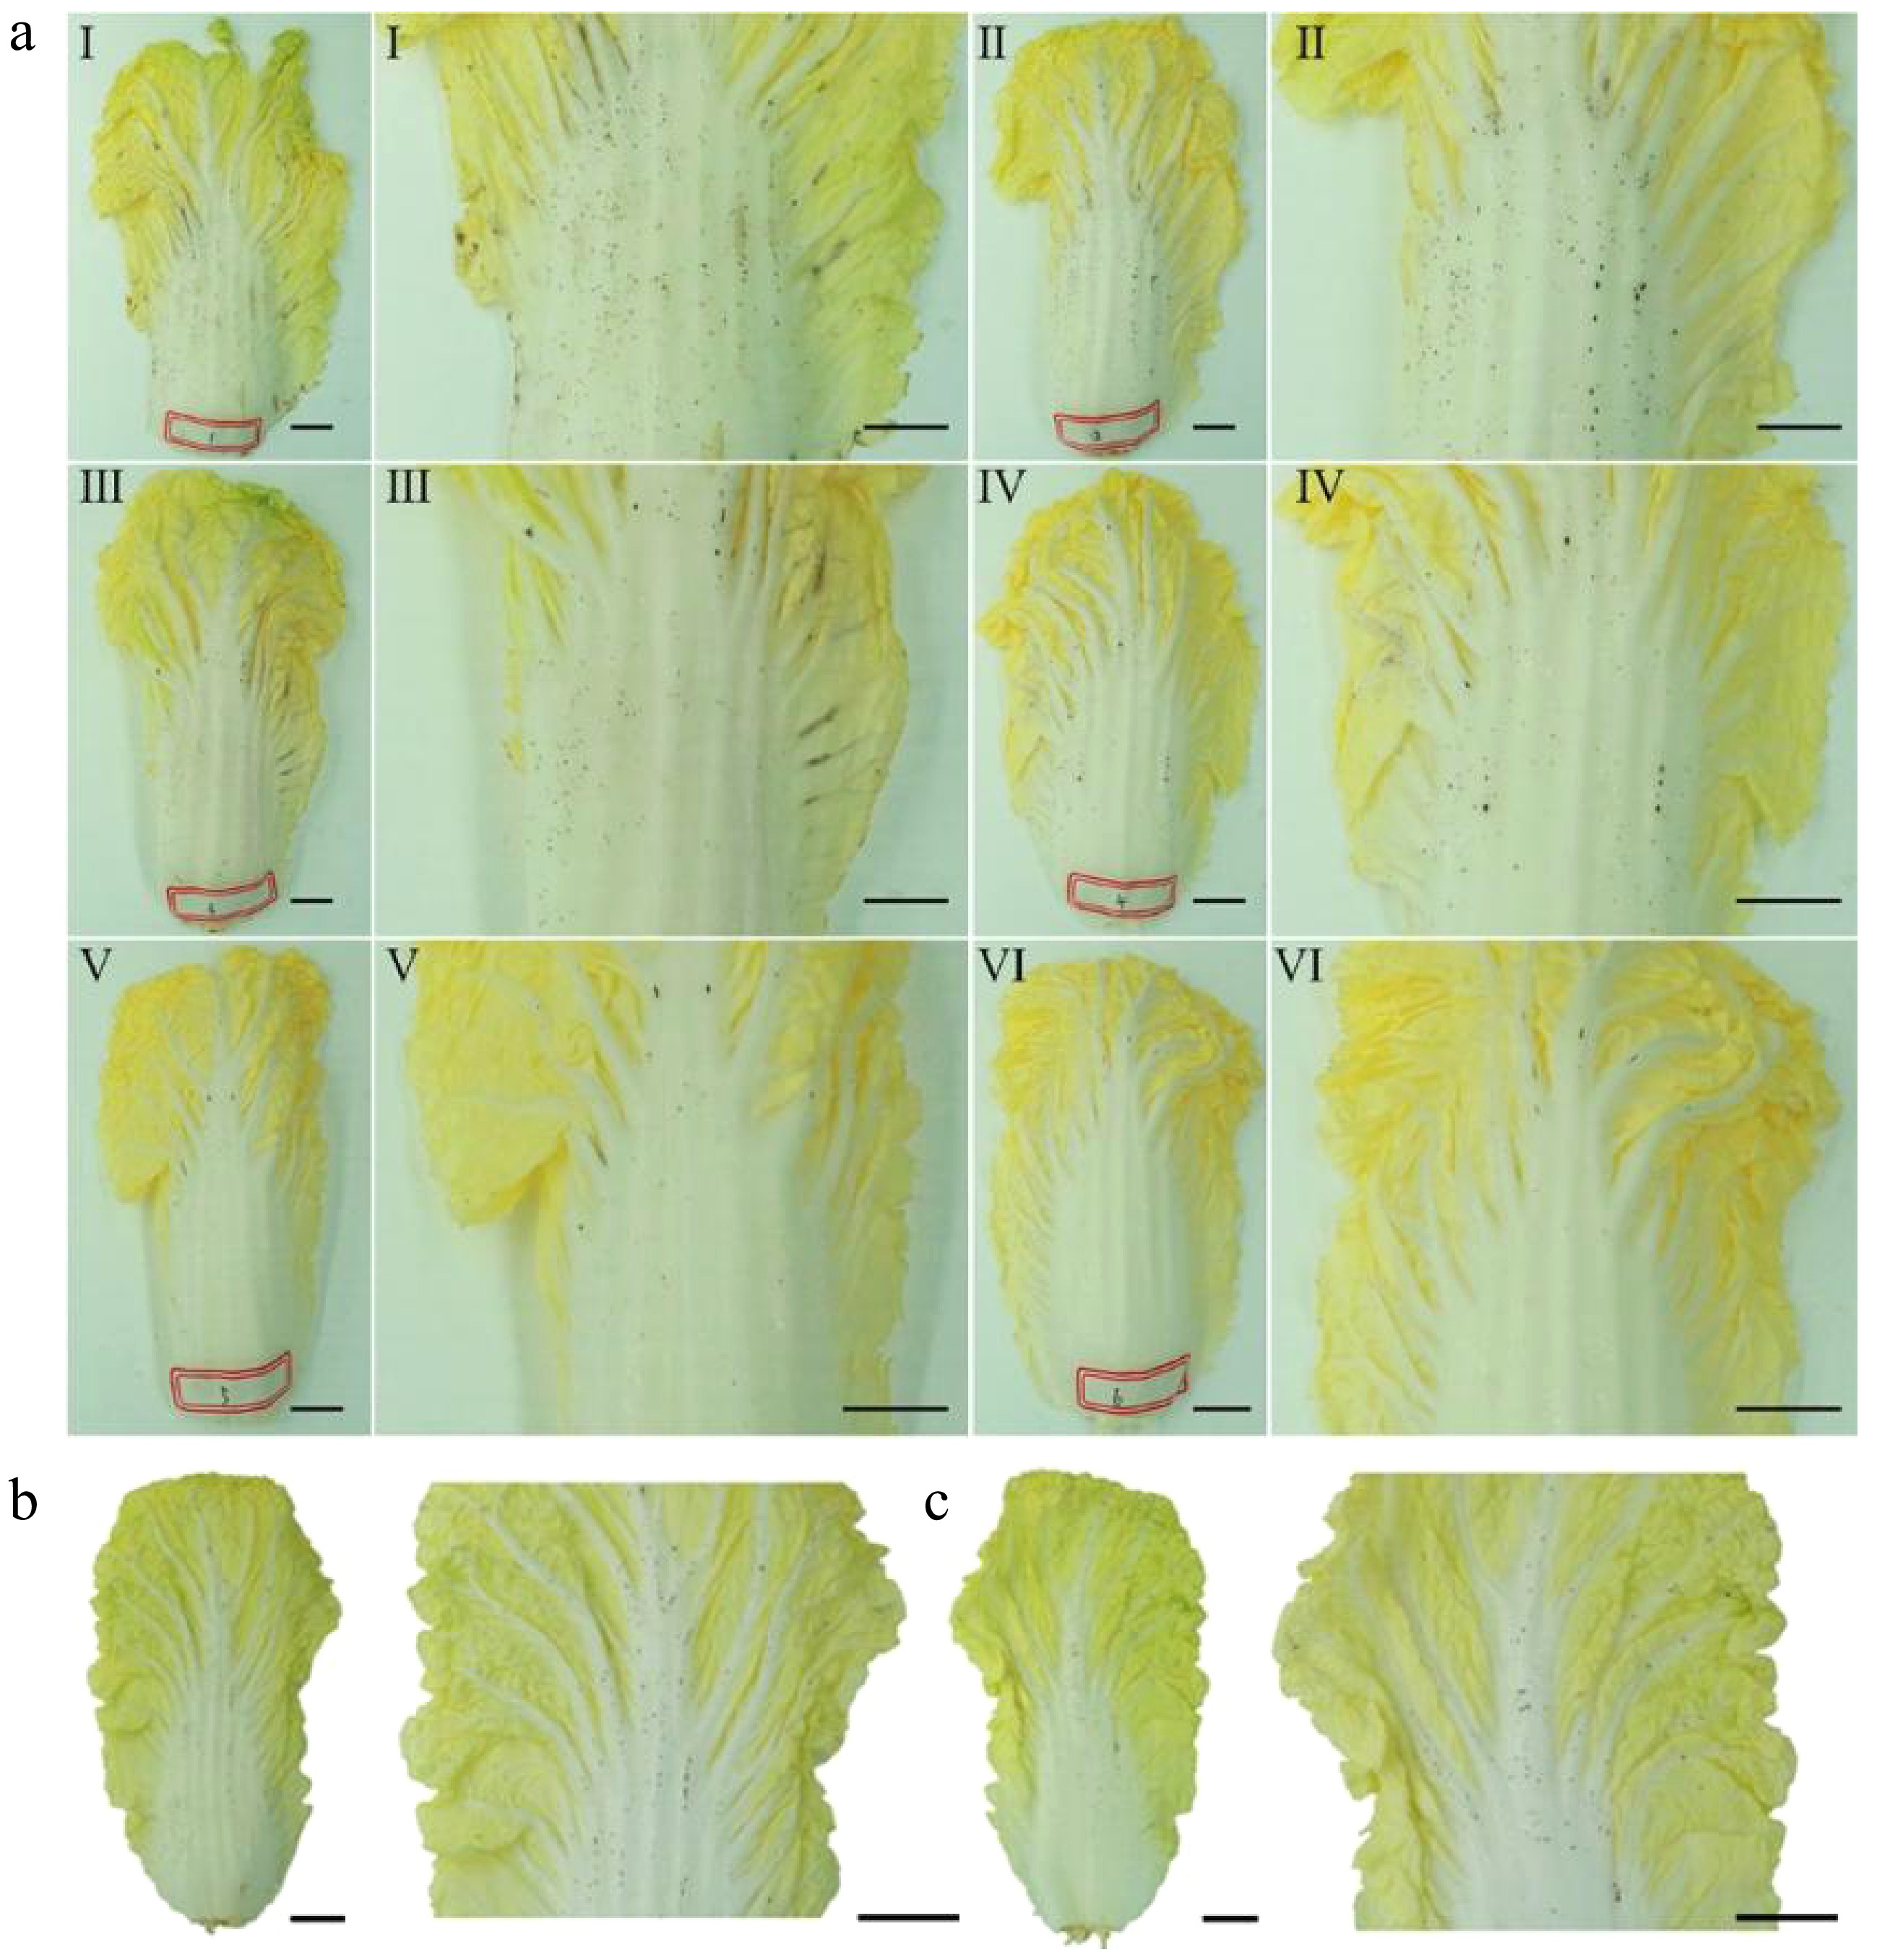
Figure 1.
Phenotypic observation of petiole spot occurrence on Chinese cabbage leaves during storage. (a) During storage, petiole spot severity in Chinese cabbage decreases from outer (I) to inner leaves (VI). No significant difference in petiole spot occurrence was found between the (b) adaxial, and (c) abaxial epidermis of Chinese cabbage leaves.
-
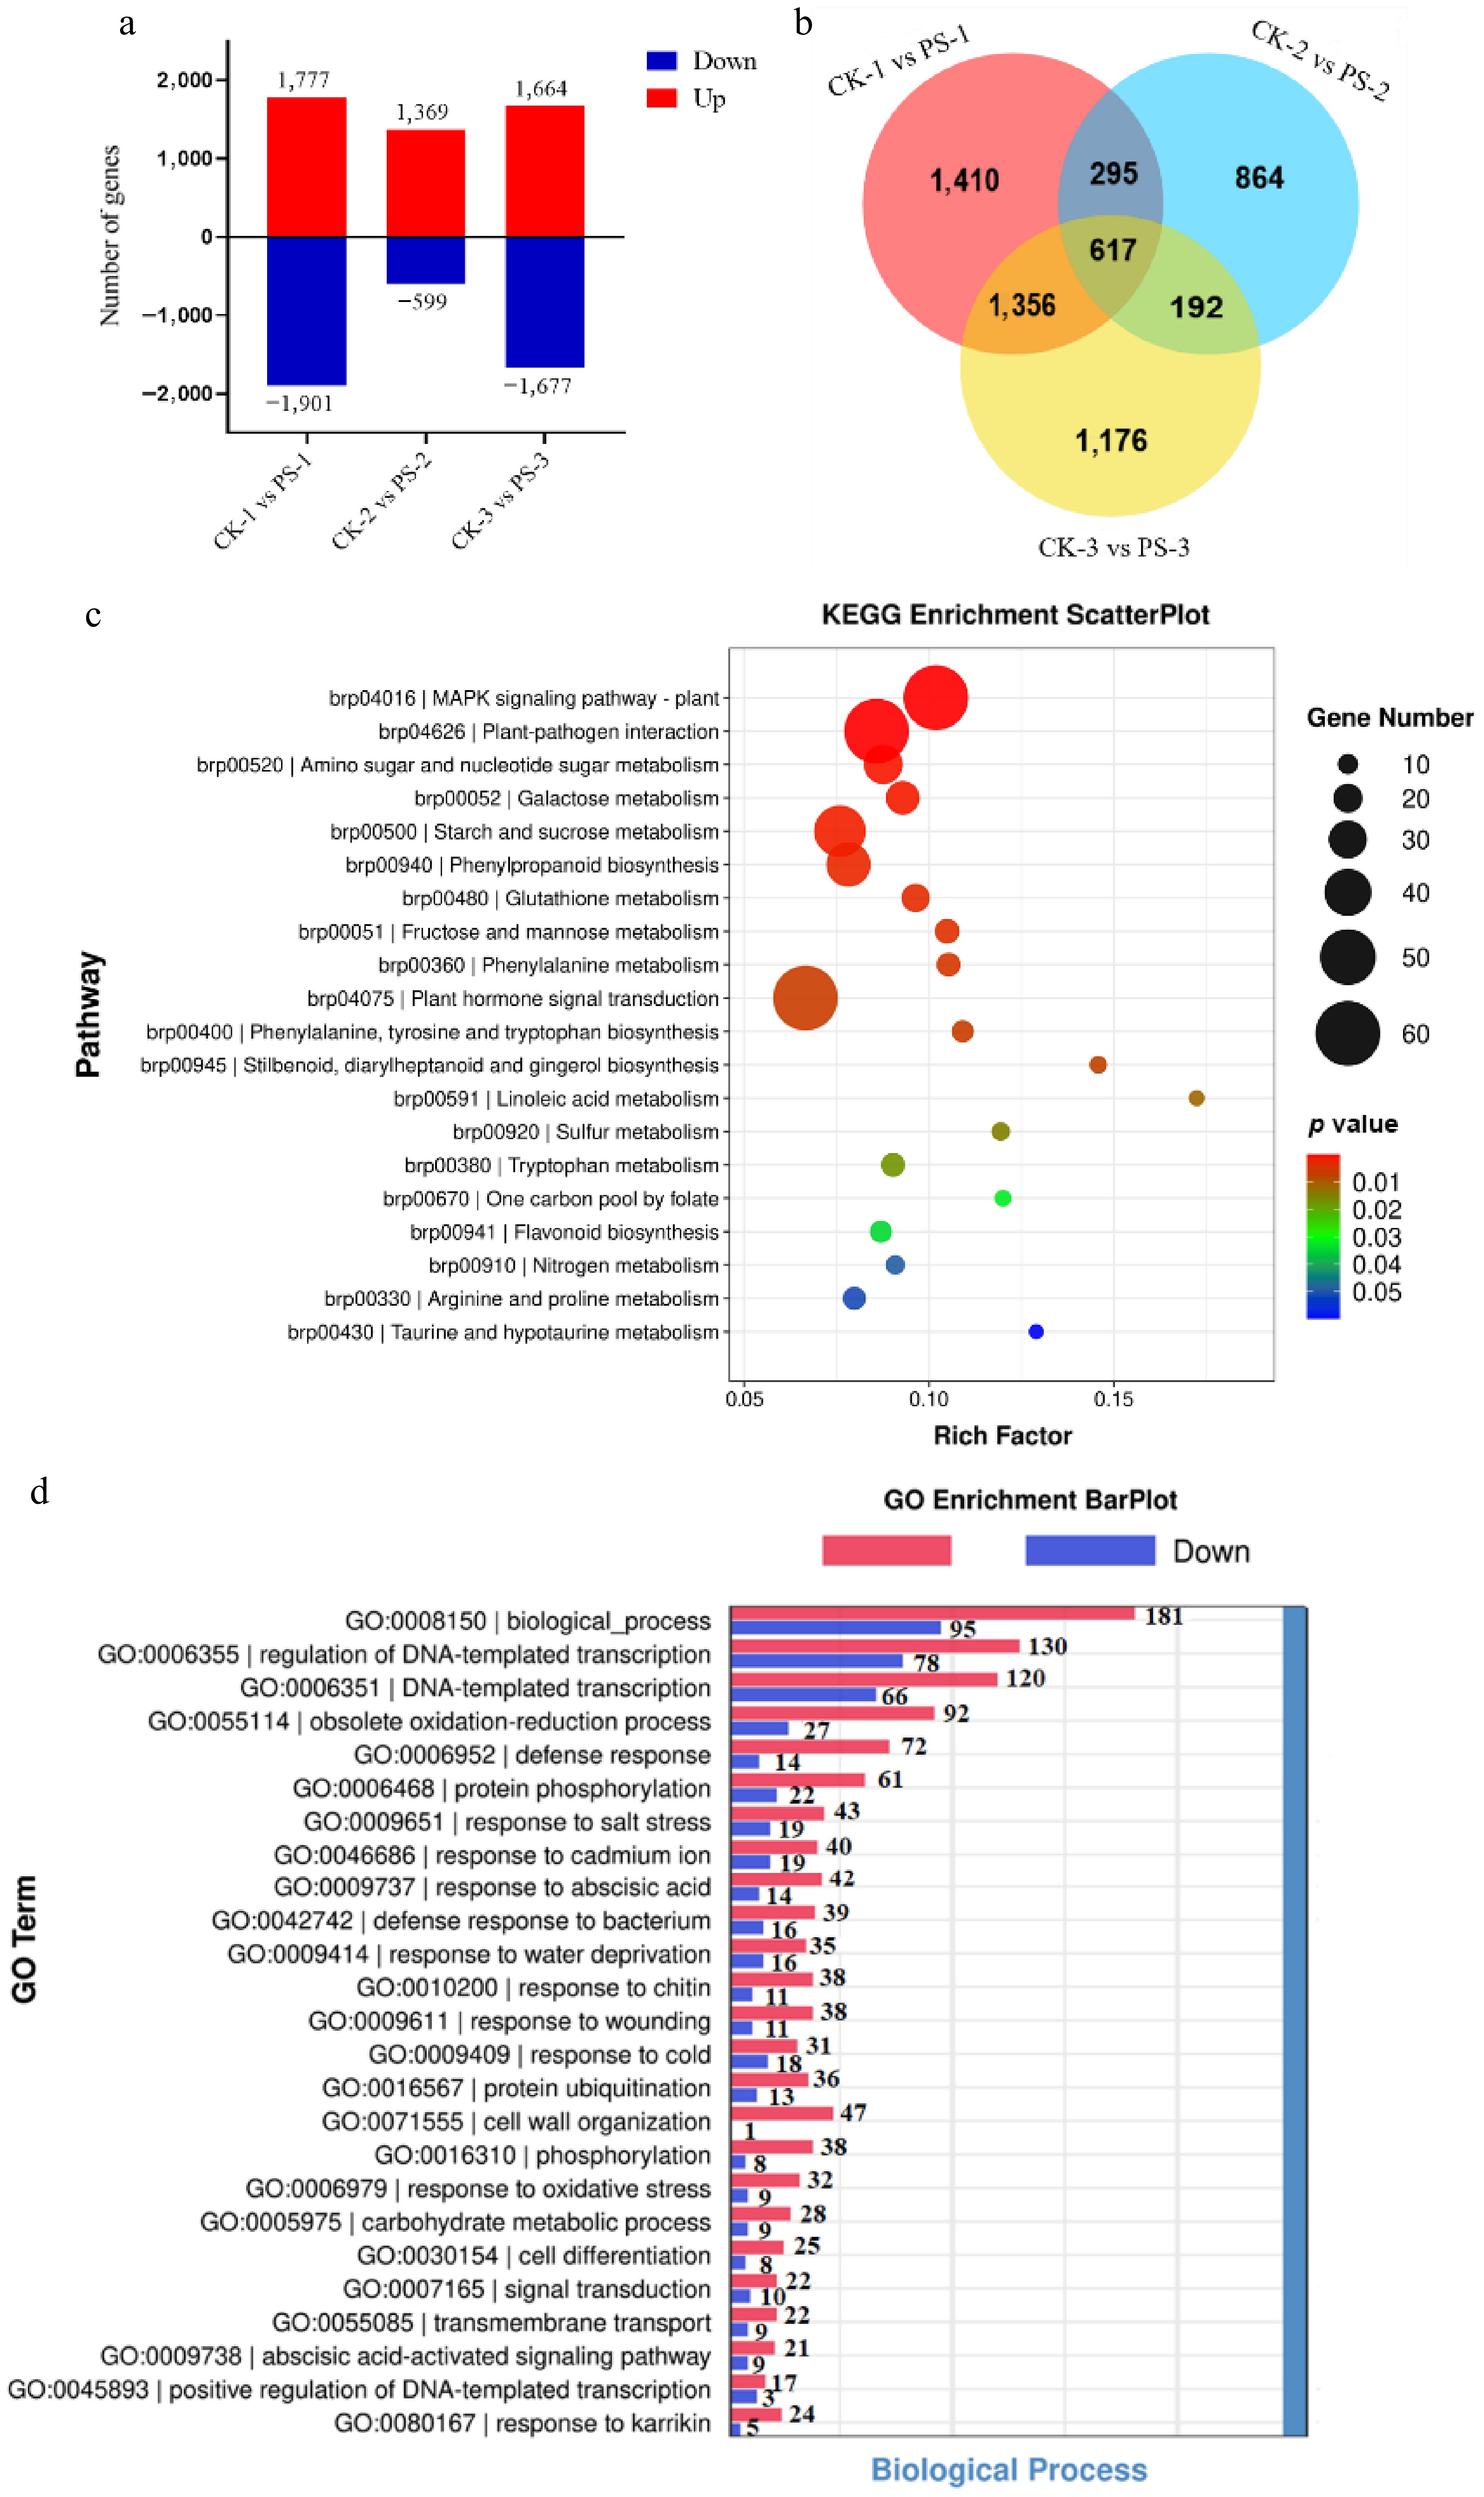
Figure 2.
Transcriptome analysis on leaves with and without petiole spots. (a) Identification of differentially expressed genes (DEGs) in the comparisons of CK-1 vs PS-1, CK-2 vs PS-2, and CK-3 vs PS-3. All the data represent the average of three independent biological replicates. (b) Venn diagram depicting the shared and unique DEGs across the three comparison groups. (c) KEGG pathway enrichment analysis of DEGs between Chinese cabbage leaves without petiole spot symptoms (CK) and those exhibiting petiole spot symptoms (PS). Each bubble represents a metabolic pathway, with bubble size indicating the pathway's impact factor and bubble color intensity reflecting the degree of enrichment. (d) Gene Ontology (GO) enrichment analysis of DEGs between the comparison groups. CK: Chinese cabbage leaves without petiole spot symptoms; PS: Chinese cabbage leaves exhibiting petiole spot symptoms.
-
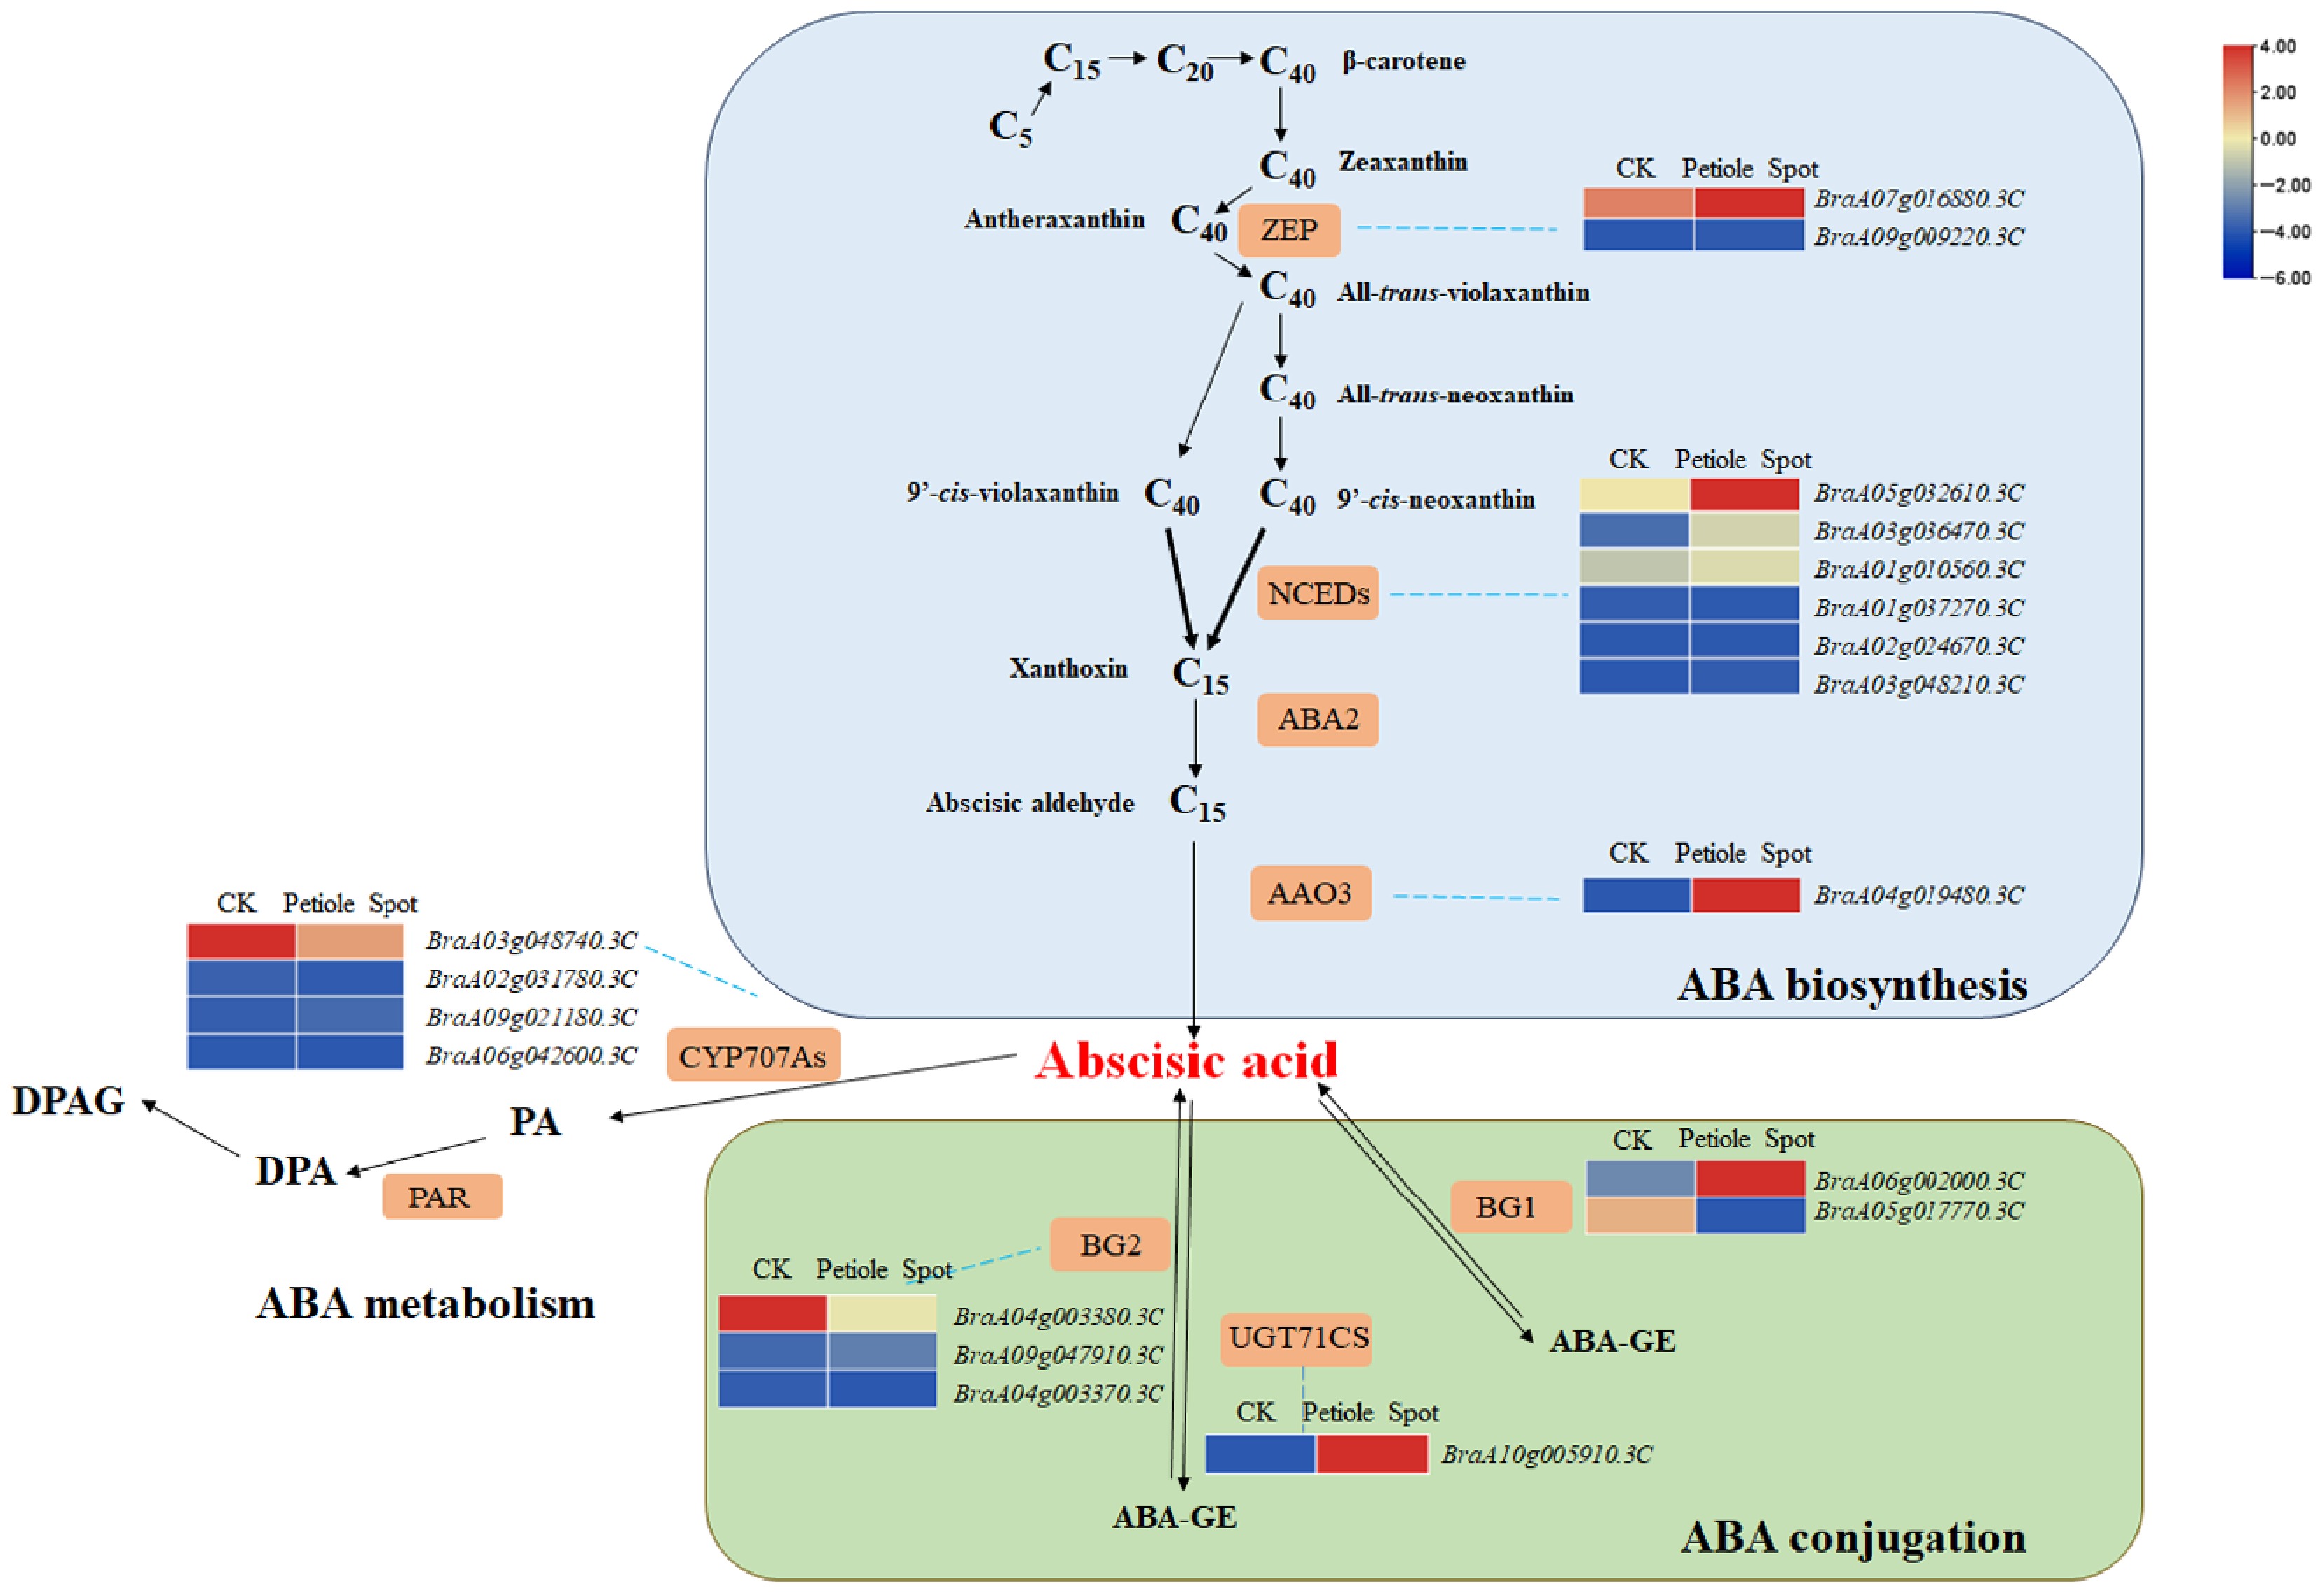
Figure 3.
Heat map illustrating the expression profiles of genes associated with ABA biosynthesis and metabolic pathways.
-
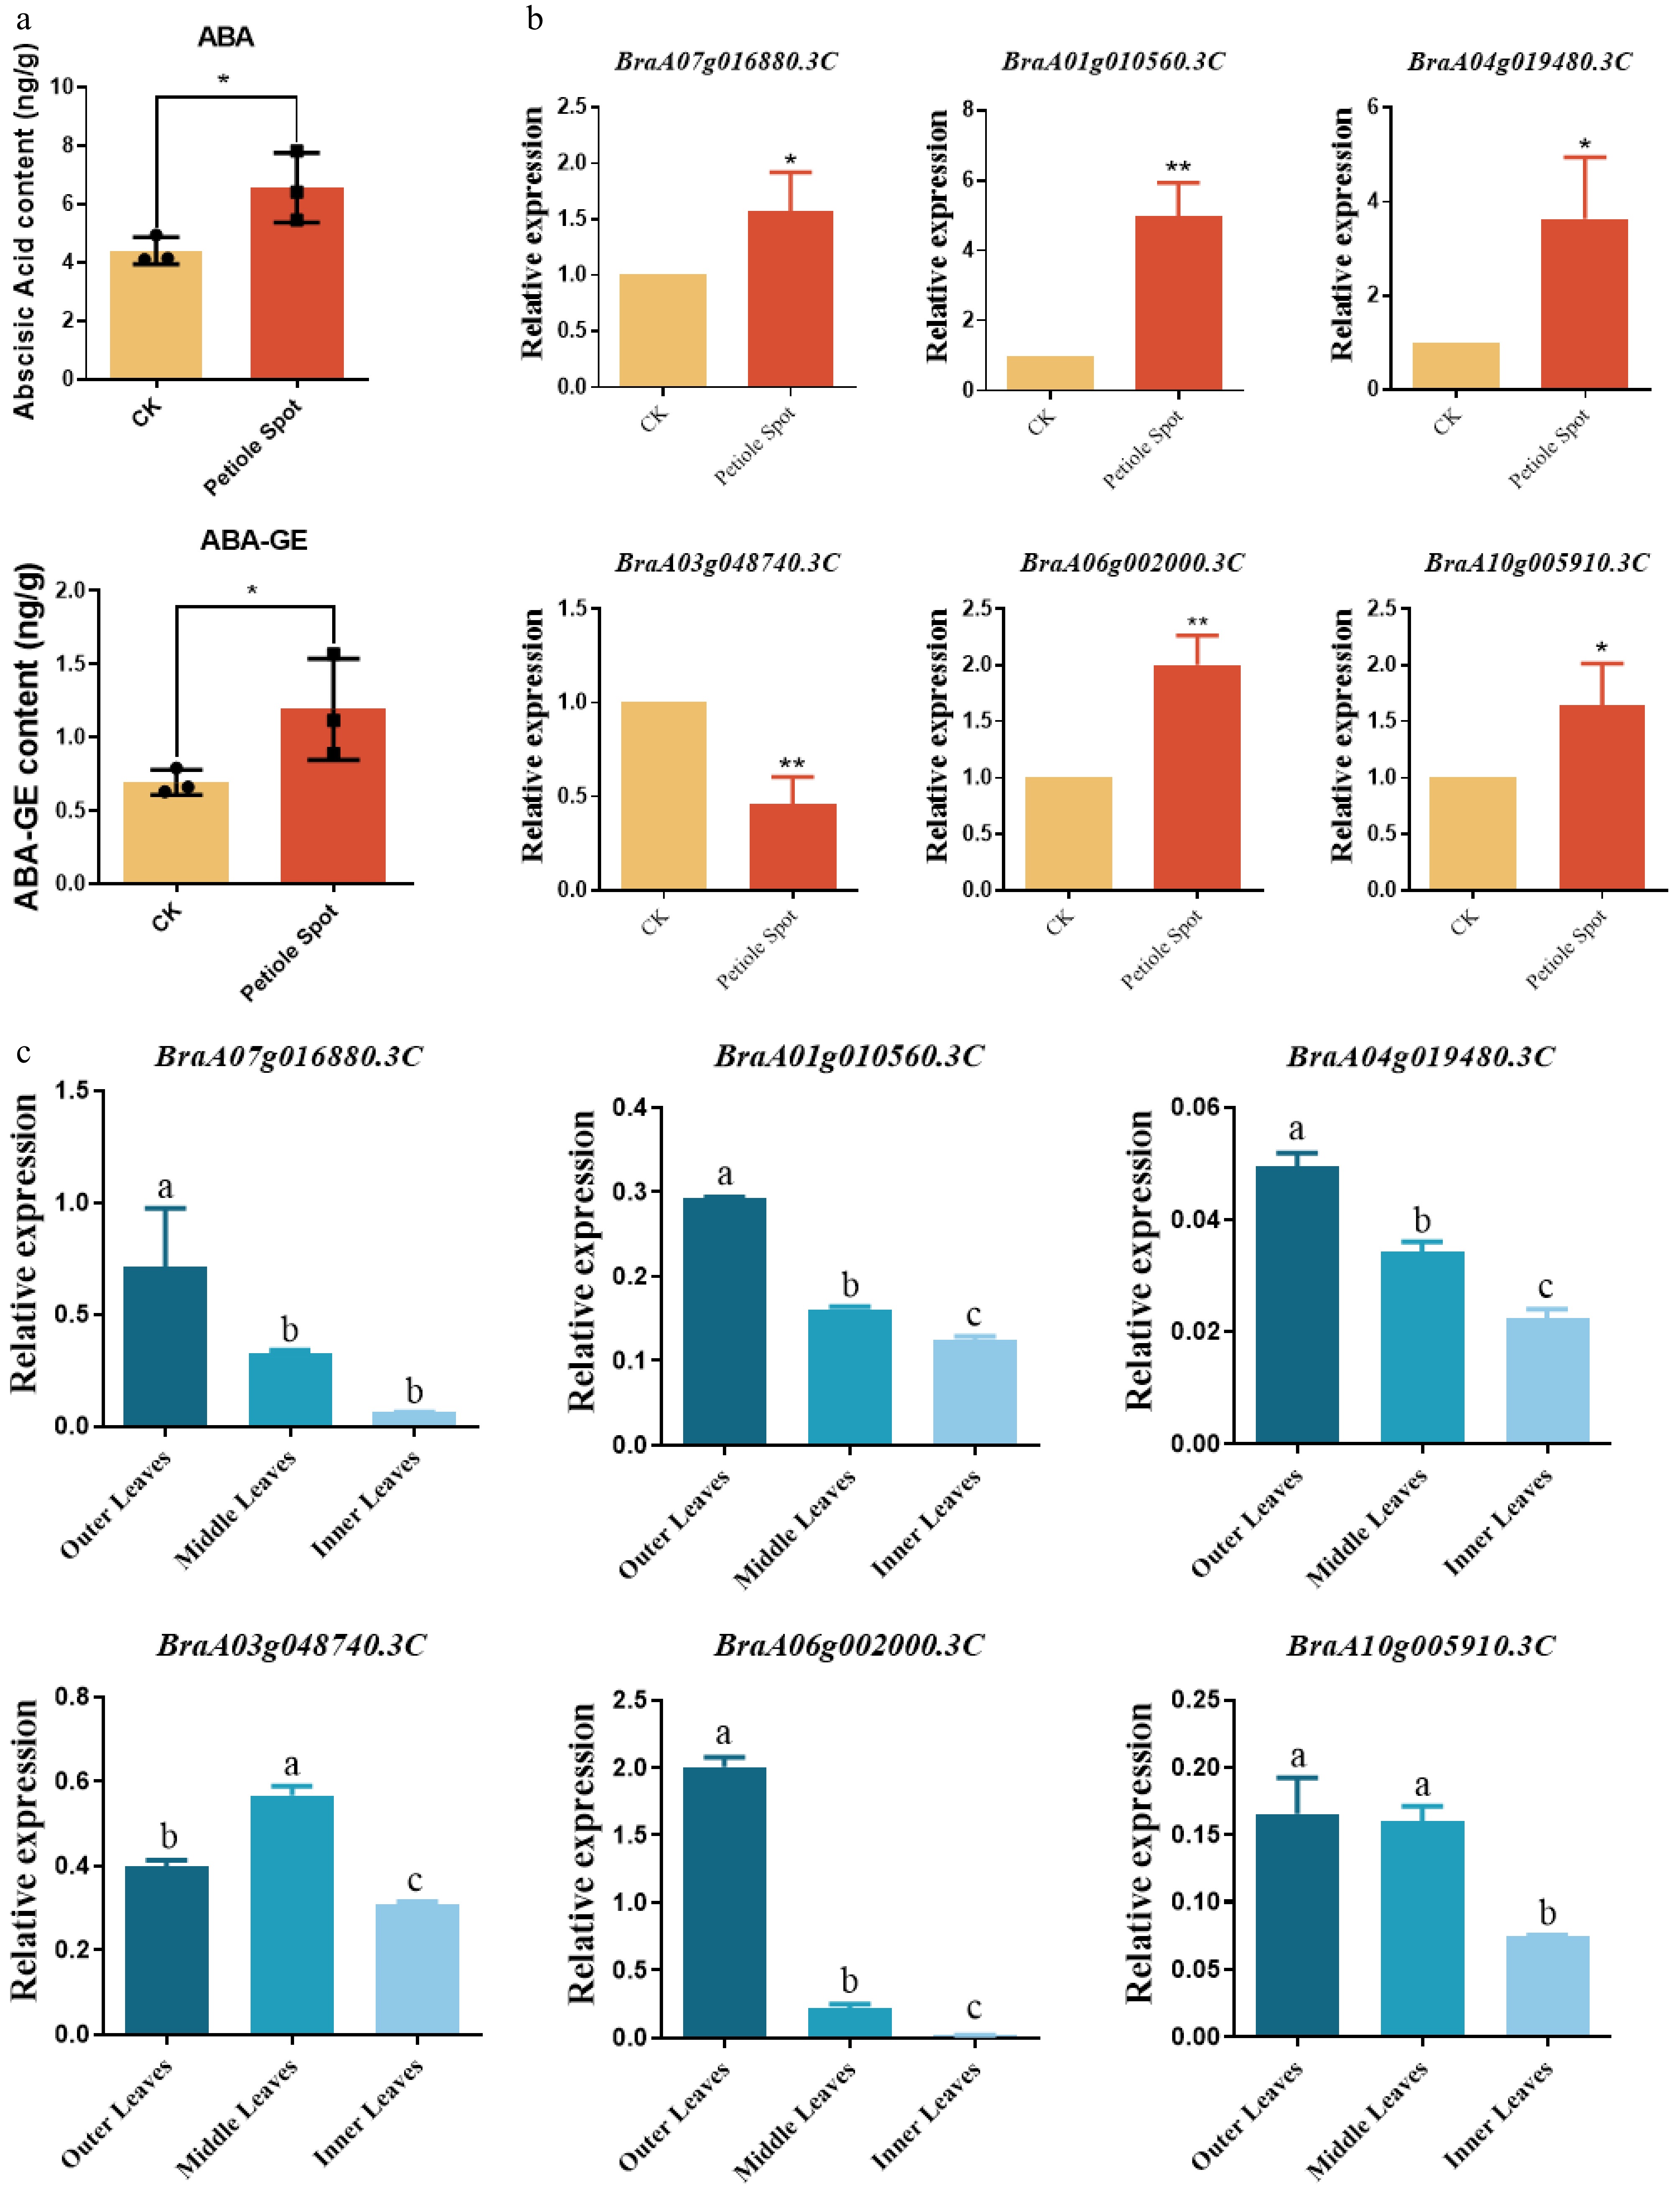
Figure 4.
Expression analysis of ABA-related genes in cultivar Zaoshu No. 8. (a) The concentrations of ABA and its conjugated form GA-ABA were significantly elevated in the epidermis of Chinese cabbage leaves exhibiting petiole spot symptoms compared to symptom-free control leaves (CK). (b) Quantitative PCR (qPCR) analysis of key ABA pathway genes in Chinese cabbage leaves with and without petiole spot symptoms. The relative expression levels analyzed by qRT-PCR and calculated by 2−ΔCᴛ and bars with different lowercase letters are significantly different (* < 0.05, ** < 0.01). (c) qPCR analysis of key ABA pathway genes in the epidermis of outer, middle, and inner leaf layers. The relative expression levels analyzed by qRT-PCR and calculated by 2−ΔΔCᴛ and bars with different lowercase letters are significantly different (p < 0.05).
-
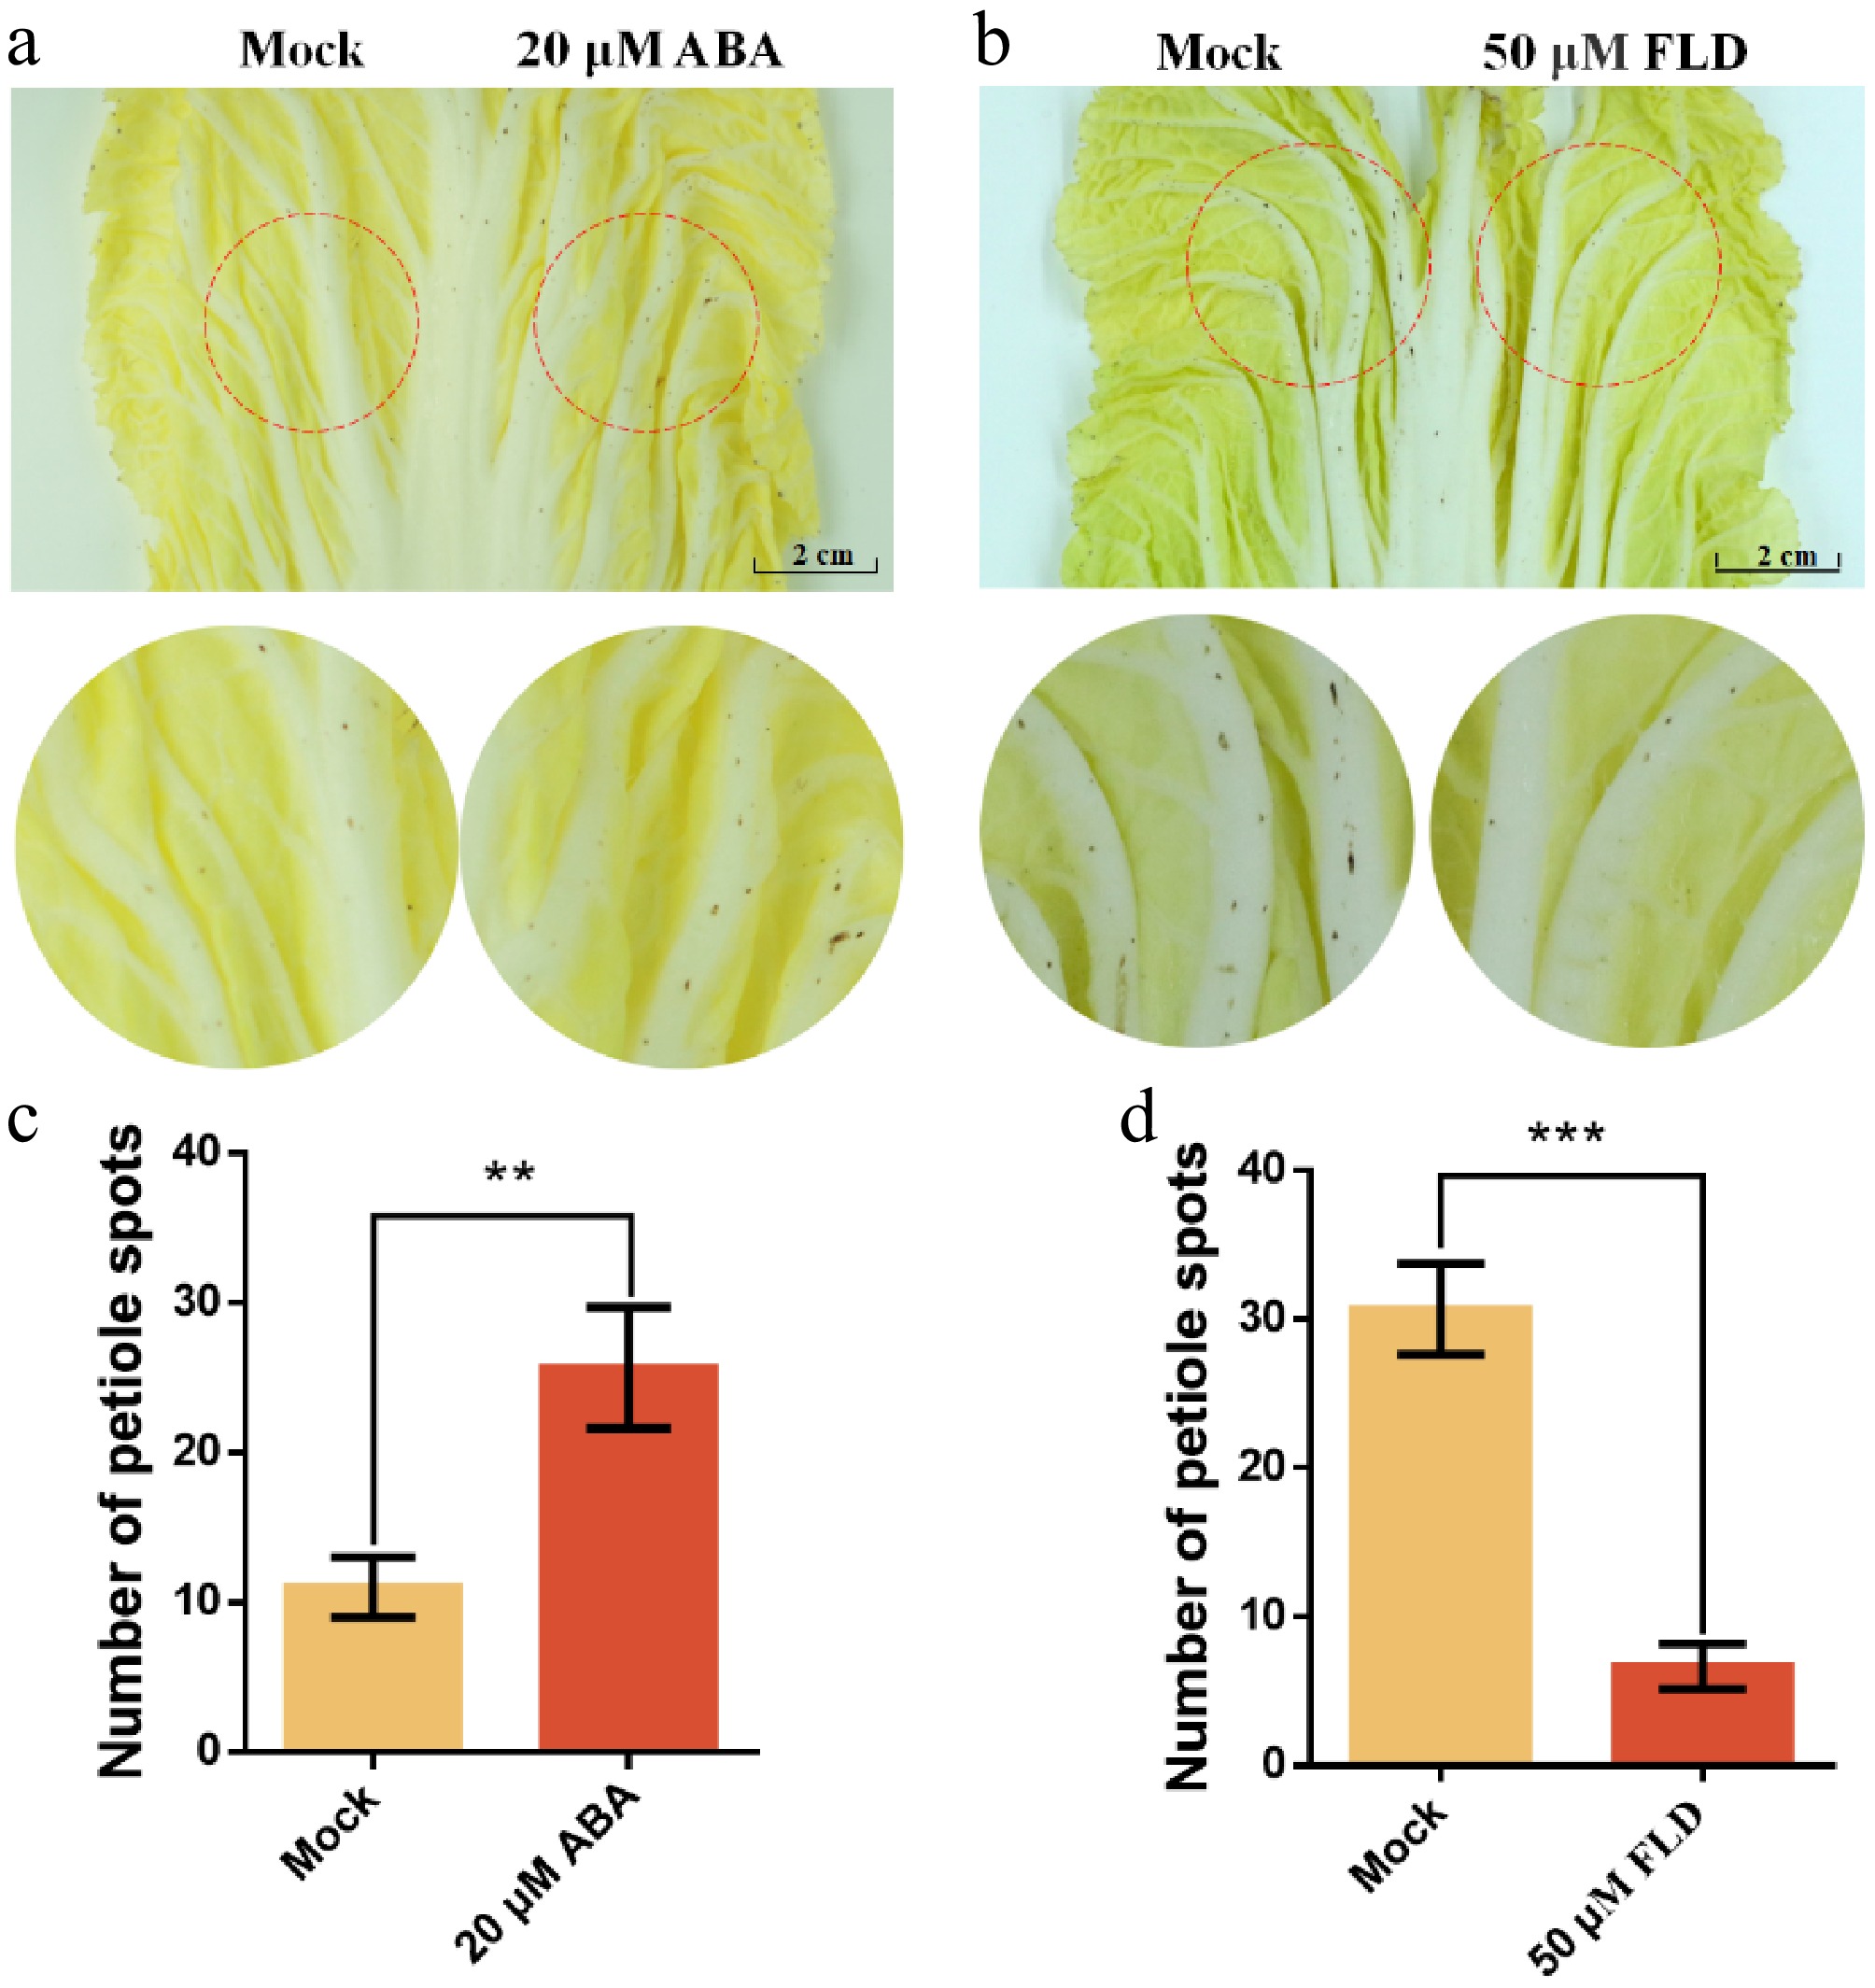
Figure 5.
Exogenous ABA promotes the development of petiole spot symptoms in Chinese cabbage cultivar Zaoshu No. 8. (a) ddH2O (Mock) and 20 μM ABA were applied to symmetrically corresponding regions on the same leaf. (b) ddH2O (Mock) and 50 μM of the ABA biosynthesis inhibitor fluridone (FLD) were applied to symmetrically corresponding regions on the same leaf. (c), (d) The number of petiole spots within the filter paper-covered area was recorded. Each treatment group consisted of three cabbage leaves, and all experiments were independently repeated three times. ** indicates p < 0.01, and *** indicates p < 0.001.
-
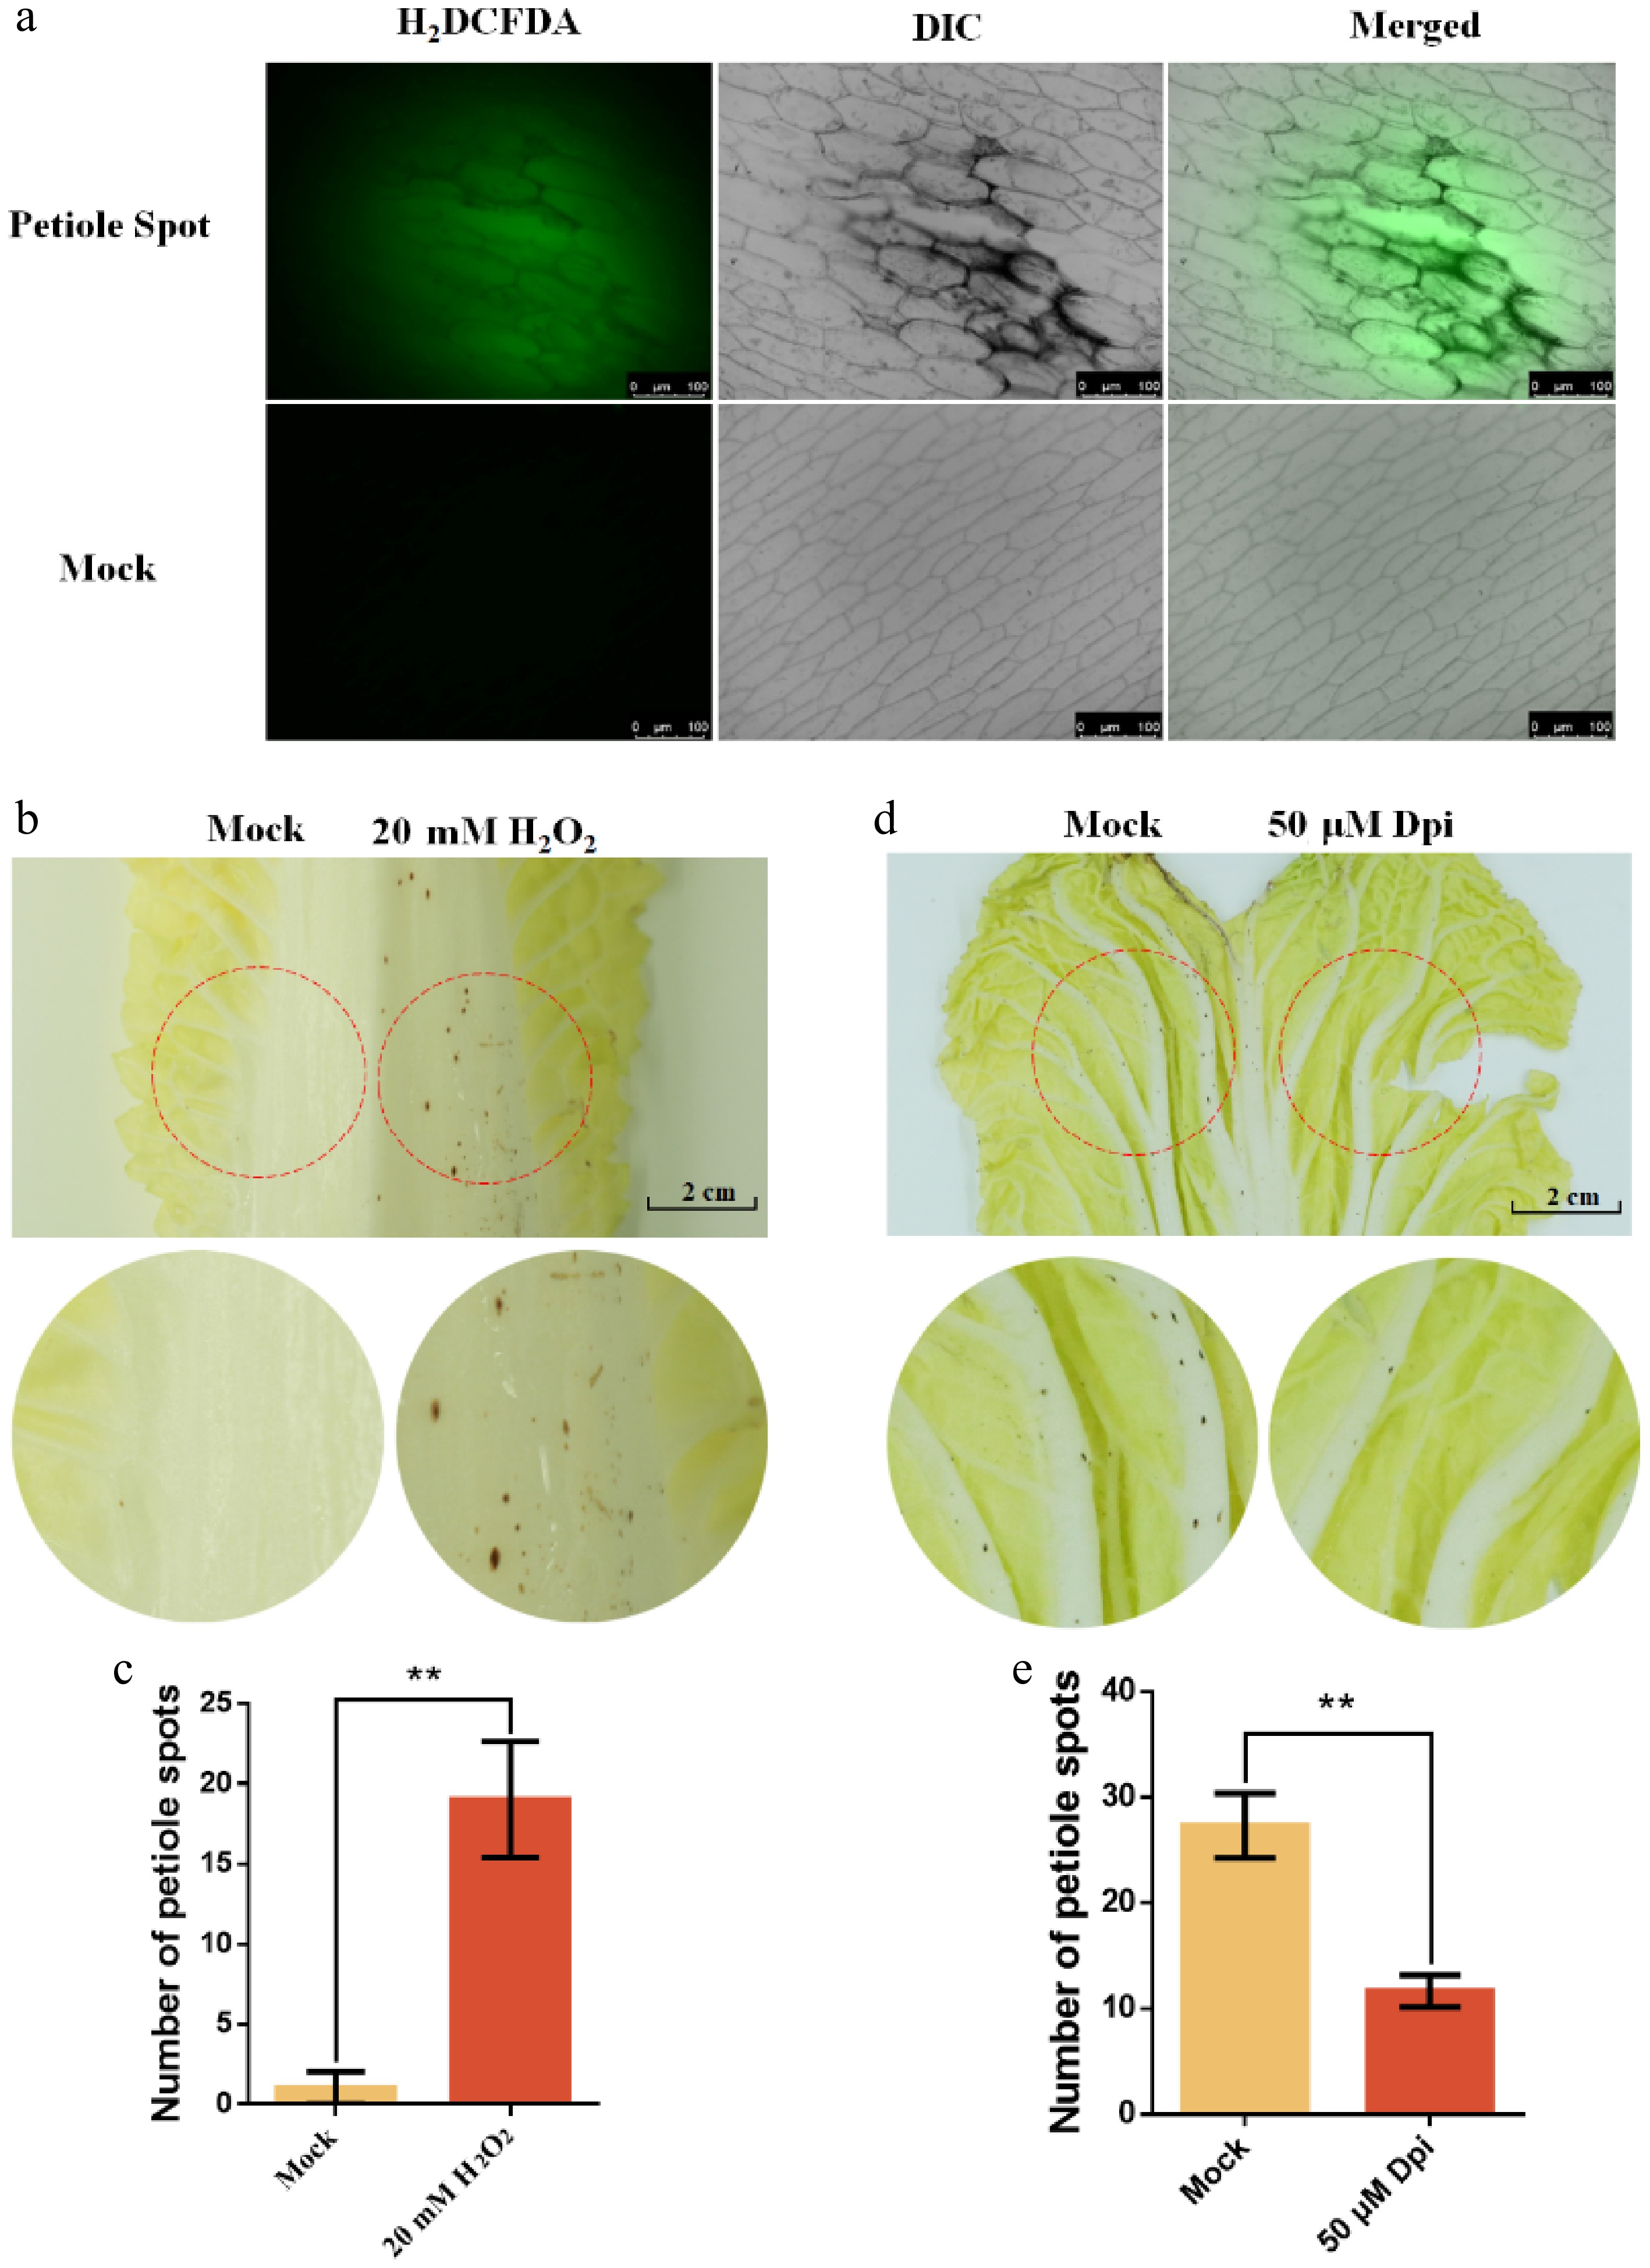
Figure 6.
Exogenous H2O2 mimics ROS-induced petiole spot formation in Chinese cabbage cultivar Zaoshu No. 8. (a) Reactive oxygen species (ROS) accumulation in the epidermis was assessed using H2DCFDA staining. ddH2O (Mock) was used as a negative control, while 20 mM H2O2 served as a positive control. (b), (c) ddH2O (Mock) and 20 mM H2O2 were applied to symmetrically positioned regions on the same leaf, and the number of petiole spots within the filter paper-covered area was quantified. (d), (e) ddH2O (Mock) and 50 μM of the ROS synthesis inhibitor diphenyleneiodonium (Dpi) were applied to symmetrically positioned regions on the same leaf, and the number of petiole spots within the filter paper-covered area was quantified. Each treatment group consisted of three cabbage leaves, and all experiments were independently repeated three times. ** indicates p < 0.01.
-
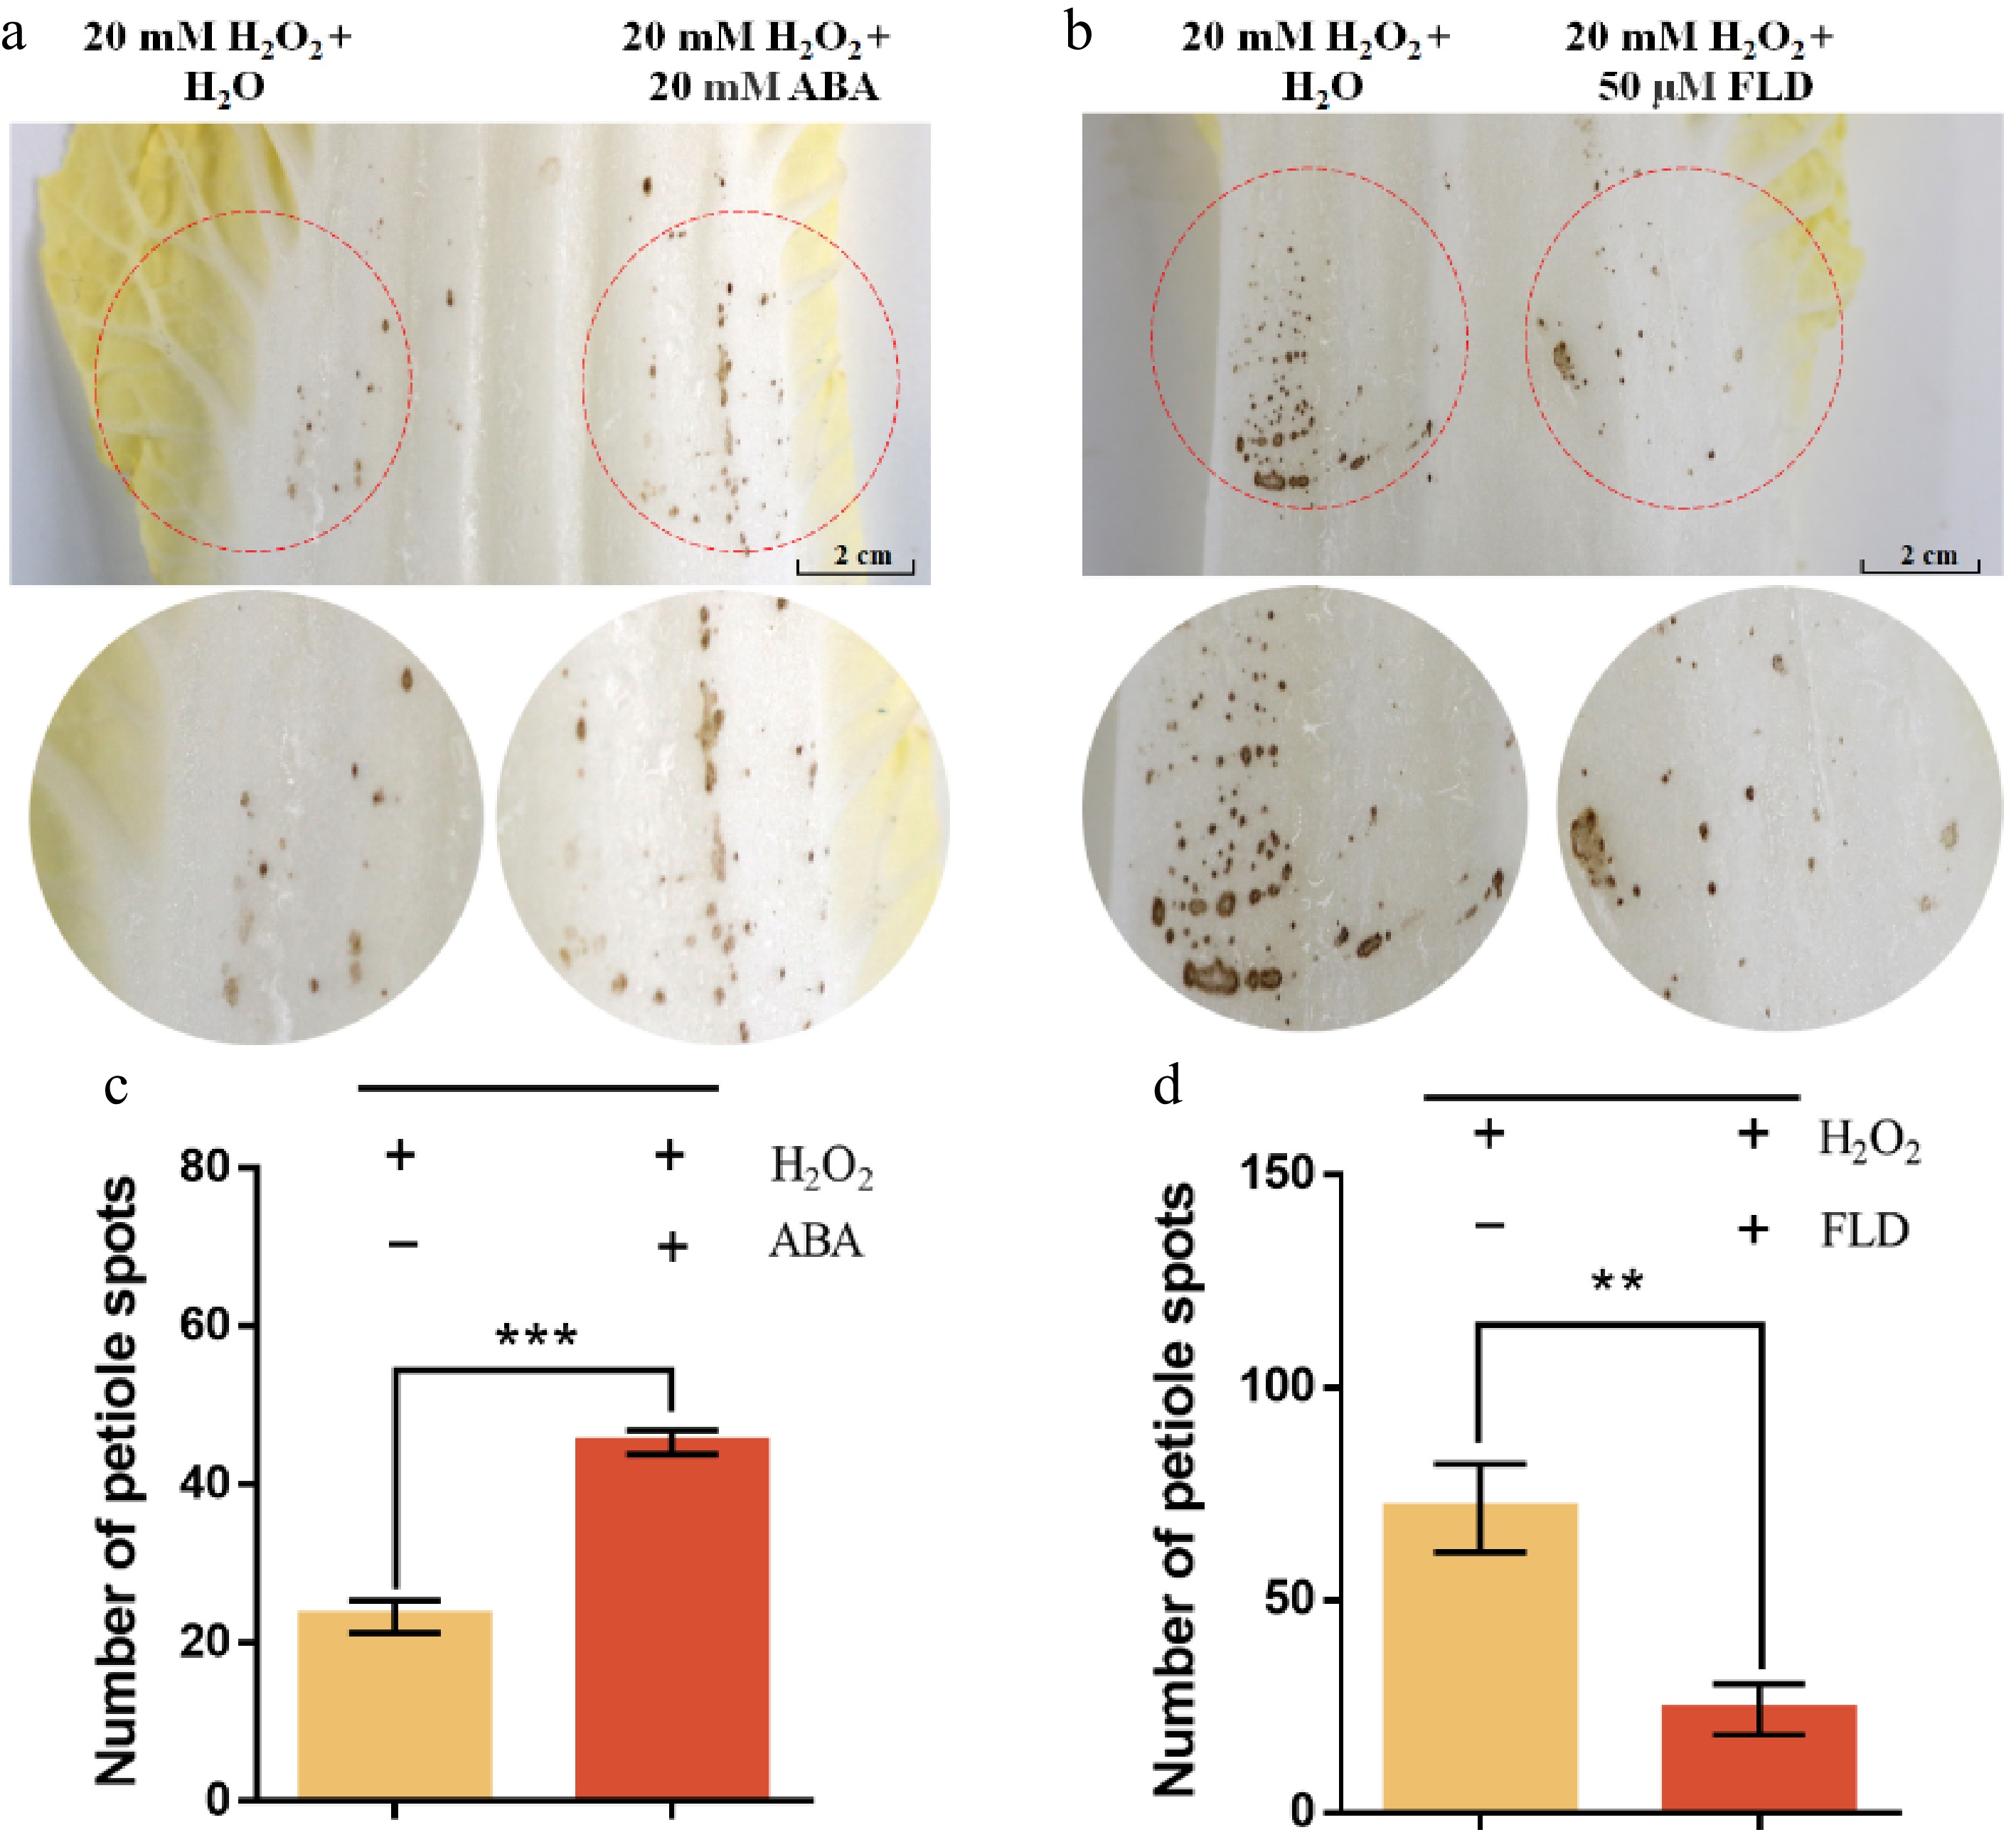
Figure 7.
ABA enhances and FLD suppresses H2O2-mimic ROS-induced petiole spot formation in Chinese cabbage cultivar Zaoshu No. 8 during cold storage. (a) Visual comparison of petiole spot formation after localized application of 20 mM H2O2 alone or in combination with 20 mM abscisic acid (ABA) on Chinese cabbage petioles. Red dashed circles indicate treated areas. (b) Visual comparison of petiole spot formation following co-treatment with 20 mM H2O2 and 50 μM fluridone (FLD, an ABA biosynthesis inhibitor). (b) Quantification of petiole spot numbers from (a), showing that co-treatment with ABA significantly increased the number of spots compared to H2O2 alone (*** p < 0.001). (d) Quantification of petiole spot numbers from (c), demonstrating that FLD significantly reduced H2O2-induced spot formation (** p < 0.01). Data represent means ± SE of three biological replicates. Statistical significance was assessed using Student's t-test.
Figures
(7)
Tables
(0)