-
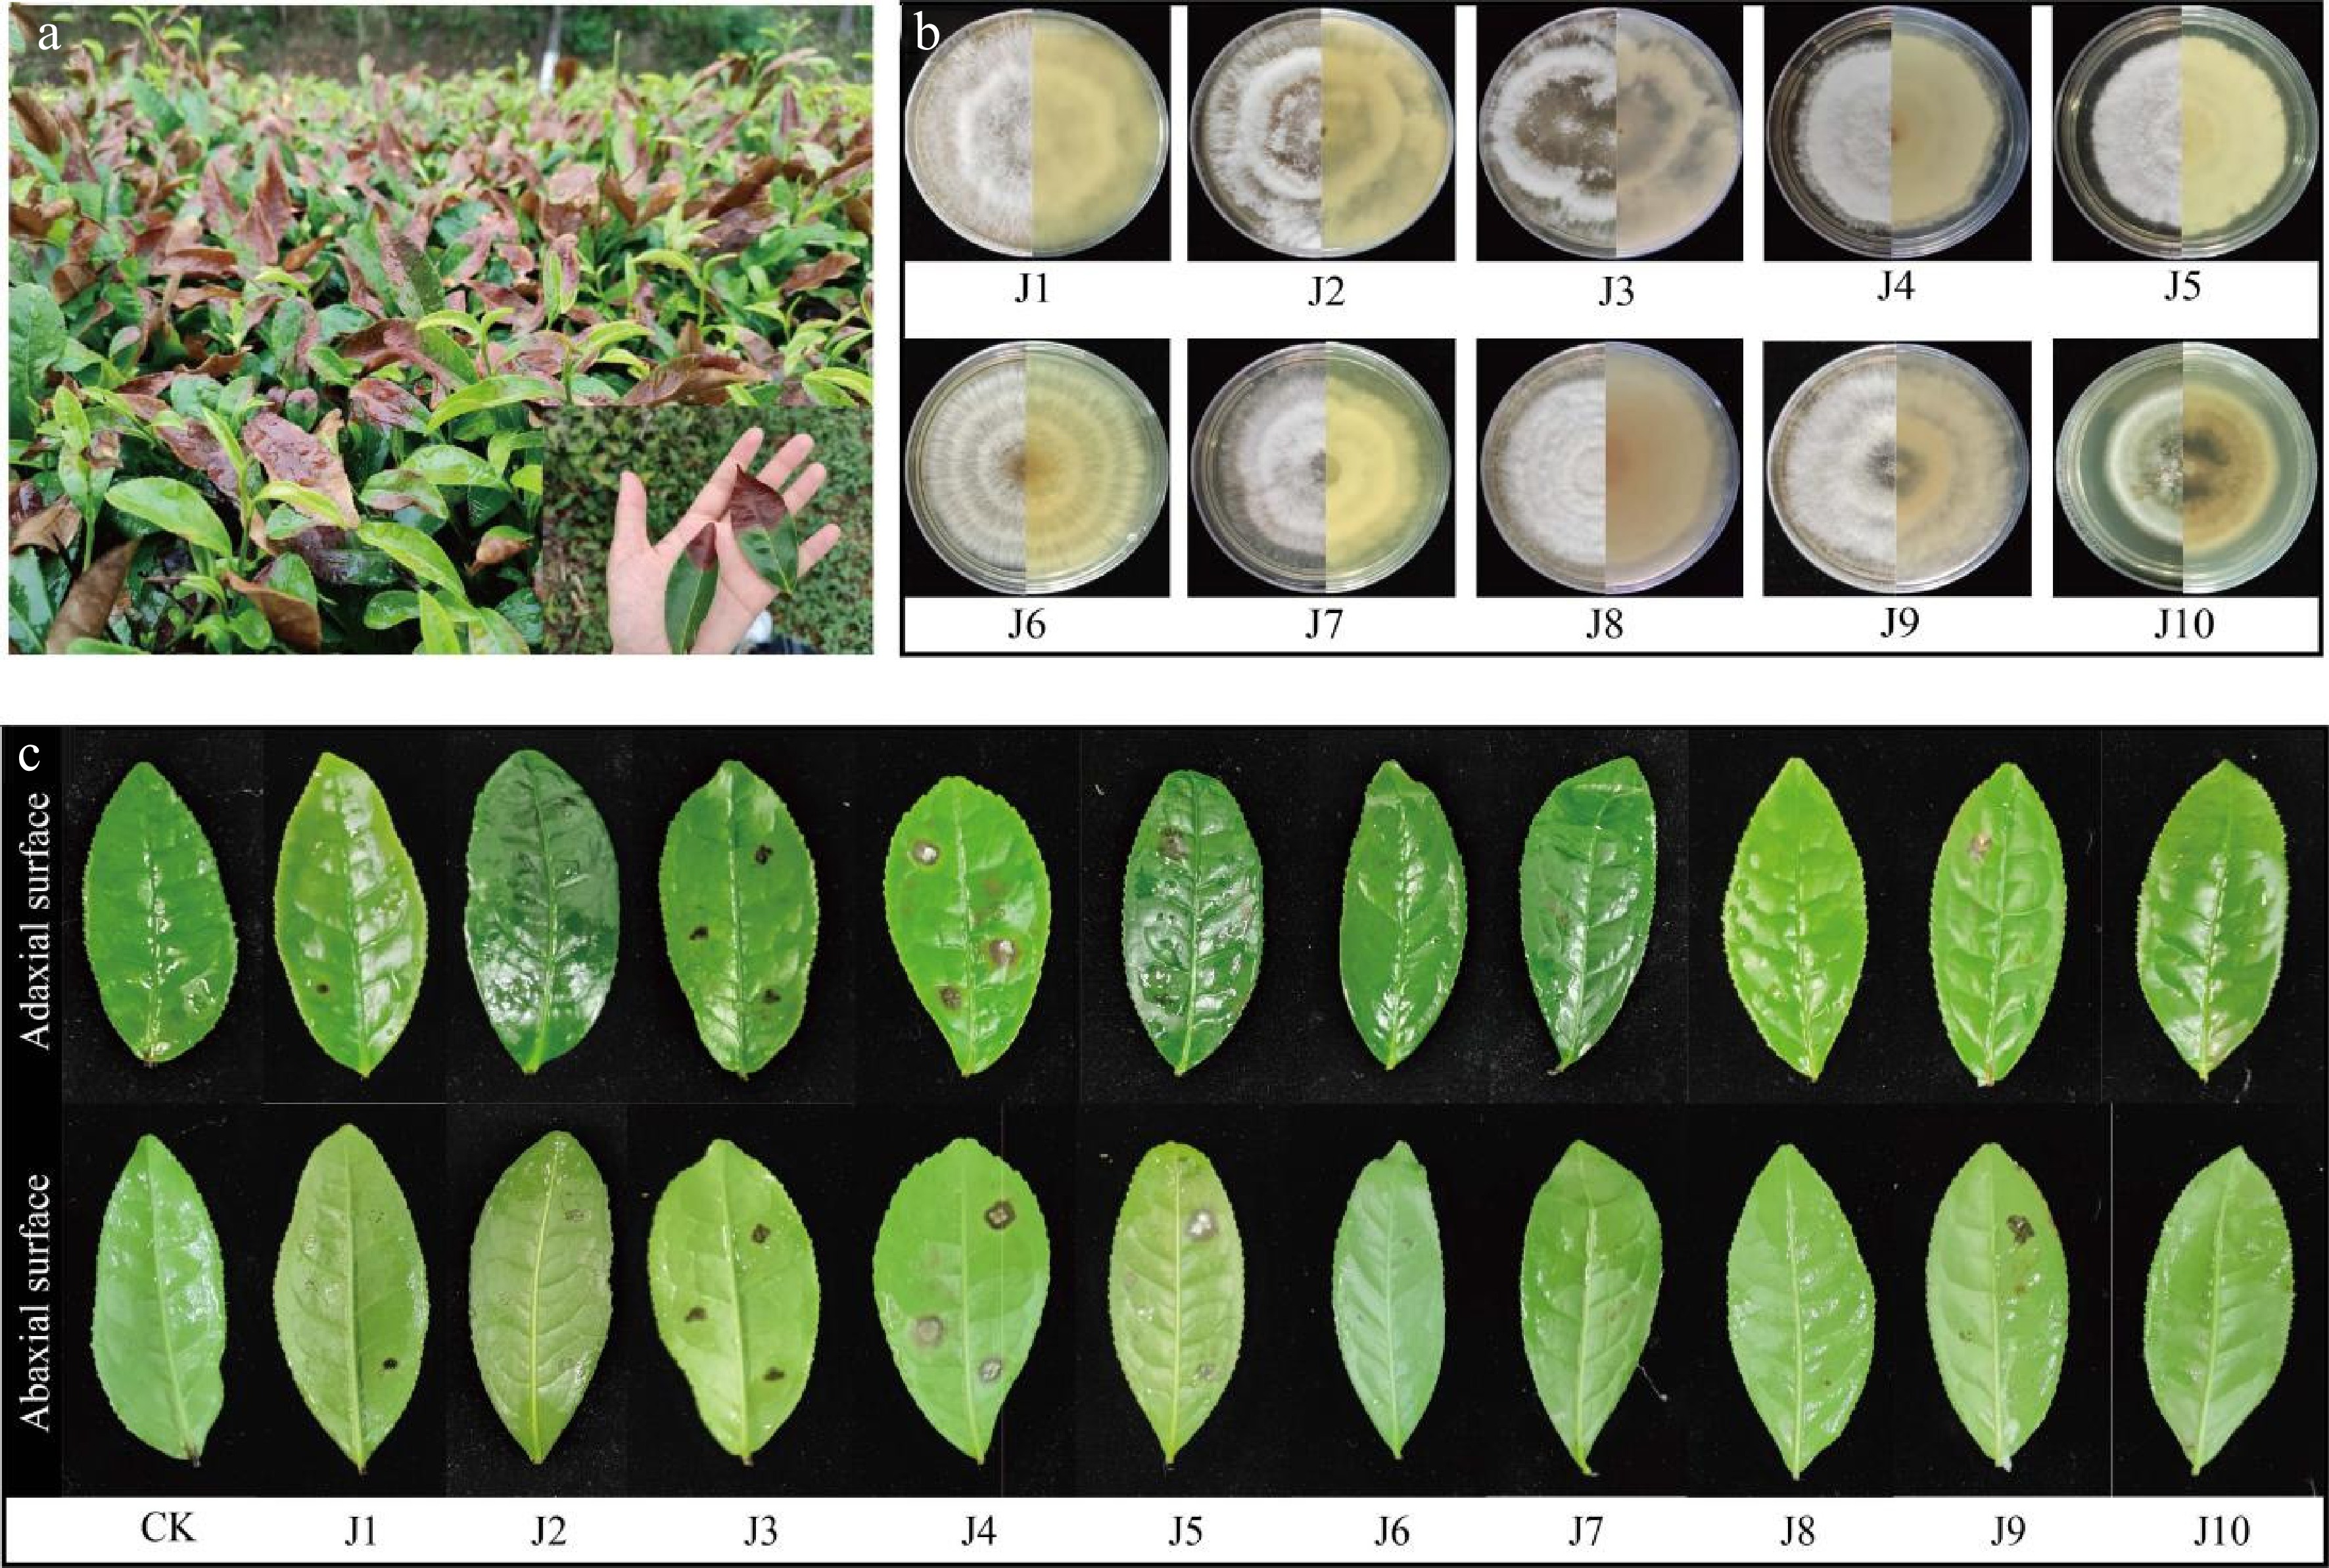
Figure 1.
Morphological characteristics of pathogens. (a) Typical symptoms on naturally infected leaves. (b) Colony morphology (front and reverse) of isolated strains. (c) Disease development on detached leaves after inoculation (CK: control).
-
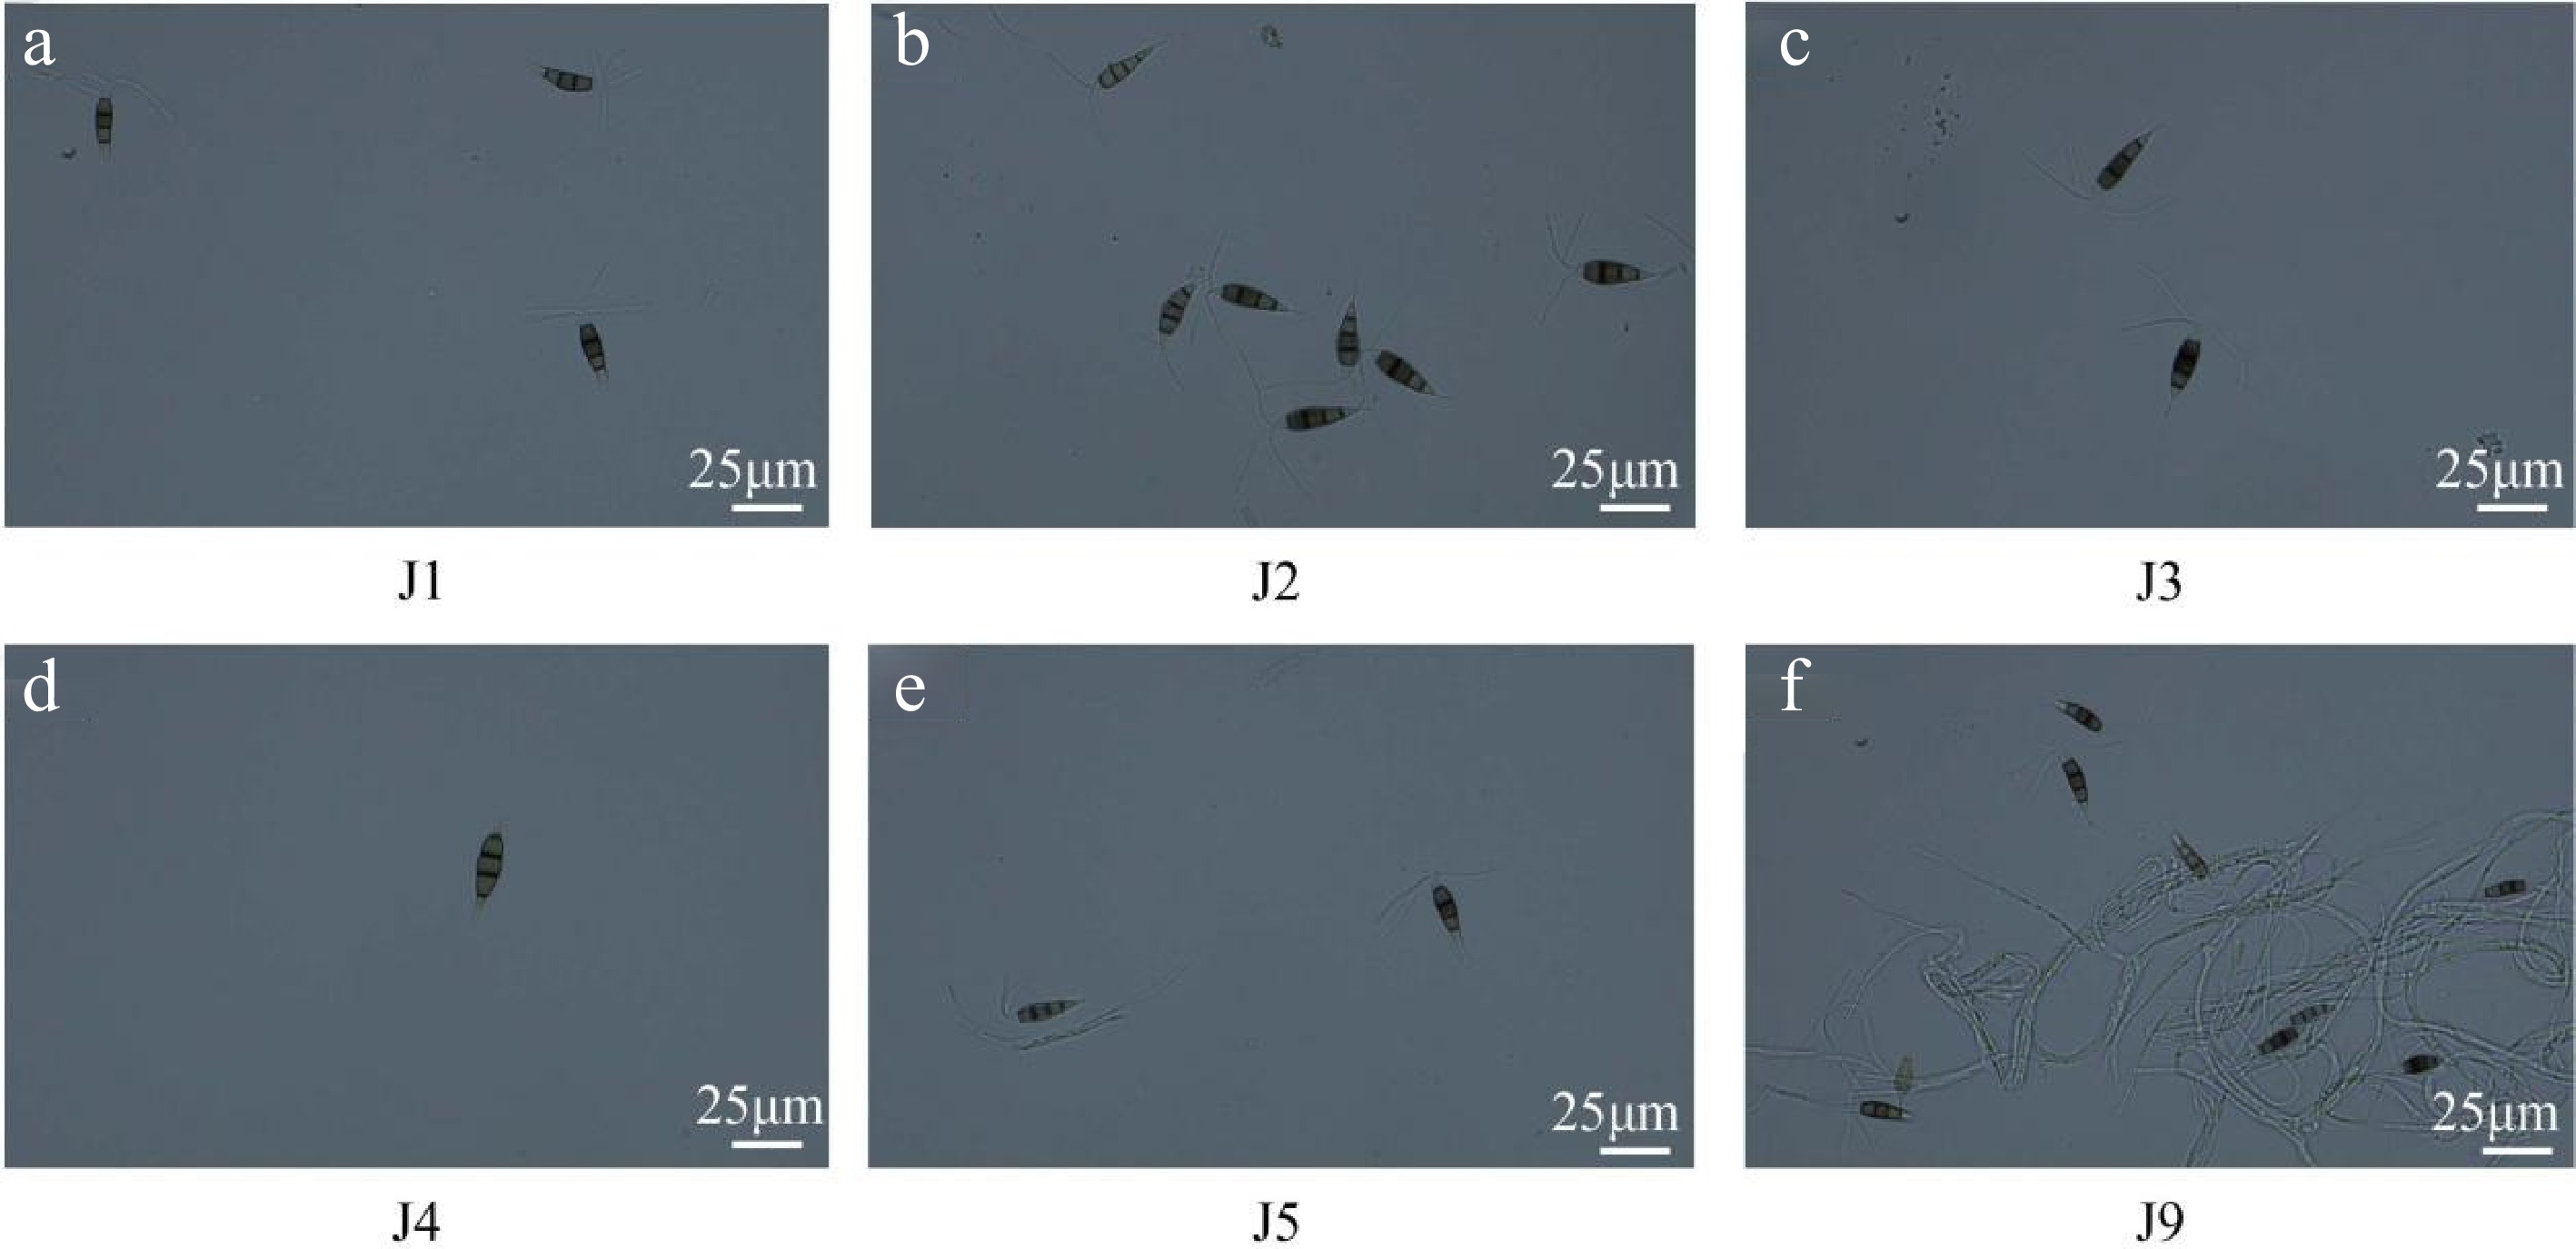
Figure 2.
The conidia morphology of pathogen isolate. Bar = 25 μm.
-

Figure 3.
The phylogenetic and phenotypic characterization of pathogen strains causing tea gray blight disease. (a) Phylogenetic tree of pathogen strains and reference strains. Tree scale = 0.050 represents genetic distance. (b) Colony morphology observation of pathogen strains.
-
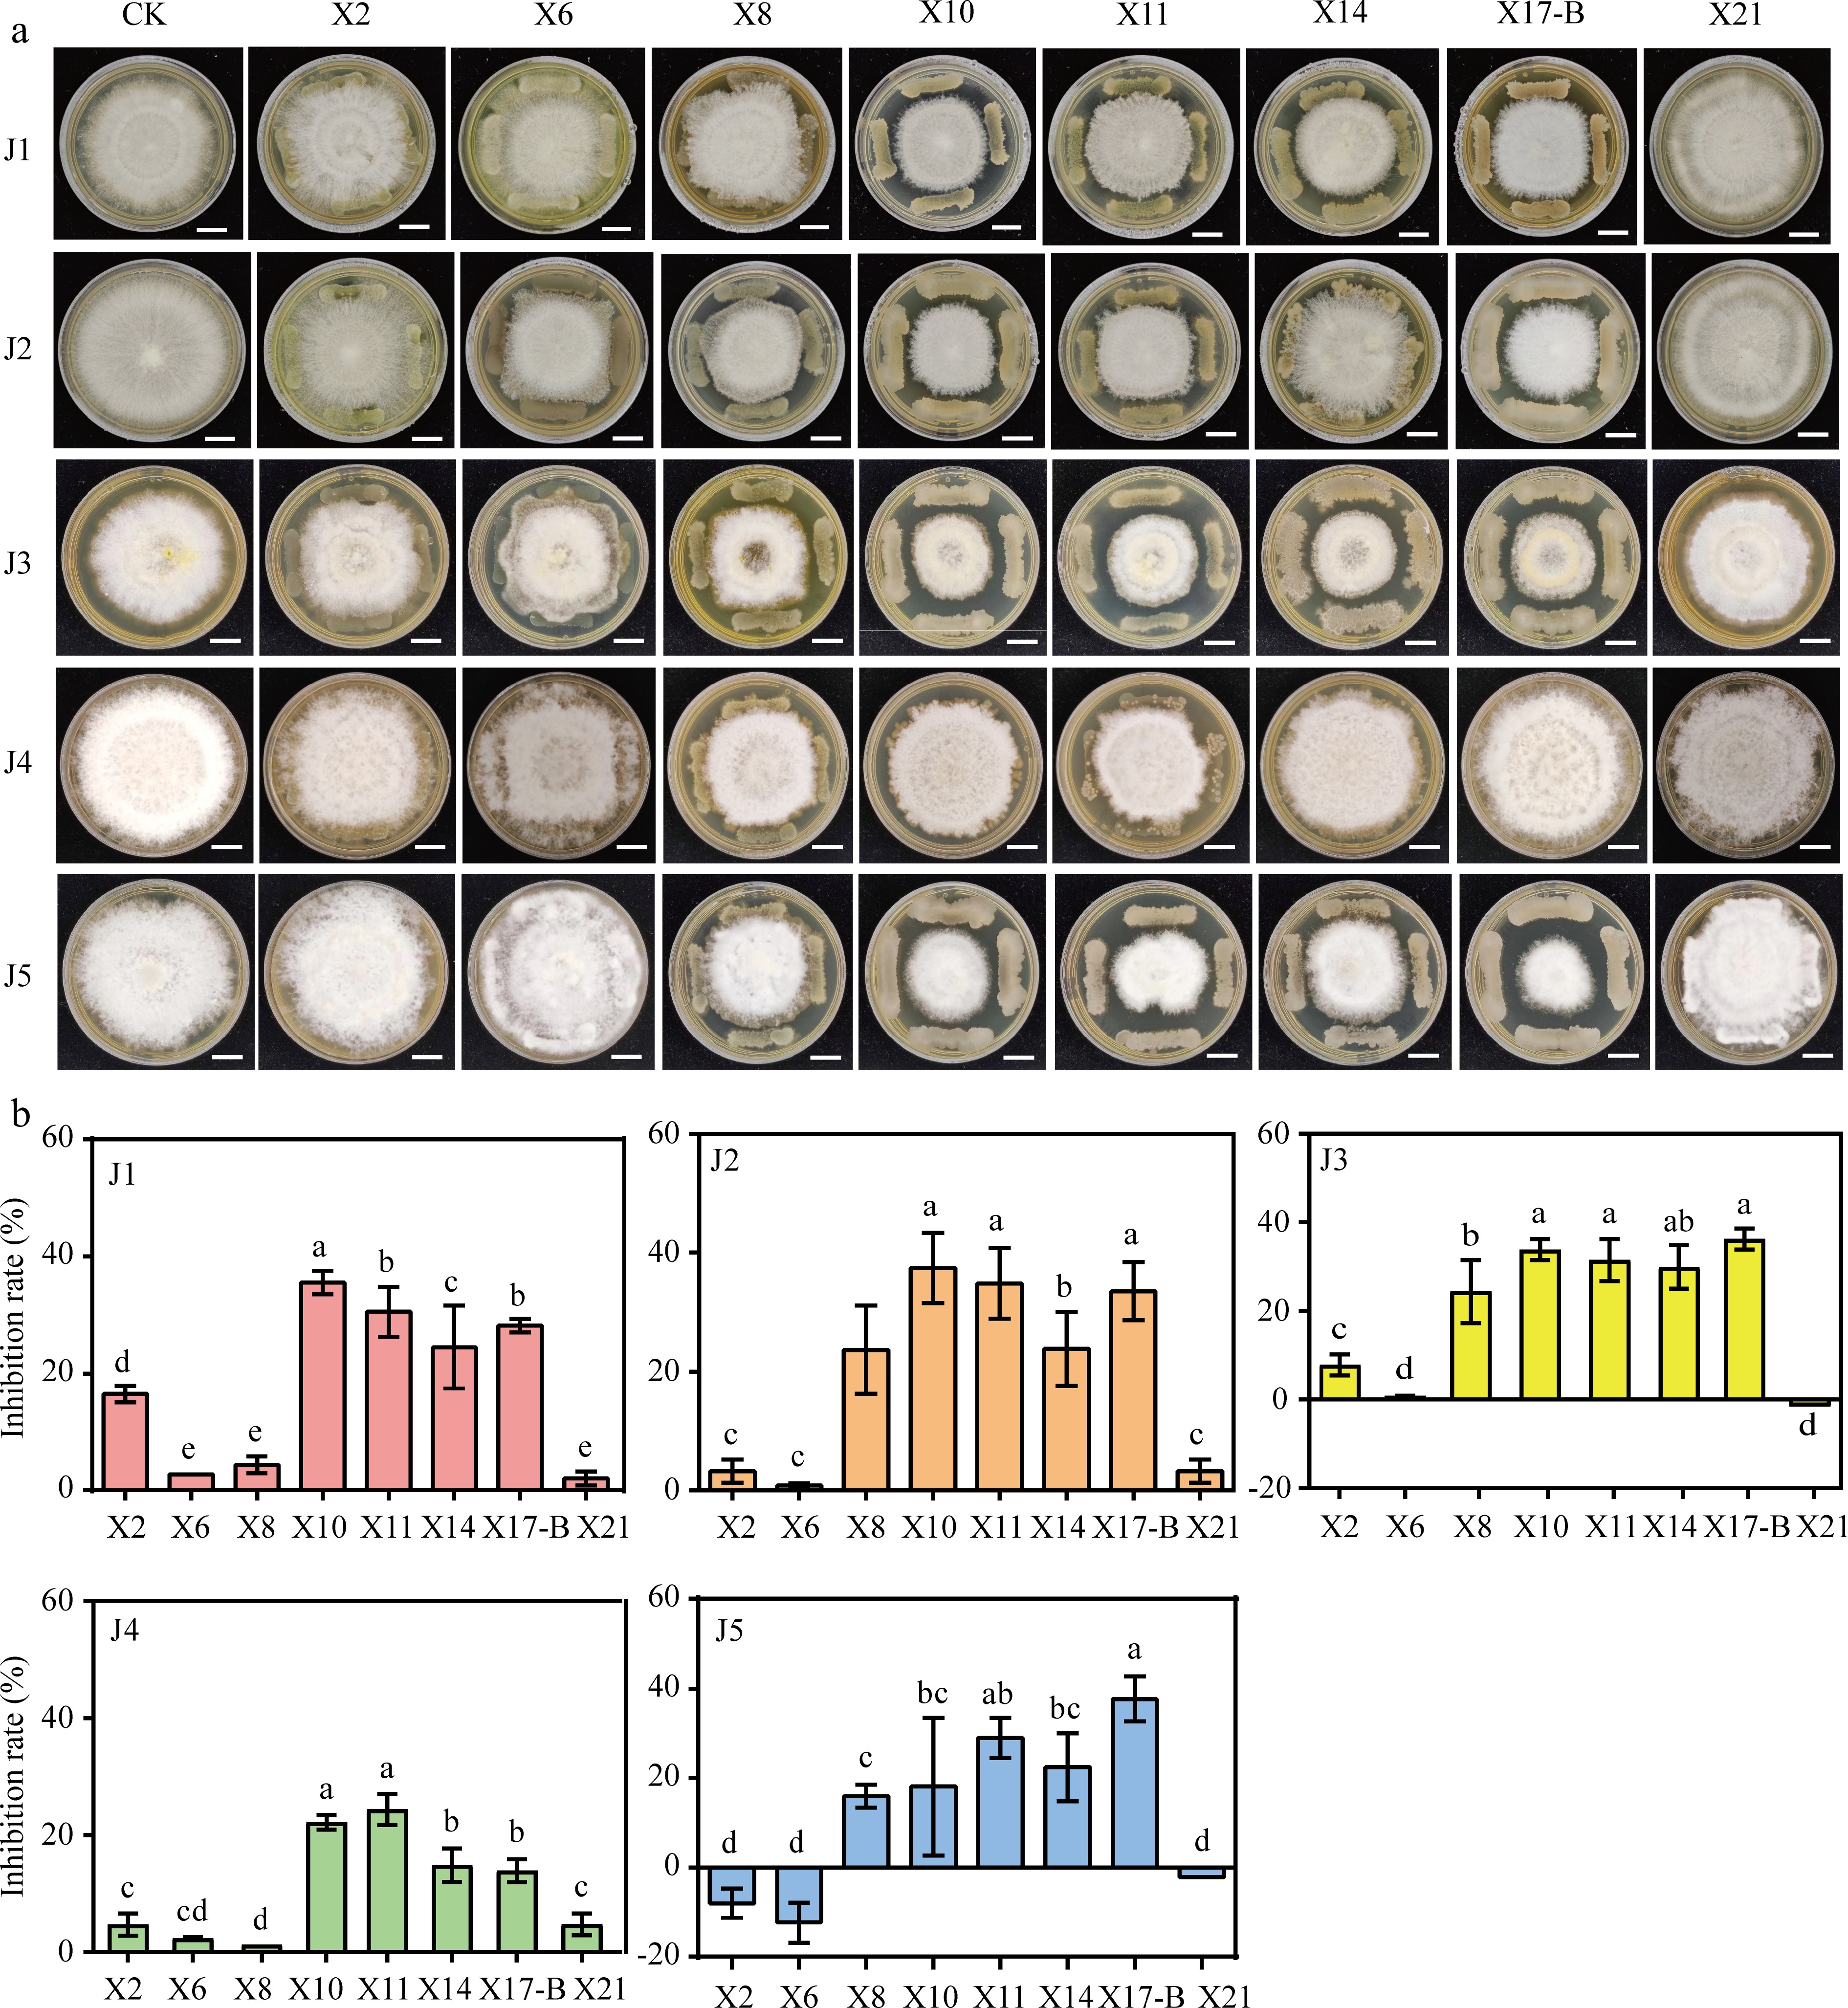
Figure 4.
Antagonistic effect of biocontrol strain with pathogen of gray blight disease. (a) Dual culture test on antagonistic bacteria against the tea gray blight disease pathogen. CK: Five pathogen normal culture on 6 mm PDA medium were used as controls. Scale bar = 1 cm. (b) Width change of pathogens under conditions of antagonistic culture. The data represent the average ± SD of biological repeats, different letters indicate significantly differences between means as determined according to ANOVA followed by Duncan's tests (p < 0.05)
-
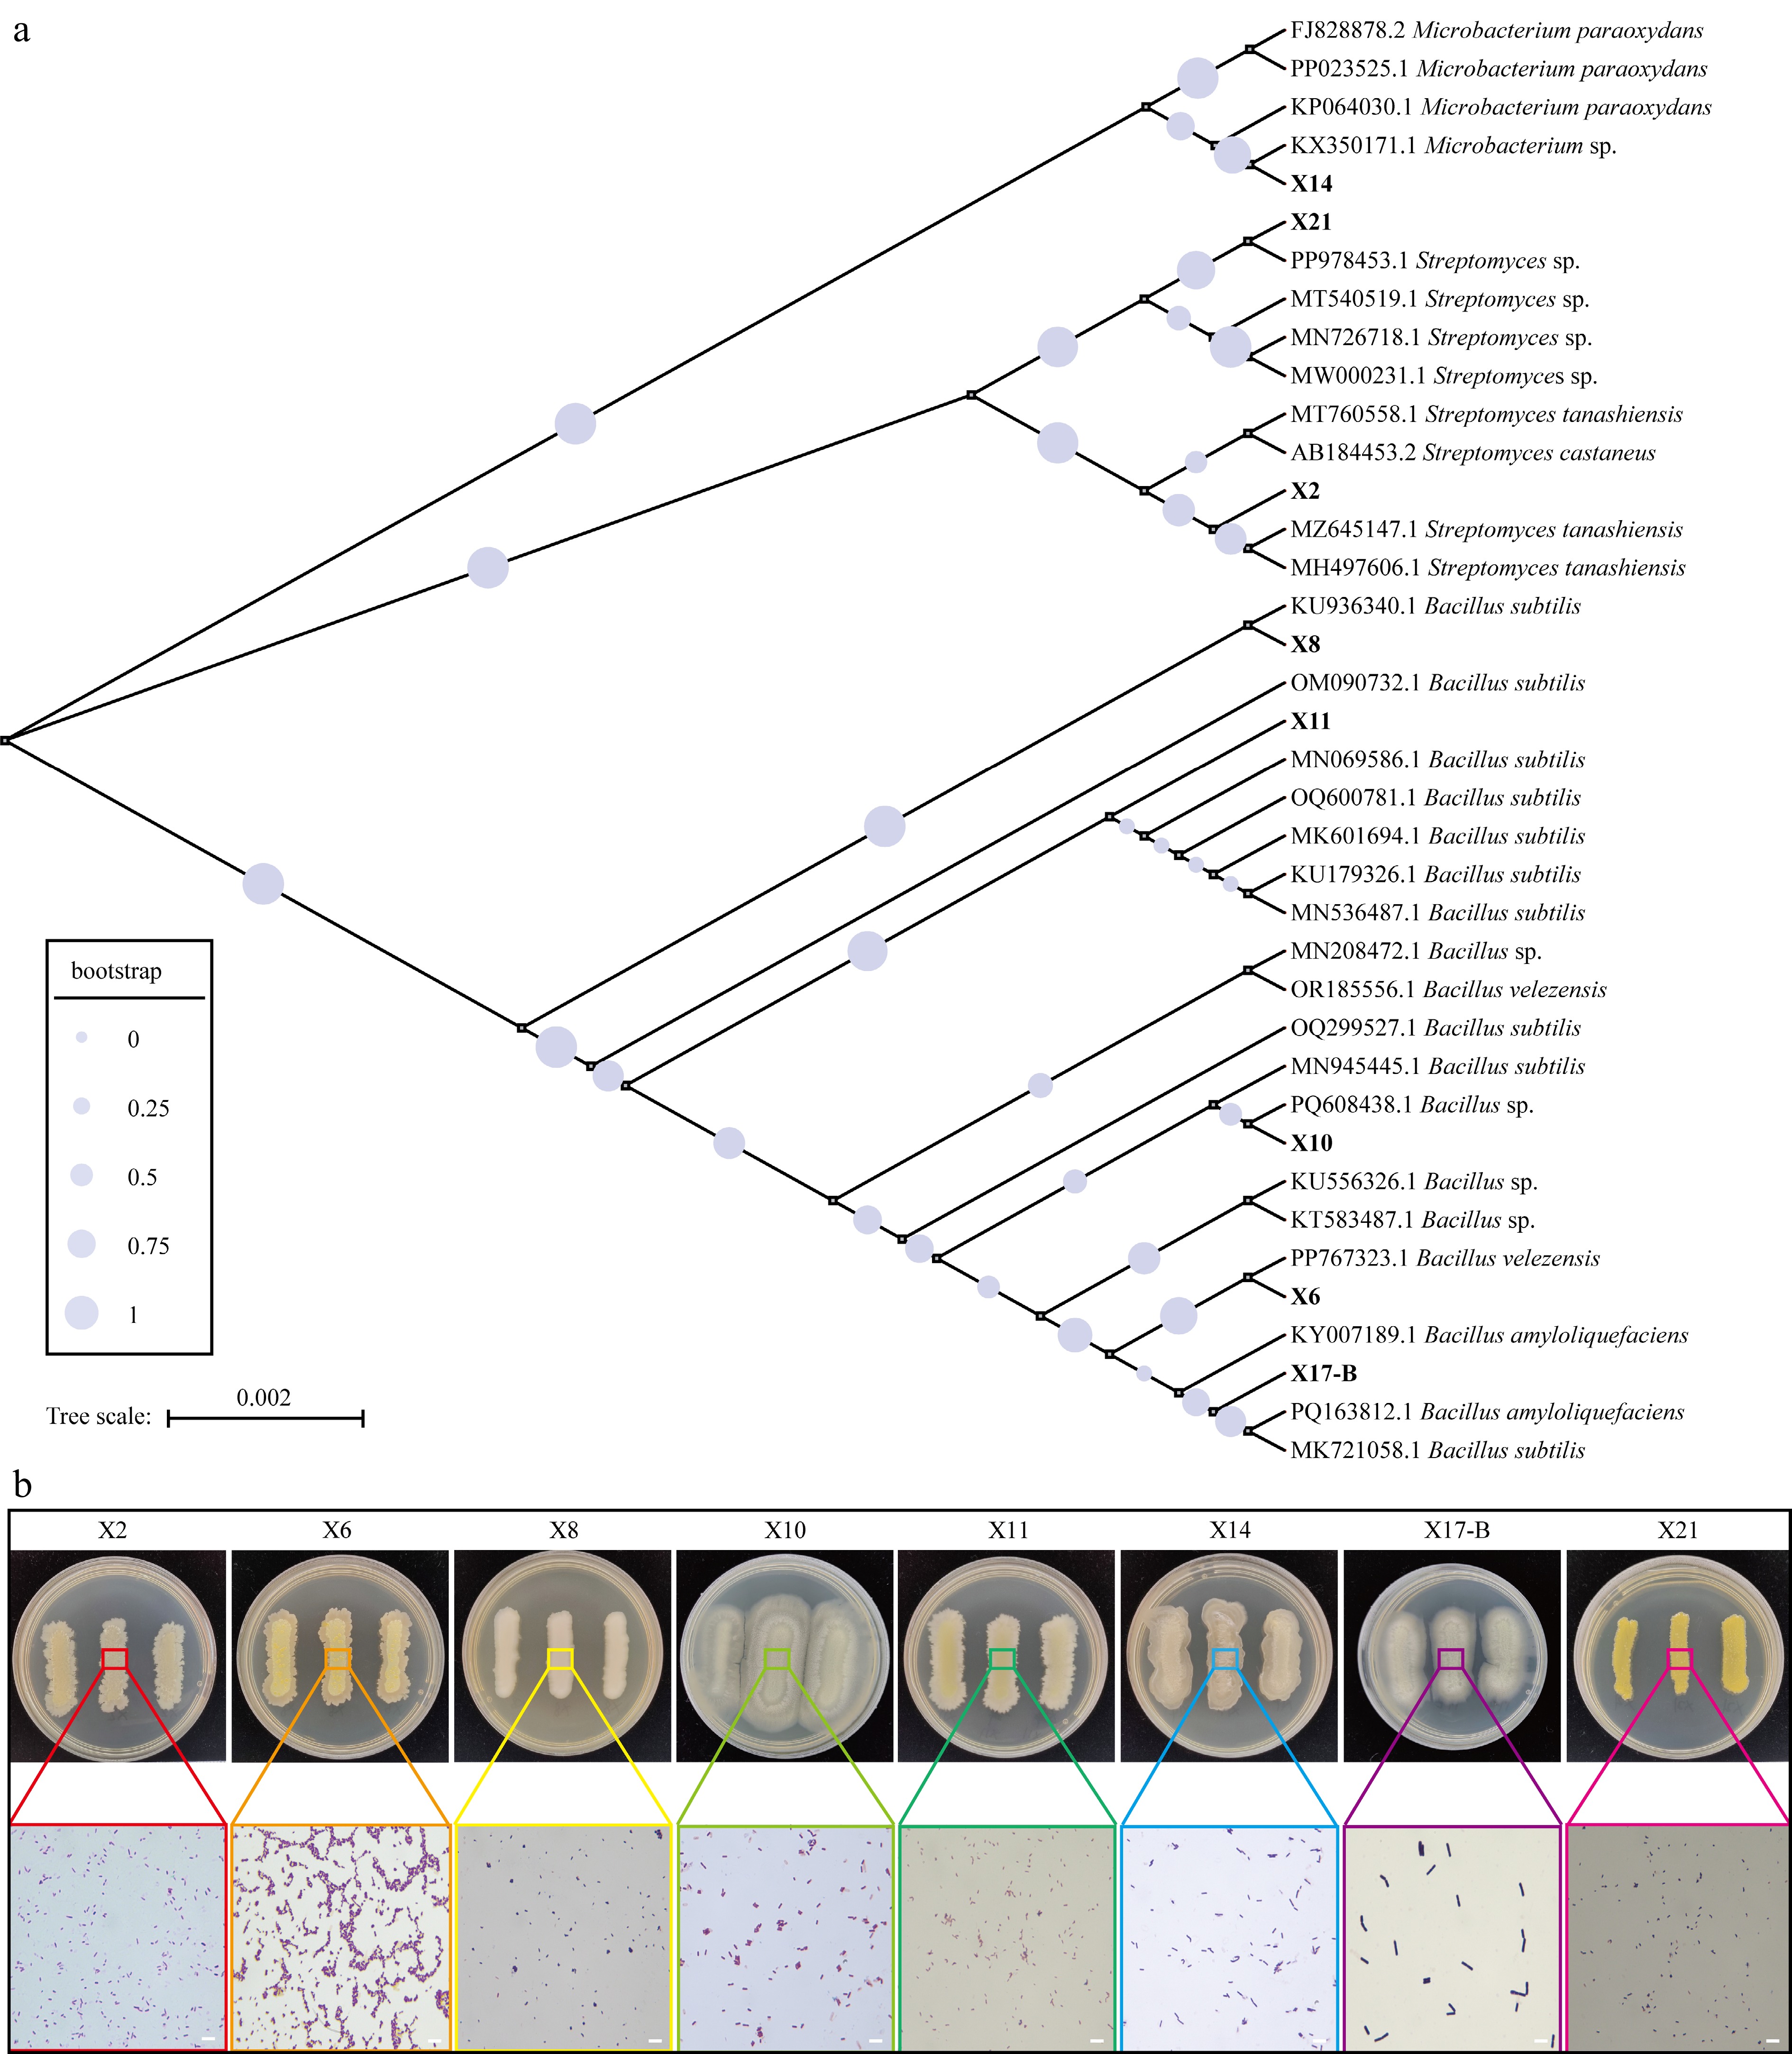
Figure 5.
The phylogenetic and phenotypic analysis of biocontrol strains. (a) Phylogenetic tree of biocontrol strains and reference strains. The size of circles at nodes represents bootstrap values (0–1, with larger values indicating higher branch reliability, see the bootstrap legend). Tree scale = 0.002 represents genetic distance. (b) Colony morphology and Gram staining microscopic observation of biocontrol strains. The upper part shows the colony phenotypes of the strains on PDA medium (the numbers of the Petri dishes correspond to the strains: X2, X6, X8, X10, X11, X14, X17-B, X21), and the colored boxes mark the local areas of the colonies; the lower part shows the Gram staining microscopic images of the corresponding areas (magnification: 100 ×, scale = 1 μm), demonstrating the bacterial cell morphology and staining characteristics.
-
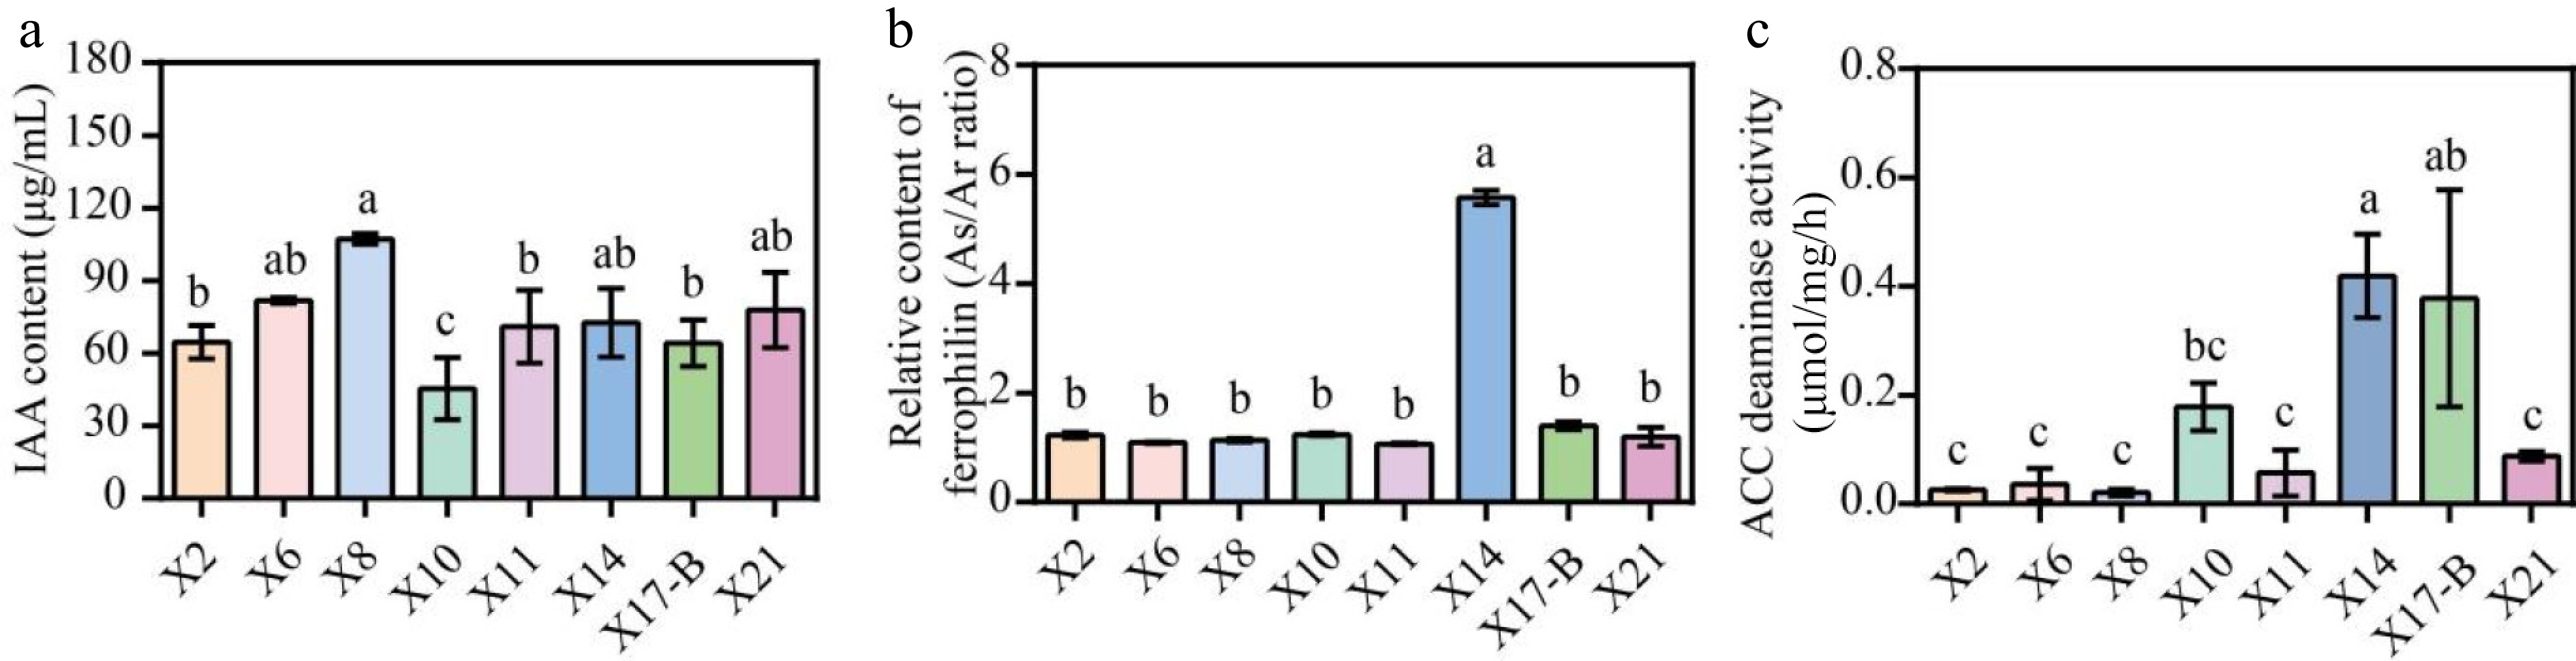
Figure 6.
Growth-promoting characteristics of biocontrol strains. (a) IAA produced by the isolated antagonistic strains. (b) Siderophores production by the antagonistic strain isolates. (c) Determination of ACC deaminase activity of antagonistic strains. The data represent the average ± SD of biological repeats. Different letters indicate significantly differences between means as determined according to ANOVA followed by Duncan's tests (p < 0.05)
-
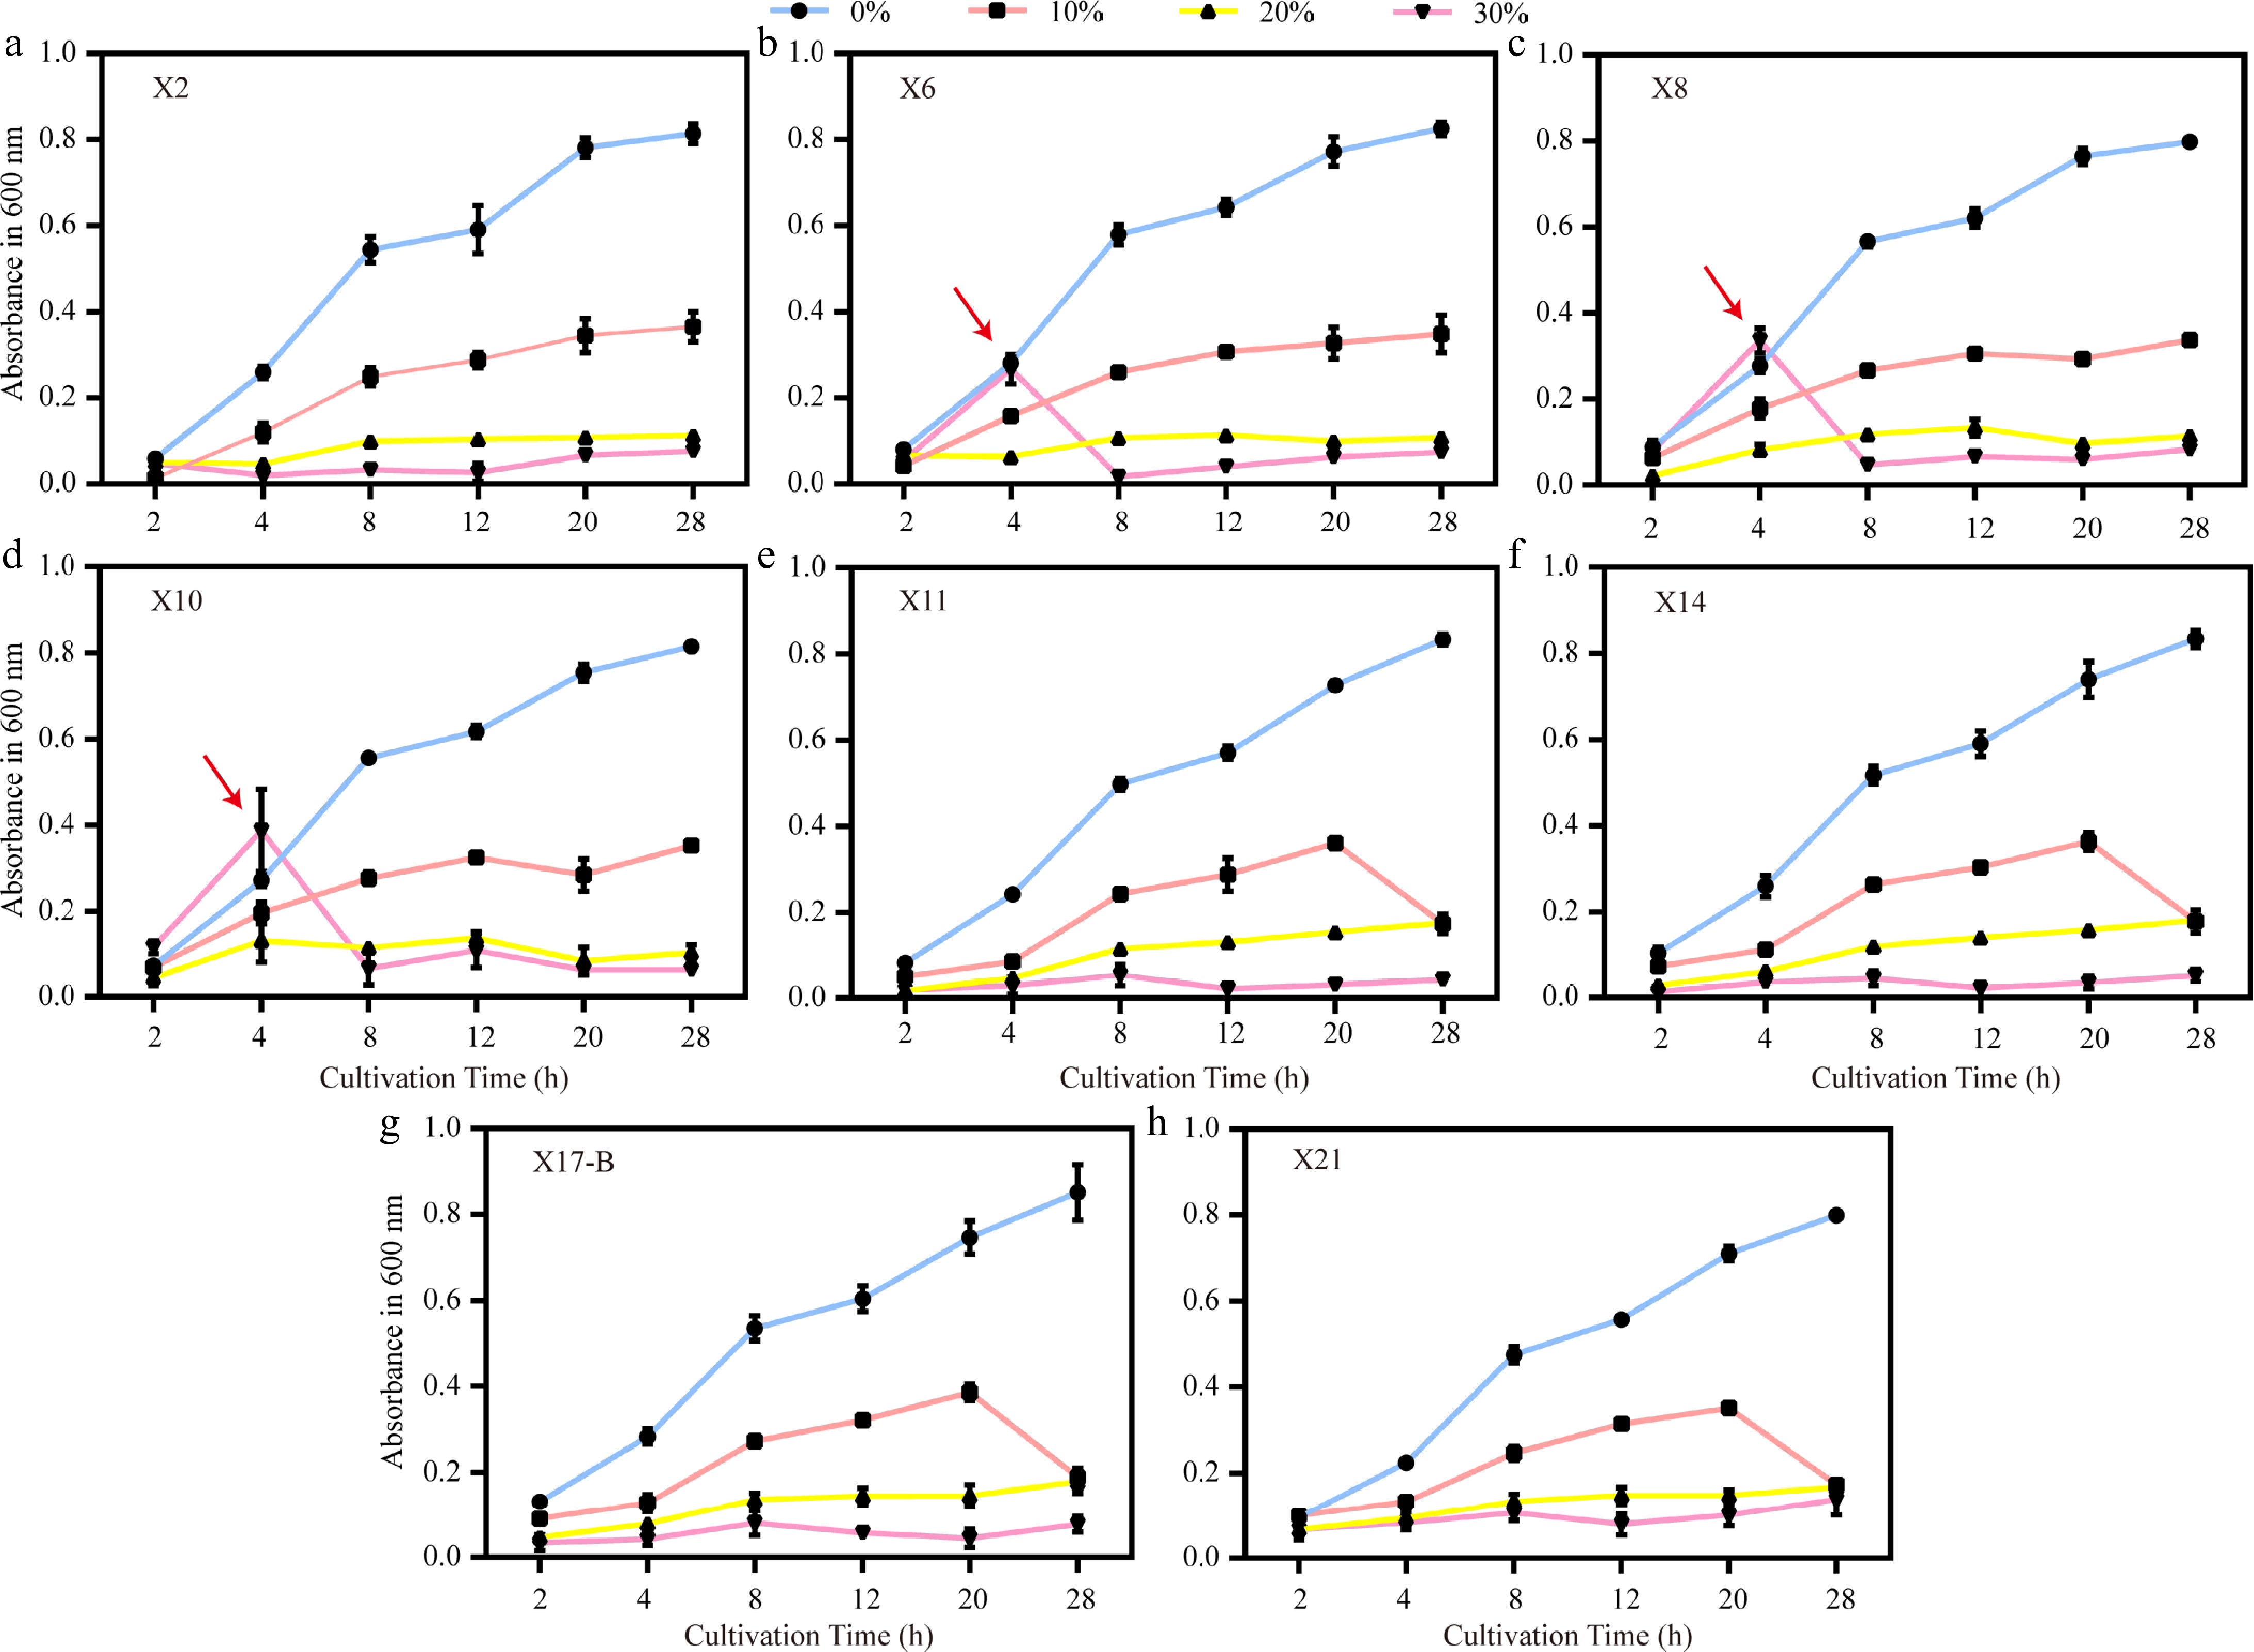
Figure 7.
Growth trends of biocontrol strains under different PEG6000 concentrations. (a)–(h) Growth curves (OD600) of strains X2, X6, X8, X10, X11, X14, X17-B, and X21 under drought stress simulated by 0%, 10%, 20%, and 30% PEG6000. Red arrows indicate abrupt growth rate changes of X6, X8, and X10 at 4 h under 30% PEG. Error bars represent standard deviations of triplicates (n = 3).
-
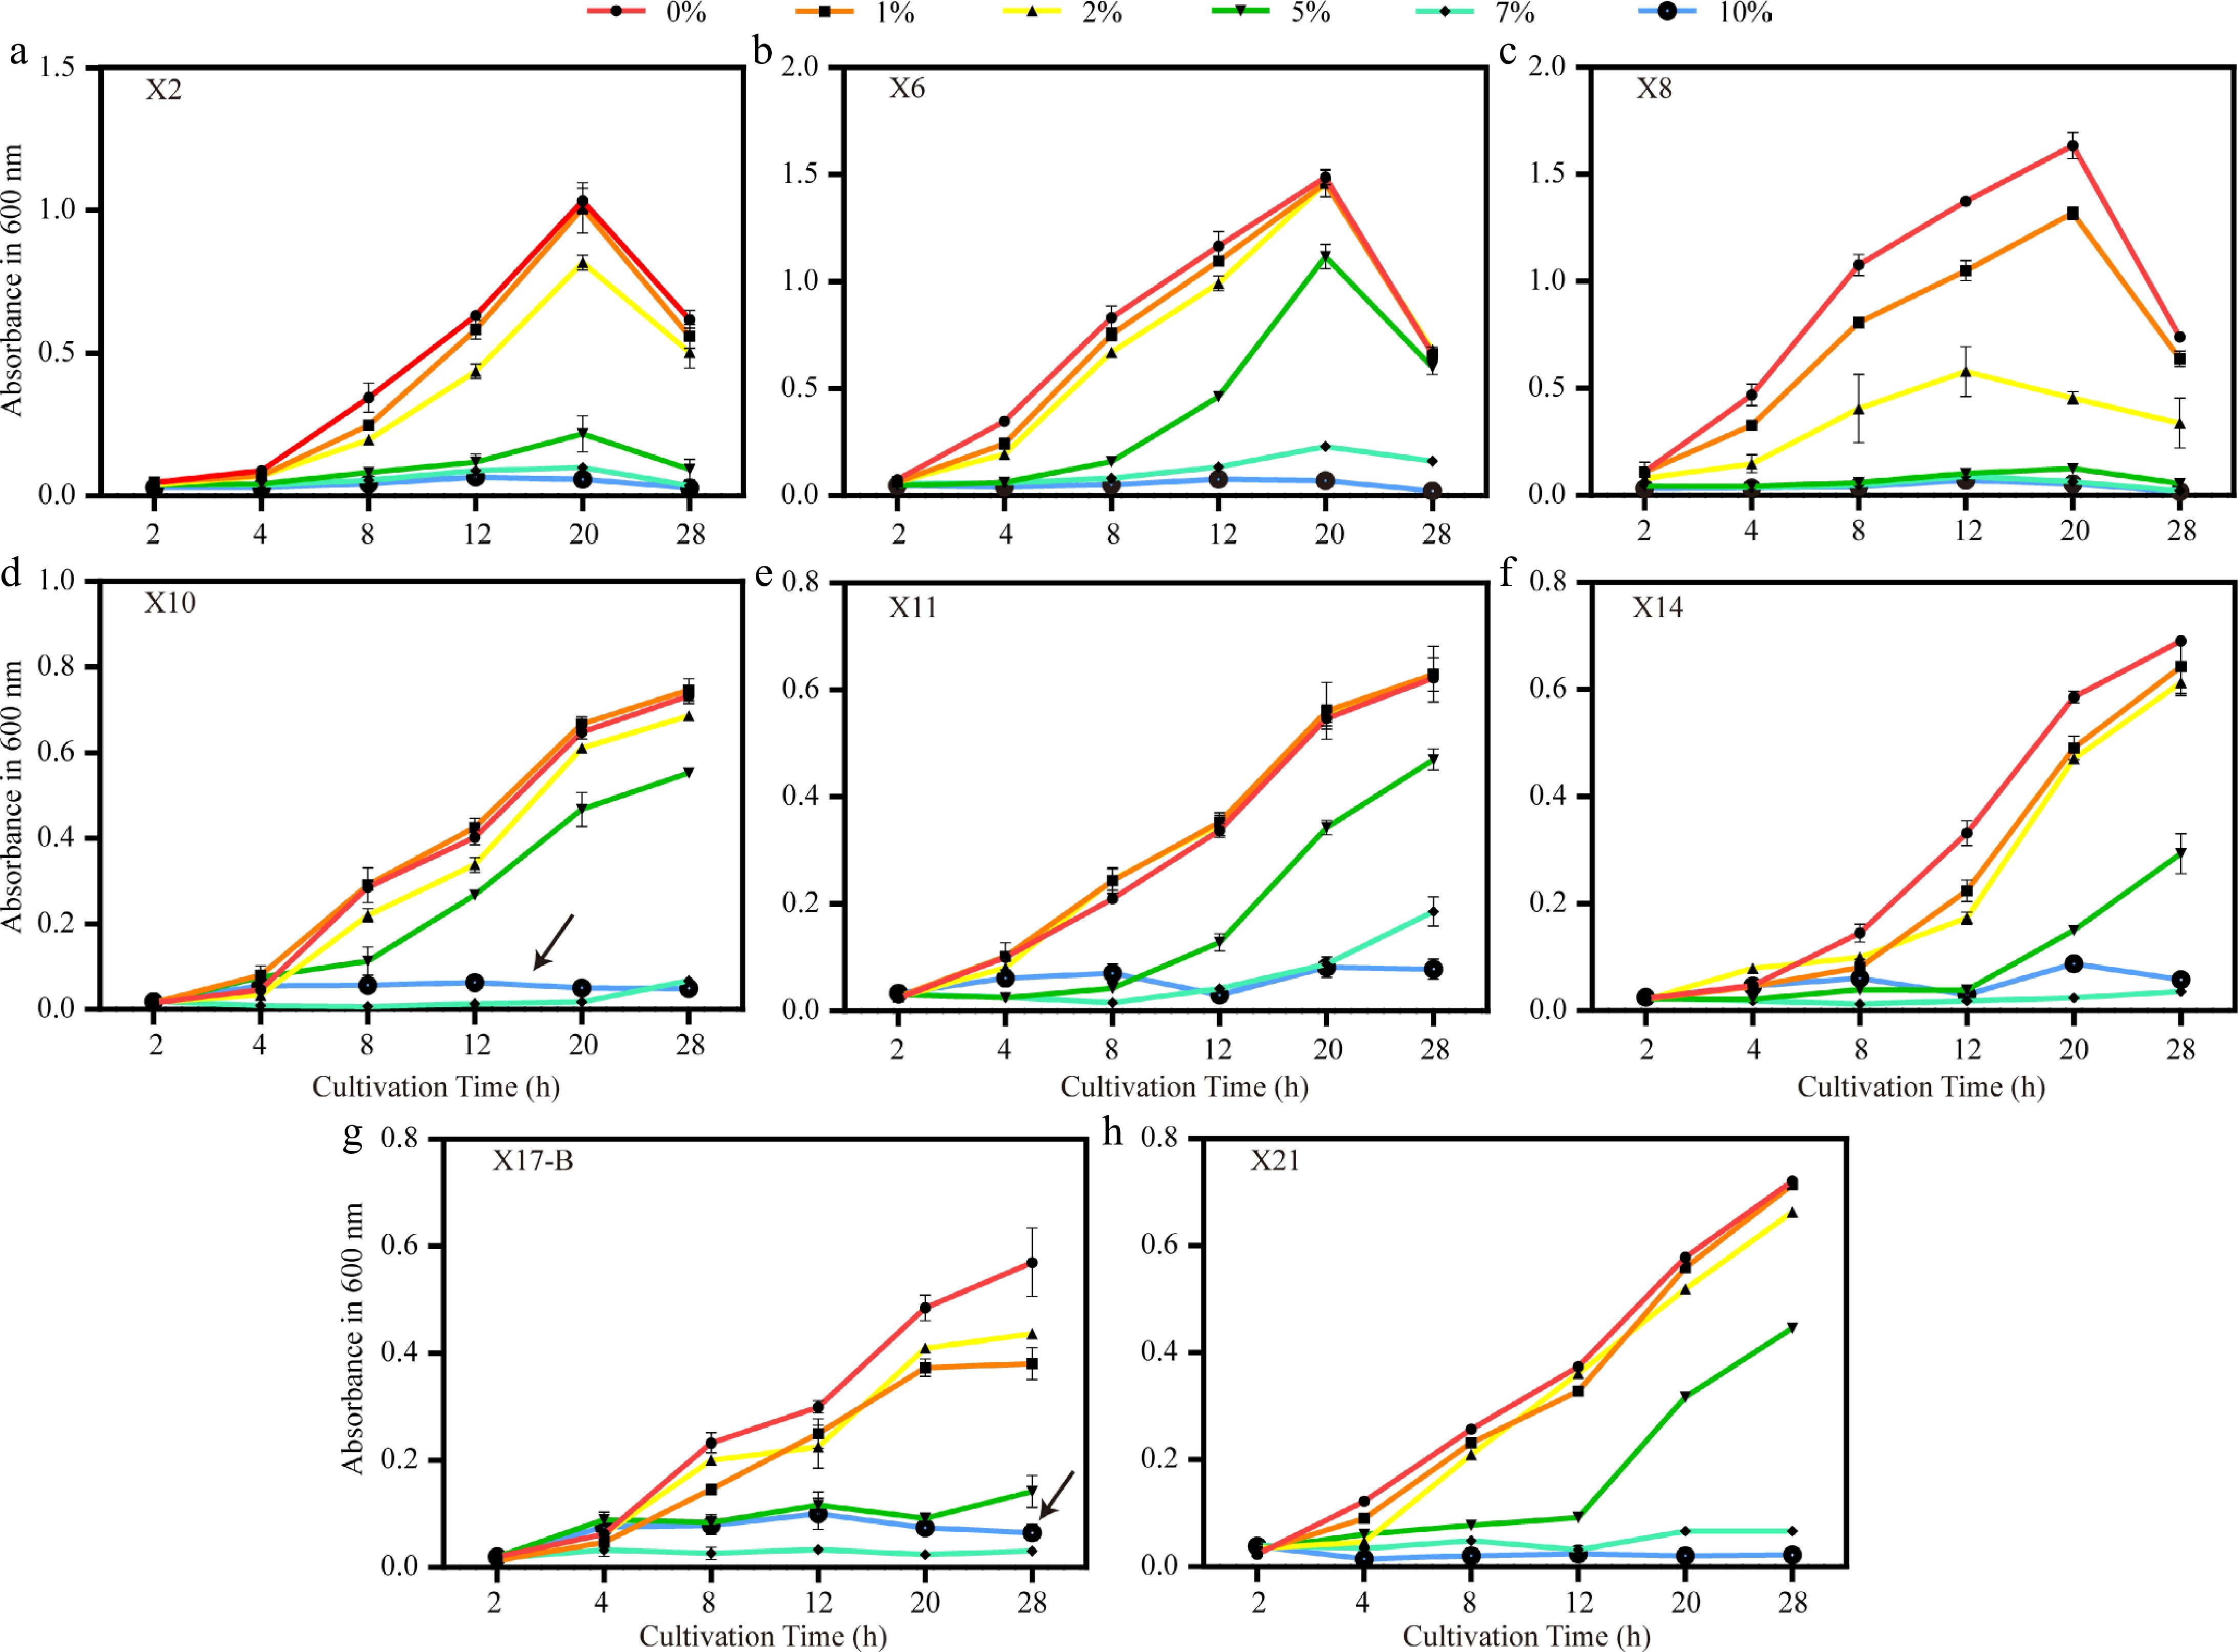
Figure 8.
Growth trends of biocontrol strains under different NaCl concentrations. (a)–(h) Growth curves (OD600) of strains X2, X6, X8, X10, X11, X14, X17-B, and X21 under salt stress with 0%, 1%, 2%, 5%, 7%, and 10% NaCl. Black arrows indicate the atypical growth recovery of X10 and X17-B at 10% NaCl. Error bars represent standard deviations of triplicates (n = 3).
Figures
(8)
Tables
(0)