-
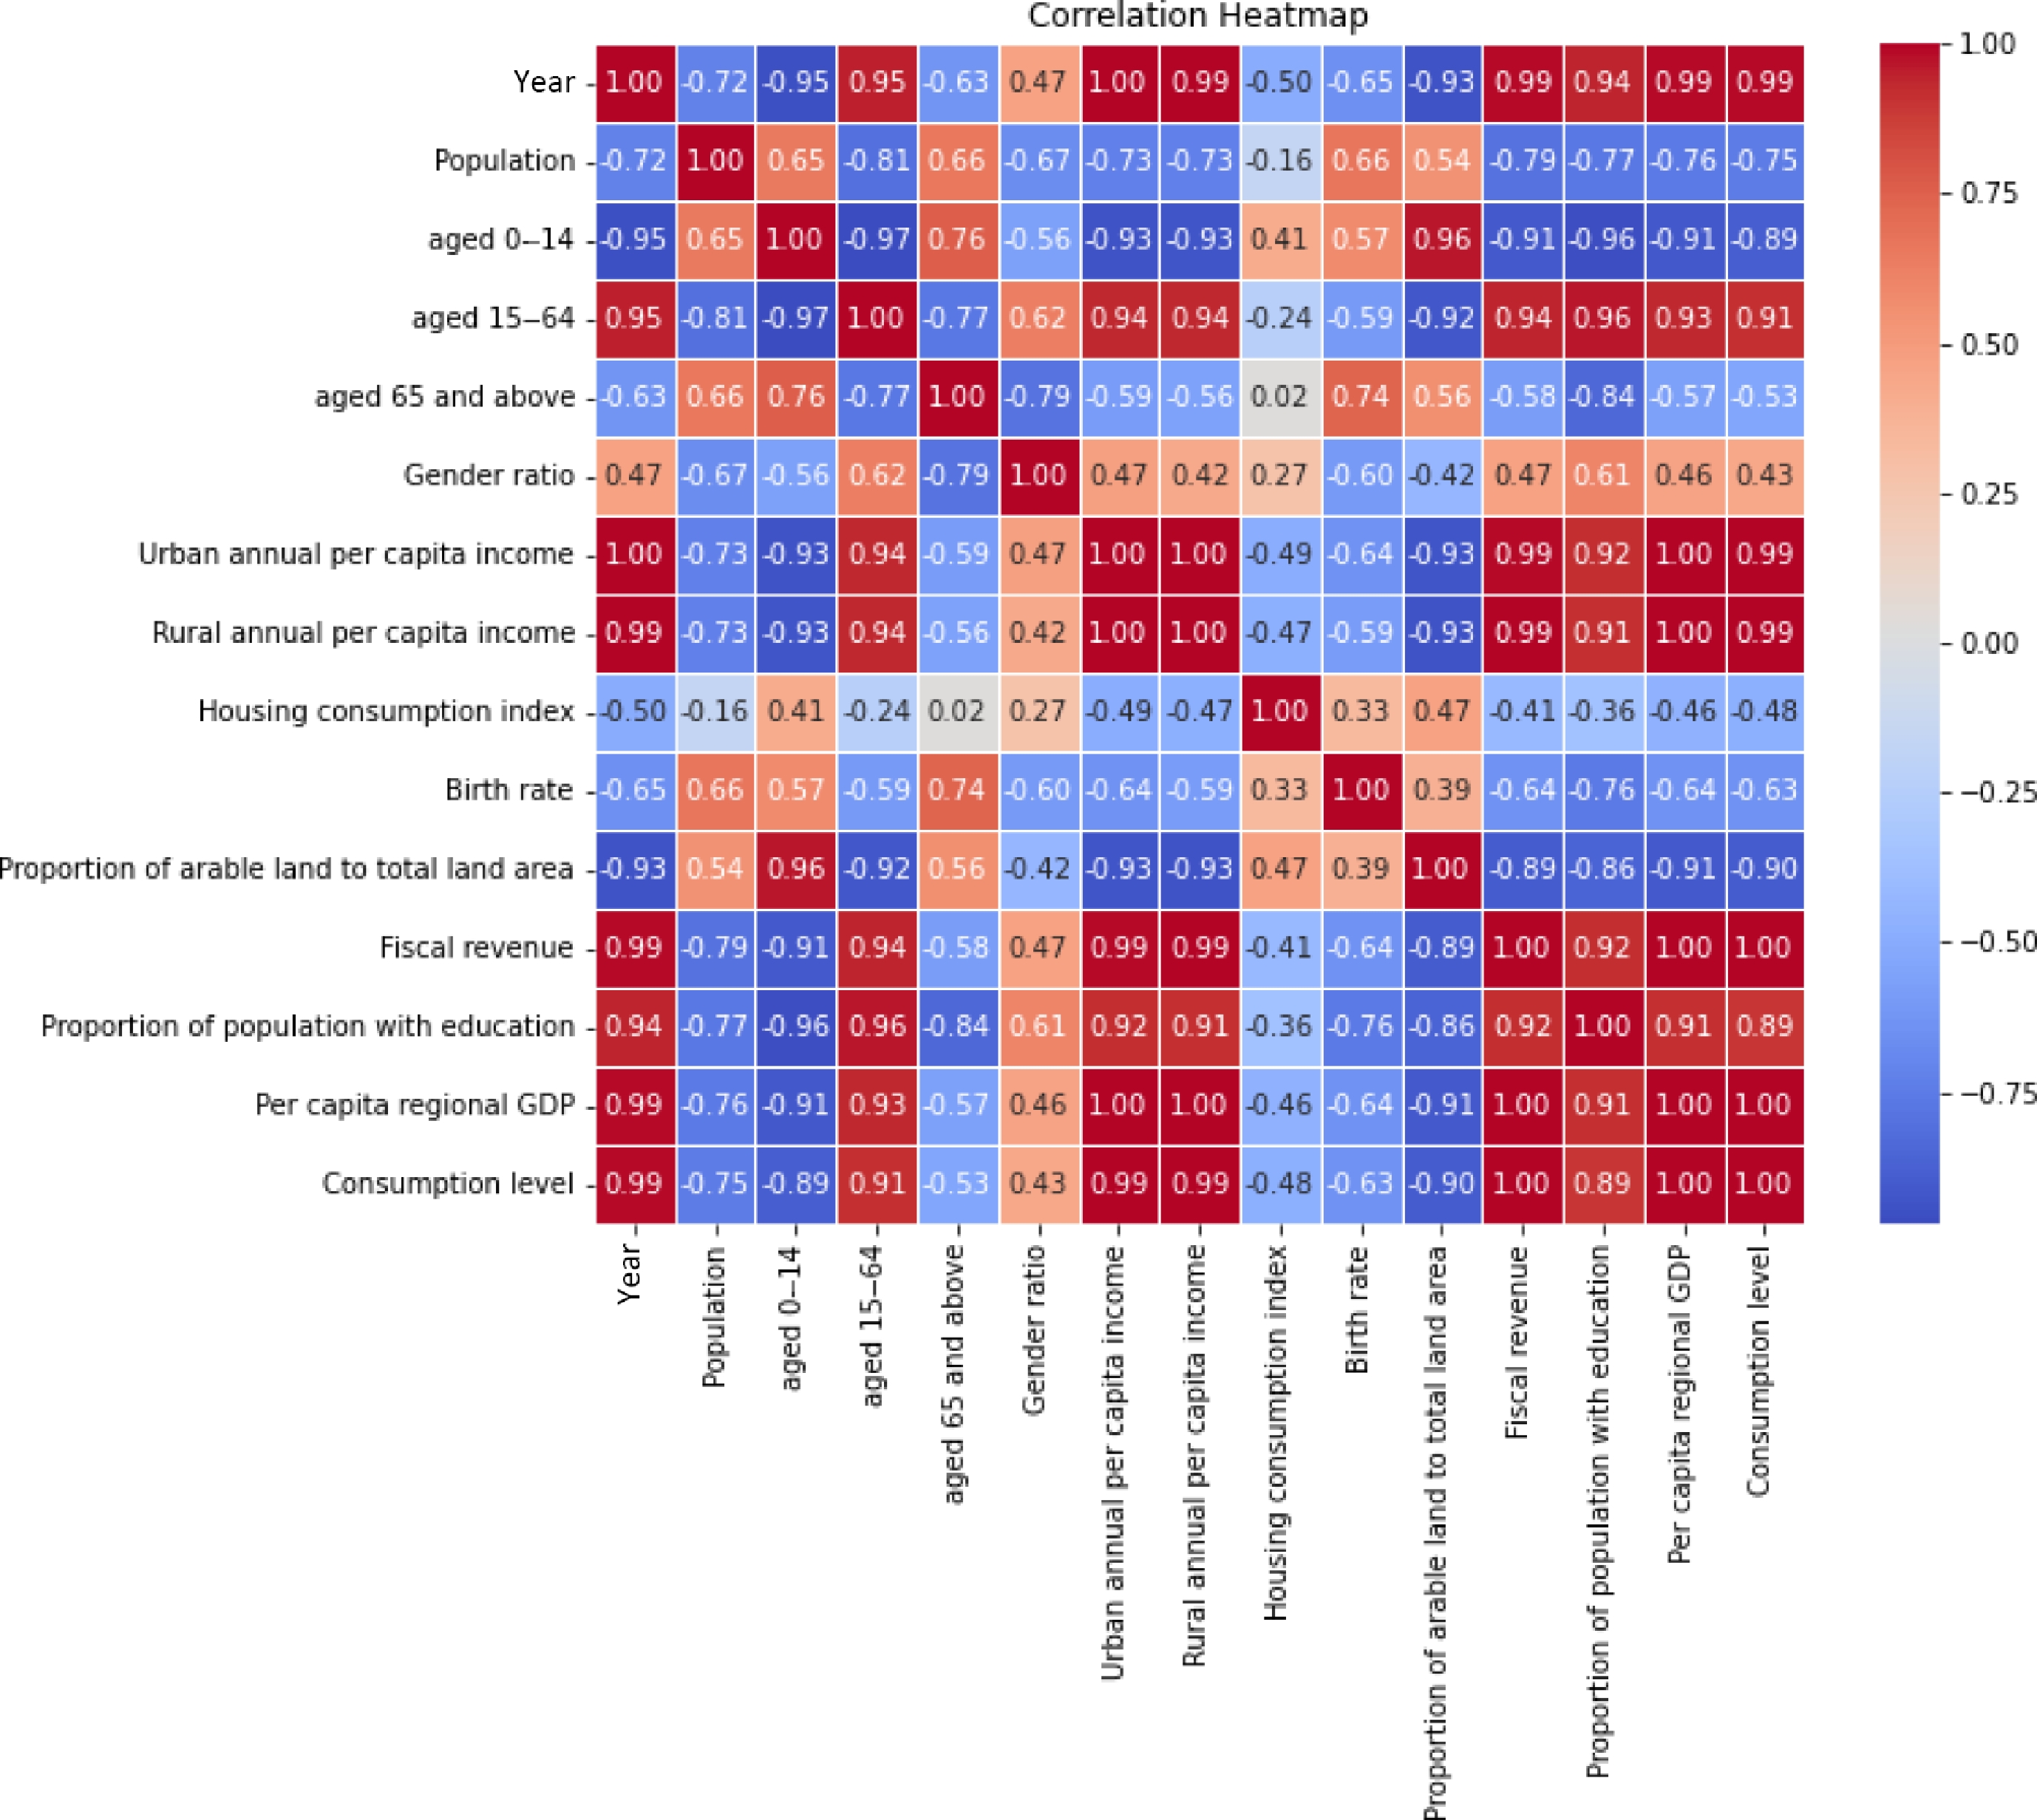
Figure 1.
Heat map of correlations between indicators.
-
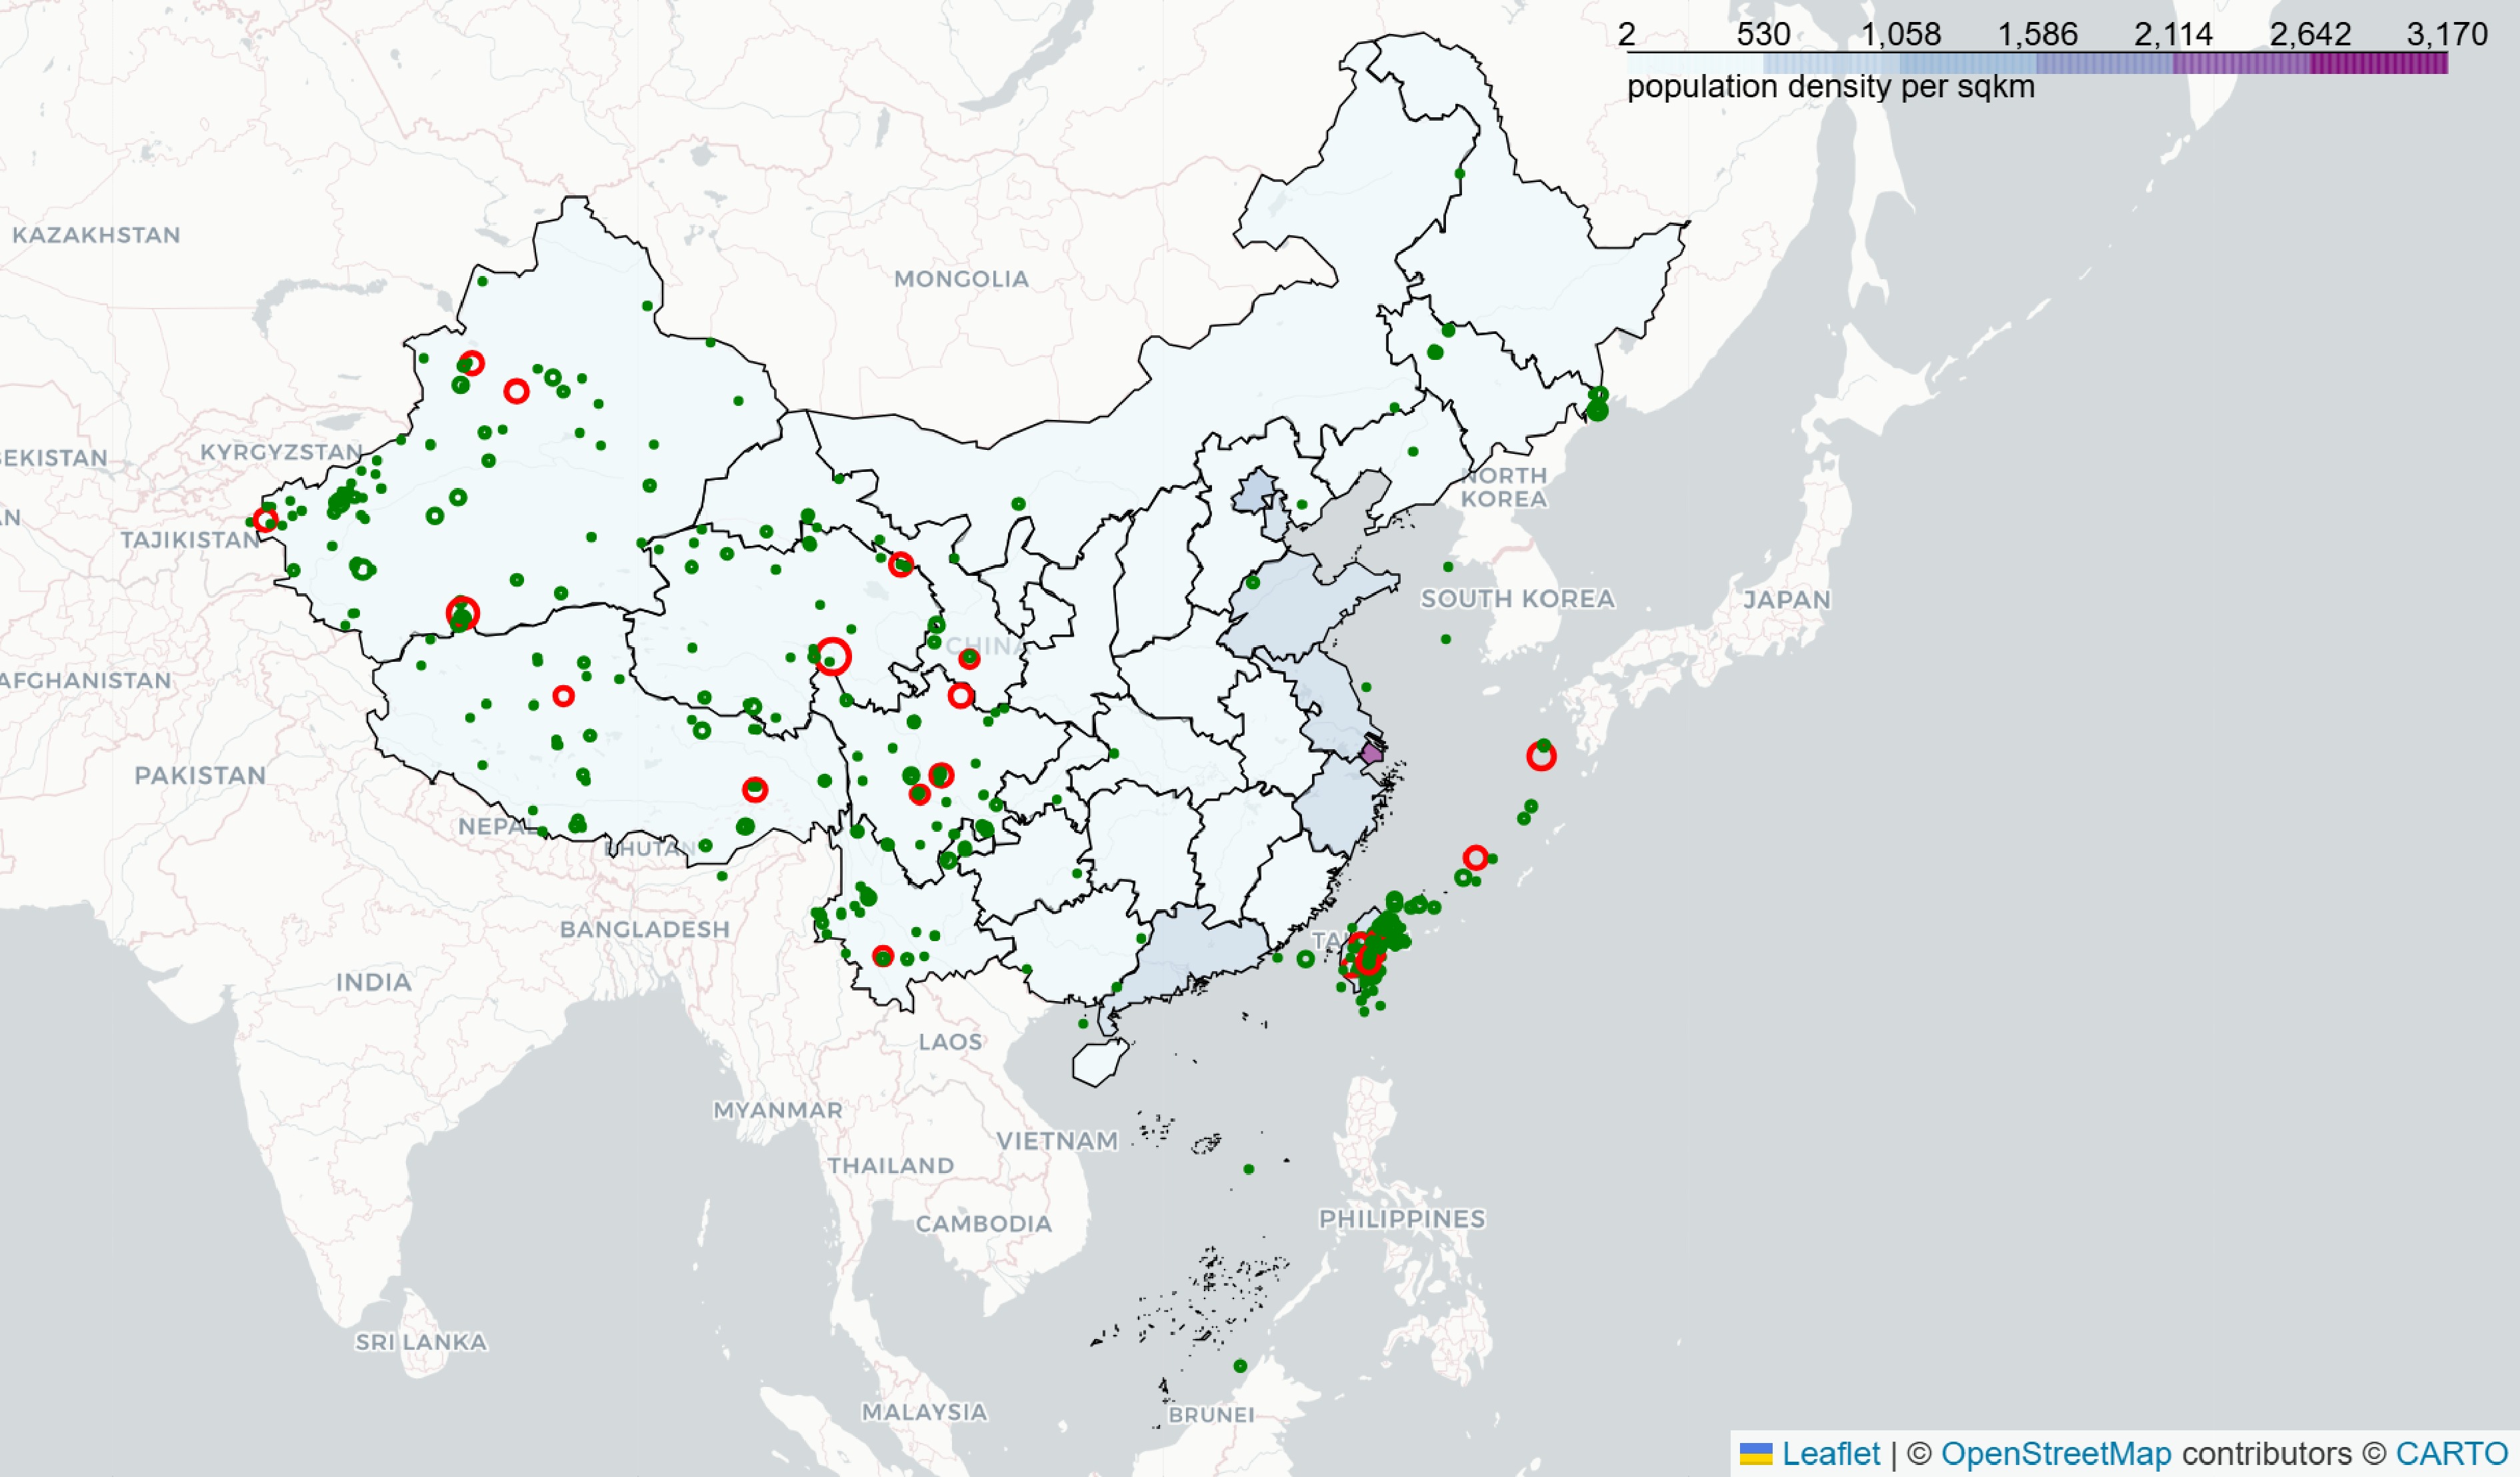
Figure 2.
Visualization of earthquake events from 2011 to 2023.
-
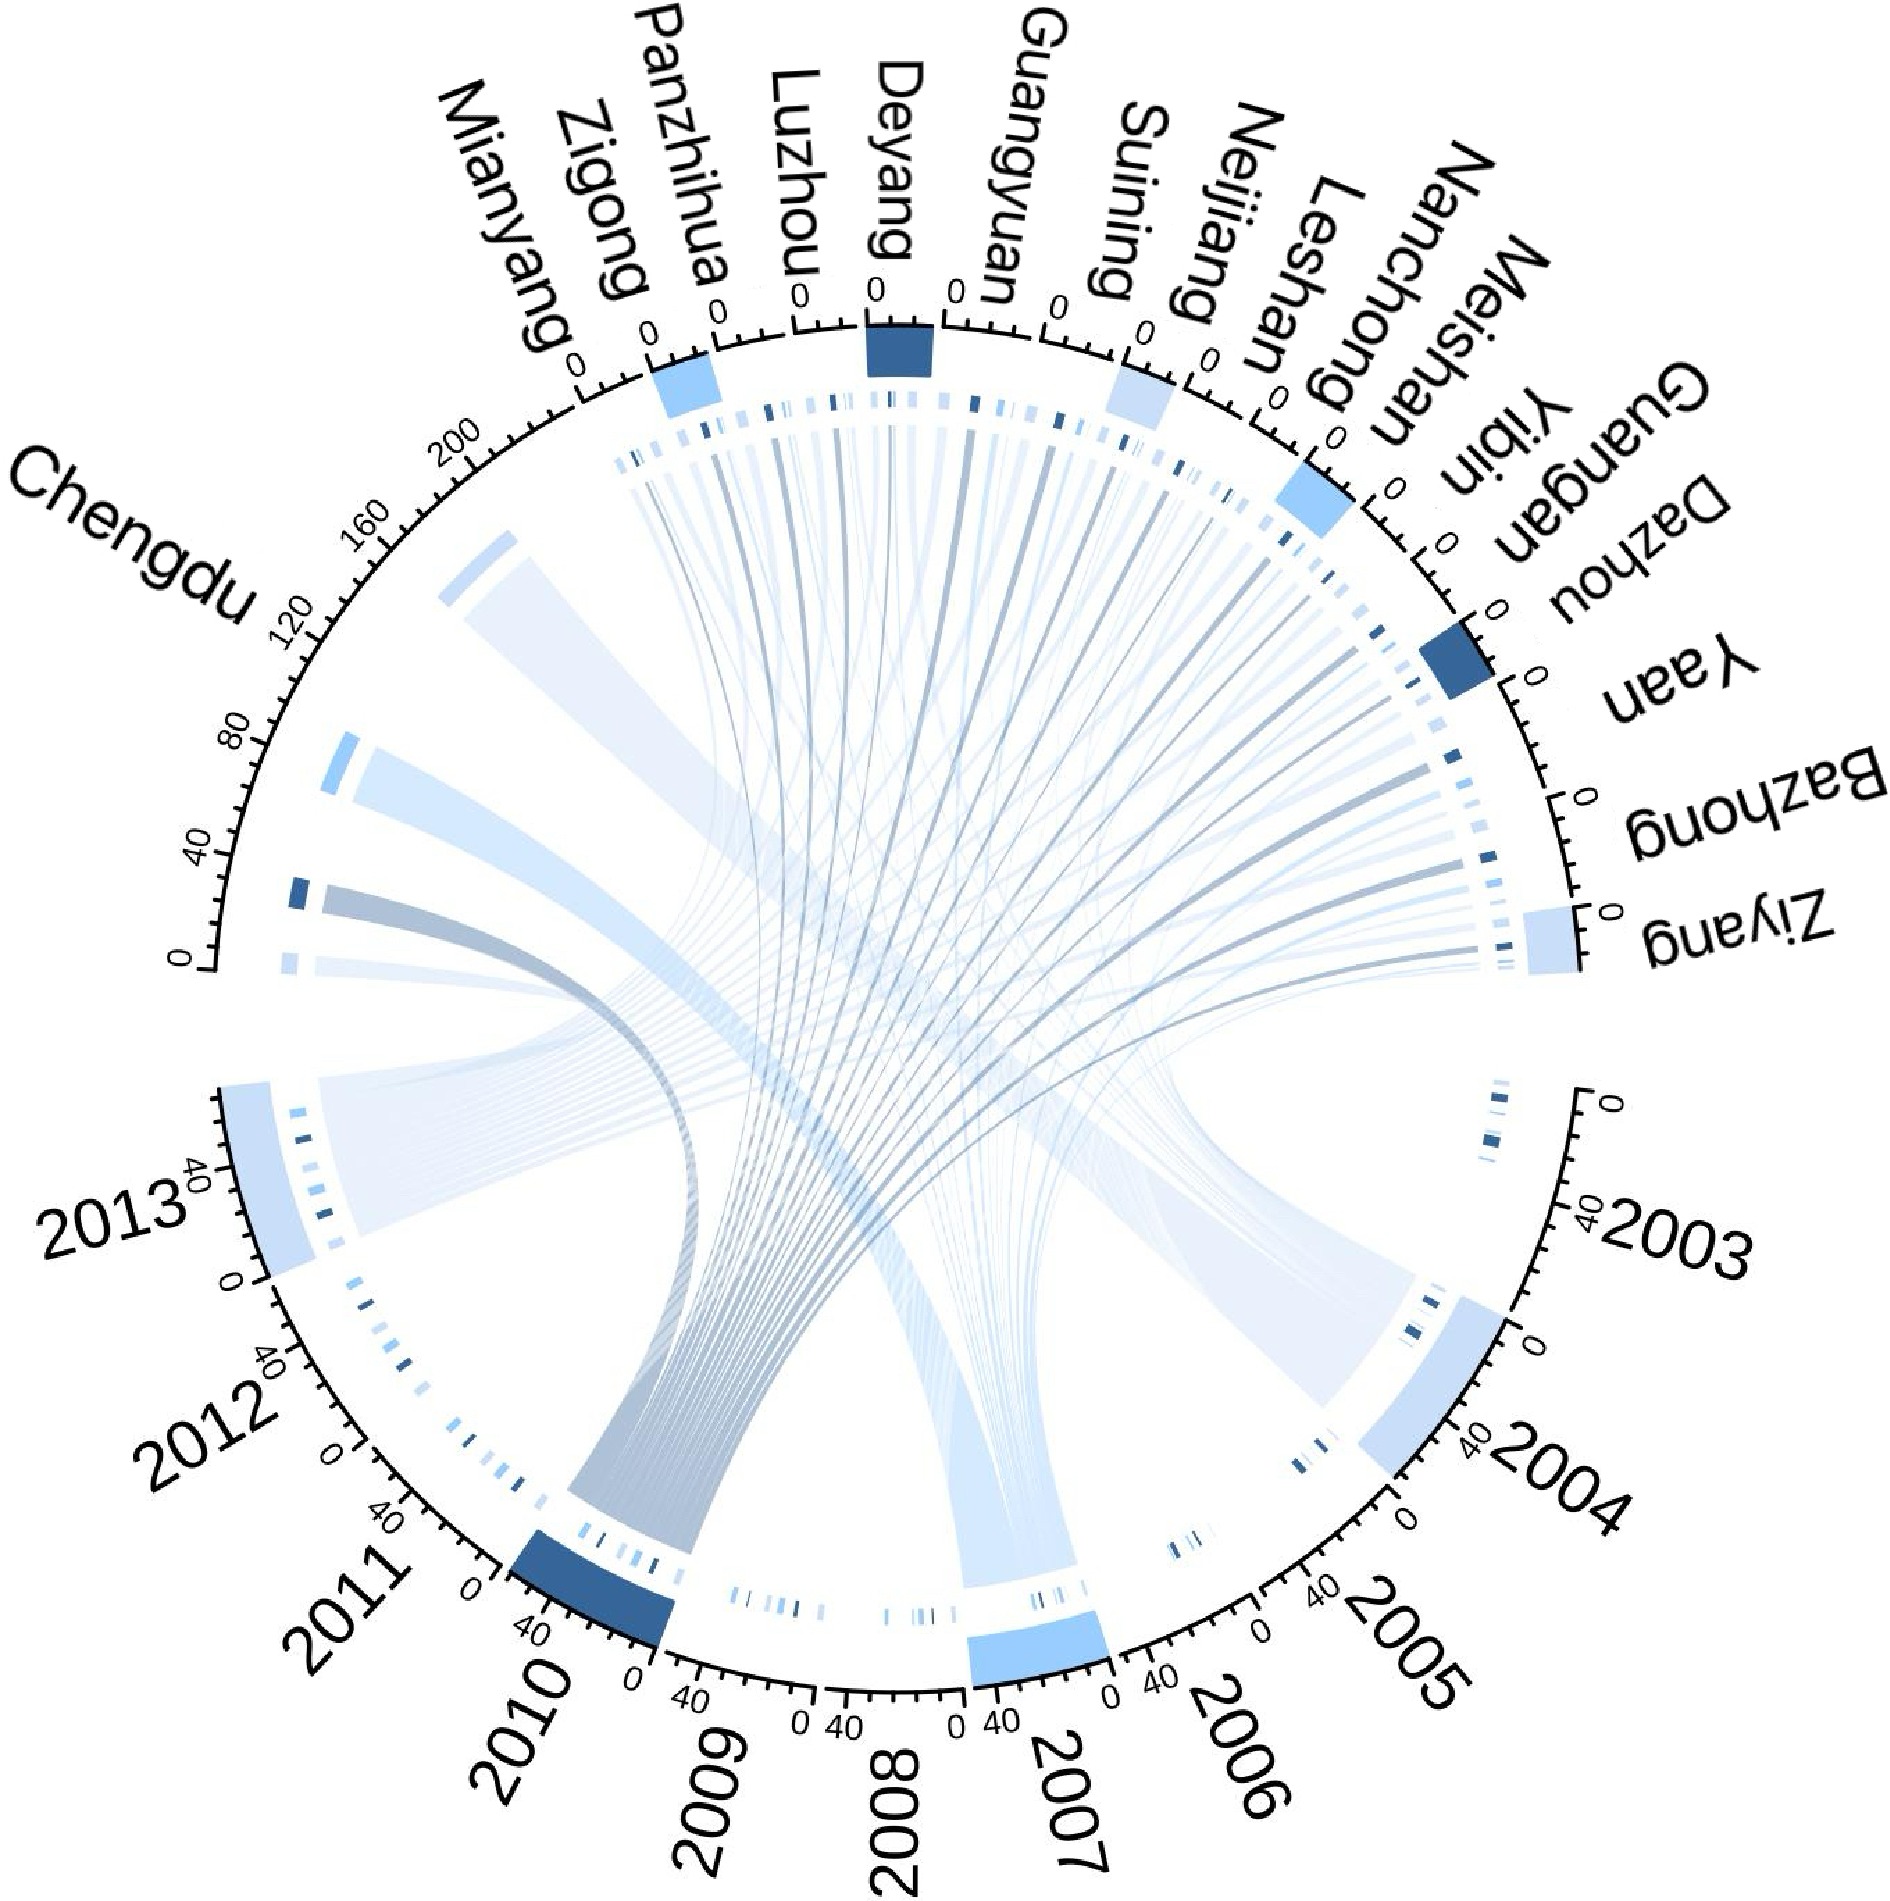
Figure 3.
Changes in SVI of prefecture-level cities in Sichuan Province from 2003 to 2013.
-
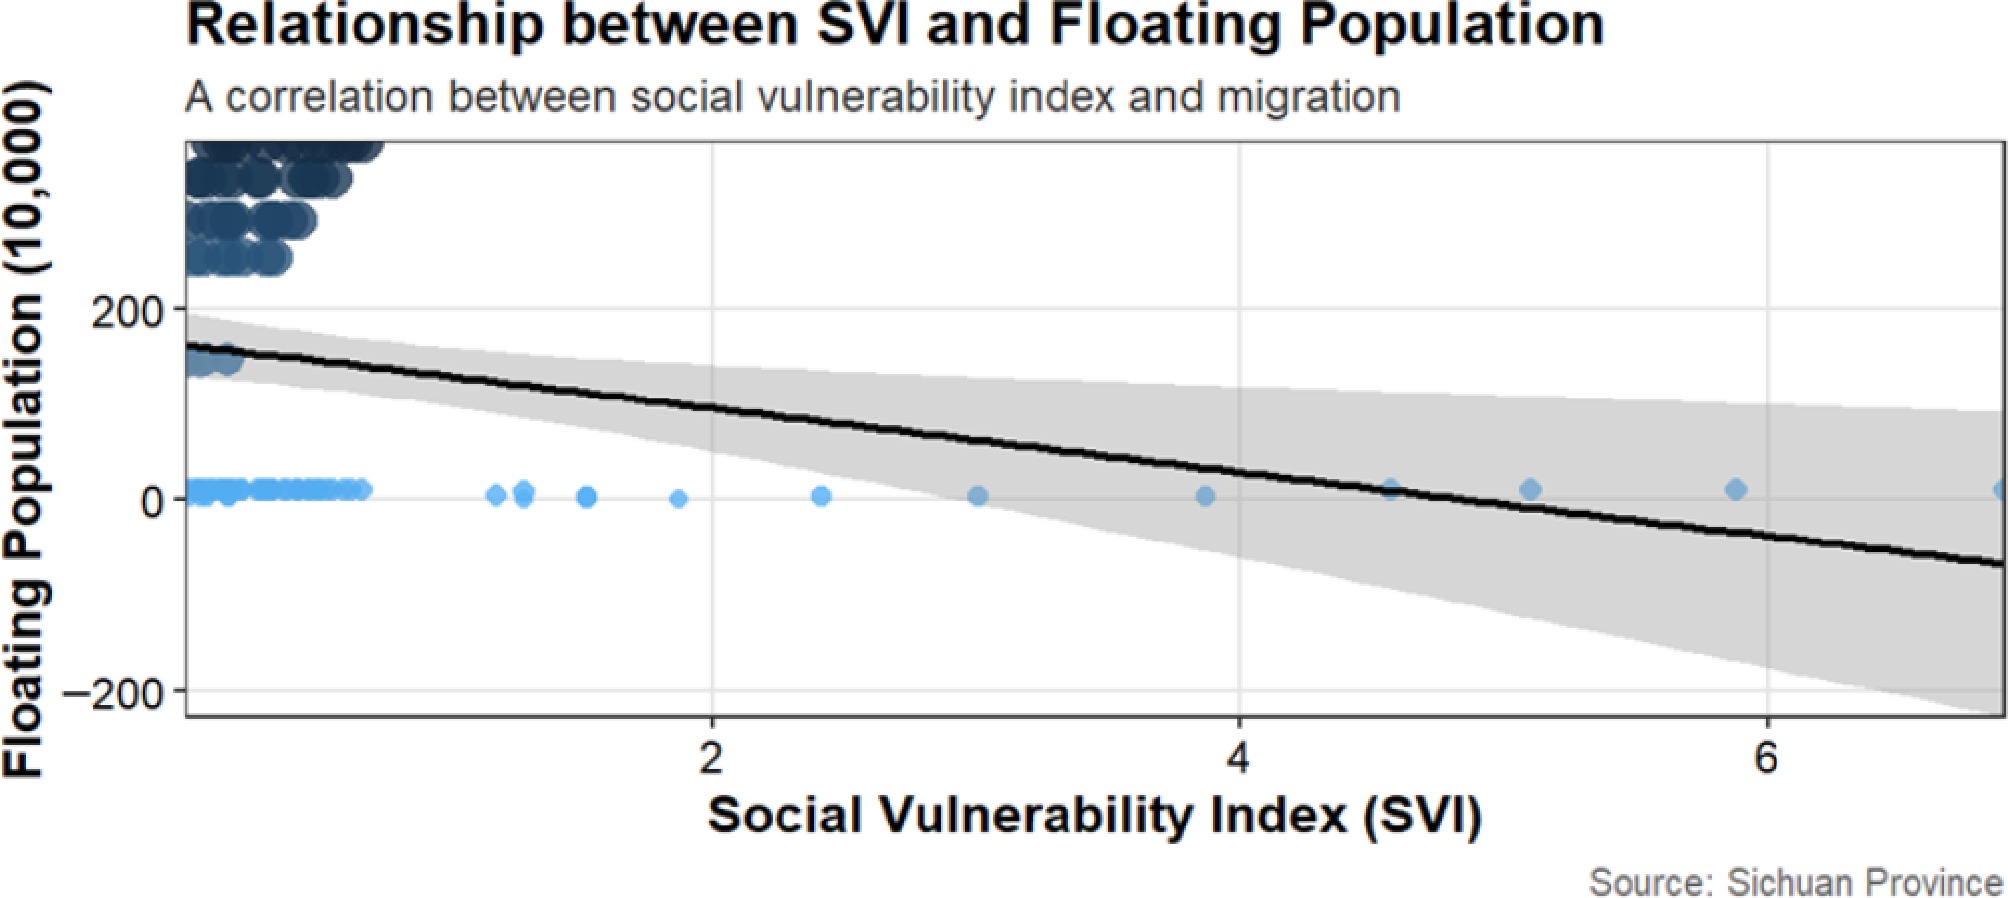
Figure 4.
Relationship between SVI and the floating population.
-
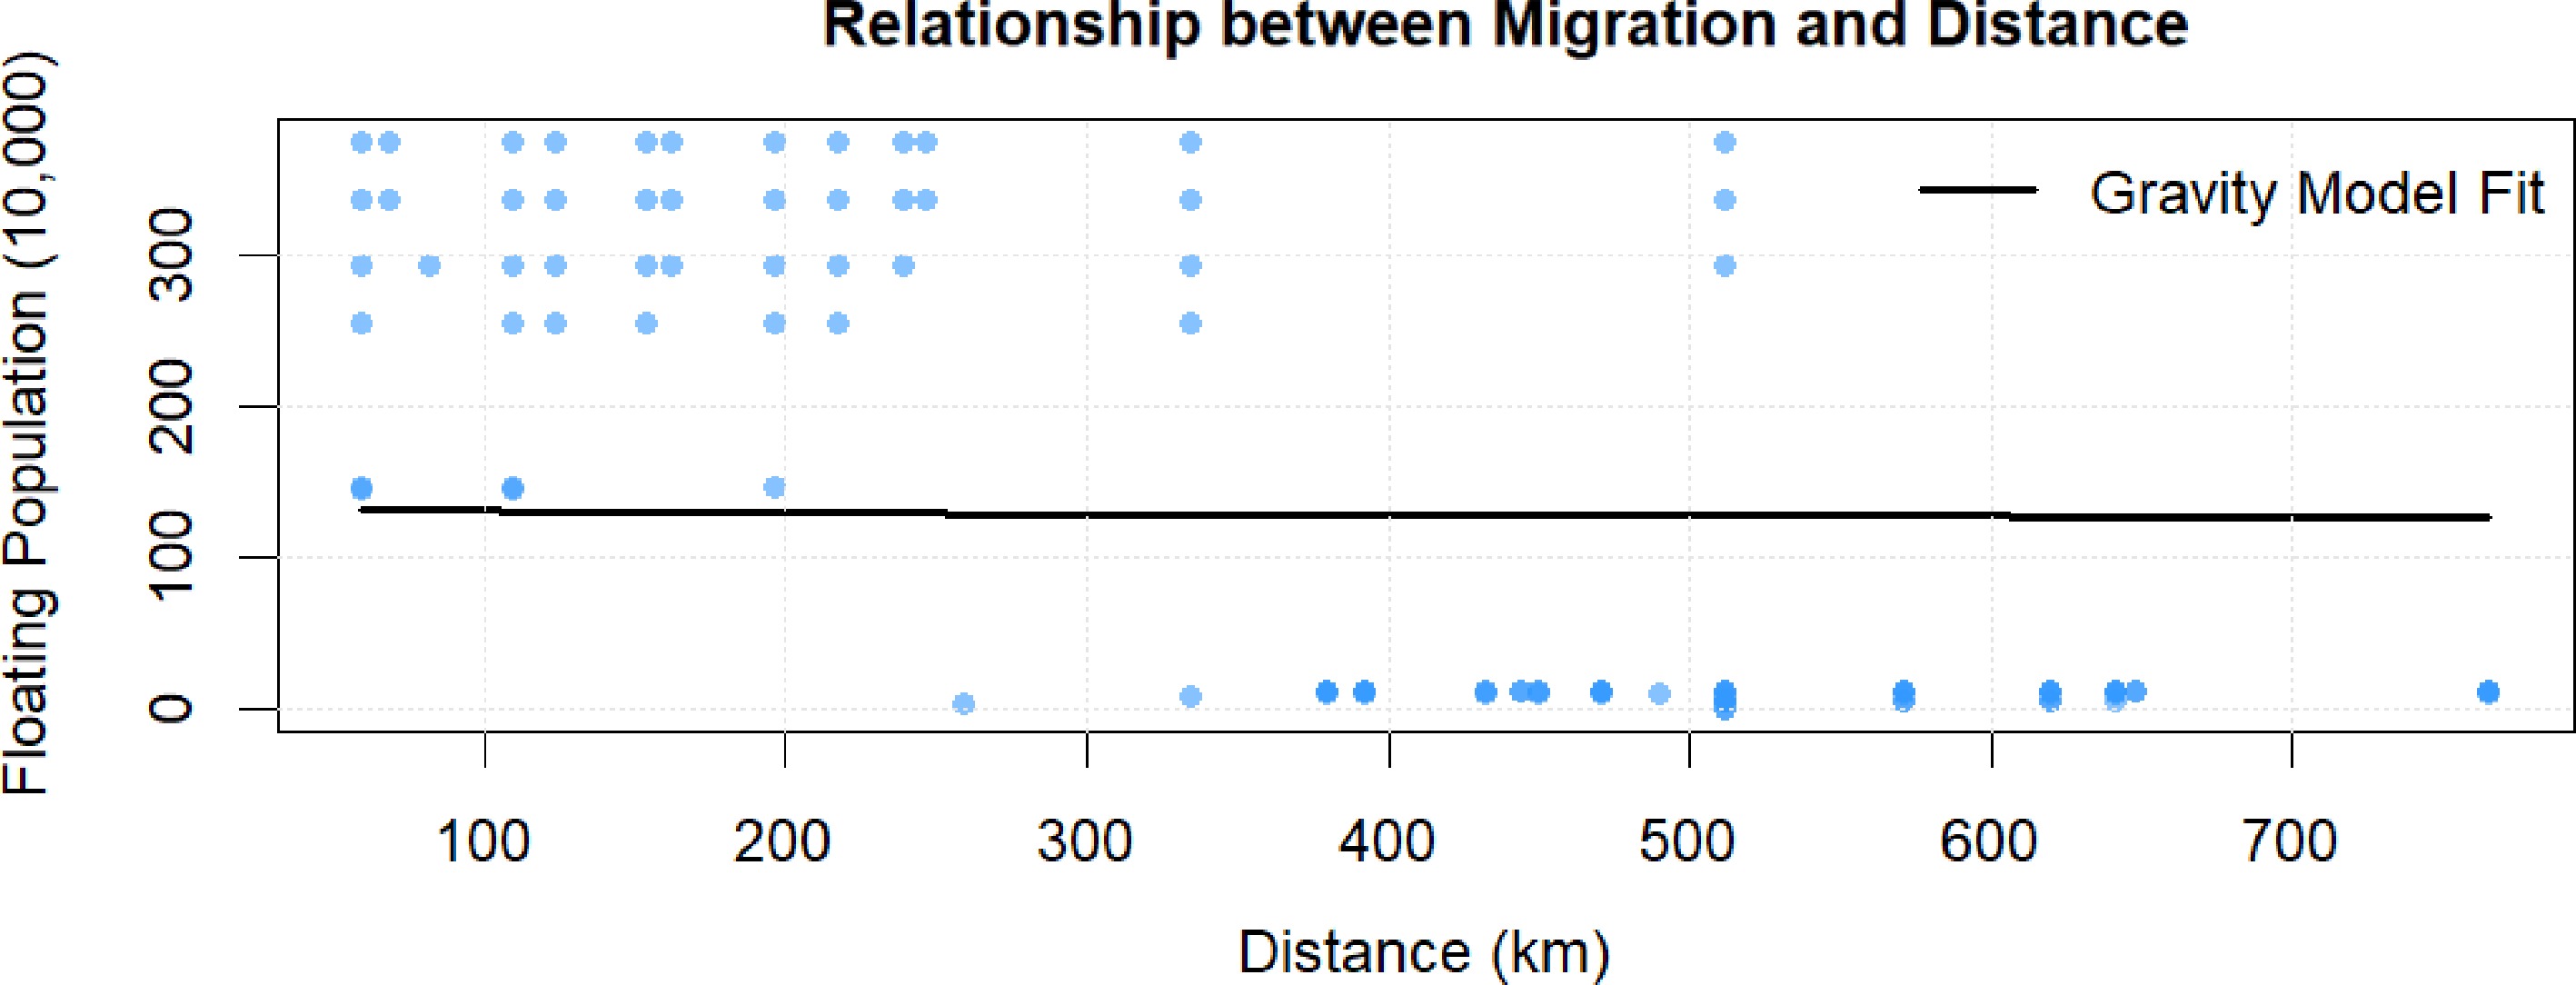
Figure 5.
Relationship between migration and distance.
-
Feature PC1 PC2 Population −0.419 −0.798 Population aged 0−14 −0.826 −0.492 Population aged 15−64 0.762 0.614 Population aged 64 and above −0.331 −0.832 Gender ratio 0.103 0.916 Urban per capita annual income 0.910 0.402 Rural per capita annual income 0.917 0.373 Housing consumption index compared with the
previous year−0.760 0.443 Birth rate −0.451 −0.608 Government fiscal revenue 0.880 0.438 Population education ratio 0.767 0.609 GDP per capita 0.900 0.407 Consumption level 0.907 0.377 Agricultural land as a percentage of total land area −0.887 −0.305 Table 1.
Rotated component matrix.
-
Year PC1 score PC2 score 2005 −12.520 −10.386 2006 −6.203 −1.458 2007 −2.0747 −0.175 2008 2.503 2.436 2009 6.644 1.121 2010 11.650 8.464 Table 2.
Principal component scores for each year.
-
Year SVI score 2005 −10.815 2006 −4.871 2007 −1.588 2008 2.209 2009 5.159 2010 9.905 Table 3.
SVI scores by year.
-
Index Sum of squares
for error (SSE)Sum of squares
for total (SST)Goodness of fit Value 18,056.63 2,472,279 0.9927 Table 4.
Results of model evaluation.
Figures
(5)
Tables
(4)