-
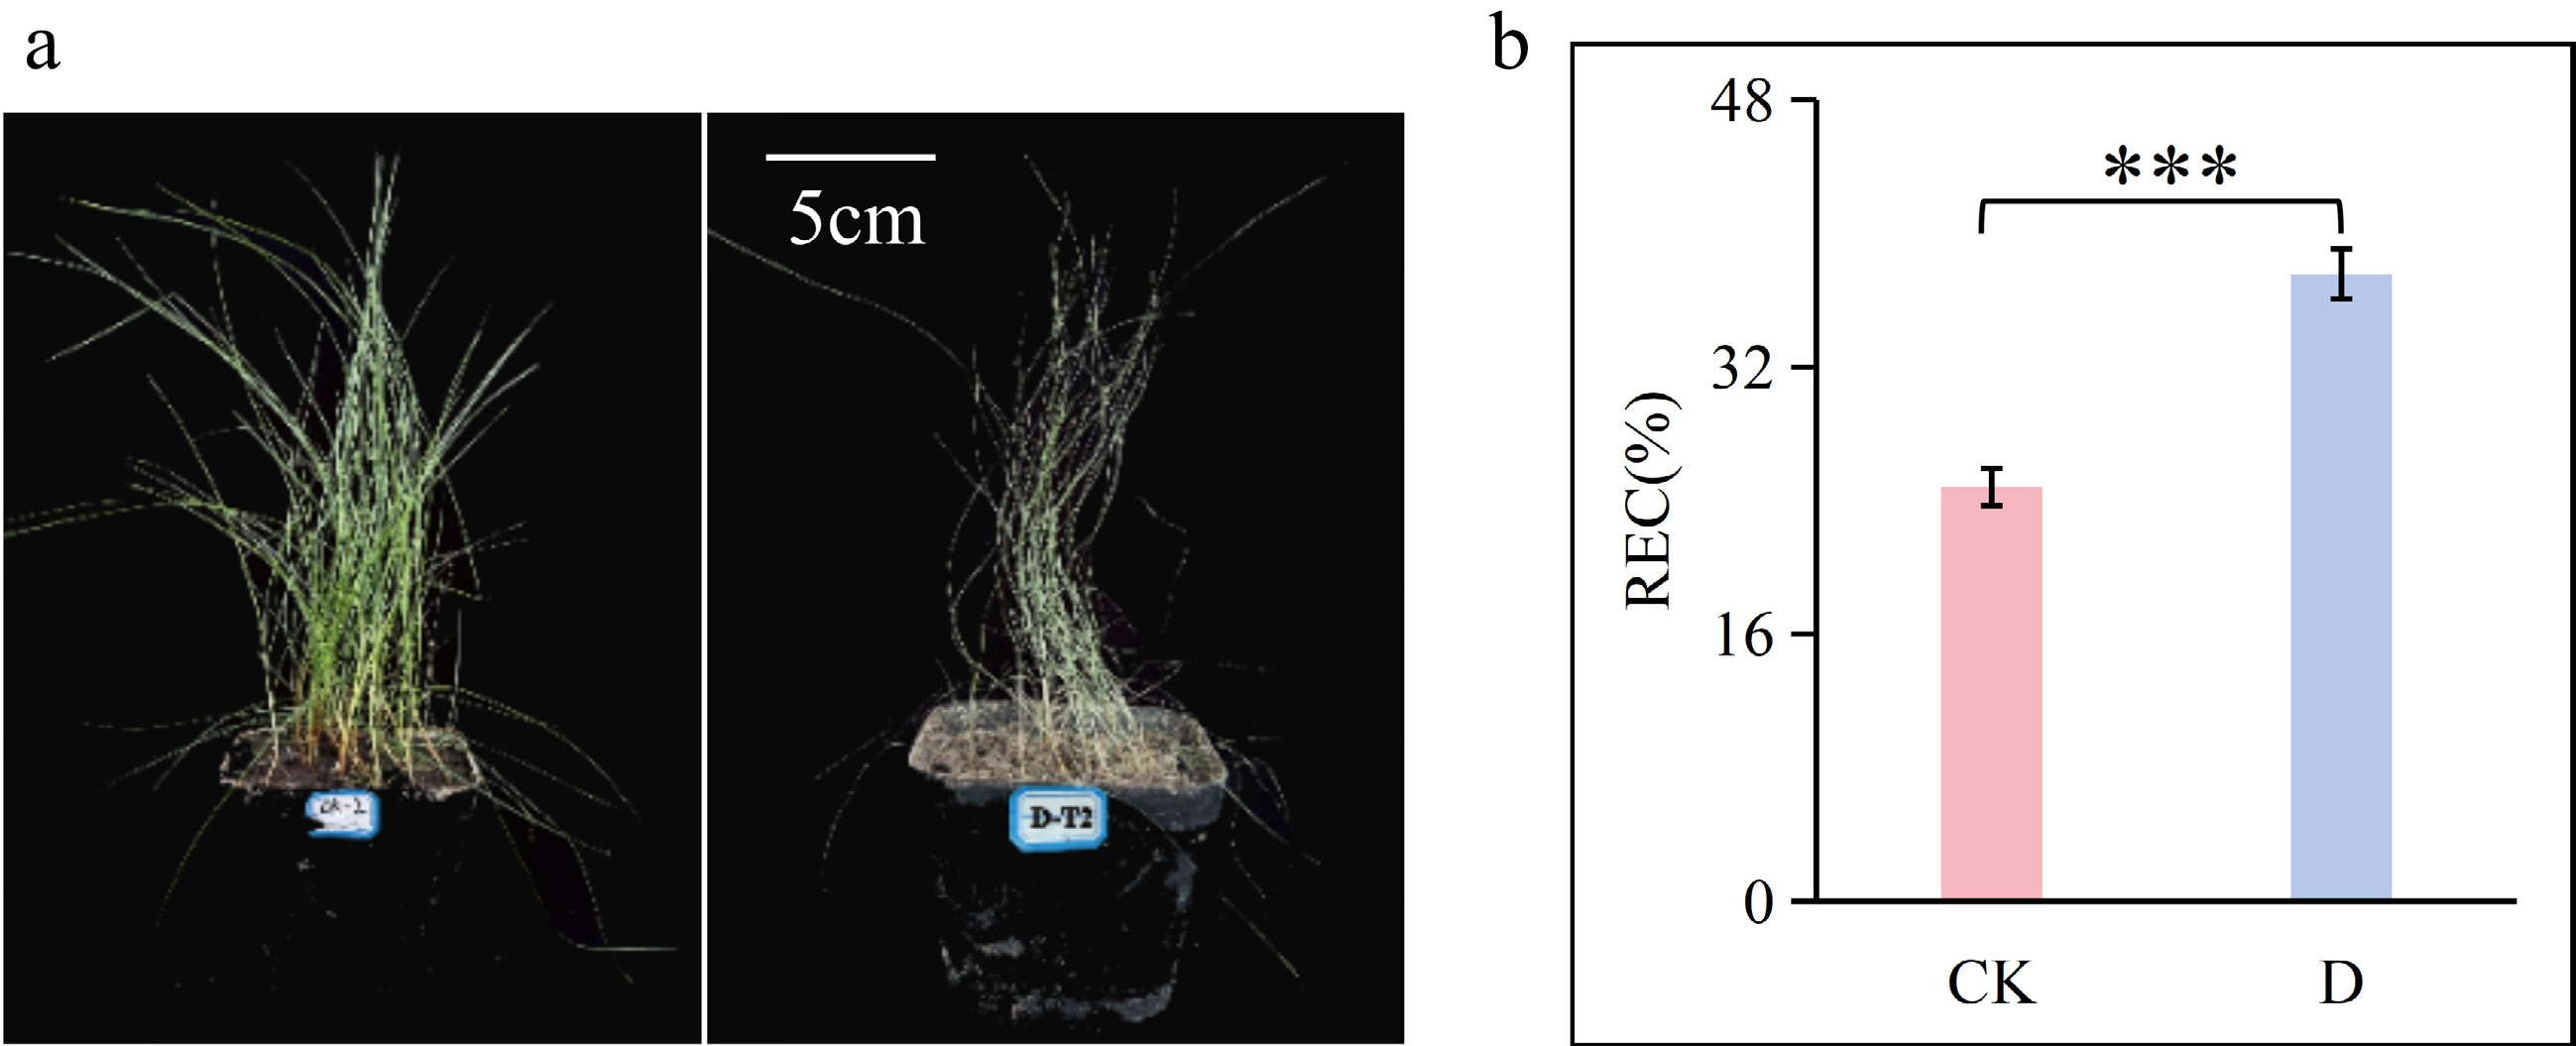
Figure 1.
(a) Morphological changes in F. rubra under control (CK) and drought stress (D). (b) Relative electrical conductivity (REC). Data are presented as mean ± standard deviation (SD). Statistical significance between groups was determined by analysis of variance (ANOVA). *** p < 0.001.
-

Figure 2.
Photosynthetic changes in F. rubra under drought stress (D) compared with the control (CK): (a) Fv/Fm, (b) F0, (c) Fq'/Fm', (d) ETR, (e) NPQ, (f) 1–qP, (g) photosynthetic rate, (h) stomatal conductance, (i) intercellular CO2 concentration (Ci), and (j) transpiration rate. All data are presented as the mean ± SD. Two groups were analyzed by ANOVA. ** 0.001 < p < 0.01; *** p < 0.001.
-
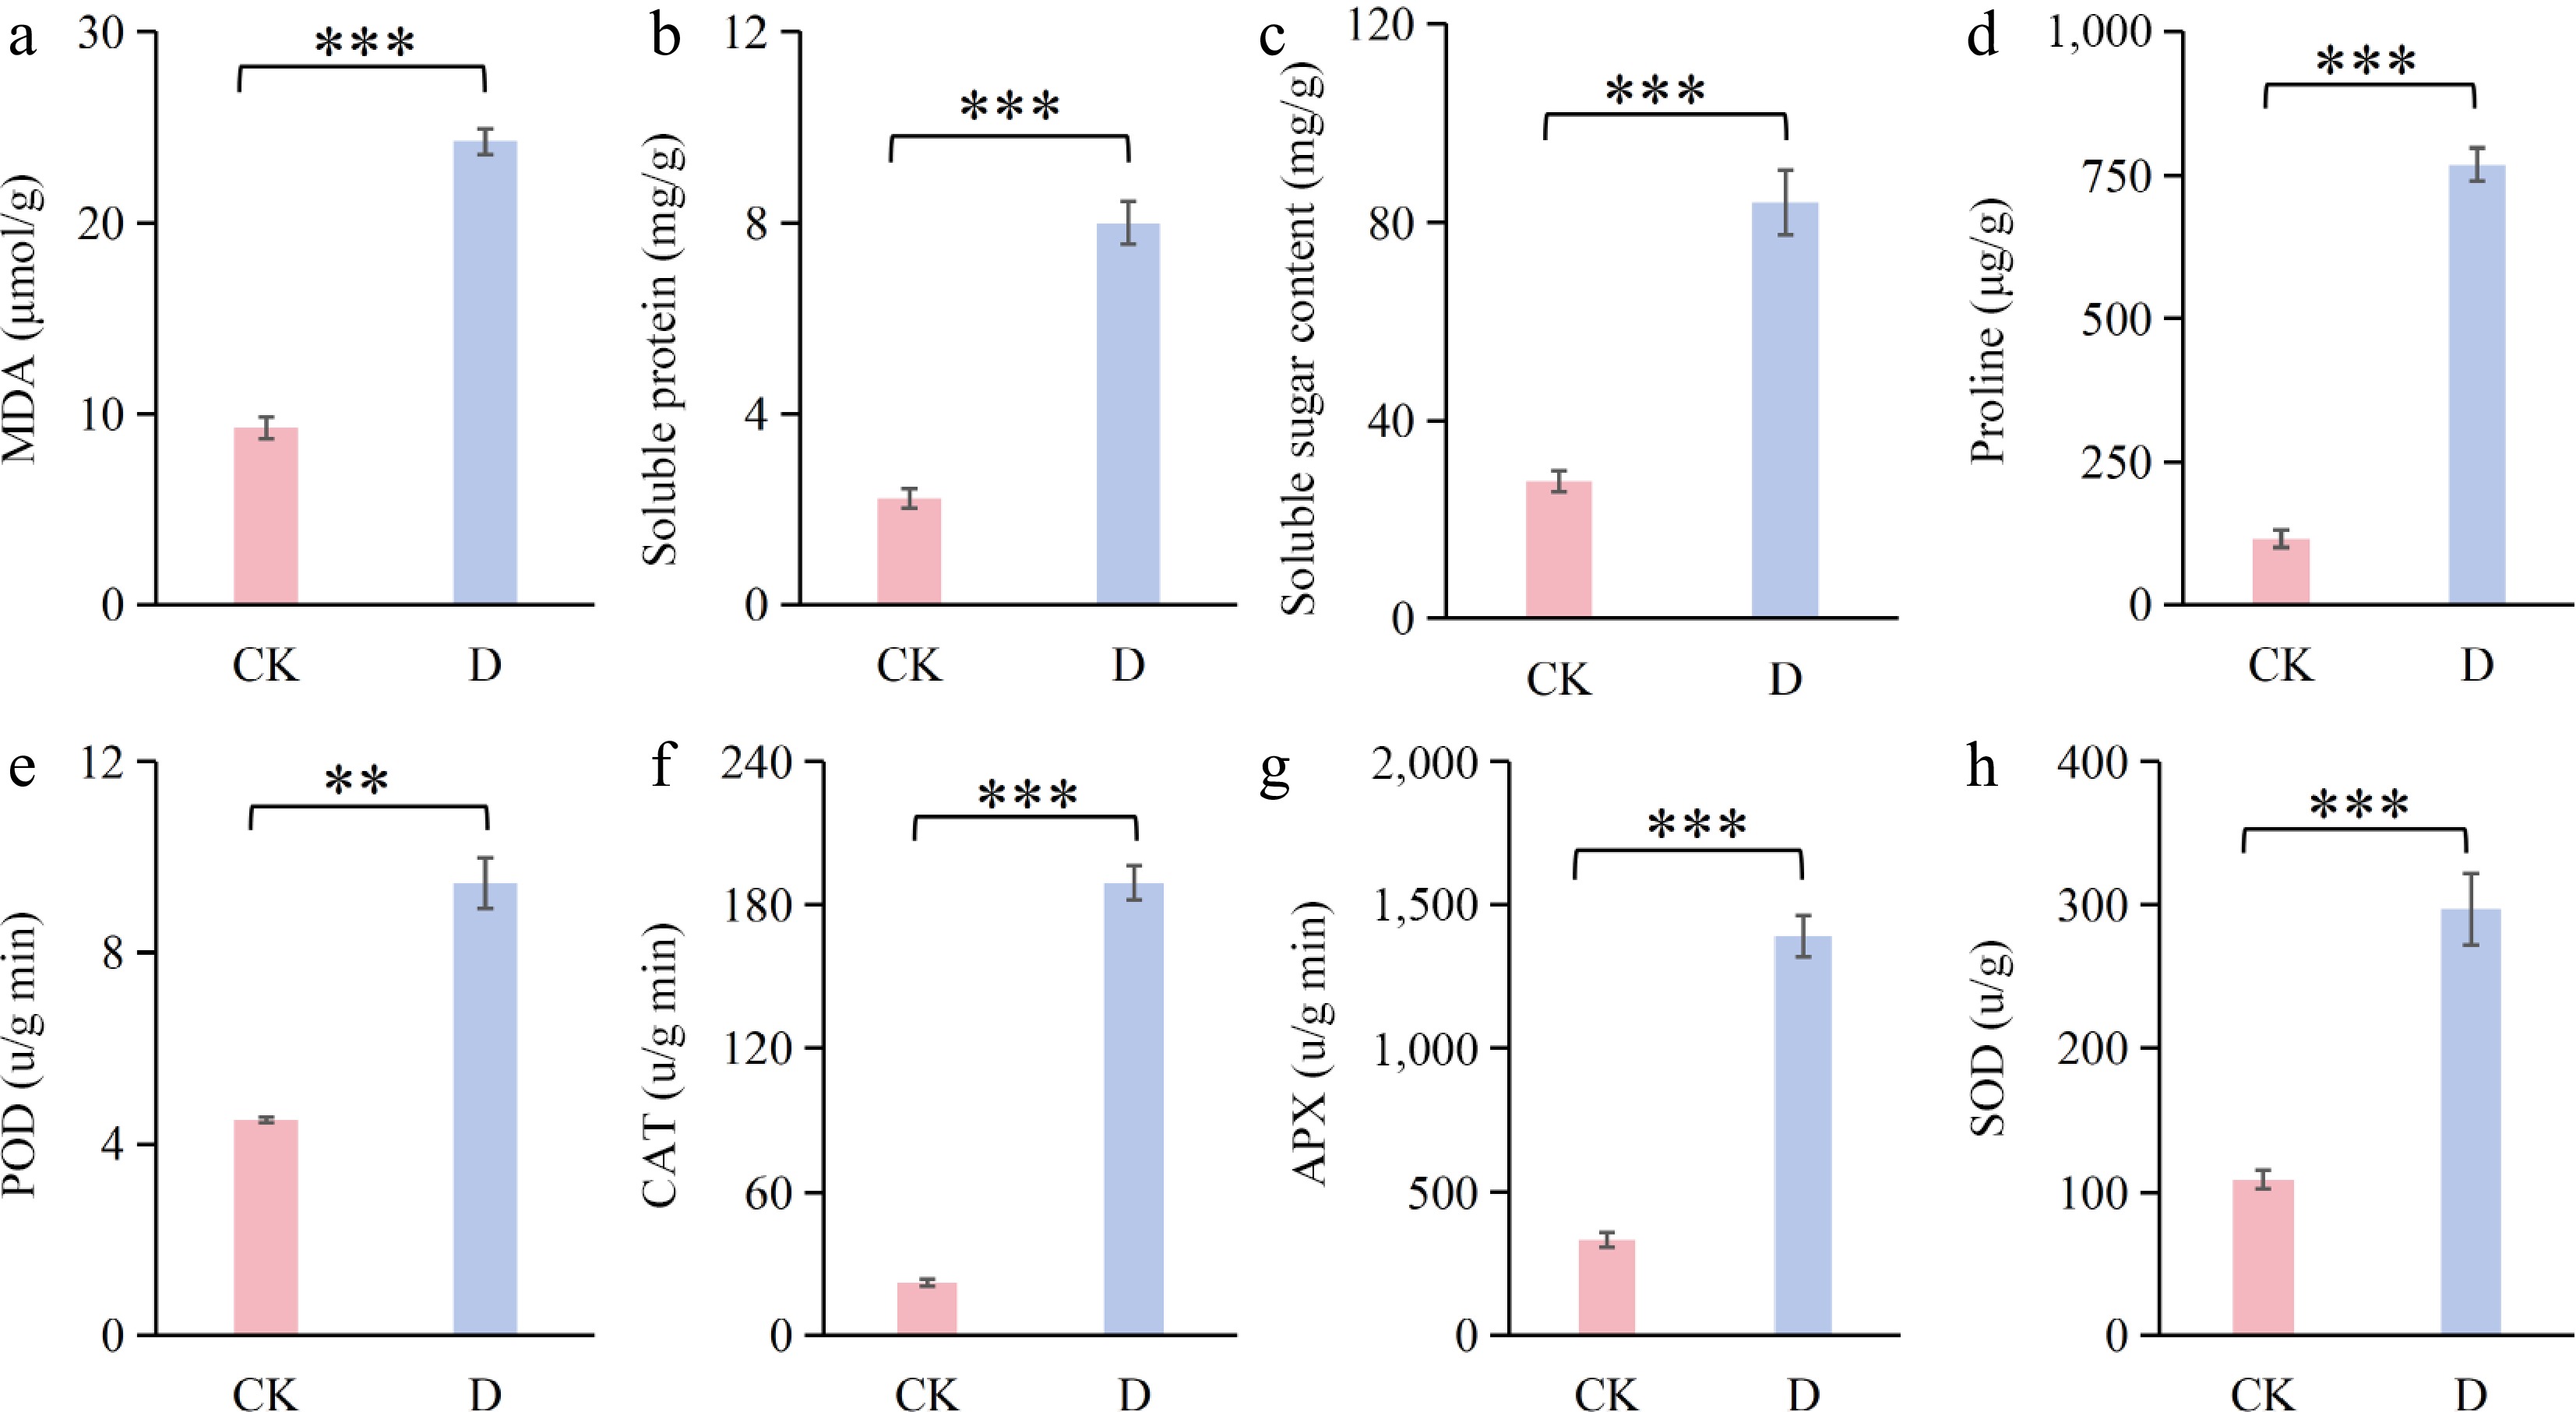
Figure 3.
Osmoregulatory and antioxidant changes in F. rubra under drought stress (D) compared with the control (CK): (a) Malondialdehyde (MDA); (b) soluble protein; (c) peroxidase (POD); (d) catalase (CAT); (e) soluble sugar content; (f) proline; (g) ascorbate peroxidase (APX); and (h) superoxide dismutase (SOD). All data are presented as the mean ± SD. Differences between the two groups were analyzed by ANOVA. ** 0.001 < p < 0.01; *** p < 0.001.
-
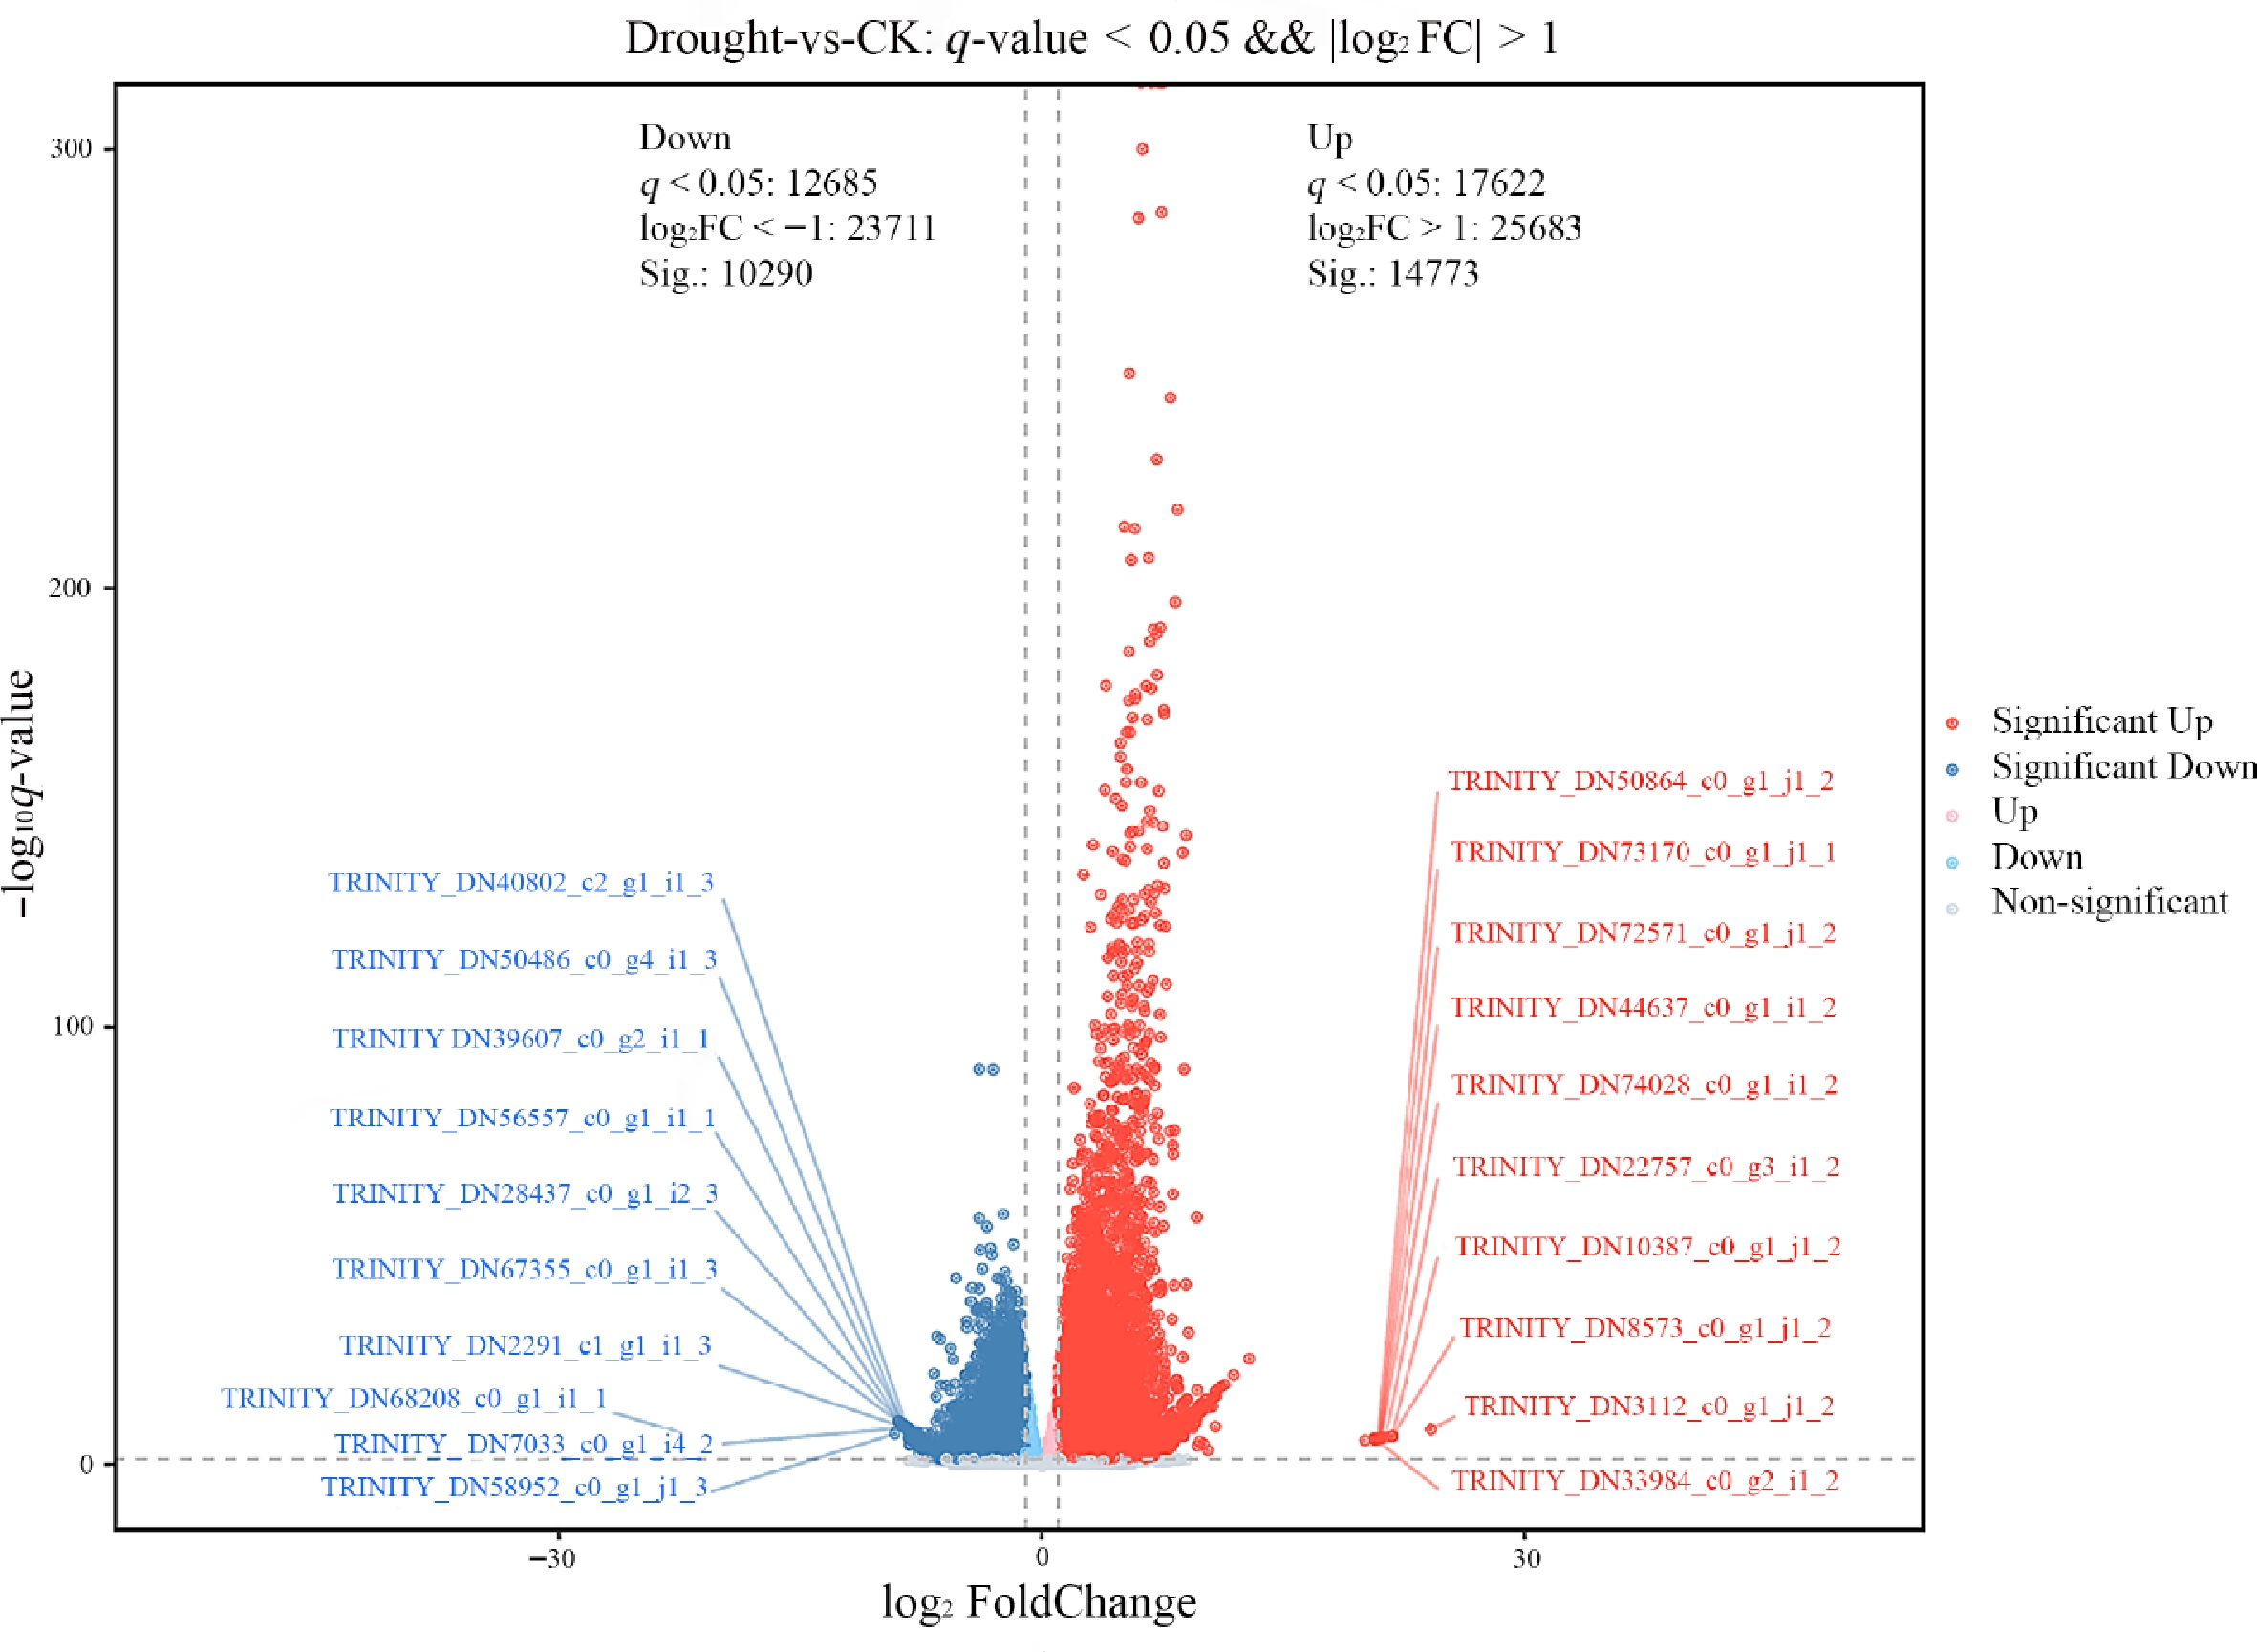
Figure 4.
Volcano plot of DEGs in F. rubra under drought stress vs. the control group. Gray indicates non-DEGs, red indicates significantly upregulated DEGs, and blue indicates significantly downregulated DEGs.
-
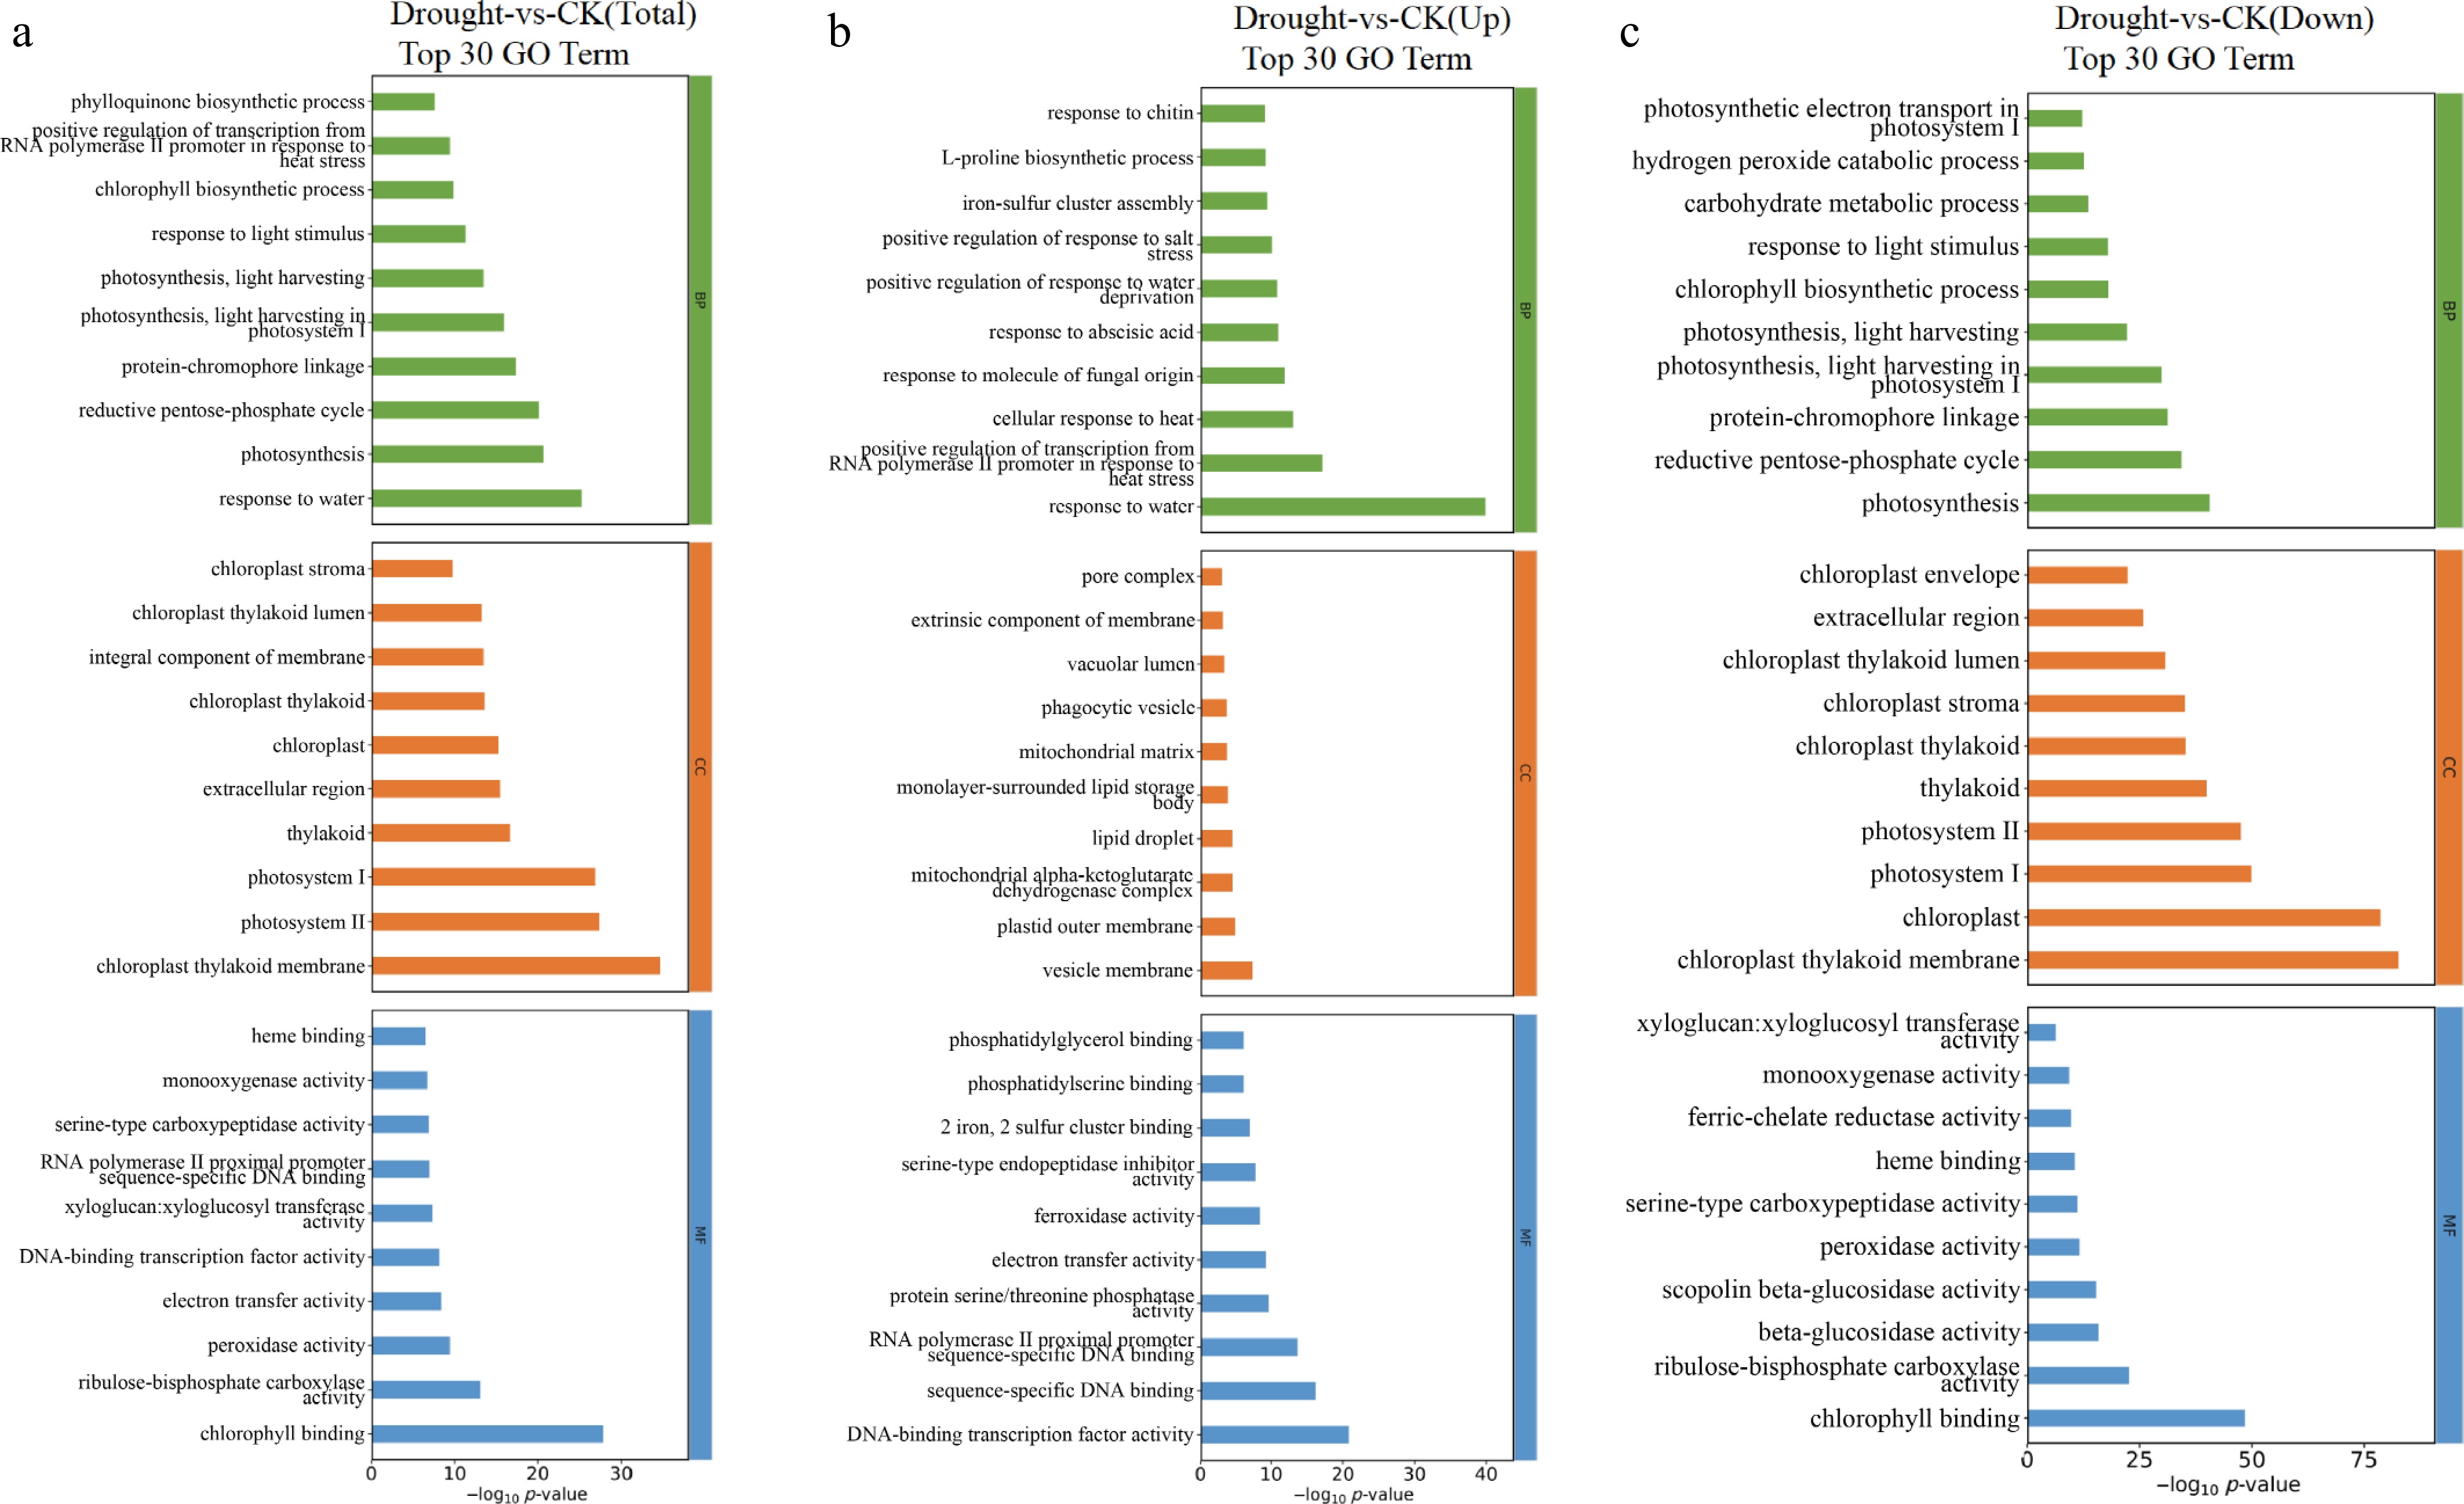
Figure 5.
Top 30 bar charts of GO functional enrichment analysis of DEGs in F. rubra under drought stress compared with the control: (a) Total, (b) upregulated, and (c) downregulated. Screened GO terms with PopHits ≥ 5 in the biological process (BP), cellular component (CC), and molecular function (MF) categories, sorted by –log10 p-value.
-

Figure 6.
Differentially expressed transcription factors of F. rubra in response to drought stress. Dark blue indicates all unigenes, yellow indicates differentially expressed unigenes, light blue indicates downregulated unigenes, and pink indicates upregulated unigenes.
-
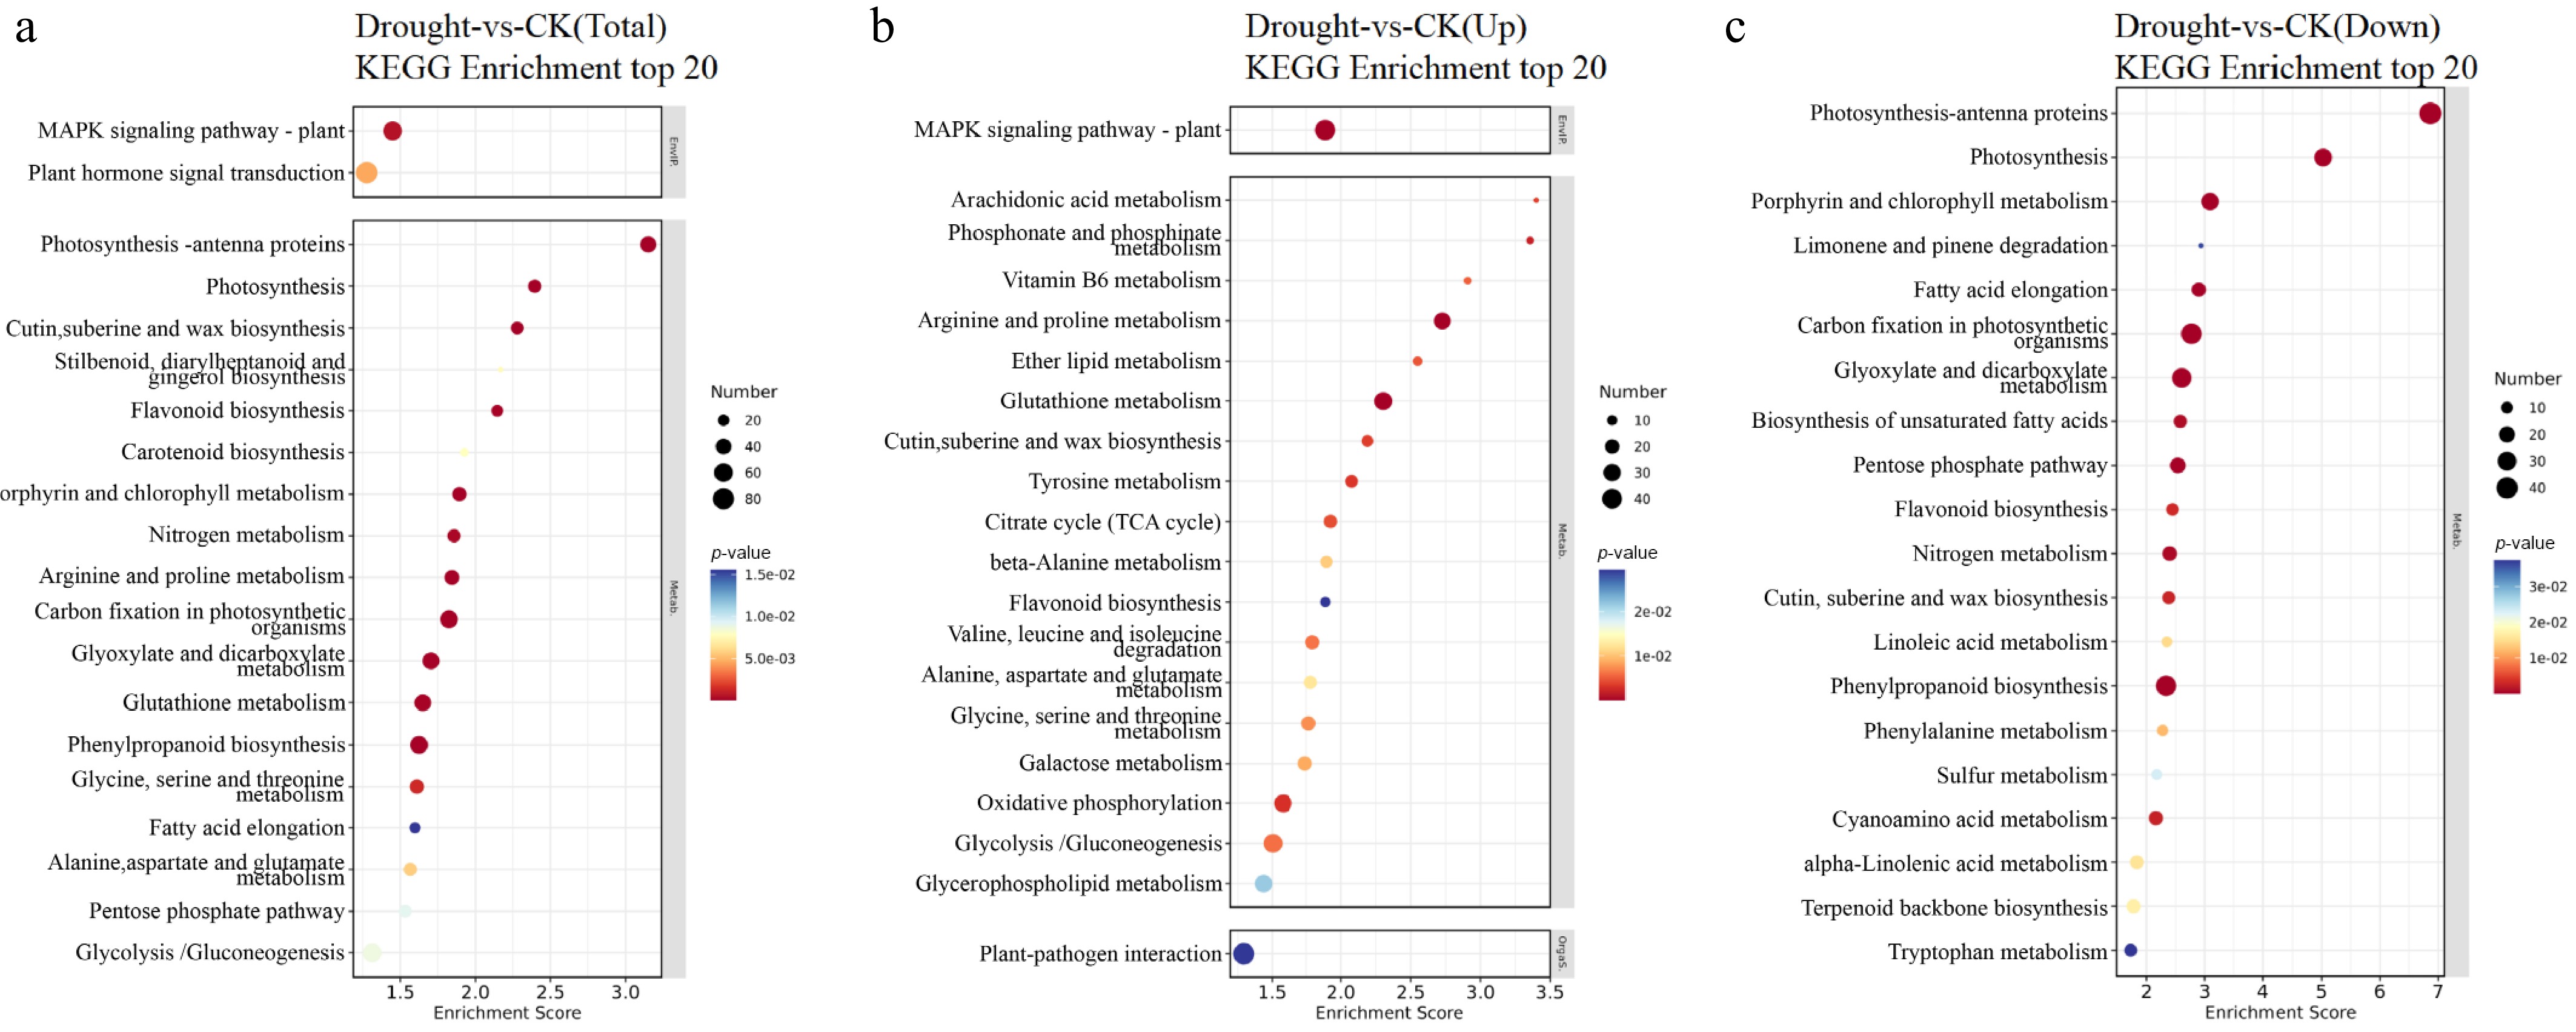
Figure 7.
Top 20 KEGG enrichment bubble charts of DEGs in F. rubra under drought stress: (a) Total, (b) upregulated, and (c) downregulated DEGs. Pathways with PopHits ≥ 5 are screened and sorted by –log10p-value. The x-axis shows the enrichment score. Larger bubbles indicate more DEGs, and bubble colors range from blue through white and yellow to red, with redder colors indicating smaller p-values and greater significance.
-
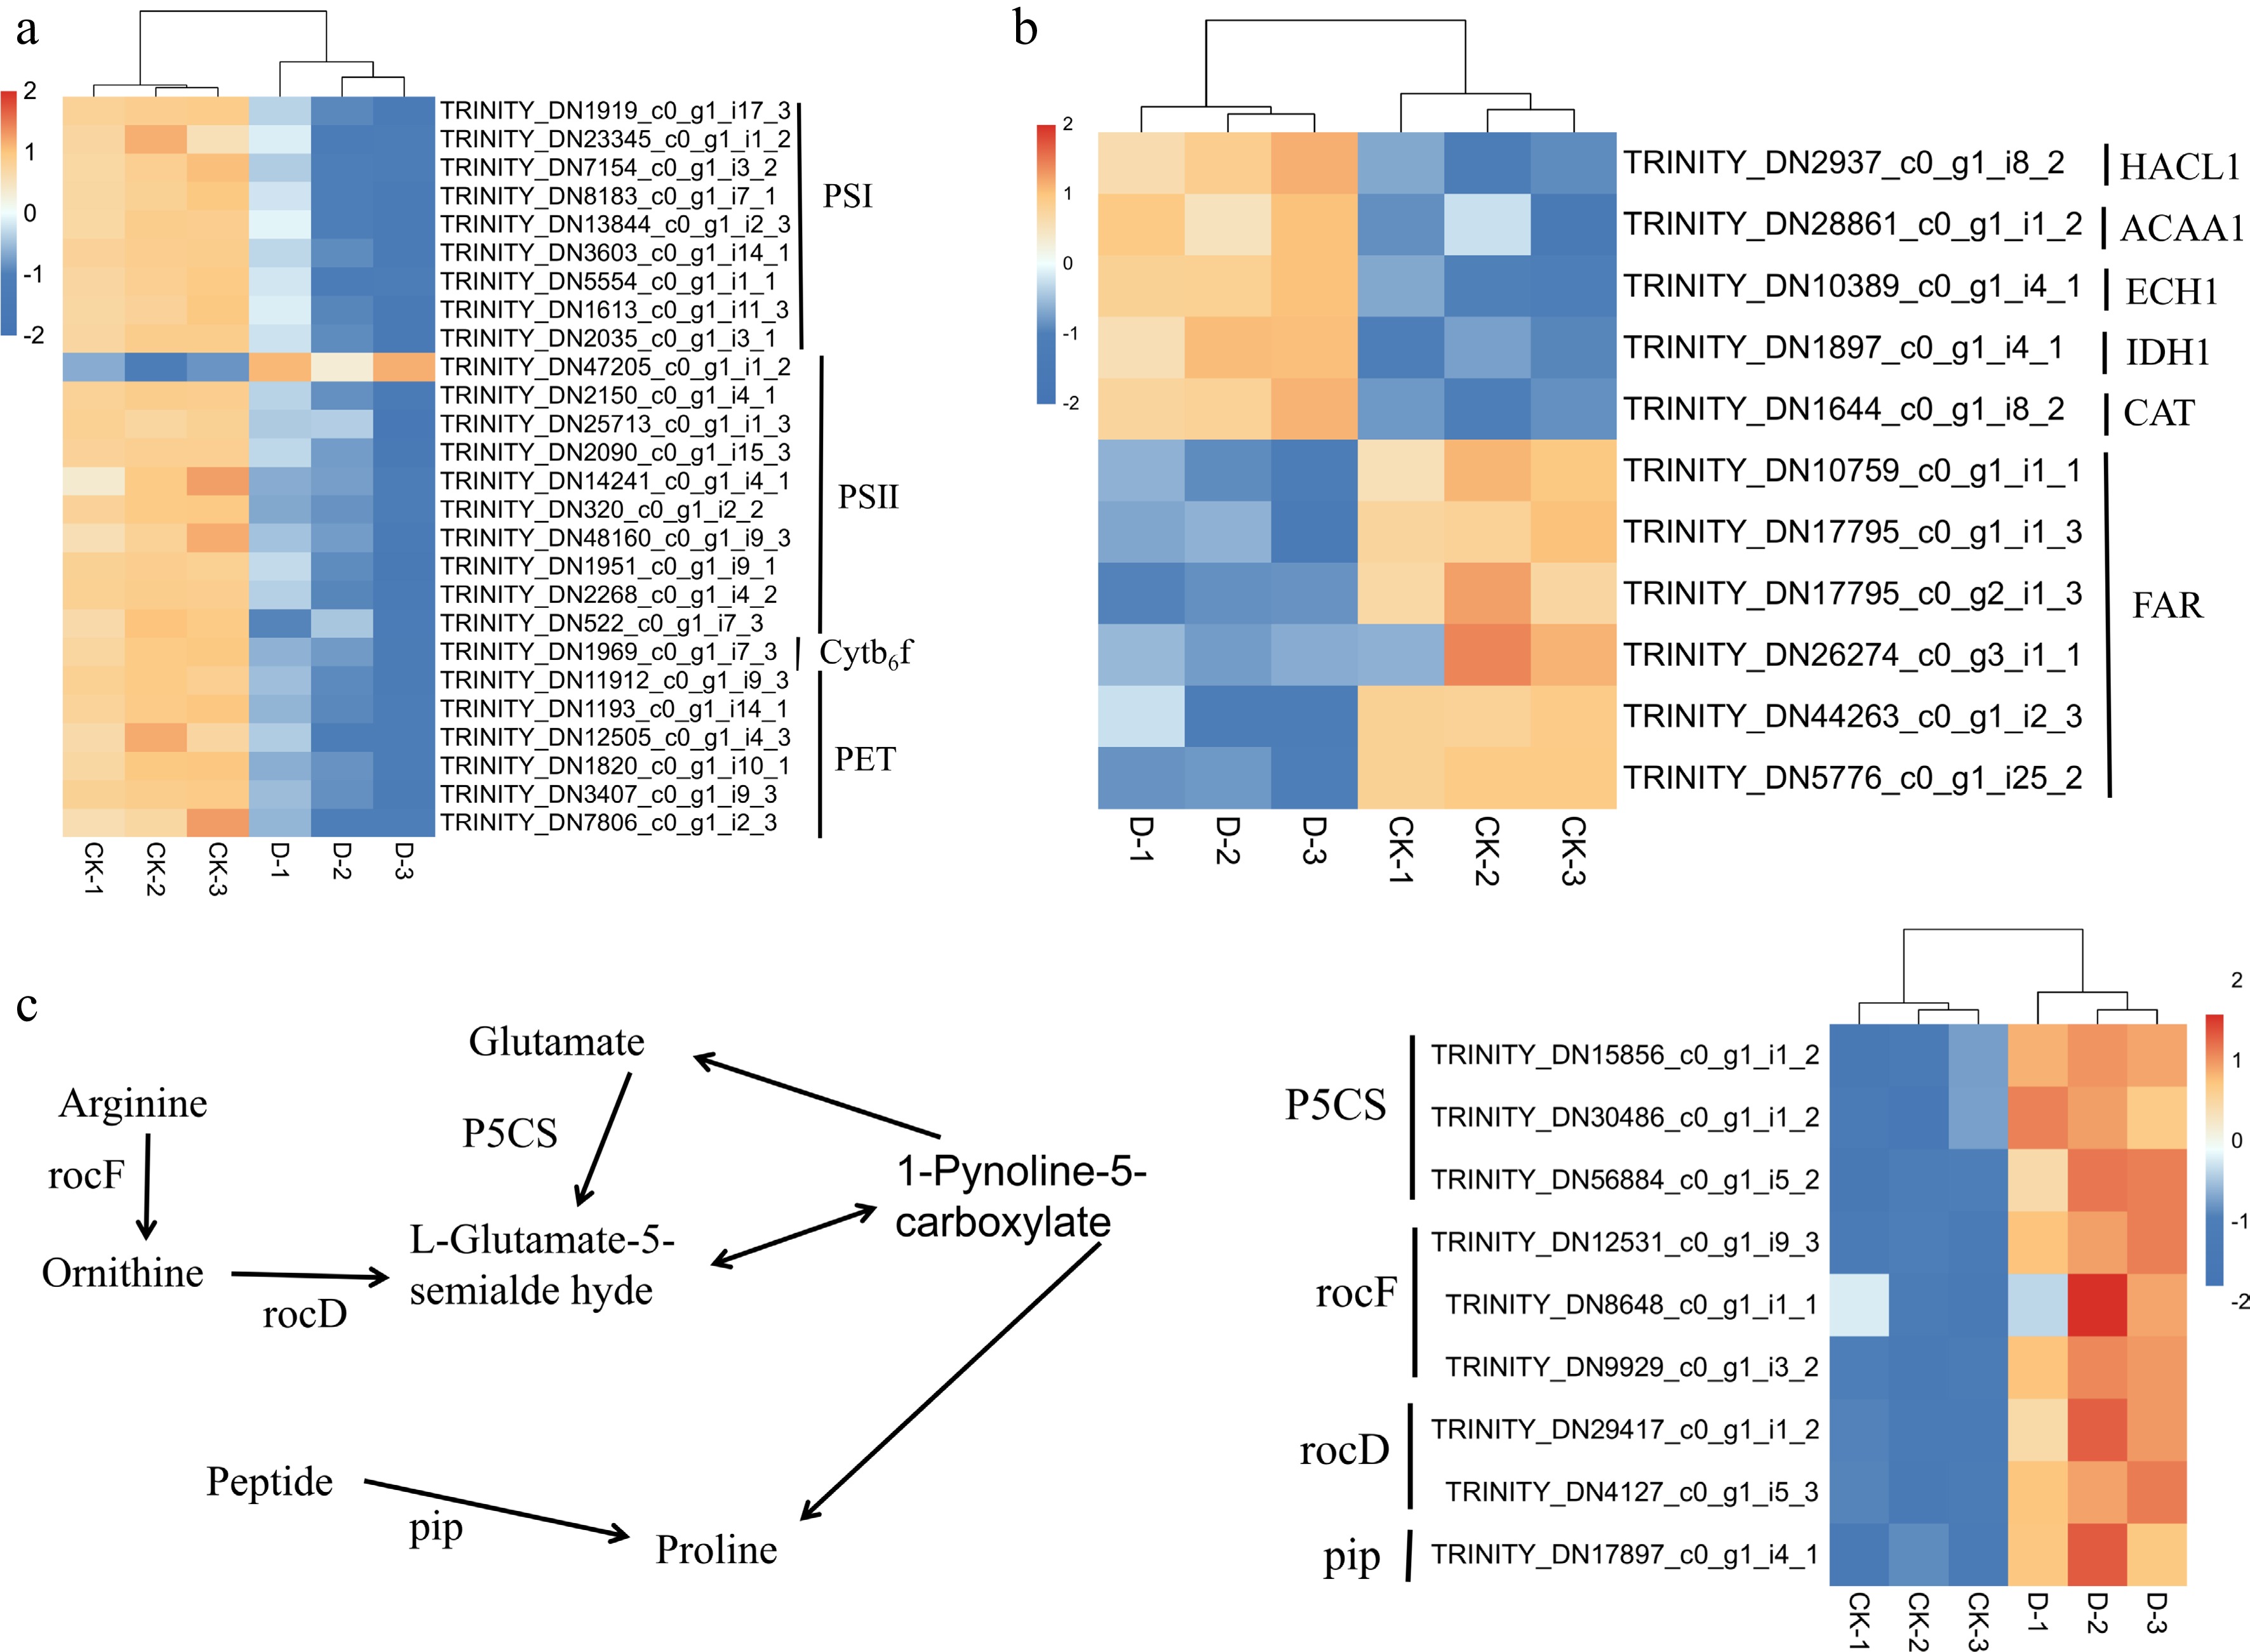
Figure 8.
Heatmap of DEGs in F. rubra under control (CK) and drought stress (D) conditions: (a) Photosynthesis; (b) peroxisome; and (c) proline biosynthesis. Rows represent genes, and columns represent treatments (CK-1, CK-2, CK-3, D-1, D-2, D-3), with colors indicating the relative gene expression levels (red for upregulation, blue for downregulation). The heatmap was created using gene_id and fragments per kilobase per million mapped fragments (FPKM) values (Supplementary Table S2).
-
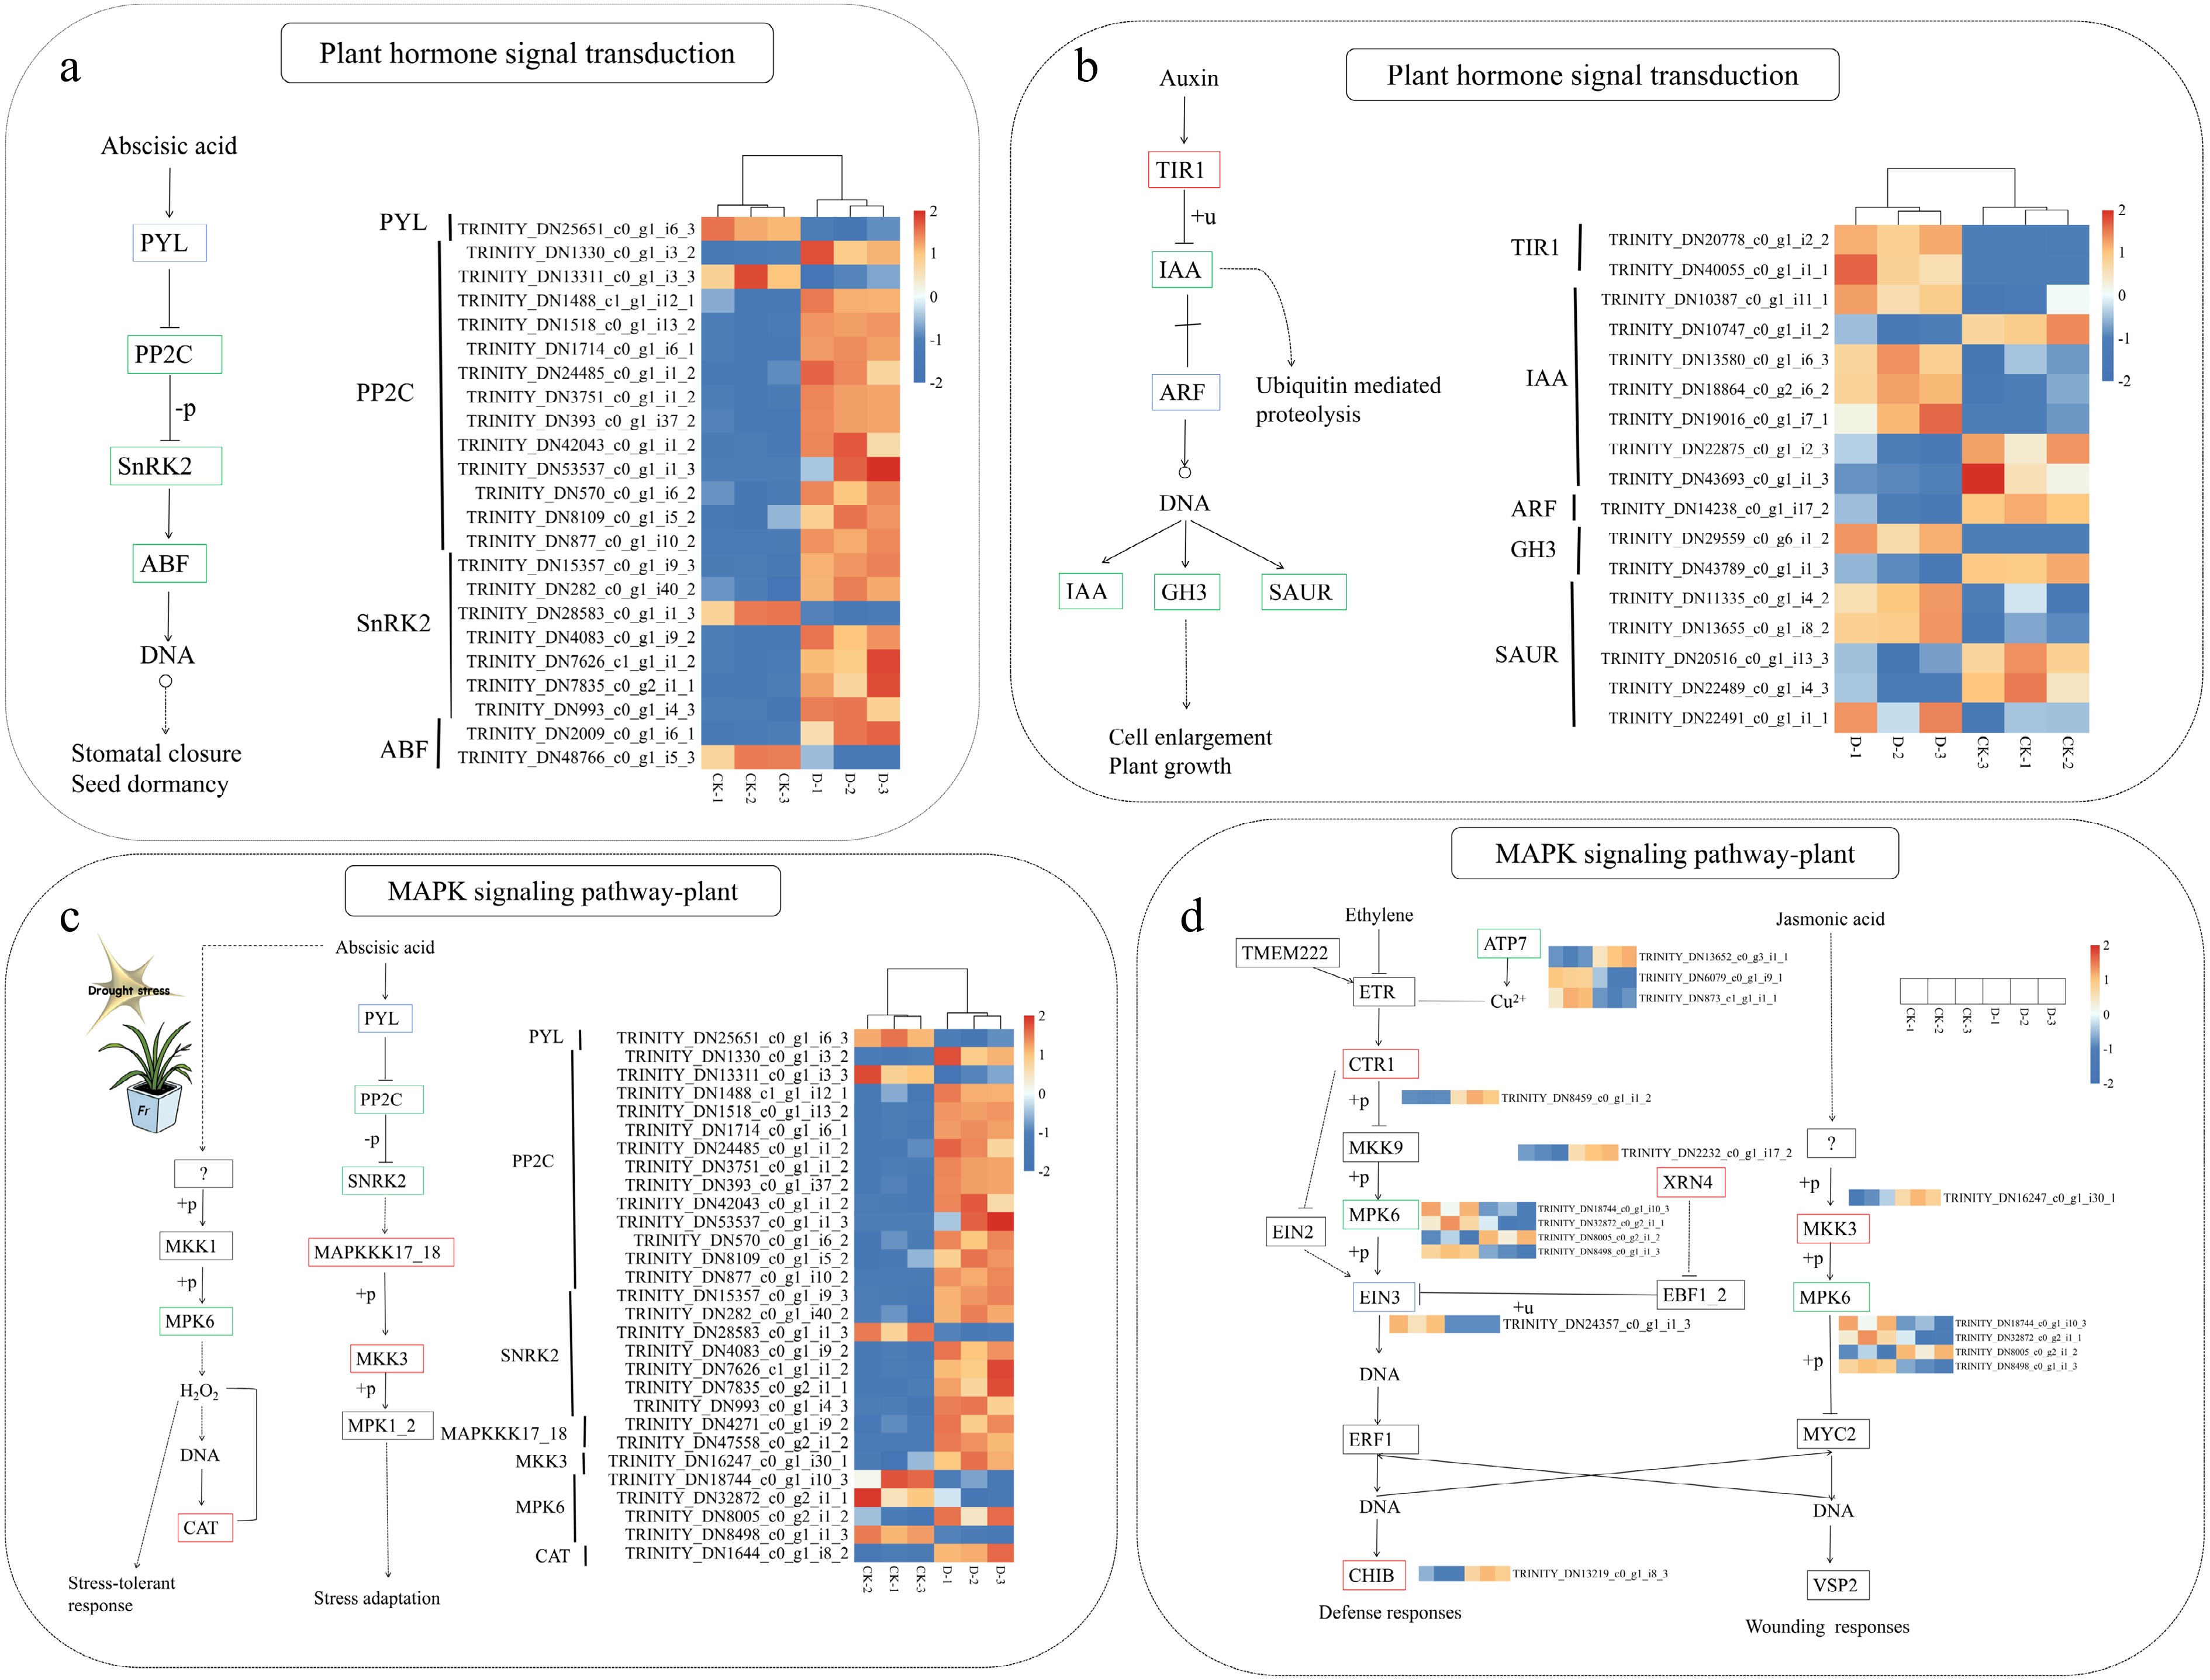
Figure 9.
Heatmap of DEGs related to (a, b) plant hormone signal transduction and (c, d) the MAPK signaling pathway in F. rubra under control (CK) and drought stress (D) conditions. Red boxes indicate upregulated genes, blue boxes indicate downregulated genes, and green boxes indicate genes with both upregulation and downregulation. Rows represent different genes, and columns represent different treatments (CK-1, CK-2, CK-3, D-1, D-2, D-3). Colors show relative gene expression levels (red for upregulation, blue for downregulation). The heatmap was created using gene_id and FPKM values (Supplementary Table S2).
Figures
(9)
Tables
(0)