-
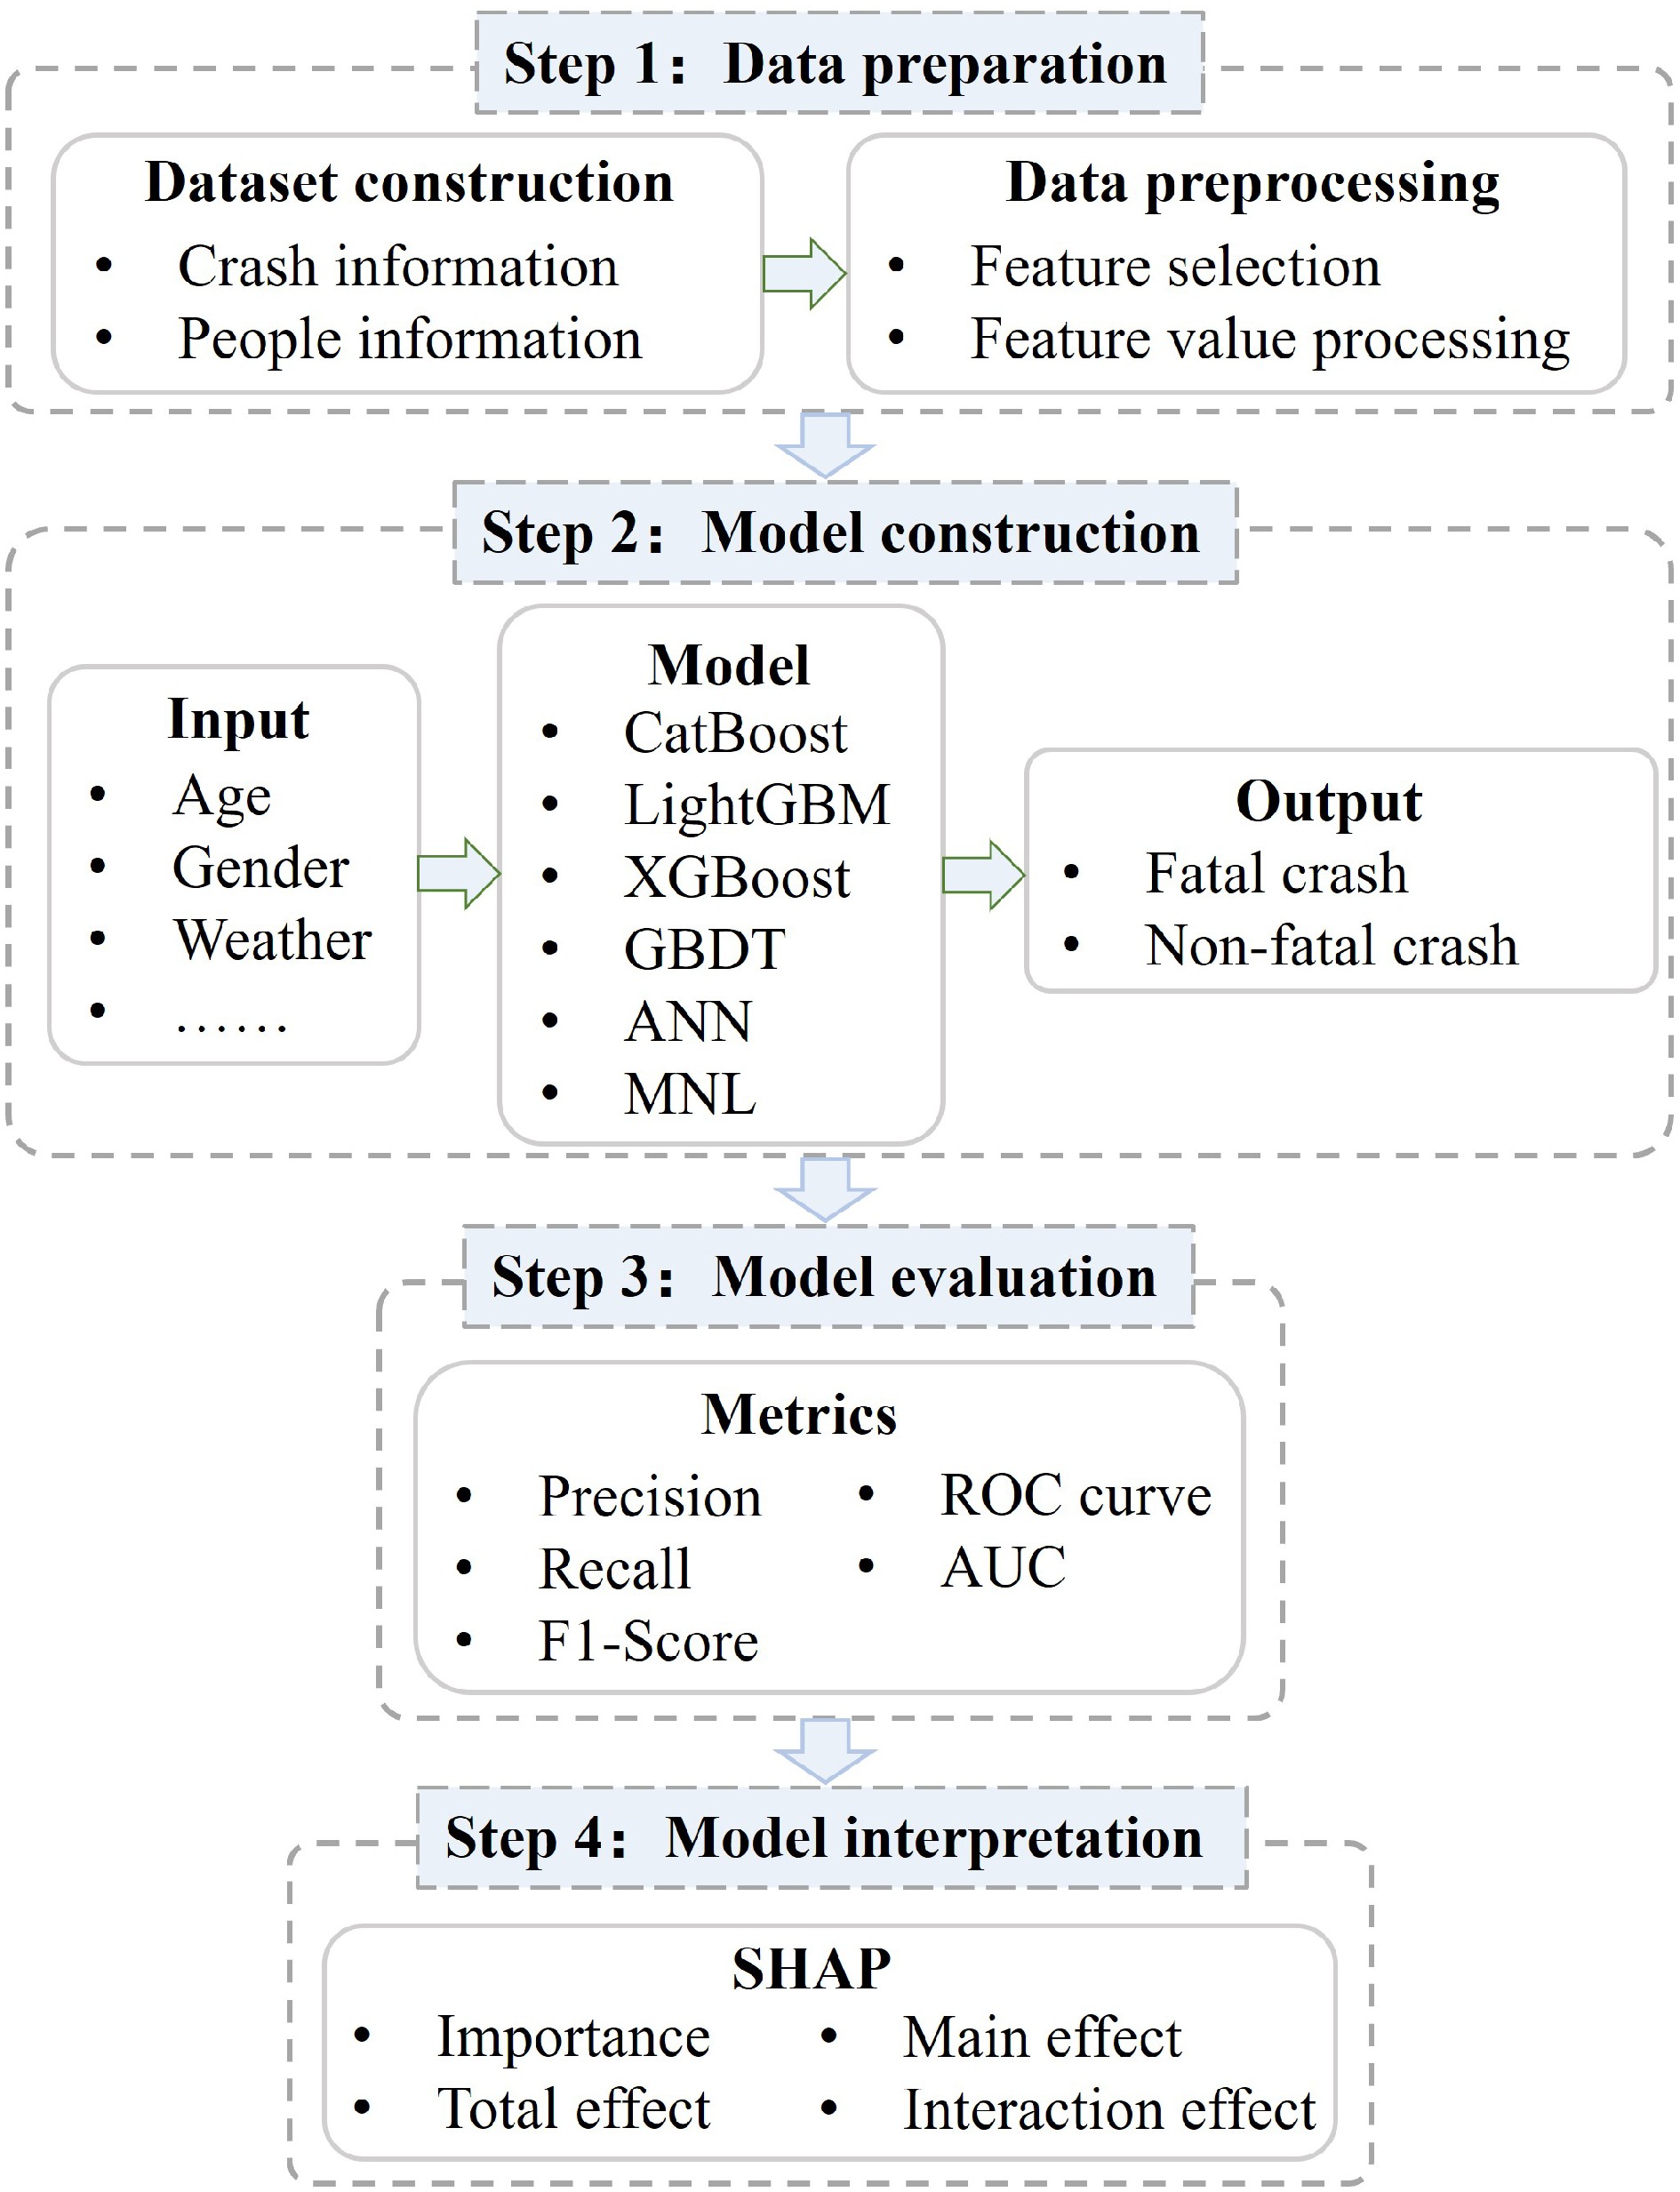
Figure 1.
Framework for fatal traffic accident prediction and causal analysis.
-
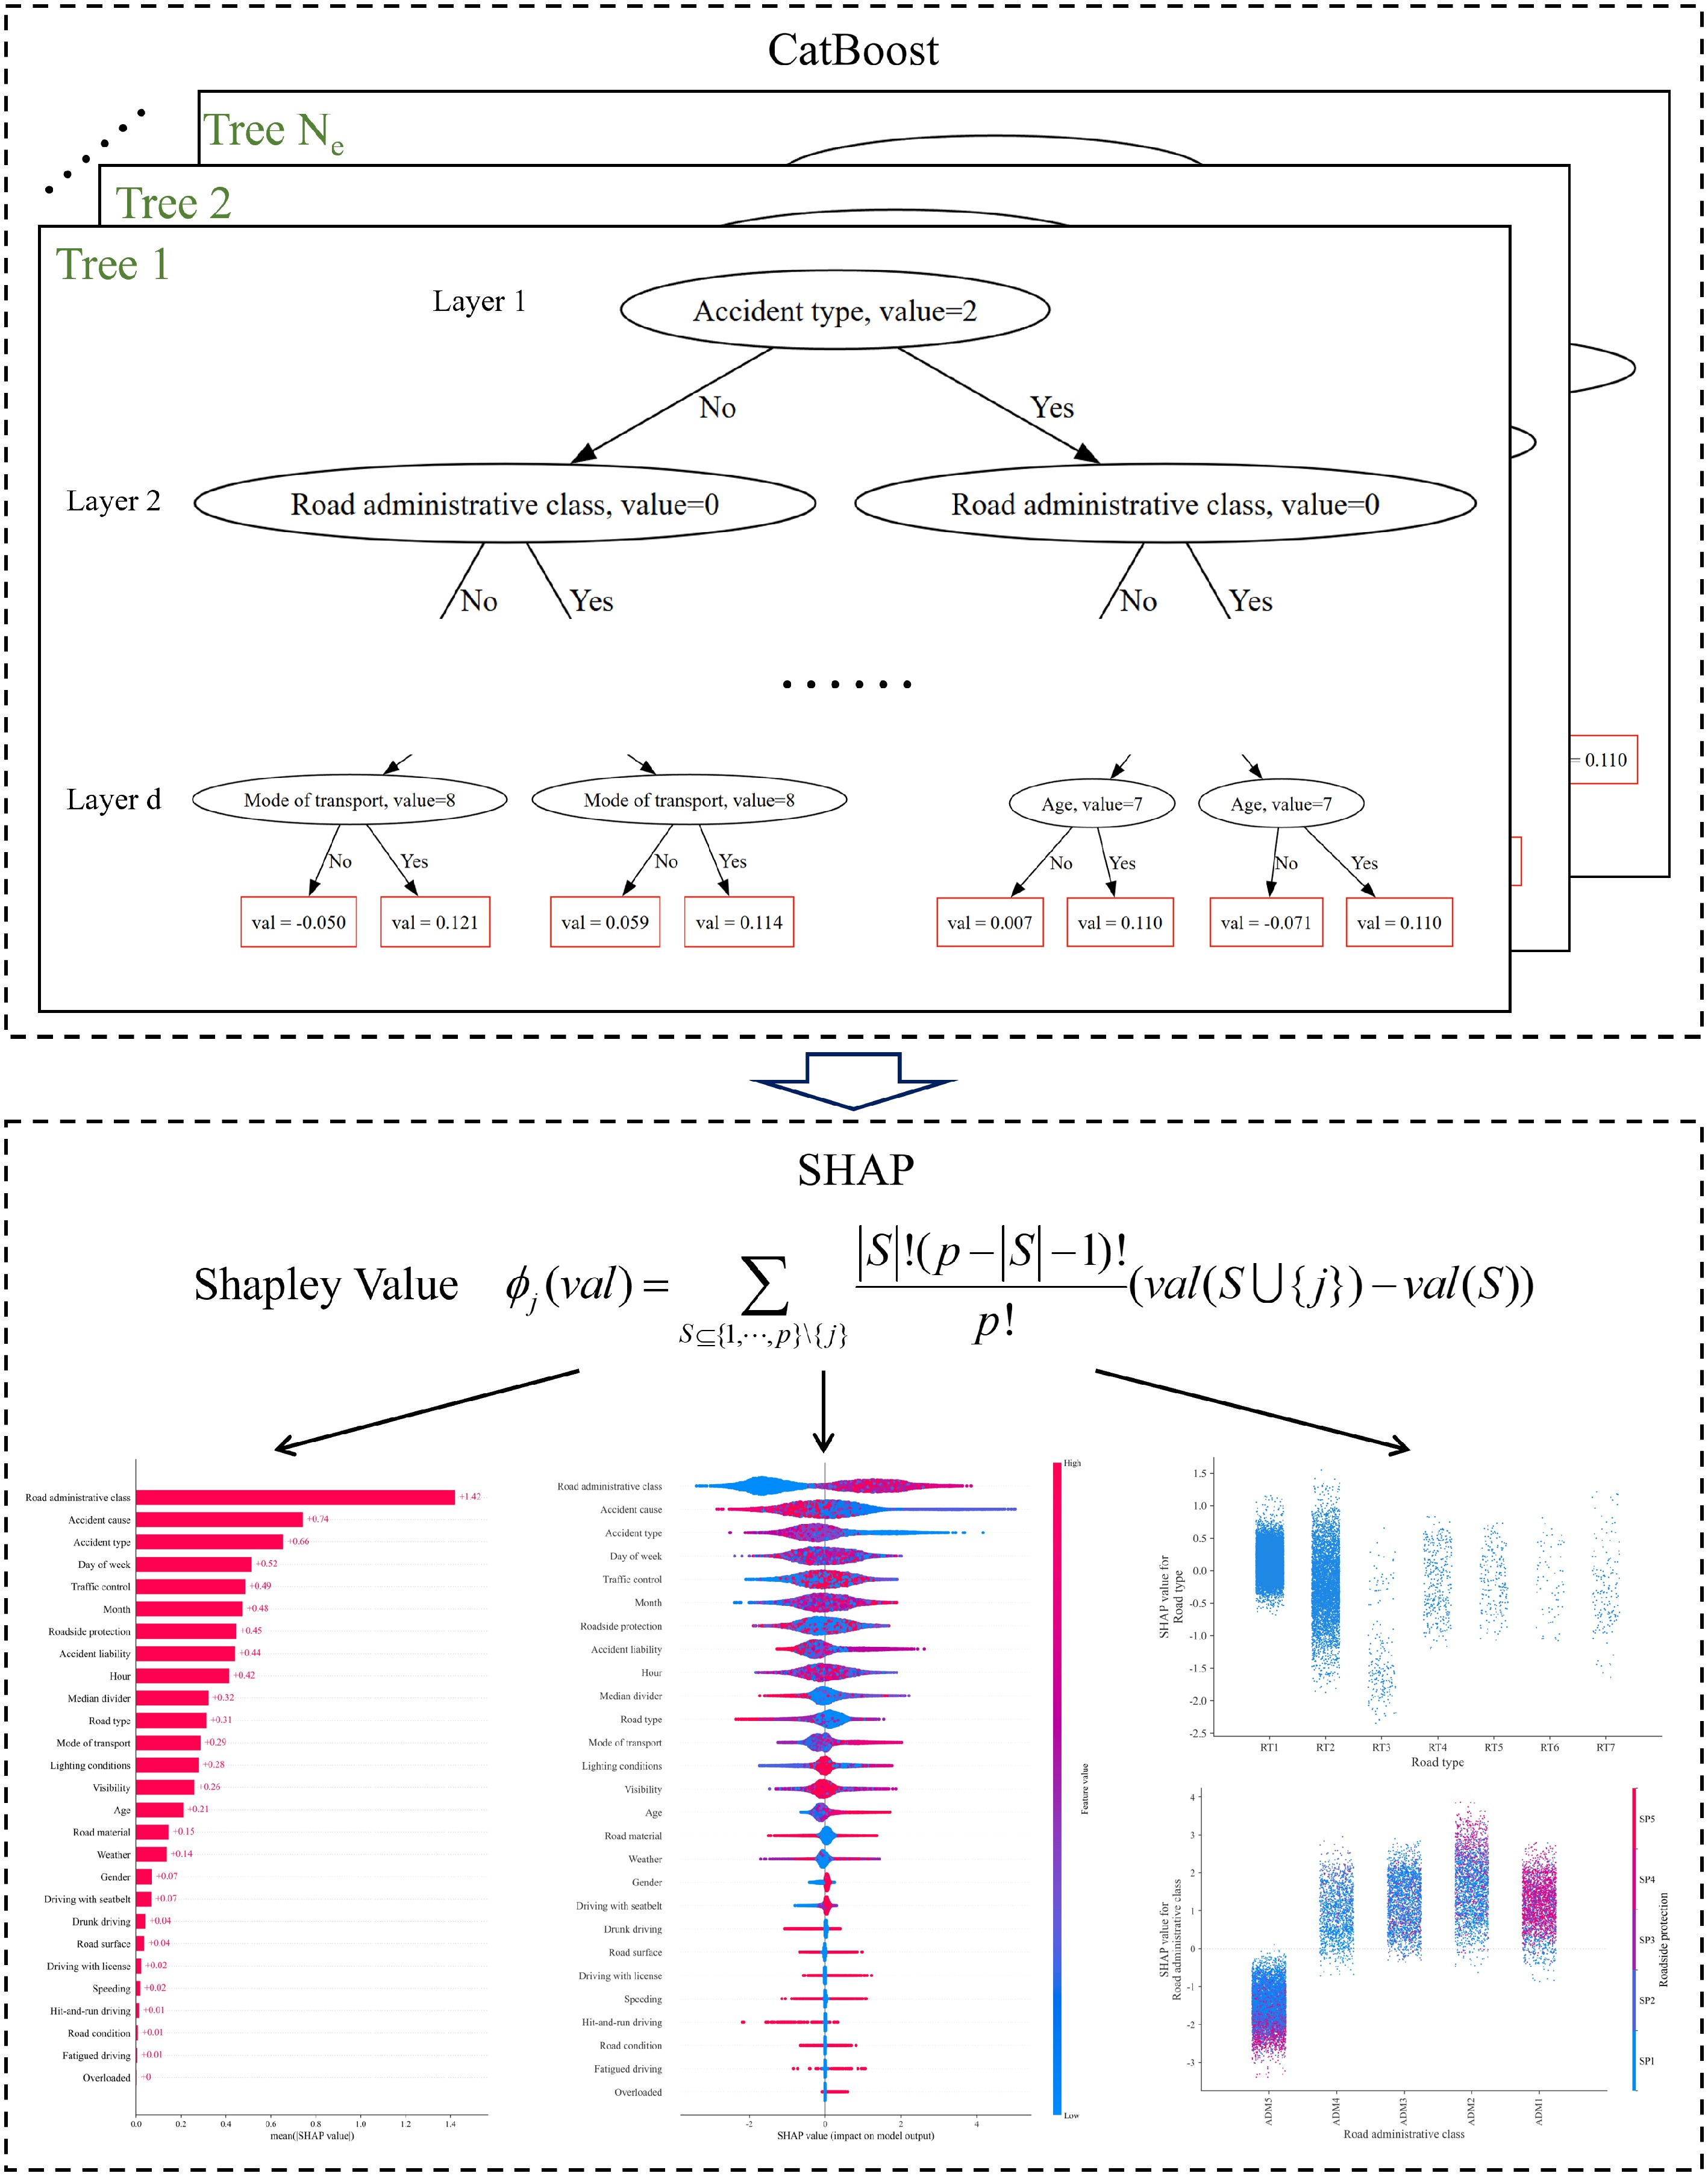
Figure 2.
Model structure of CatBoost and SHAP.
-
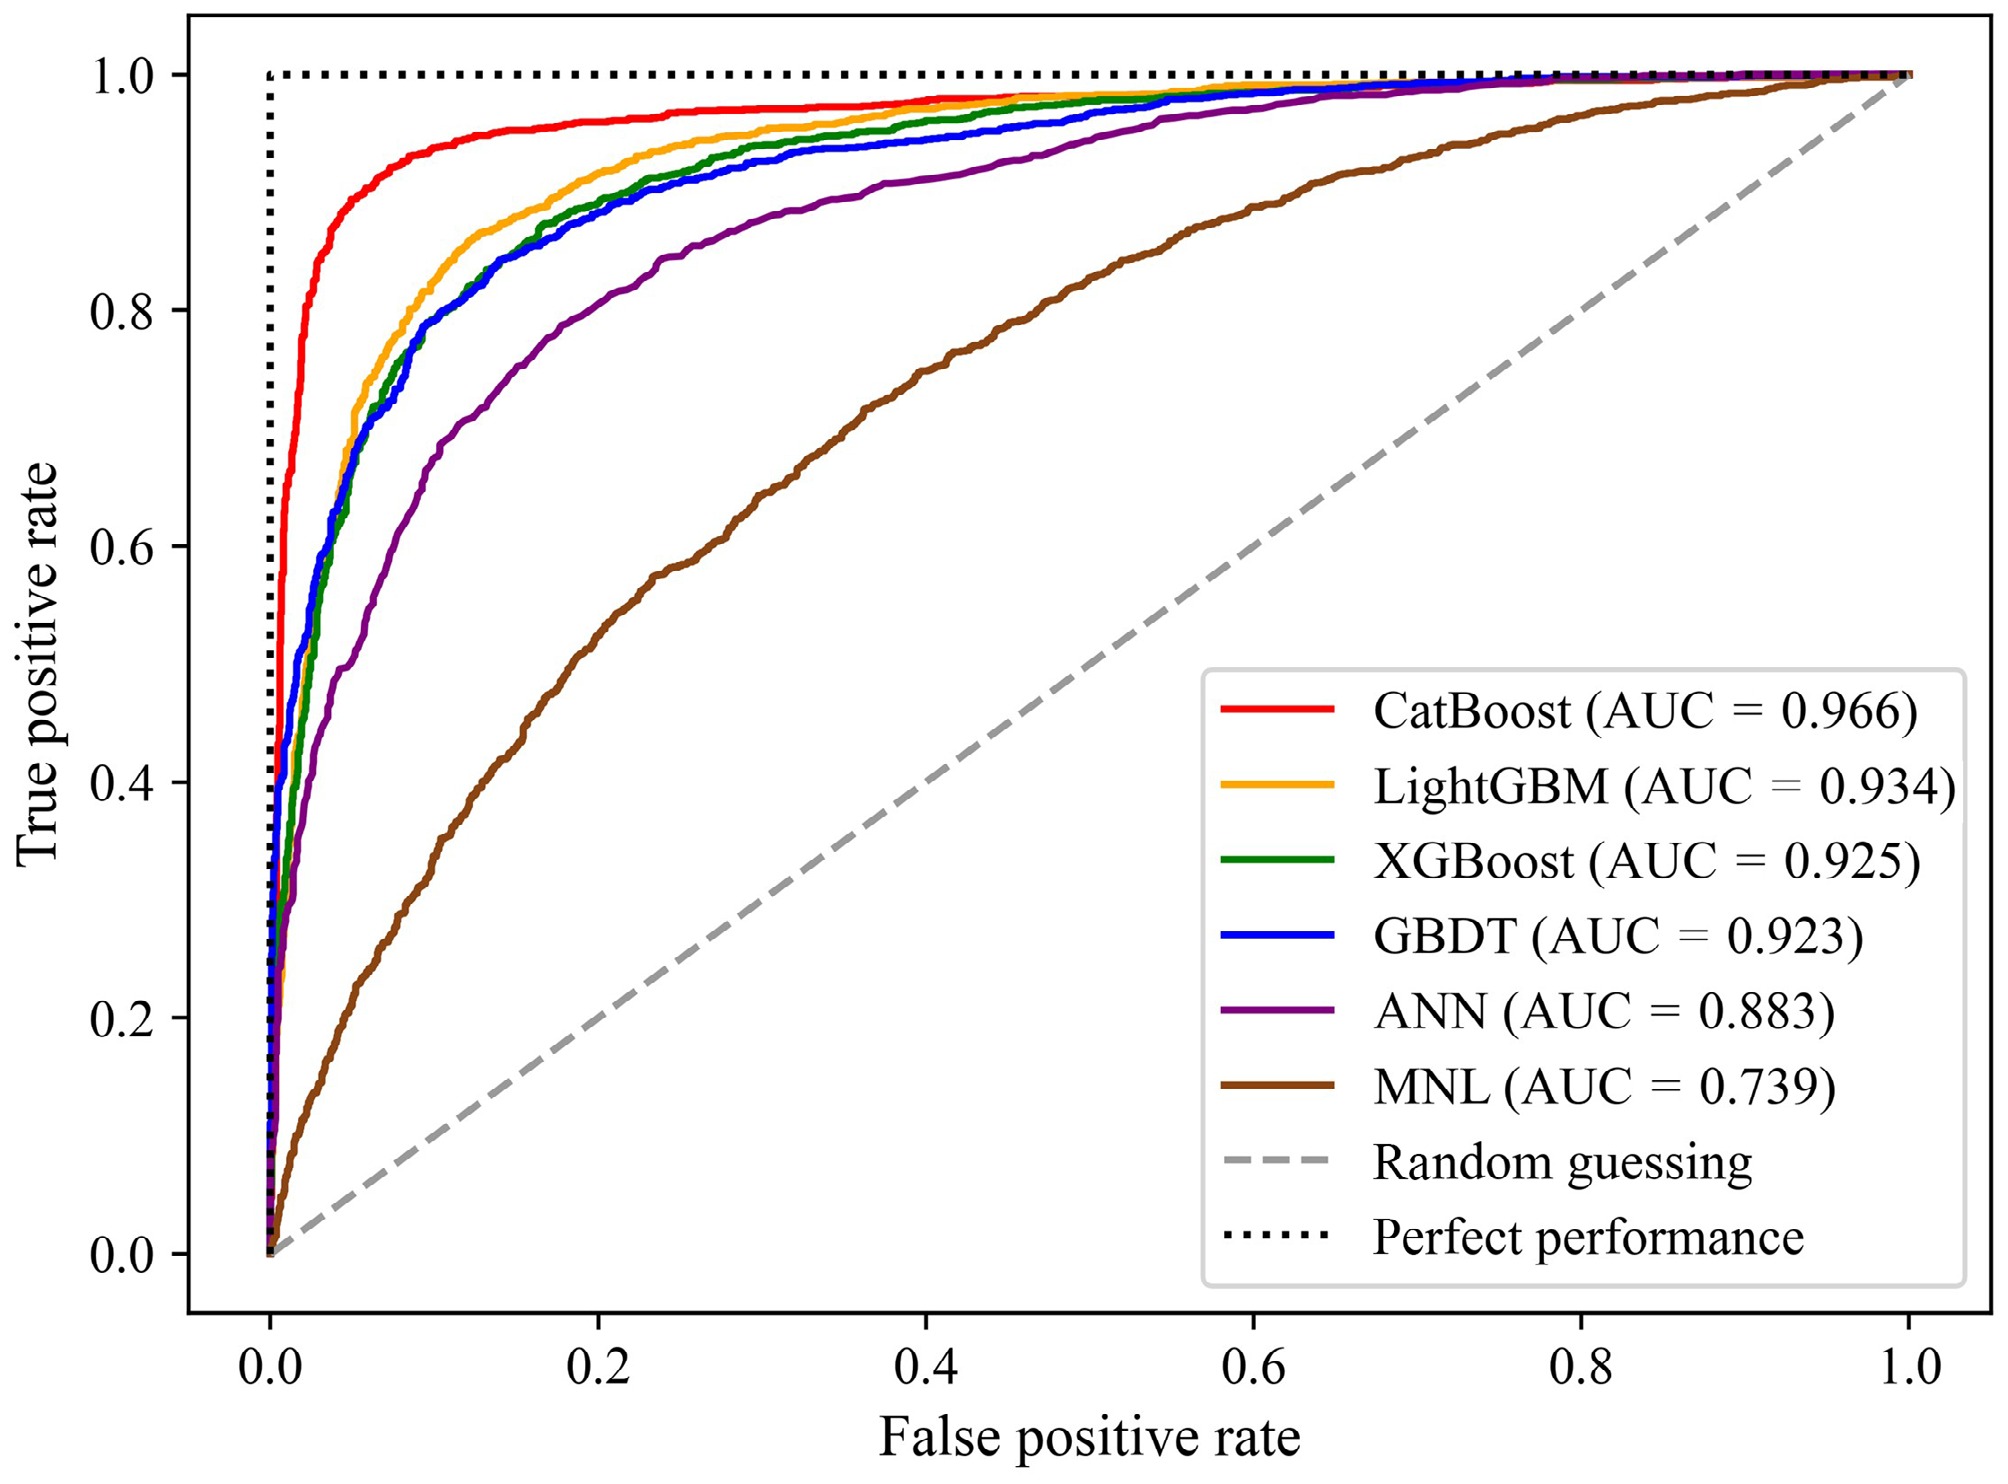
Figure 3.
Receiver operating characteristic curve for each compared algorithm.
-
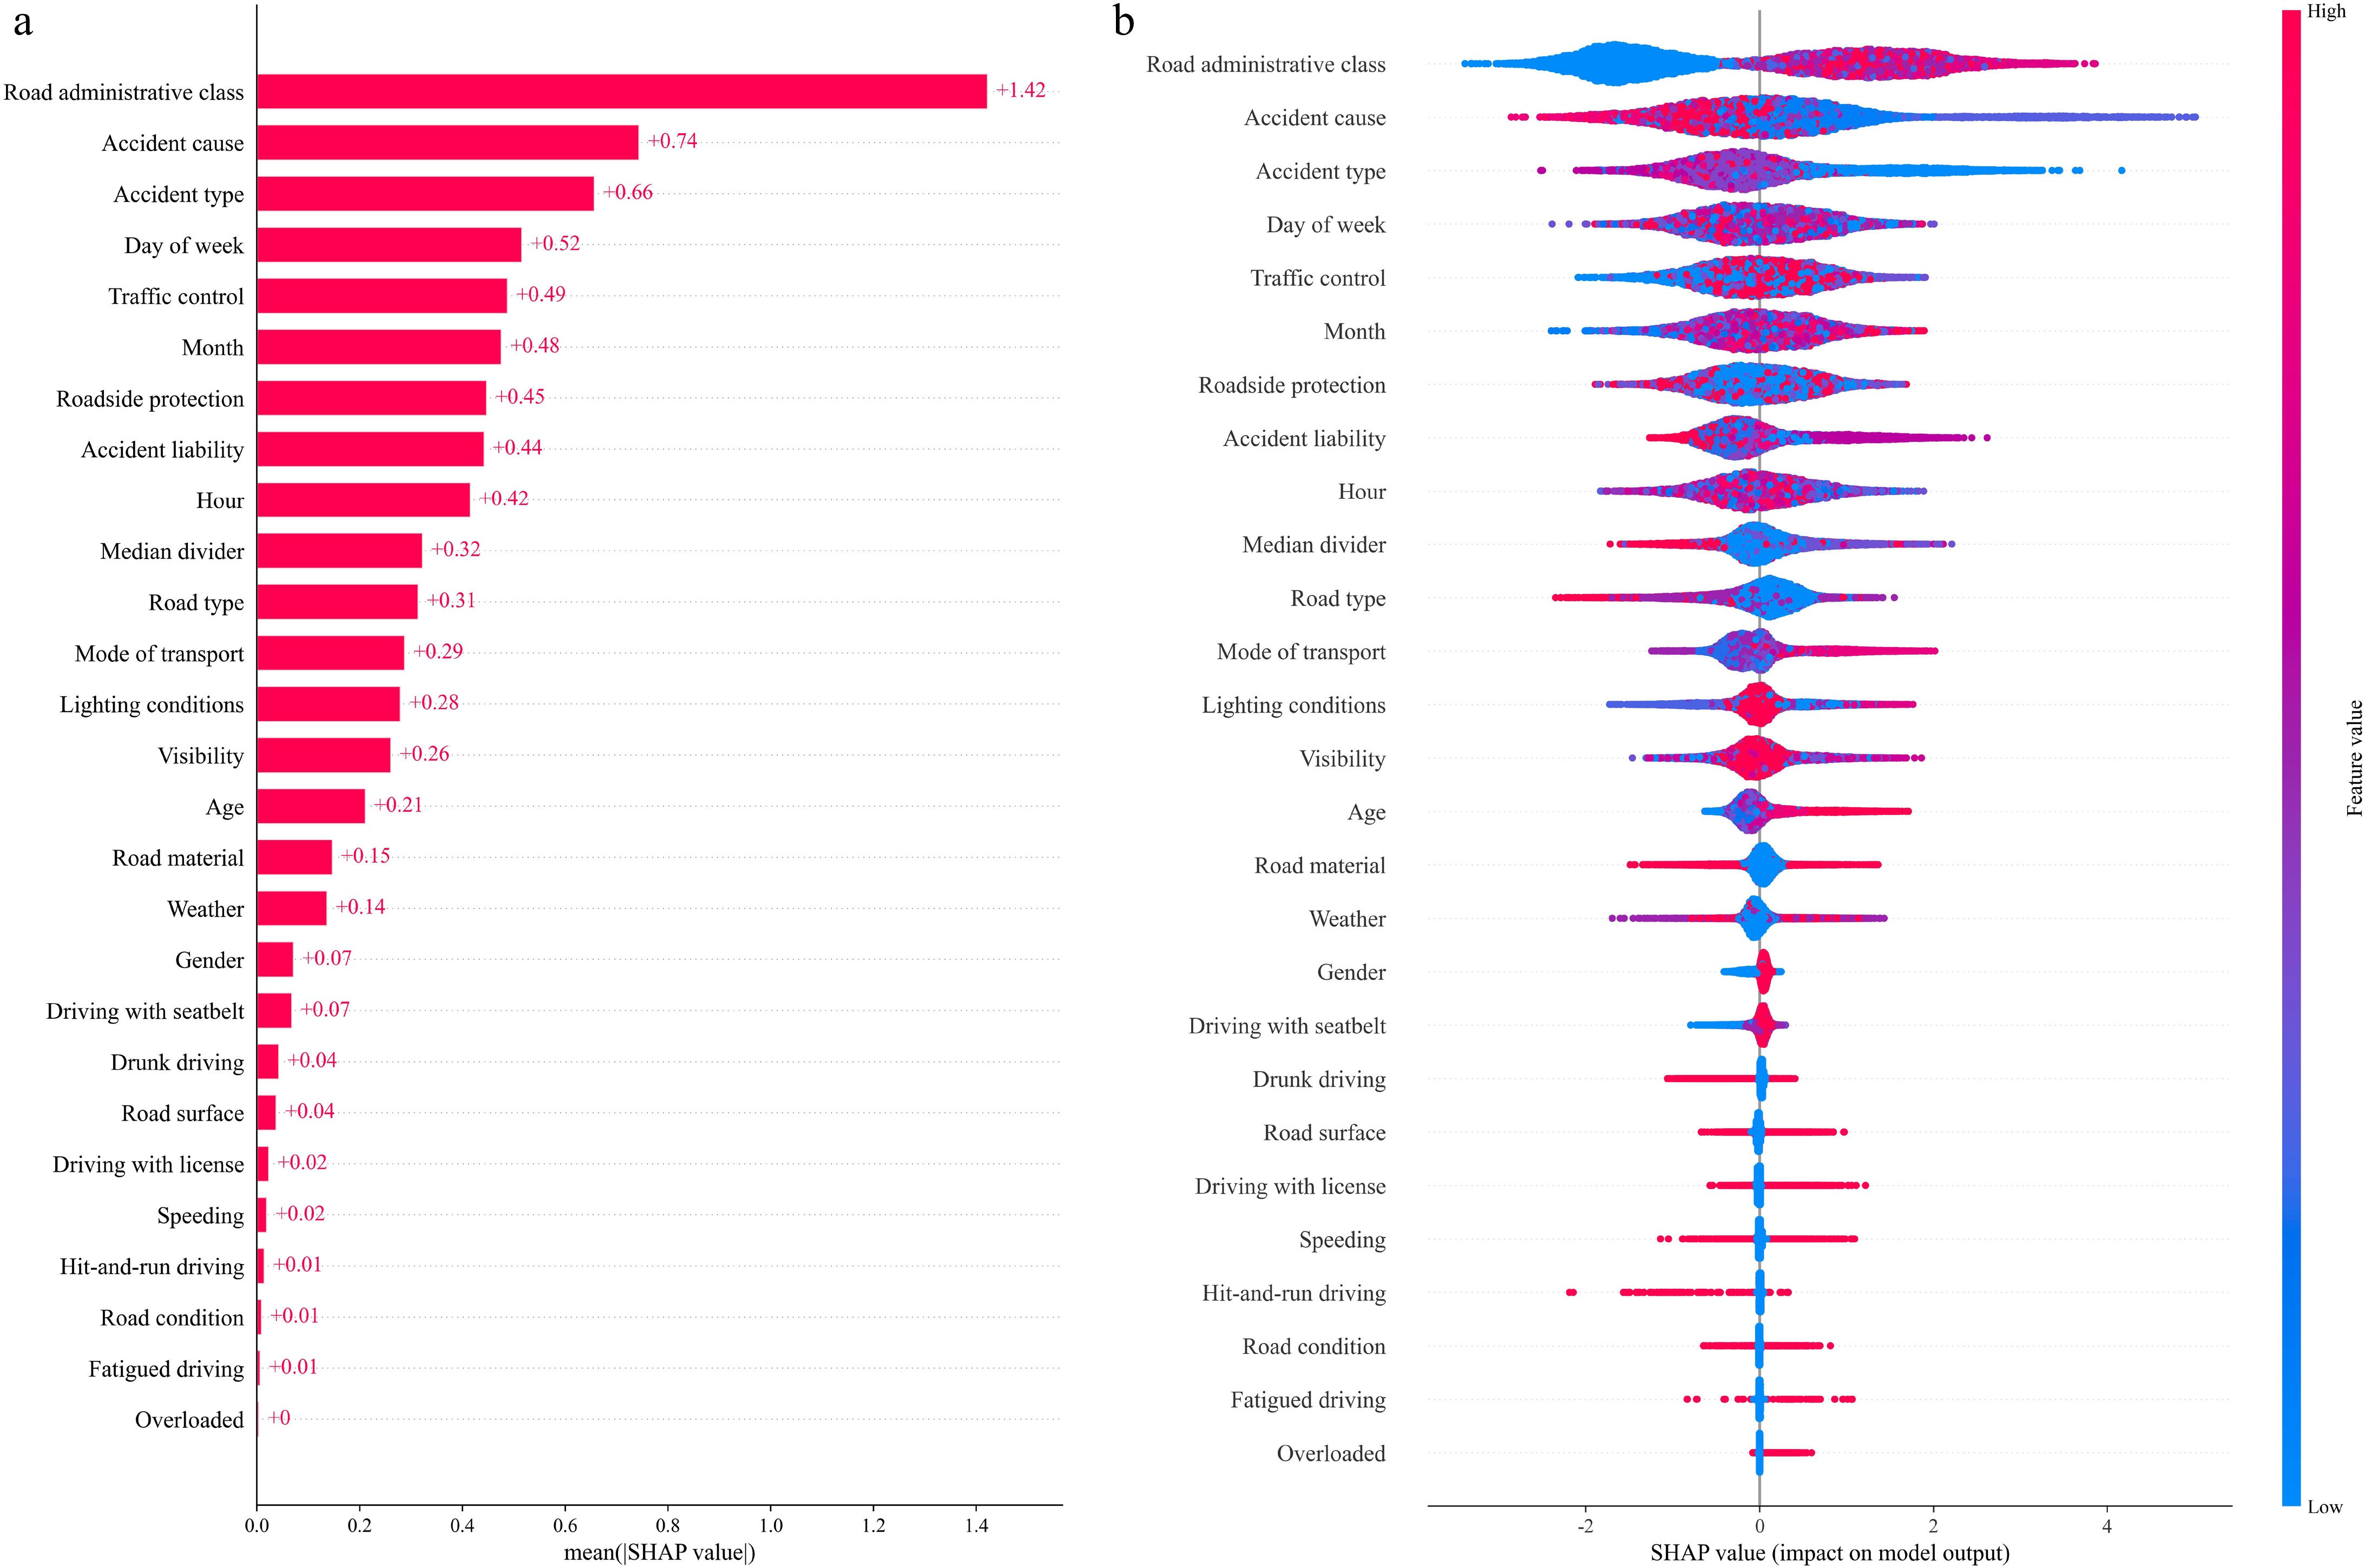
Figure 4.
Contributing factors for fatal accidents: (a) feature importance, and (b) total effect.
-
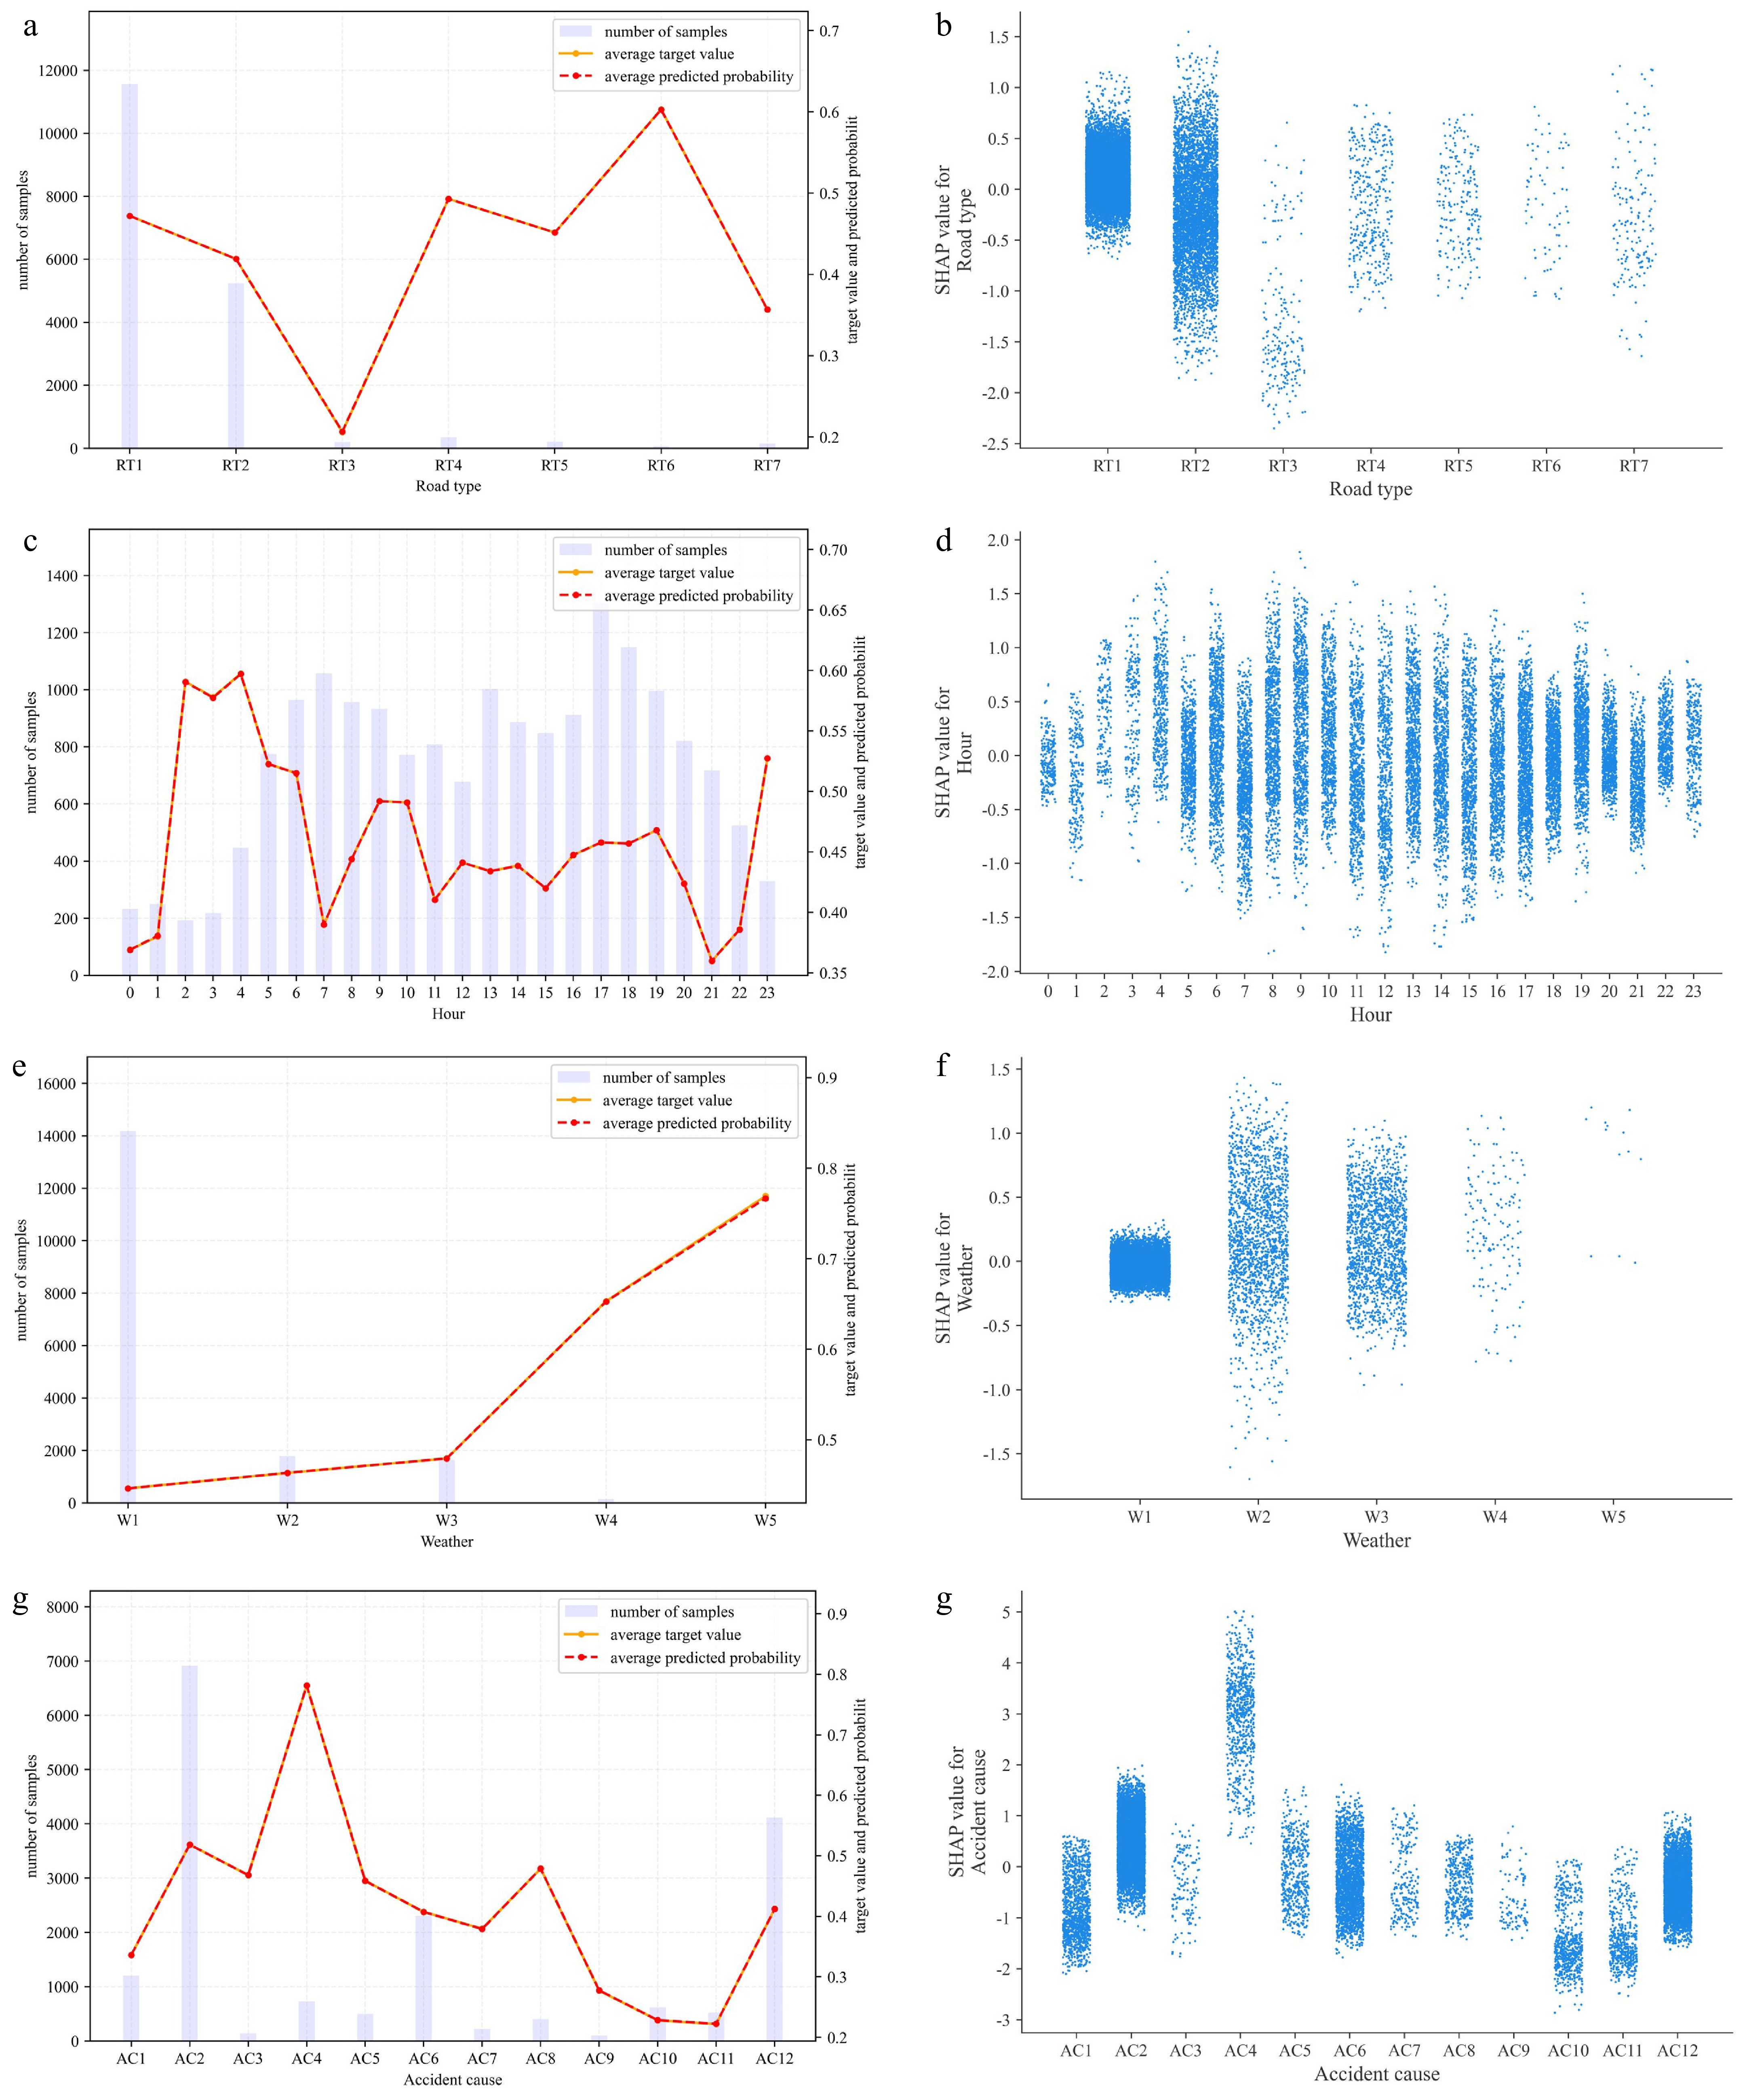
Figure 5.
Feature values and main effects of contributing factors for fatal accidents: (a) road type (feature value), (b) road type (main effect), (c) hour (feature value), (d) hour (main effect), (e) weather (feature value), (f) weather (main effect), (g) accident cause (feature value), and (h) accident cause (main effect).
-
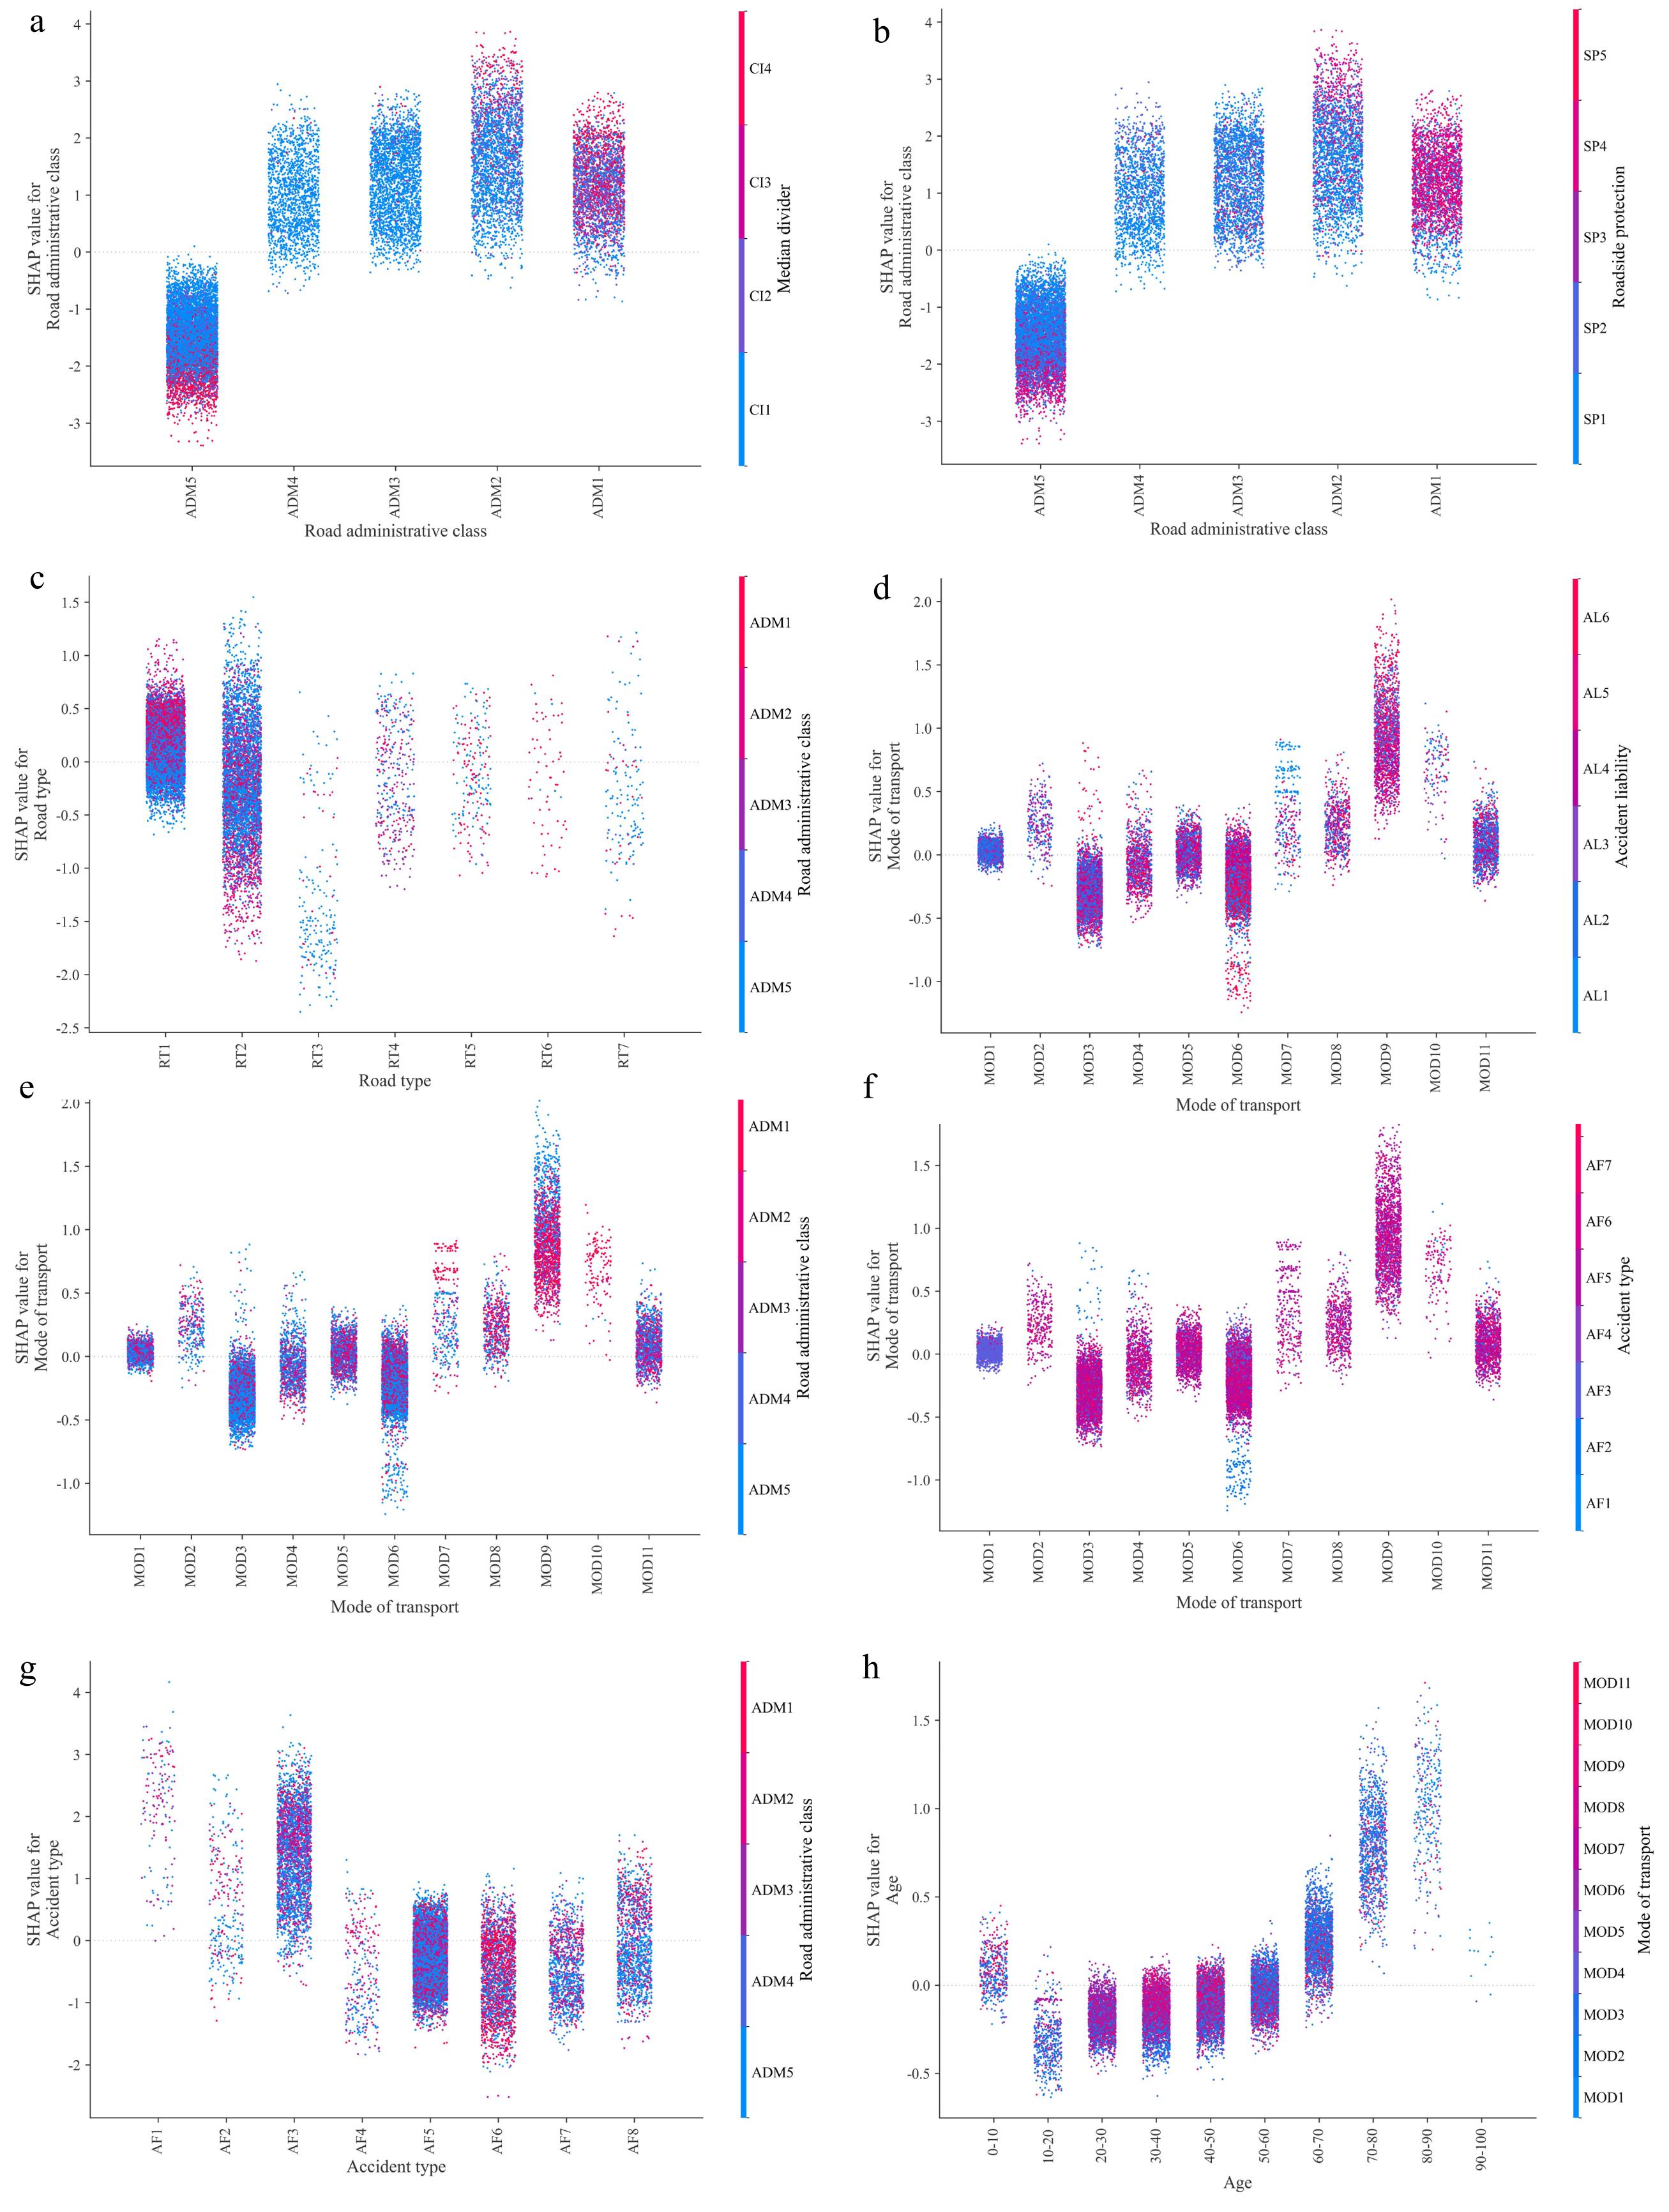
Figure 6.
Interaction effects of contributing factors for fatal accidents: (a) road administrative class vs median divider, (b) road administrative class vs roadside protection, (c) road type vs road administrative class, (d) mode of transport vs accident liability, (e) mode of transport vs road administrative level, (f) mode of travel vs accident type, (g) accident type vs road administrative class, and (h) driver age vs mode of transport.
-
Feature Value Abbreviation of value Age (0,20] / (20,30] / (30,40] / (40,50] / (50,60] / (60,70] / (70, ) 0-20 / 20-30 / 30-40 / 40-50 / 50-60 / 60-70 / > 70 Gender Female / Male − Driving with license True / False T / F Driving with seatbelt True / False / Unknown T / F / U Drunk driving True / False T / F Fatigued driving True / False T / F Speeding True / False T / F Overloaded True / False T / F Hit-and-run driving True / False T / F Mode of transport Pedestrian / Bicycle / Electric bicycle / Motorcycle / Tricycle / Car / Bus / Small truck / Large truck / Combination vehicle / Other MOD1 / MOD2 / MOD3 / MOD4 / MOD5 / MOD6 / MOD7 / MOD8 / MOD9 / MOD10 / MOD11 Road administrative class National road / Provincial road / Country road / Township road / Urban road ADM1 / ADM2 / ADM3 / ADM4 / ADM5 Road type Road segment / Intersection / Road access / Ramp / Bridge or tunnel / Elevated road / Other RT1 / RT2 / RT3 / RT4 / RT5 / RT6 / RT7 Traffic control No control / Marking / Sign / Traffic light / Other TC1 / TC2 / TC3 / TC4 / TC5 Median divider No divider / Greenbelt / Pier / Guardrail CI1 / CI2 / CI3 / CI4 Roadside protection No protection / Greenbelt / Pier / Guardrail / Other SP1 / SP2 / SP3 / SP4 / SP5 Road condition Intact / Damaged RC1 / RC2 Road material Asphalt / Cement / Other RM1 / RM2 / RM3 Road surface Dry / Wet / Ponding / Icy / Other RS1 / RS2 / RS3 / RS4 / RS5 Month January / February / March / April / May / June / July / August / September / October / November / December Jan / Feb / Mar / Apr / May / Jun / Jul / Aug / Sept / Oct / Nov / Dec Day of week Monday / Tuesday / Wednesday / Thursday / Friday / Saturday / Sunday Mon / Tue / Wed / Thur / Fri / Sat / Sun Hour 0 / 1 / 2 / 3 / 4 / 5 / 6 / 7 / 8 / 9 / 10 / 11 / 12 / 13 / 14 / 15 / 16 / 17 / 18 / 19 / 20 / 21 / 22 / 23 − Weather Sunny / Cloudy / Rainy or snowy / Foggy / Other W1 / W2 / W3 / W4 / W5 Lighting conditions Night without street lamp / Night with street lamp / Nightfall / Dawn / Daytime LC1 / LC2 / LC3 / LC4 / LC5 Visibility < 50 m / 50−100 m / 100−200 m / > 200 m VIS1 / VIS2 / VIS3 / VIS4 Accident cause Pedestrian or non-motor vehicle violation / Distracted driving/ Natural disaster / Substandard vehicle / Driving in the wrong lane / Failure to give way according to traffic rules / Traffic light or sign violation / Failure to maintain safe distance / Illegal parking / Illegal overtaking or lane changing / Driving in the opposite direction / Other AC1 / AC2 / AC3 / AC4 / AC5 / AC6 / AC7 / AC8 / AC9 / AC10 / AC11 / AC12 Accident type Overturned vehicle / Bumping into fixed object / Bumping into pedestrian(s) / Side-swipe / Side collision / Rear-end collision / Head-on collision / Other AF1 / AF2 / AF3 / AF4 / AF5 / AF6 / AF7 / AF8 Accident liability Unknown / No liability / Secondary / Equal / Primary / Full AL1 / AL2 / AL3 / AL4 / AL5 / AL6 Accident severity Injury or property damage (non-fatal) / Fatal AS0 / AS1 Table 1.
Data description.
-
Algorithms Parameters Parameter range Optimal parameters CatBoost Learning rate lr lr $ \in $ lr = 0.1 Number of estimators Ne Ne $ \in $ Ne = 500 Depth of each tree d d $ \in $ d = 10 LightGBM Learning rate lr lr $ \in $ lr = 0.1 Number of estimators Ne Ne $ \in $ Ne = 1,000 Maximum depth of each tree d d $ \in $ $ \infty $ d = $ \infty $ Maximum tree leaves of each tree ml ml $ \in $ ml = 100 XGBoost Learning rate lr lr $ \in $ lr = 0.1 Number of estimators Ne Ne $ \in $ Ne = 500 maximum depth of each tree d d $ \in $ d = 30 Minimum decreasing value of loss function gamma gamma $ \in $ gamma = 0.1 GBDT Learning rate lr lr $ \in $ lr = 0.1 Number of estimators Ne Ne $ \in $ Ne = 500 Maximum depth of each tree d d $ \in $ d = 30 ANN Number of hidden layer units Nunit Nunit $ \in $ Nunit = 256 Learning rate lr lr $ \in $ lr = 10−3 MNL Penalty p p $ \in $ p = l2 Inverse of regularization strength C C $ \in $ C = 10 Table 2.
Parameter selection for each compared algorithm.
-
Algorithms Precision Recall F1-score CatBoost 0.912 0.942 0.927 LightGBM 0.826 0.872 0.848 XGBoost 0.820 0.847 0.833 GBDT 0.808 0.852 0.829 ANN 0.727 0.817 0.769 MNL 0.596 0.651 0.622 Table 3.
Metrics for each compared algorithm.
Figures
(6)
Tables
(3)