-
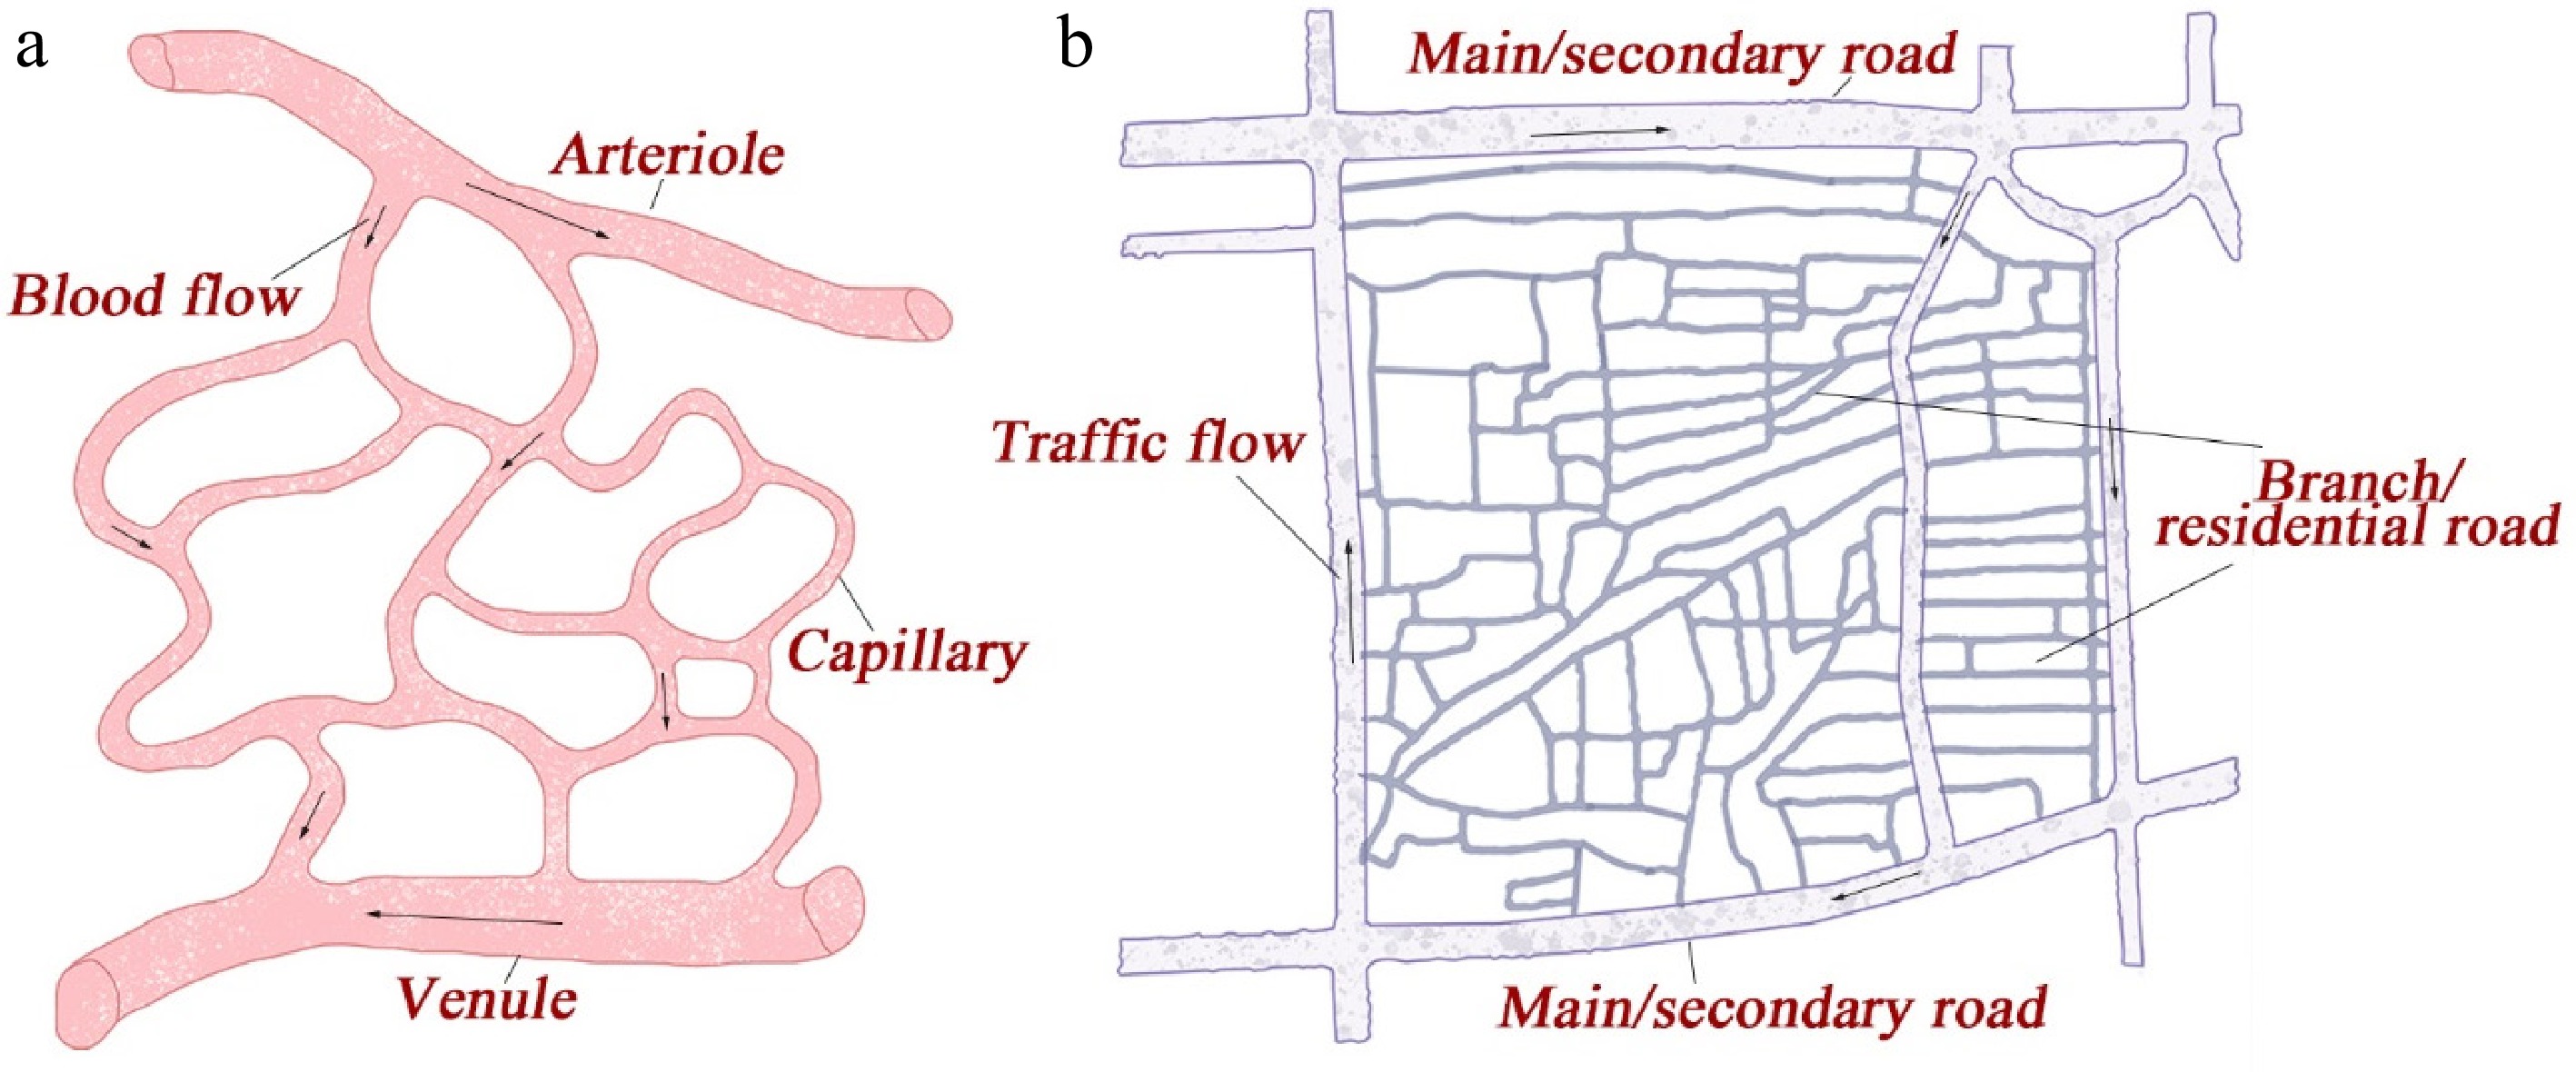
Figure 1.
(a) Microvascular circulation and (b) traffic microcirculation system.
-
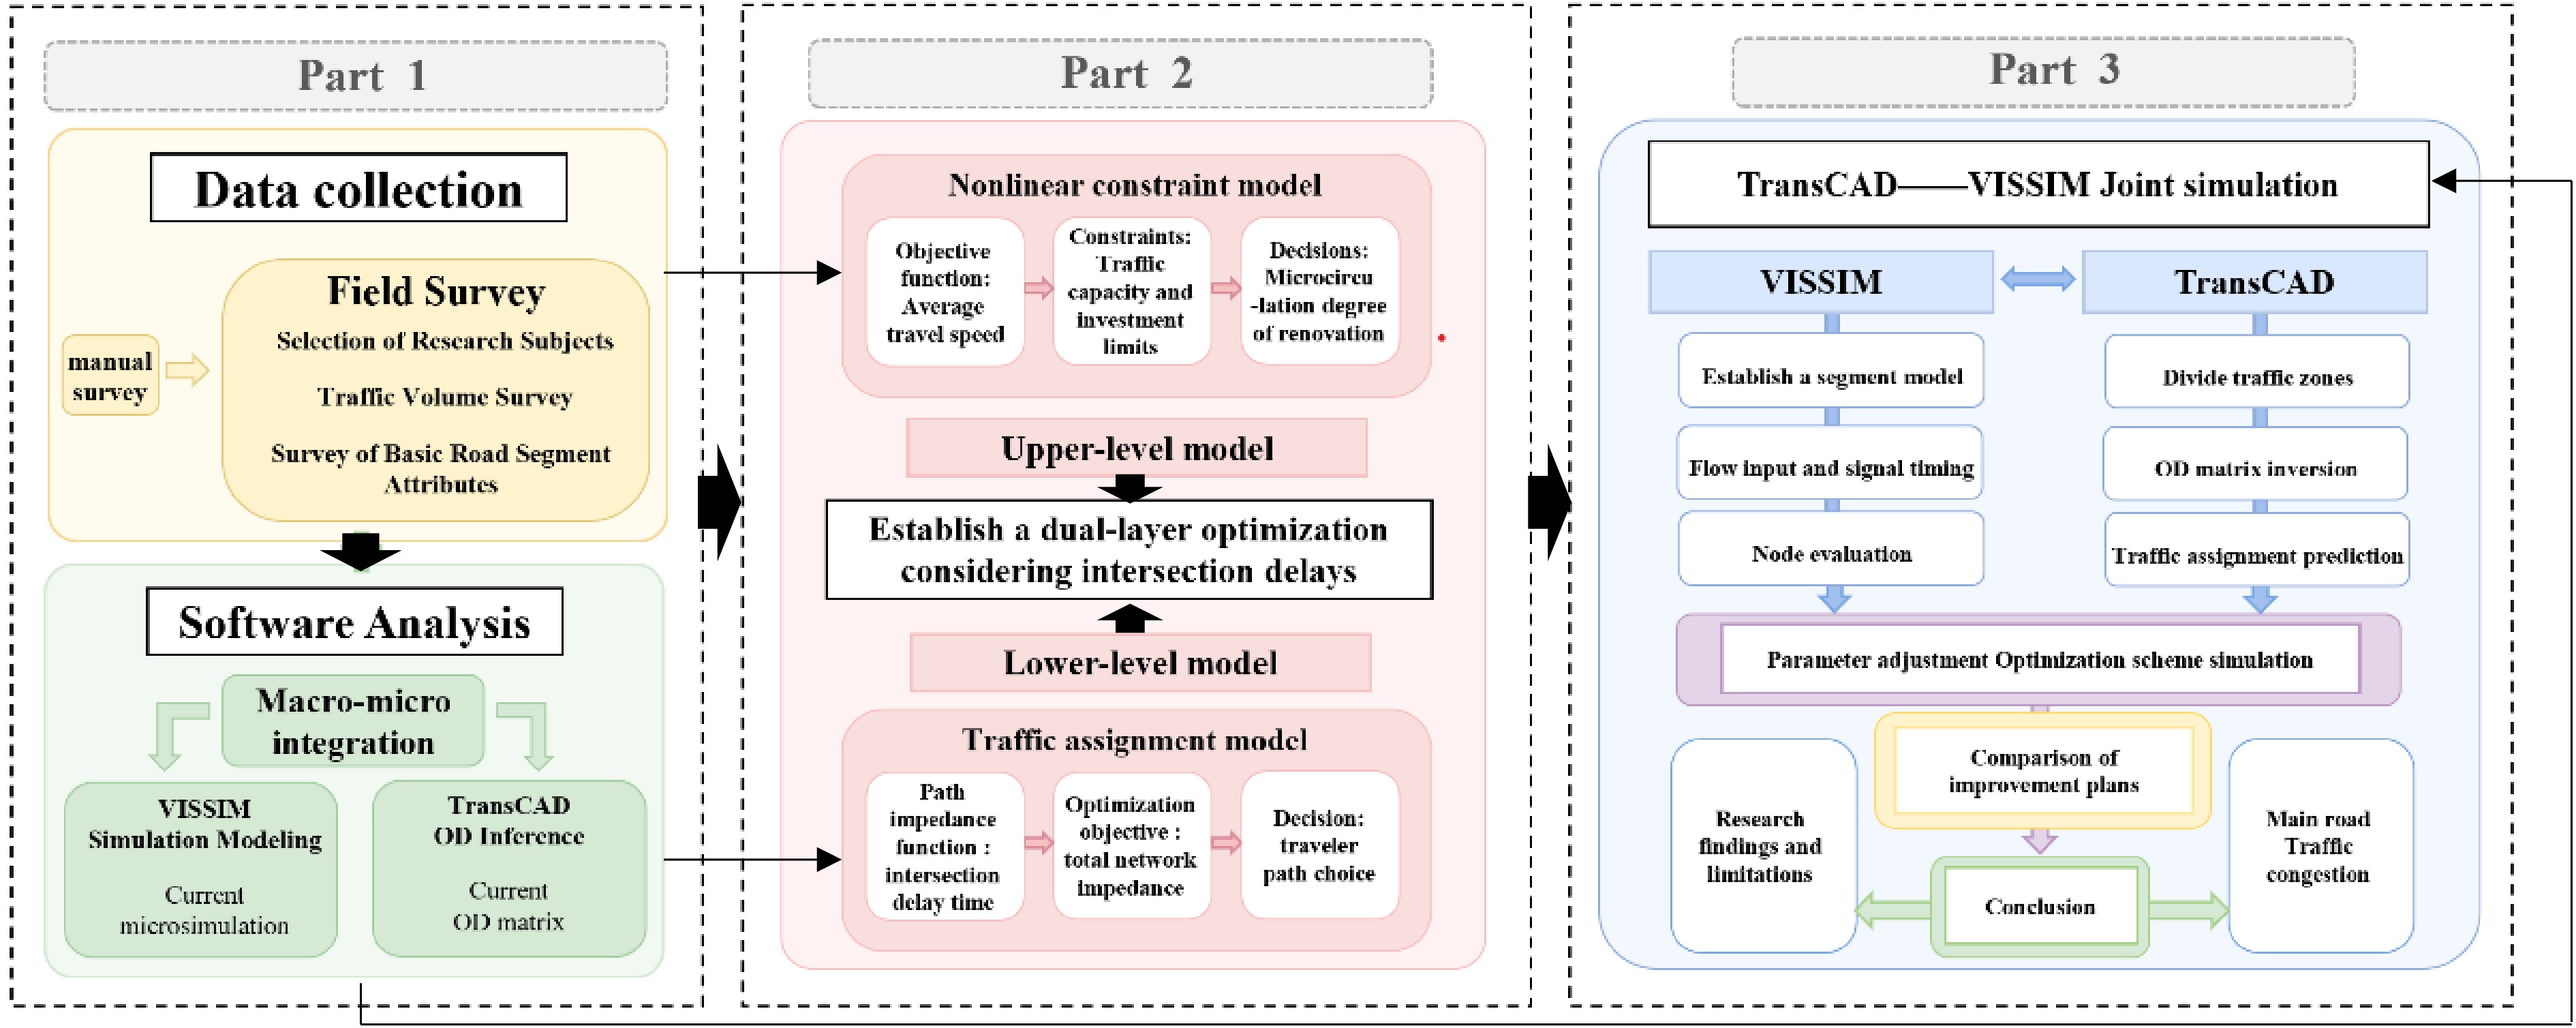
Figure 2.
Methodological framework.
-
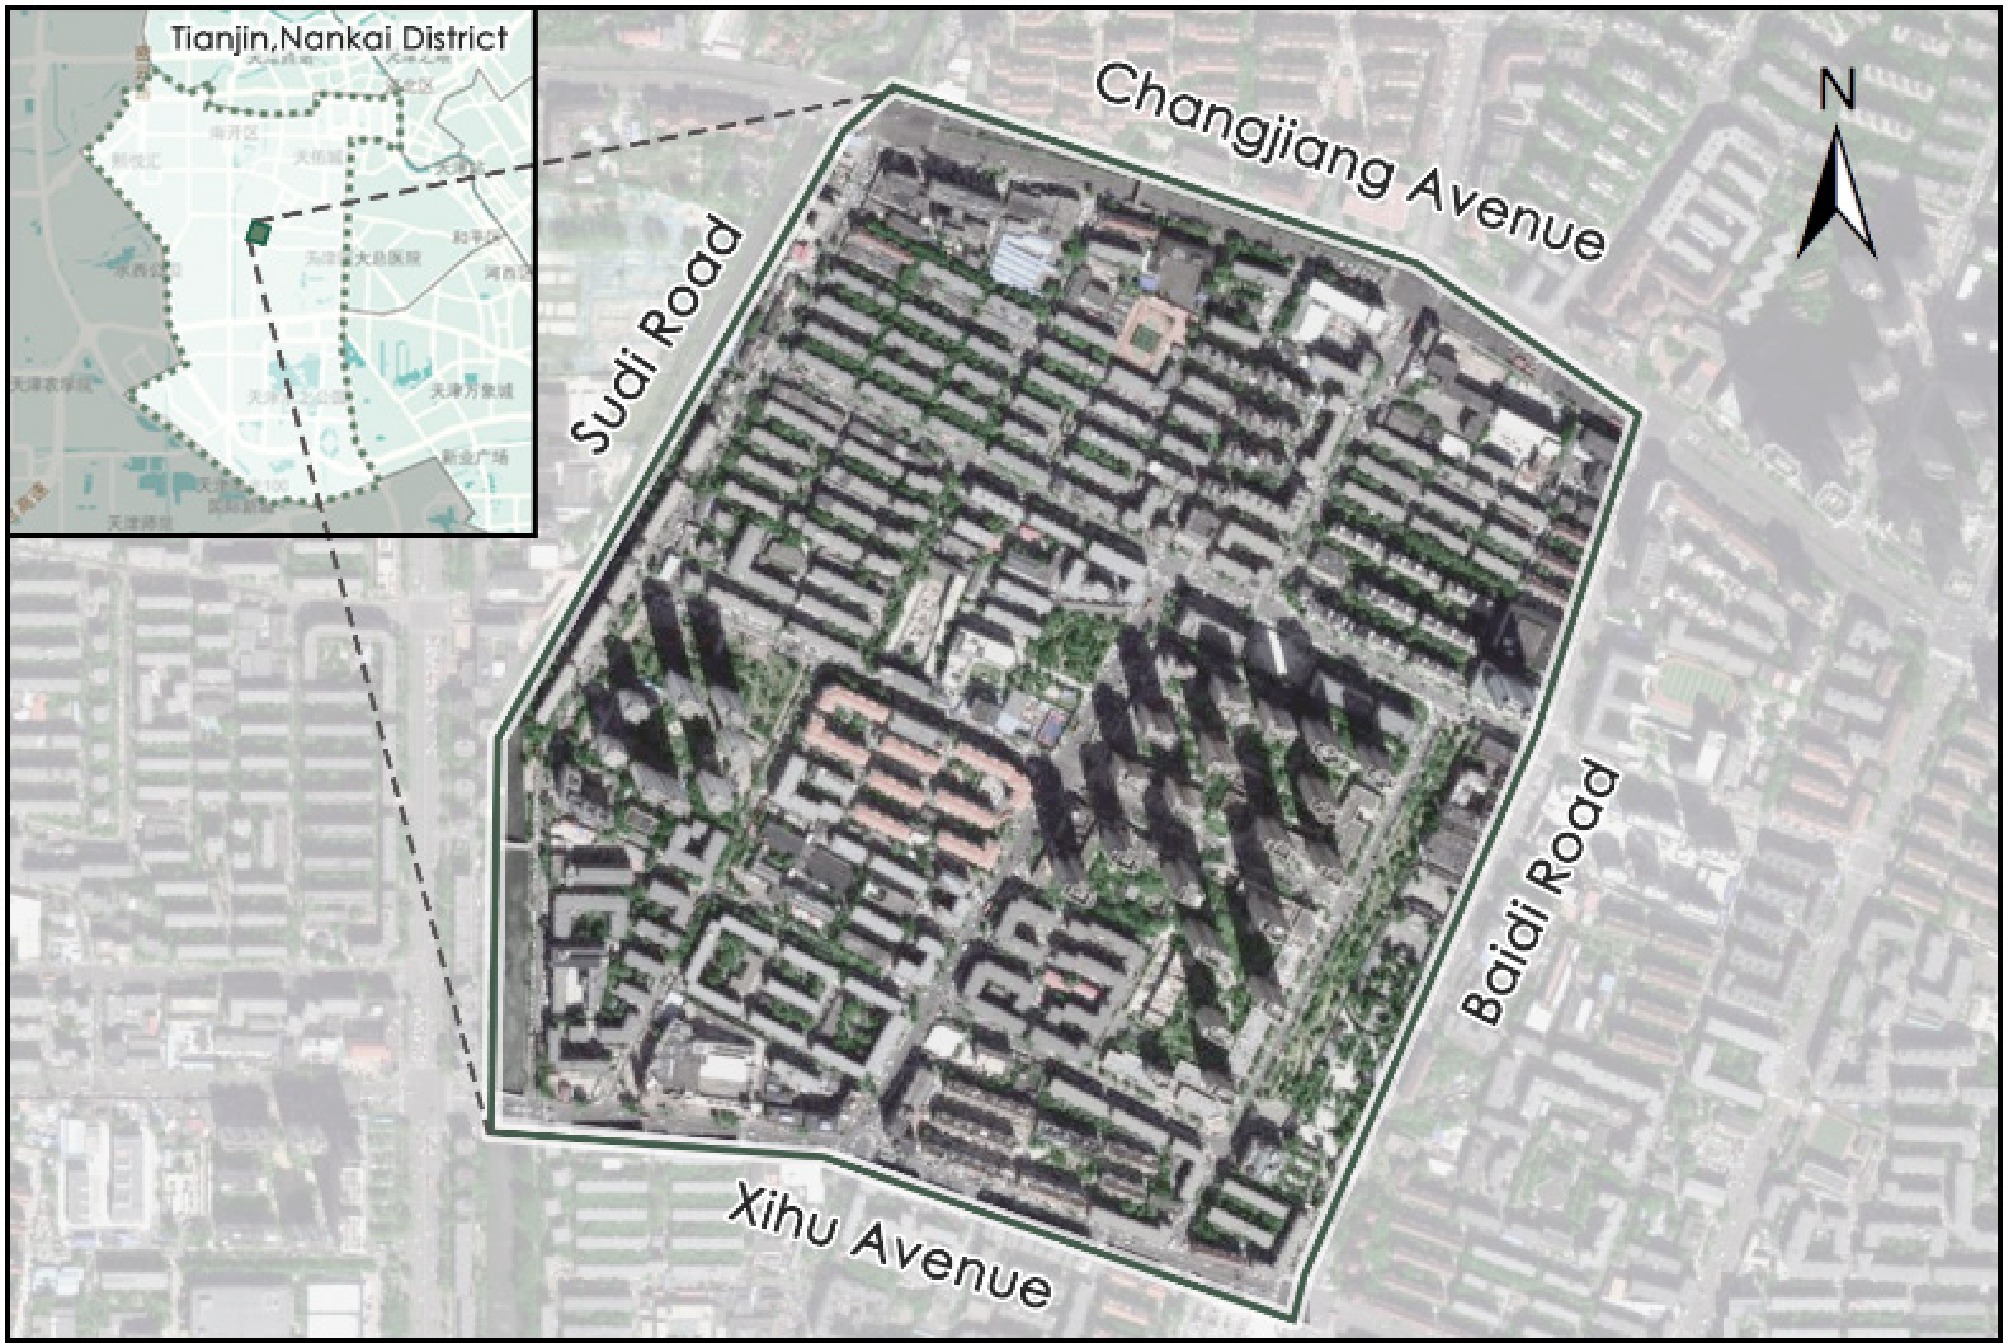
Figure 3.
Location of the study area.
-
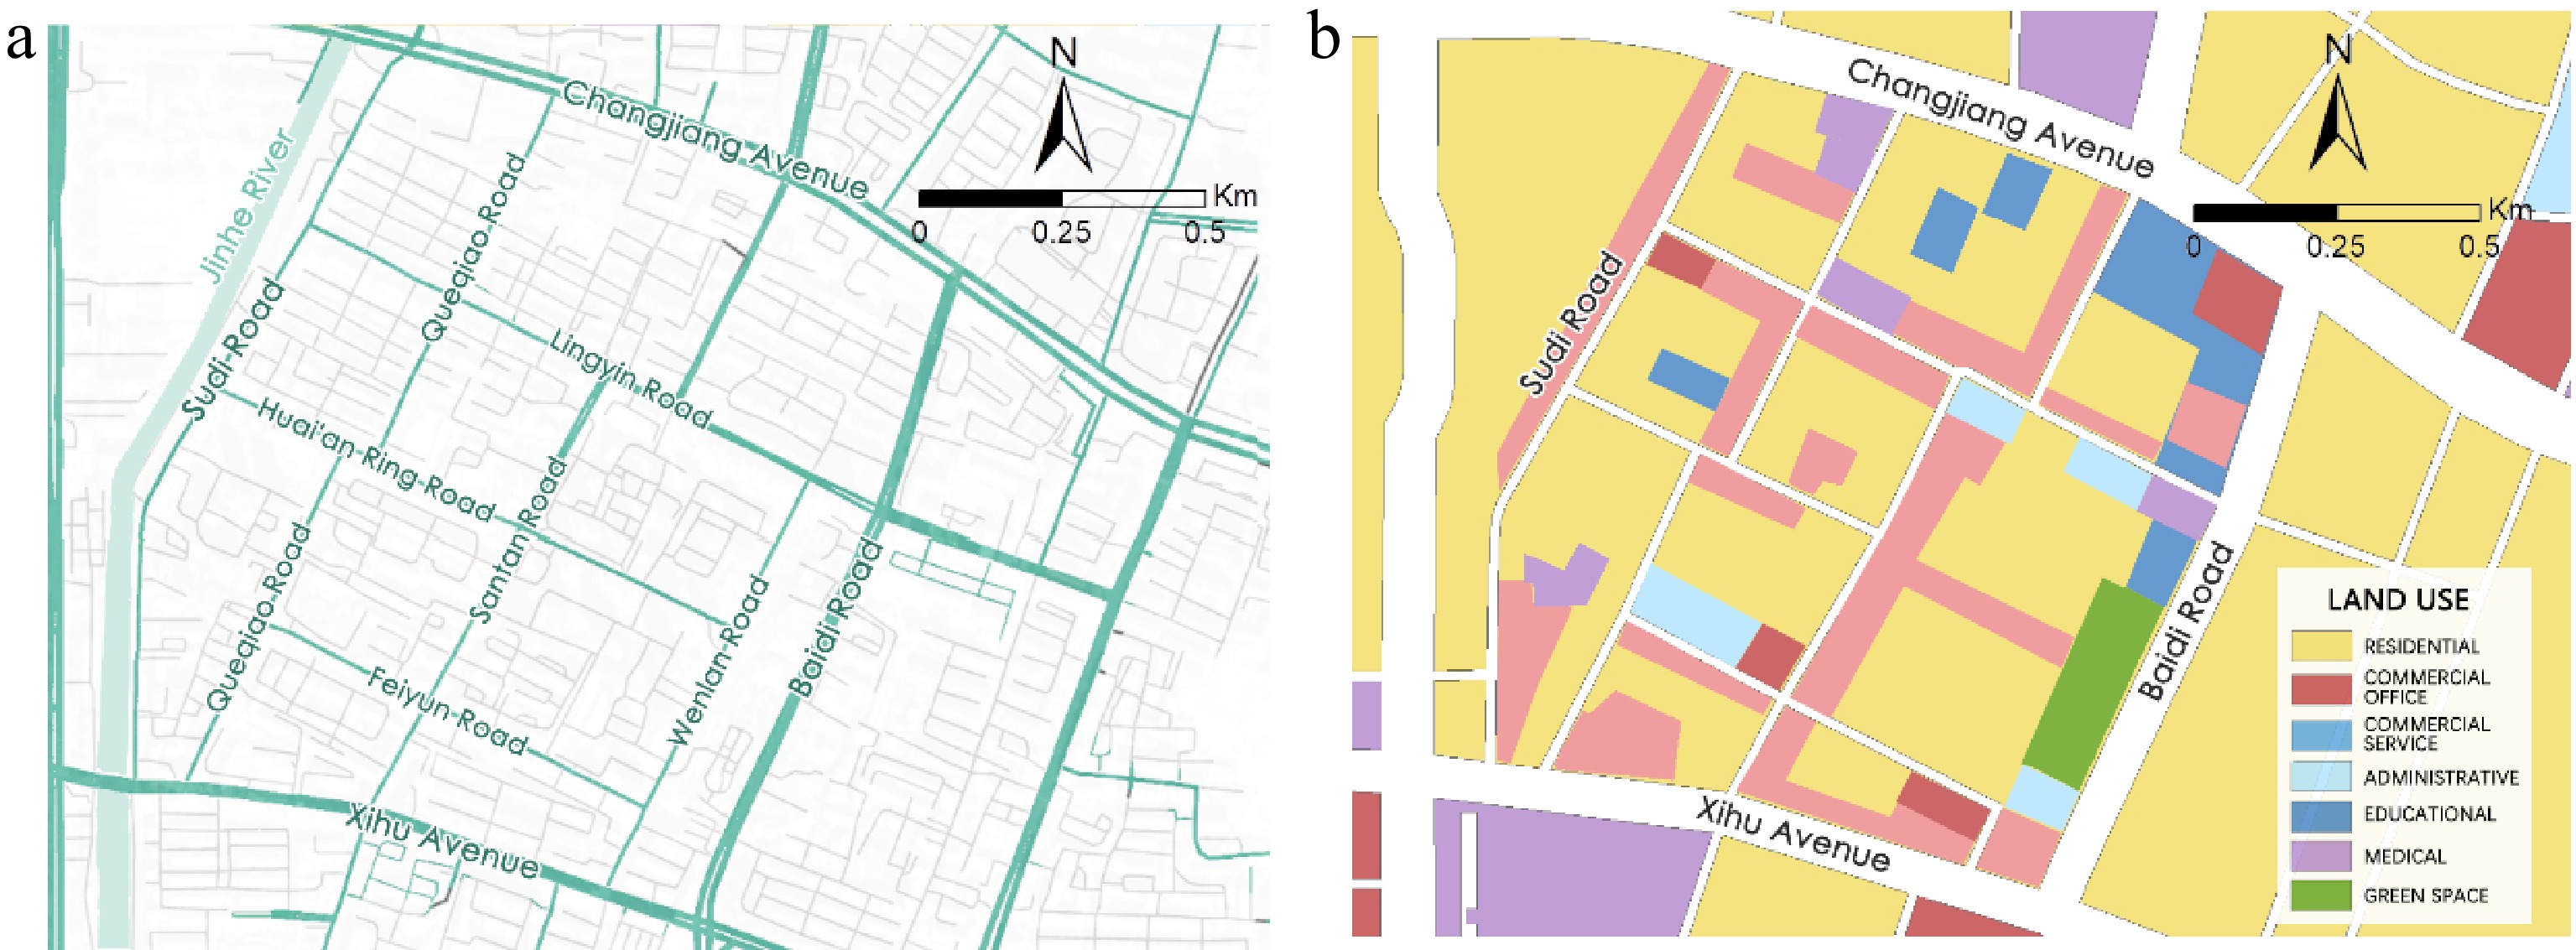
Figure 4.
(a) Road system and (b) land use distribution of the study area.
-
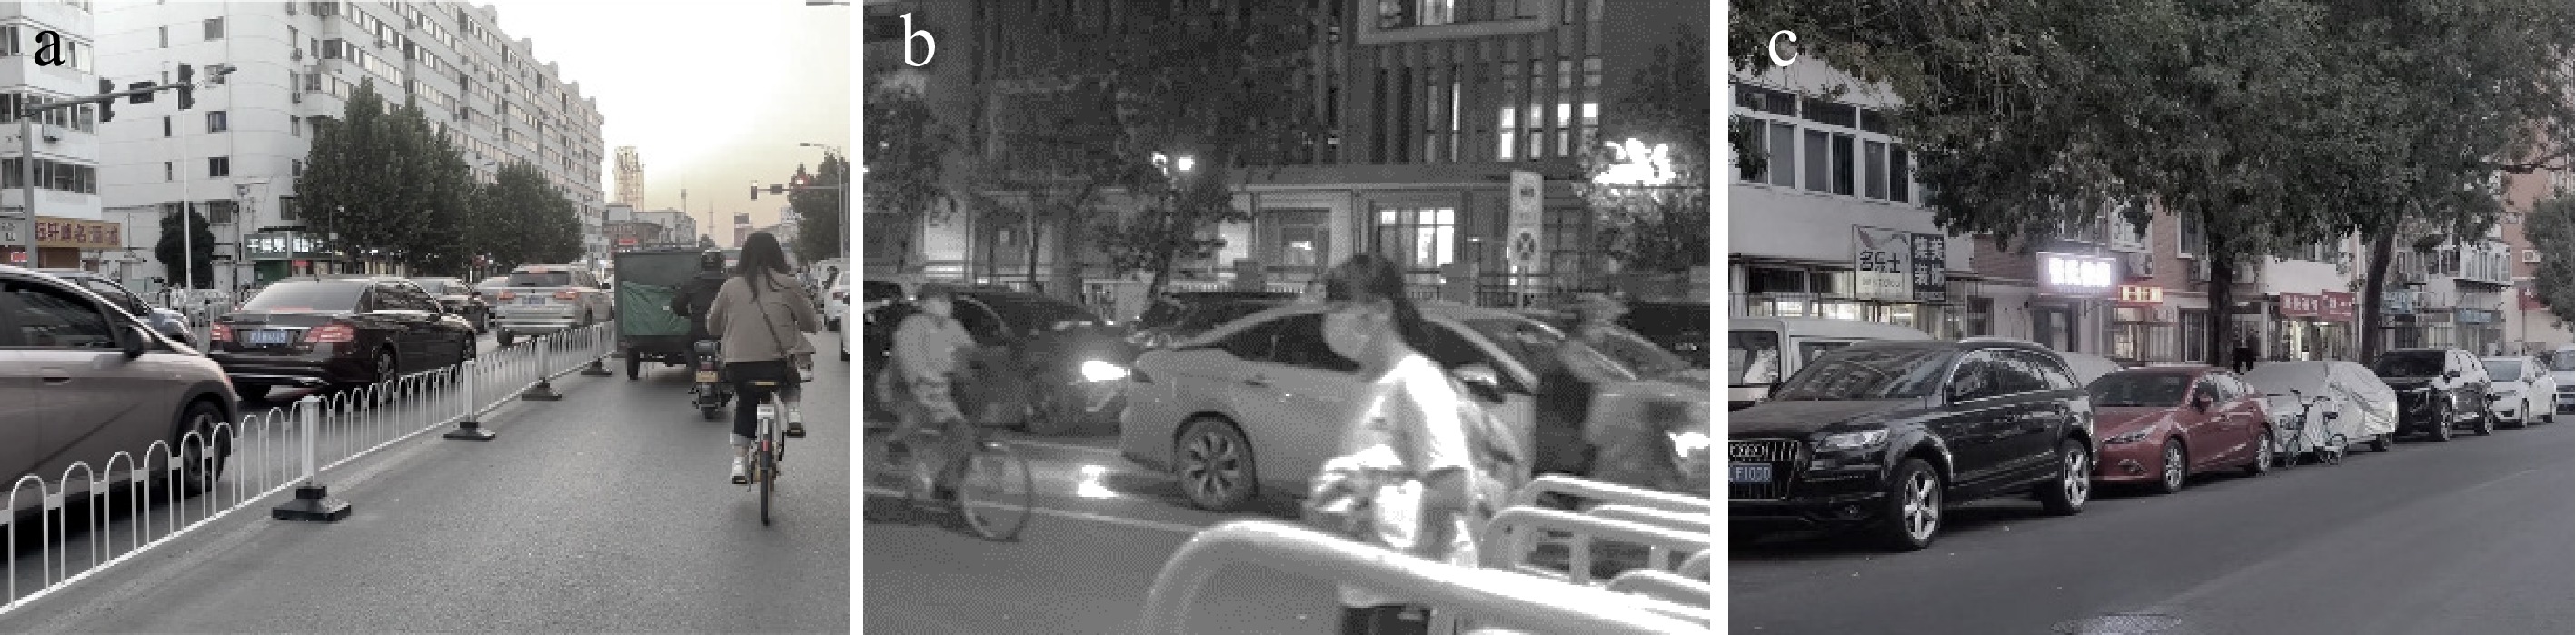
Figure 5.
(a) Congestion during peak hours, (b) traffic safety concerns, and (c) using the road to park.
-
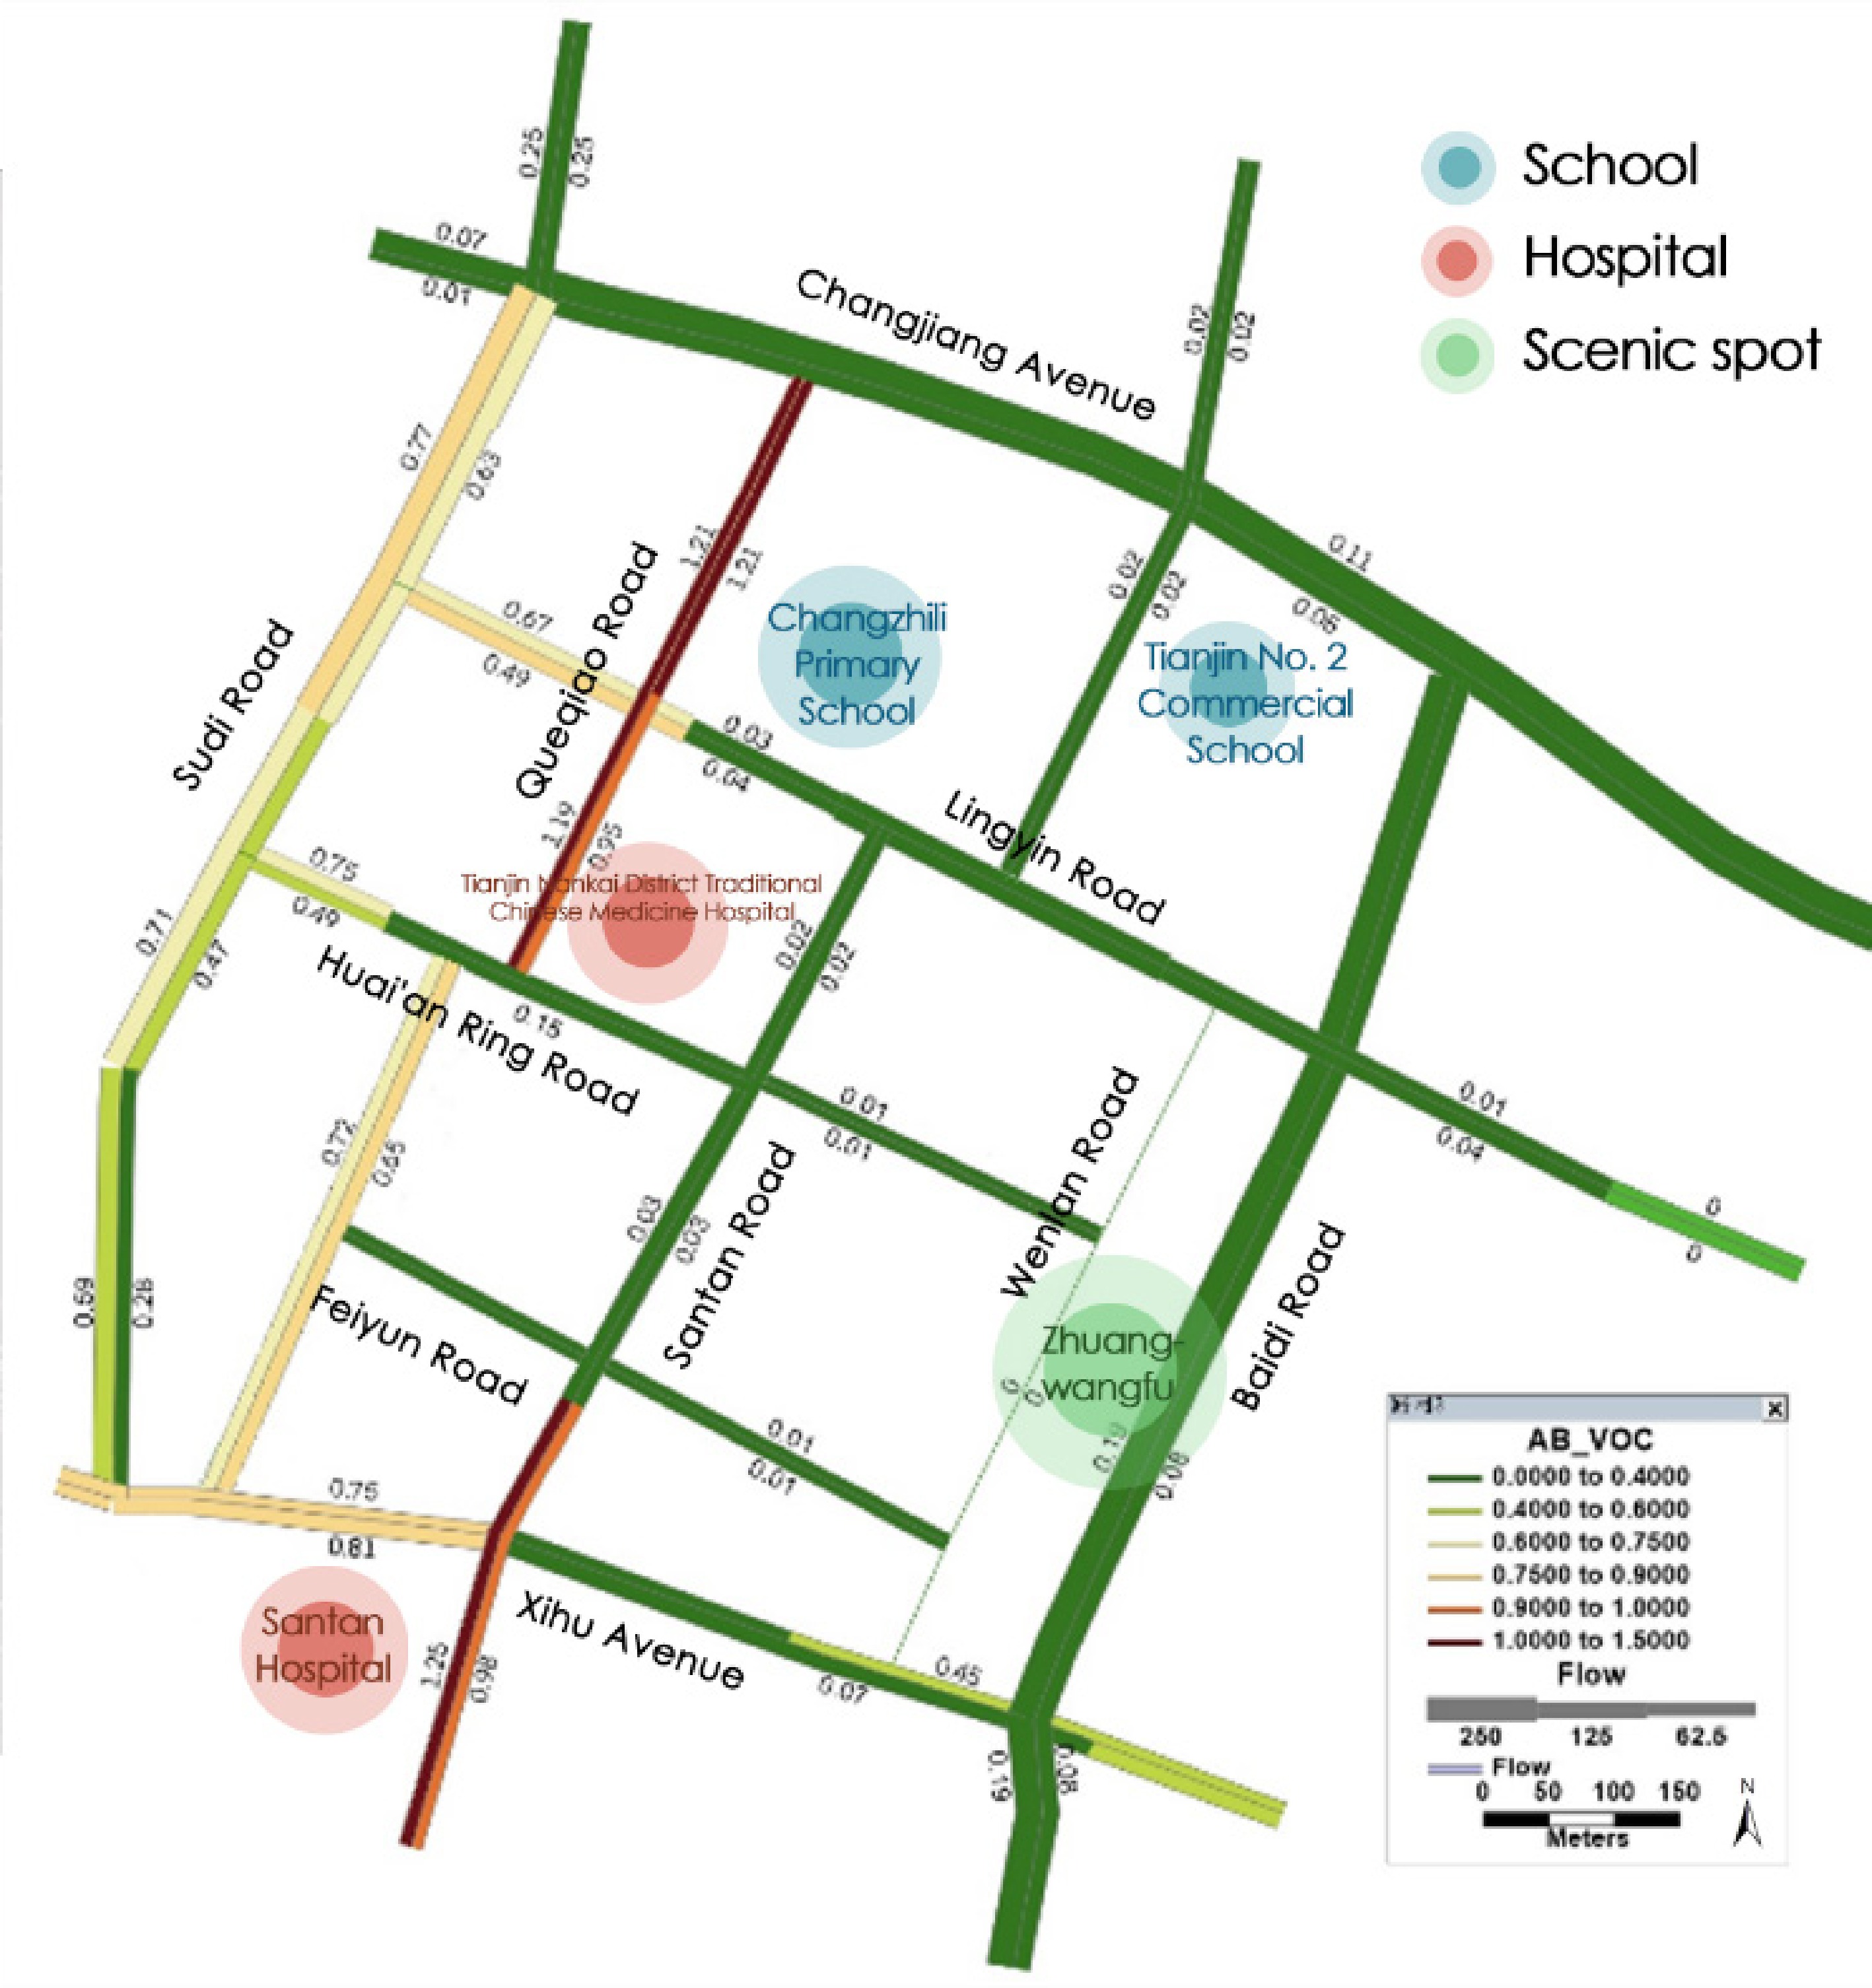
Figure 6.
Traffic service levels assigned by TransCAD.
-
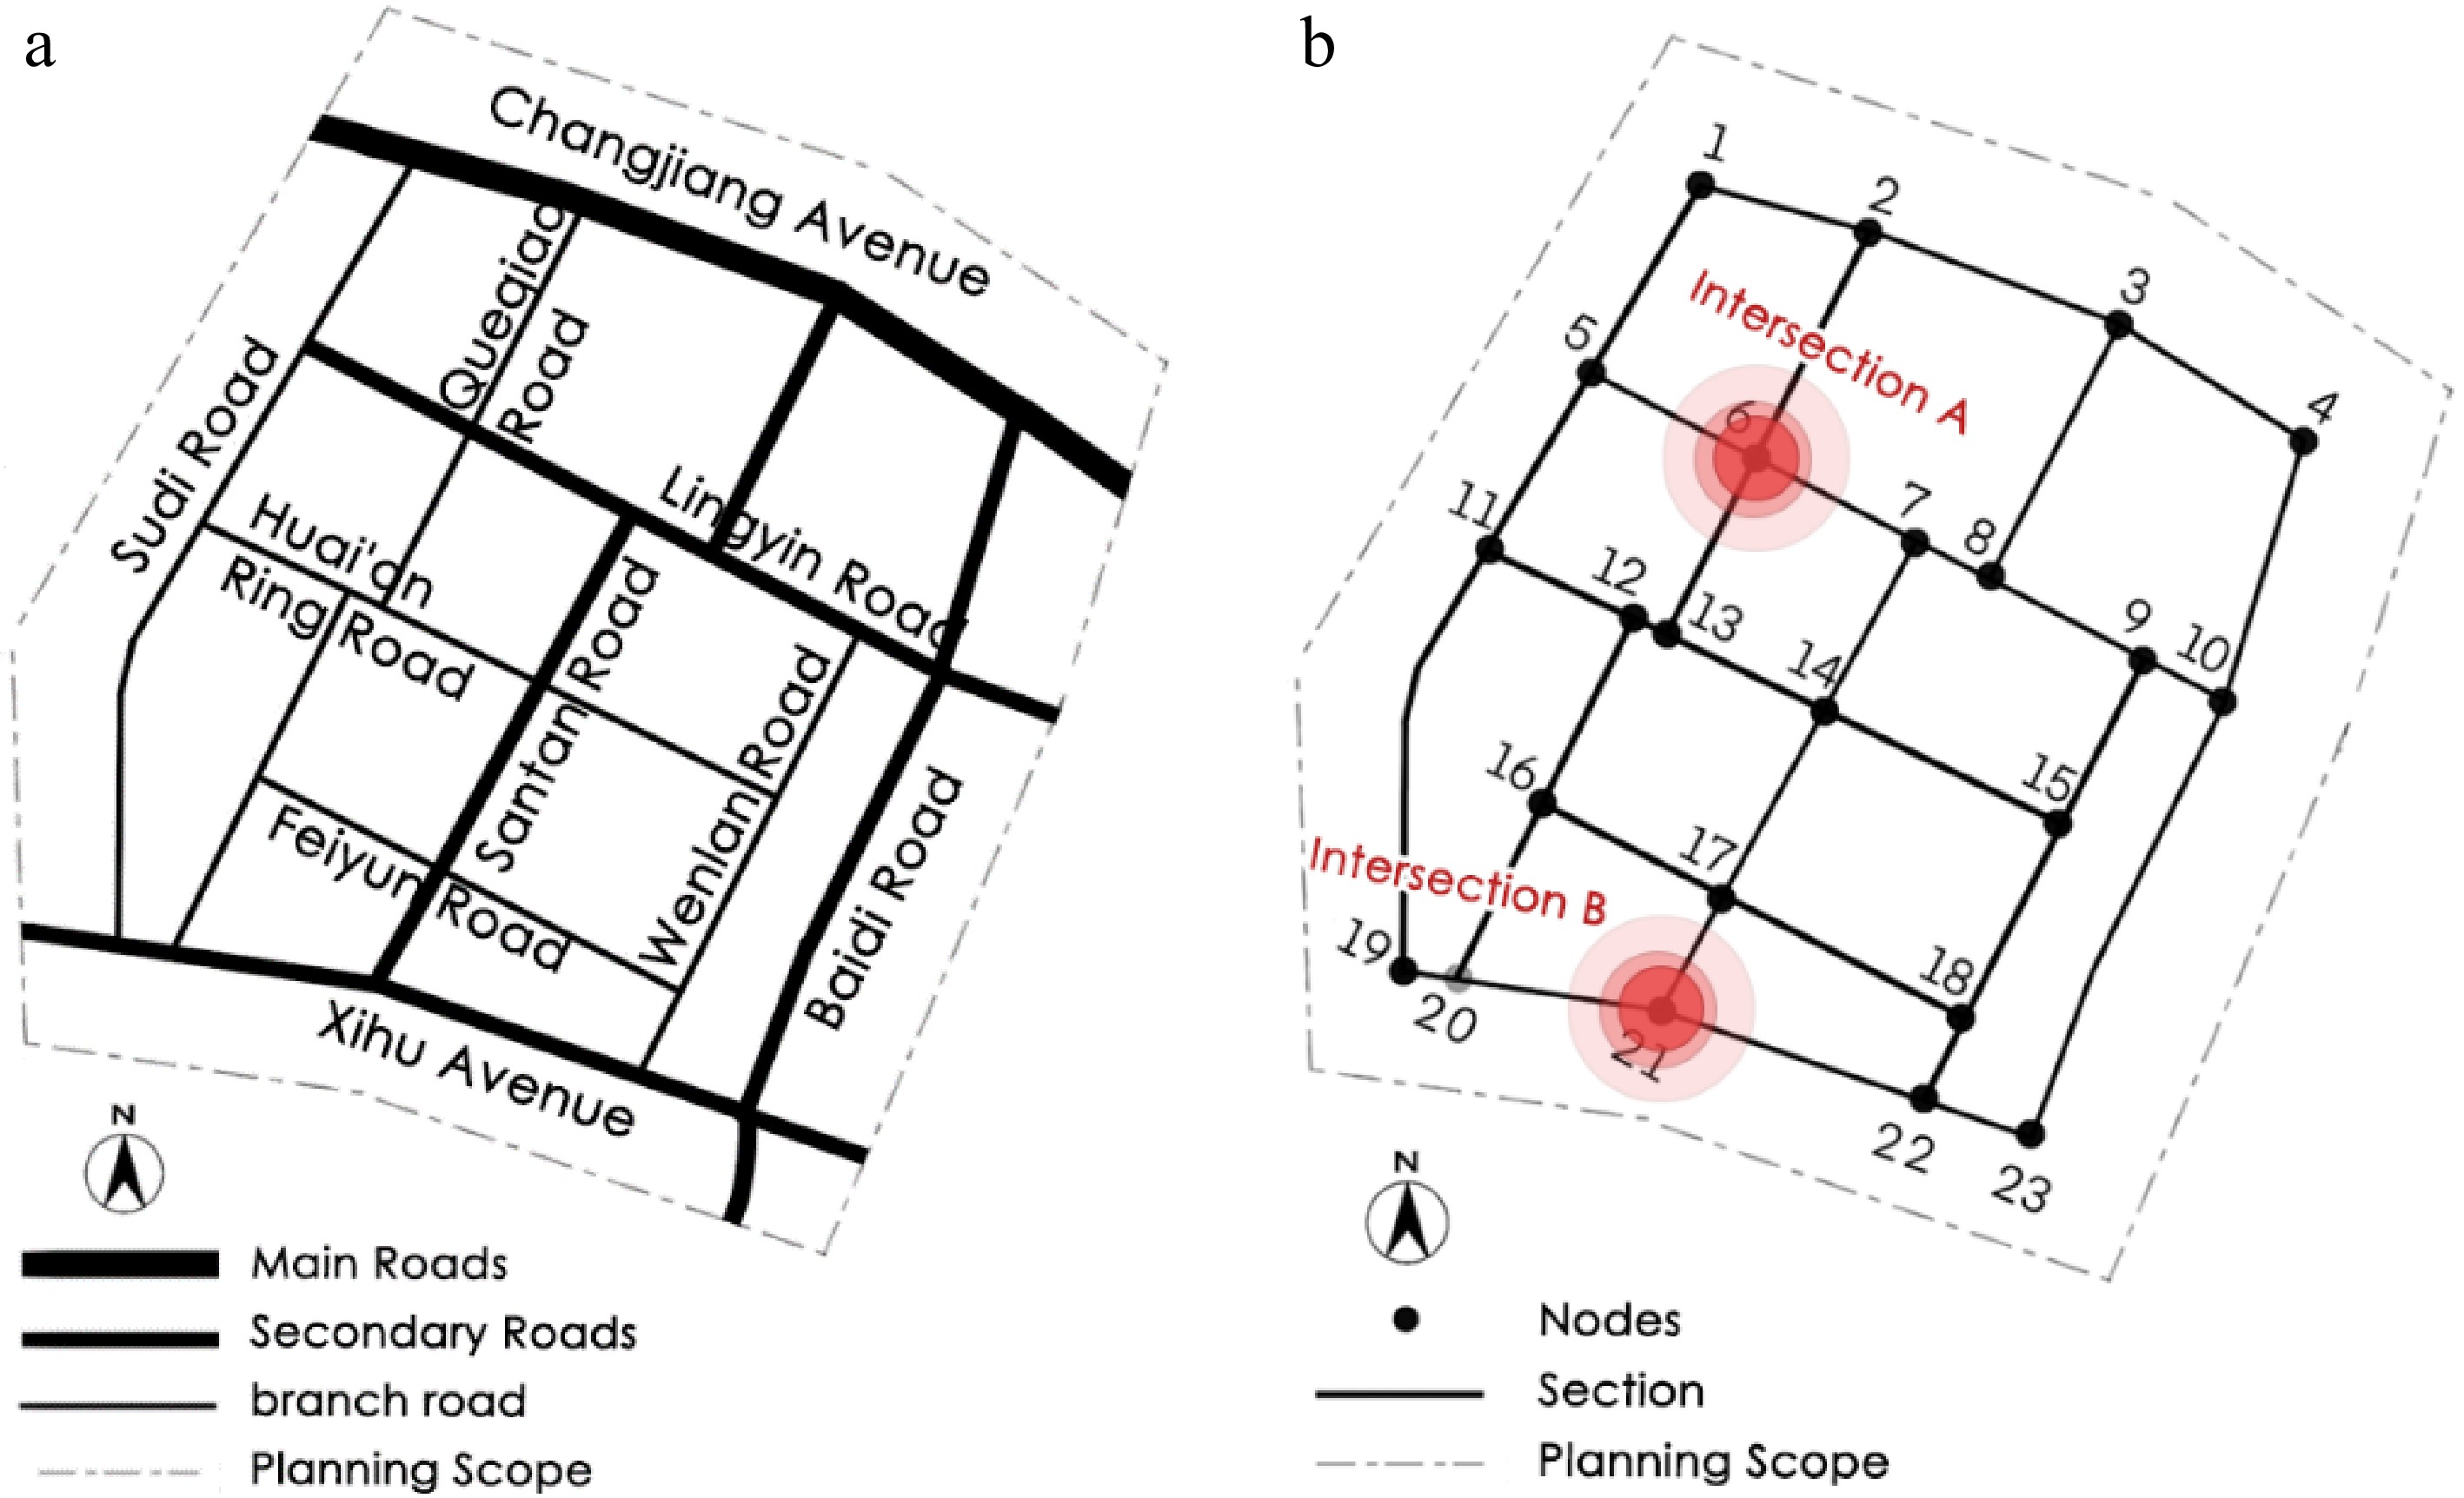
Figure 7.
(a) Road network and (b) network nodes of the study area.
-
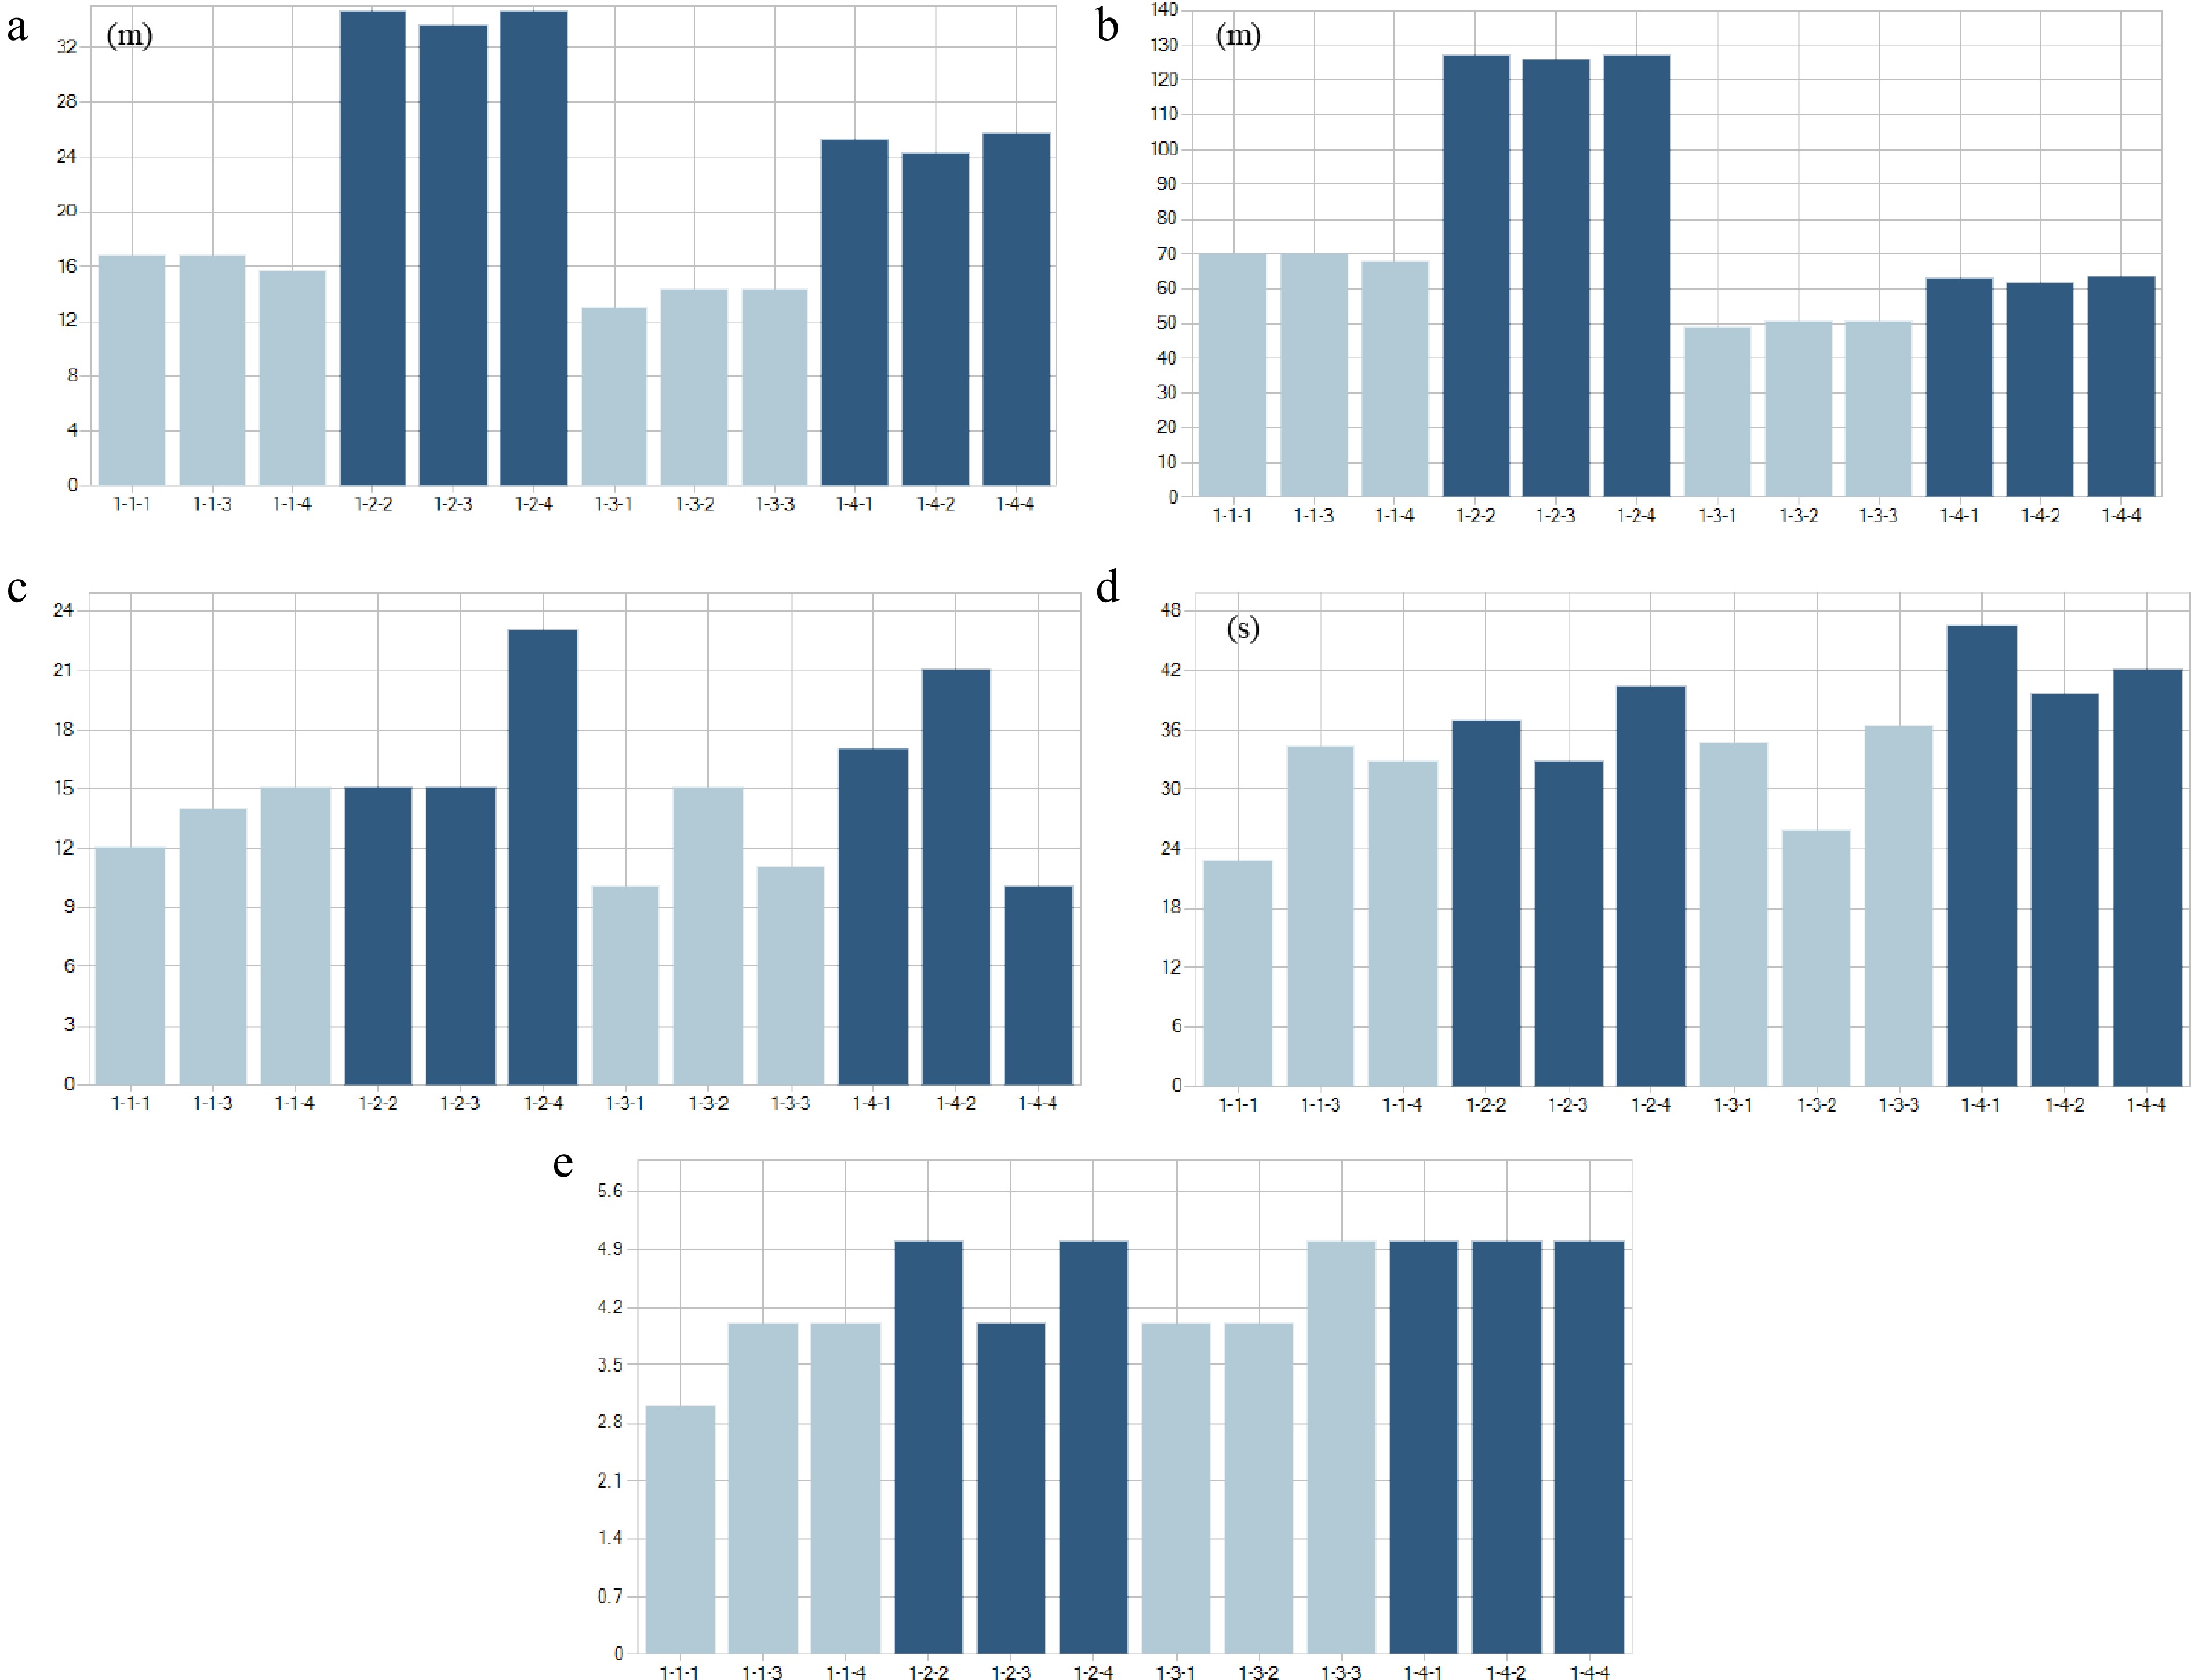
Figure 8.
(a) Vehicle queue length, (b) maximum queue length, (c) number of vehicles, (d) average vehicle delay, and (e) service level of each road segment at Intersection A.
-
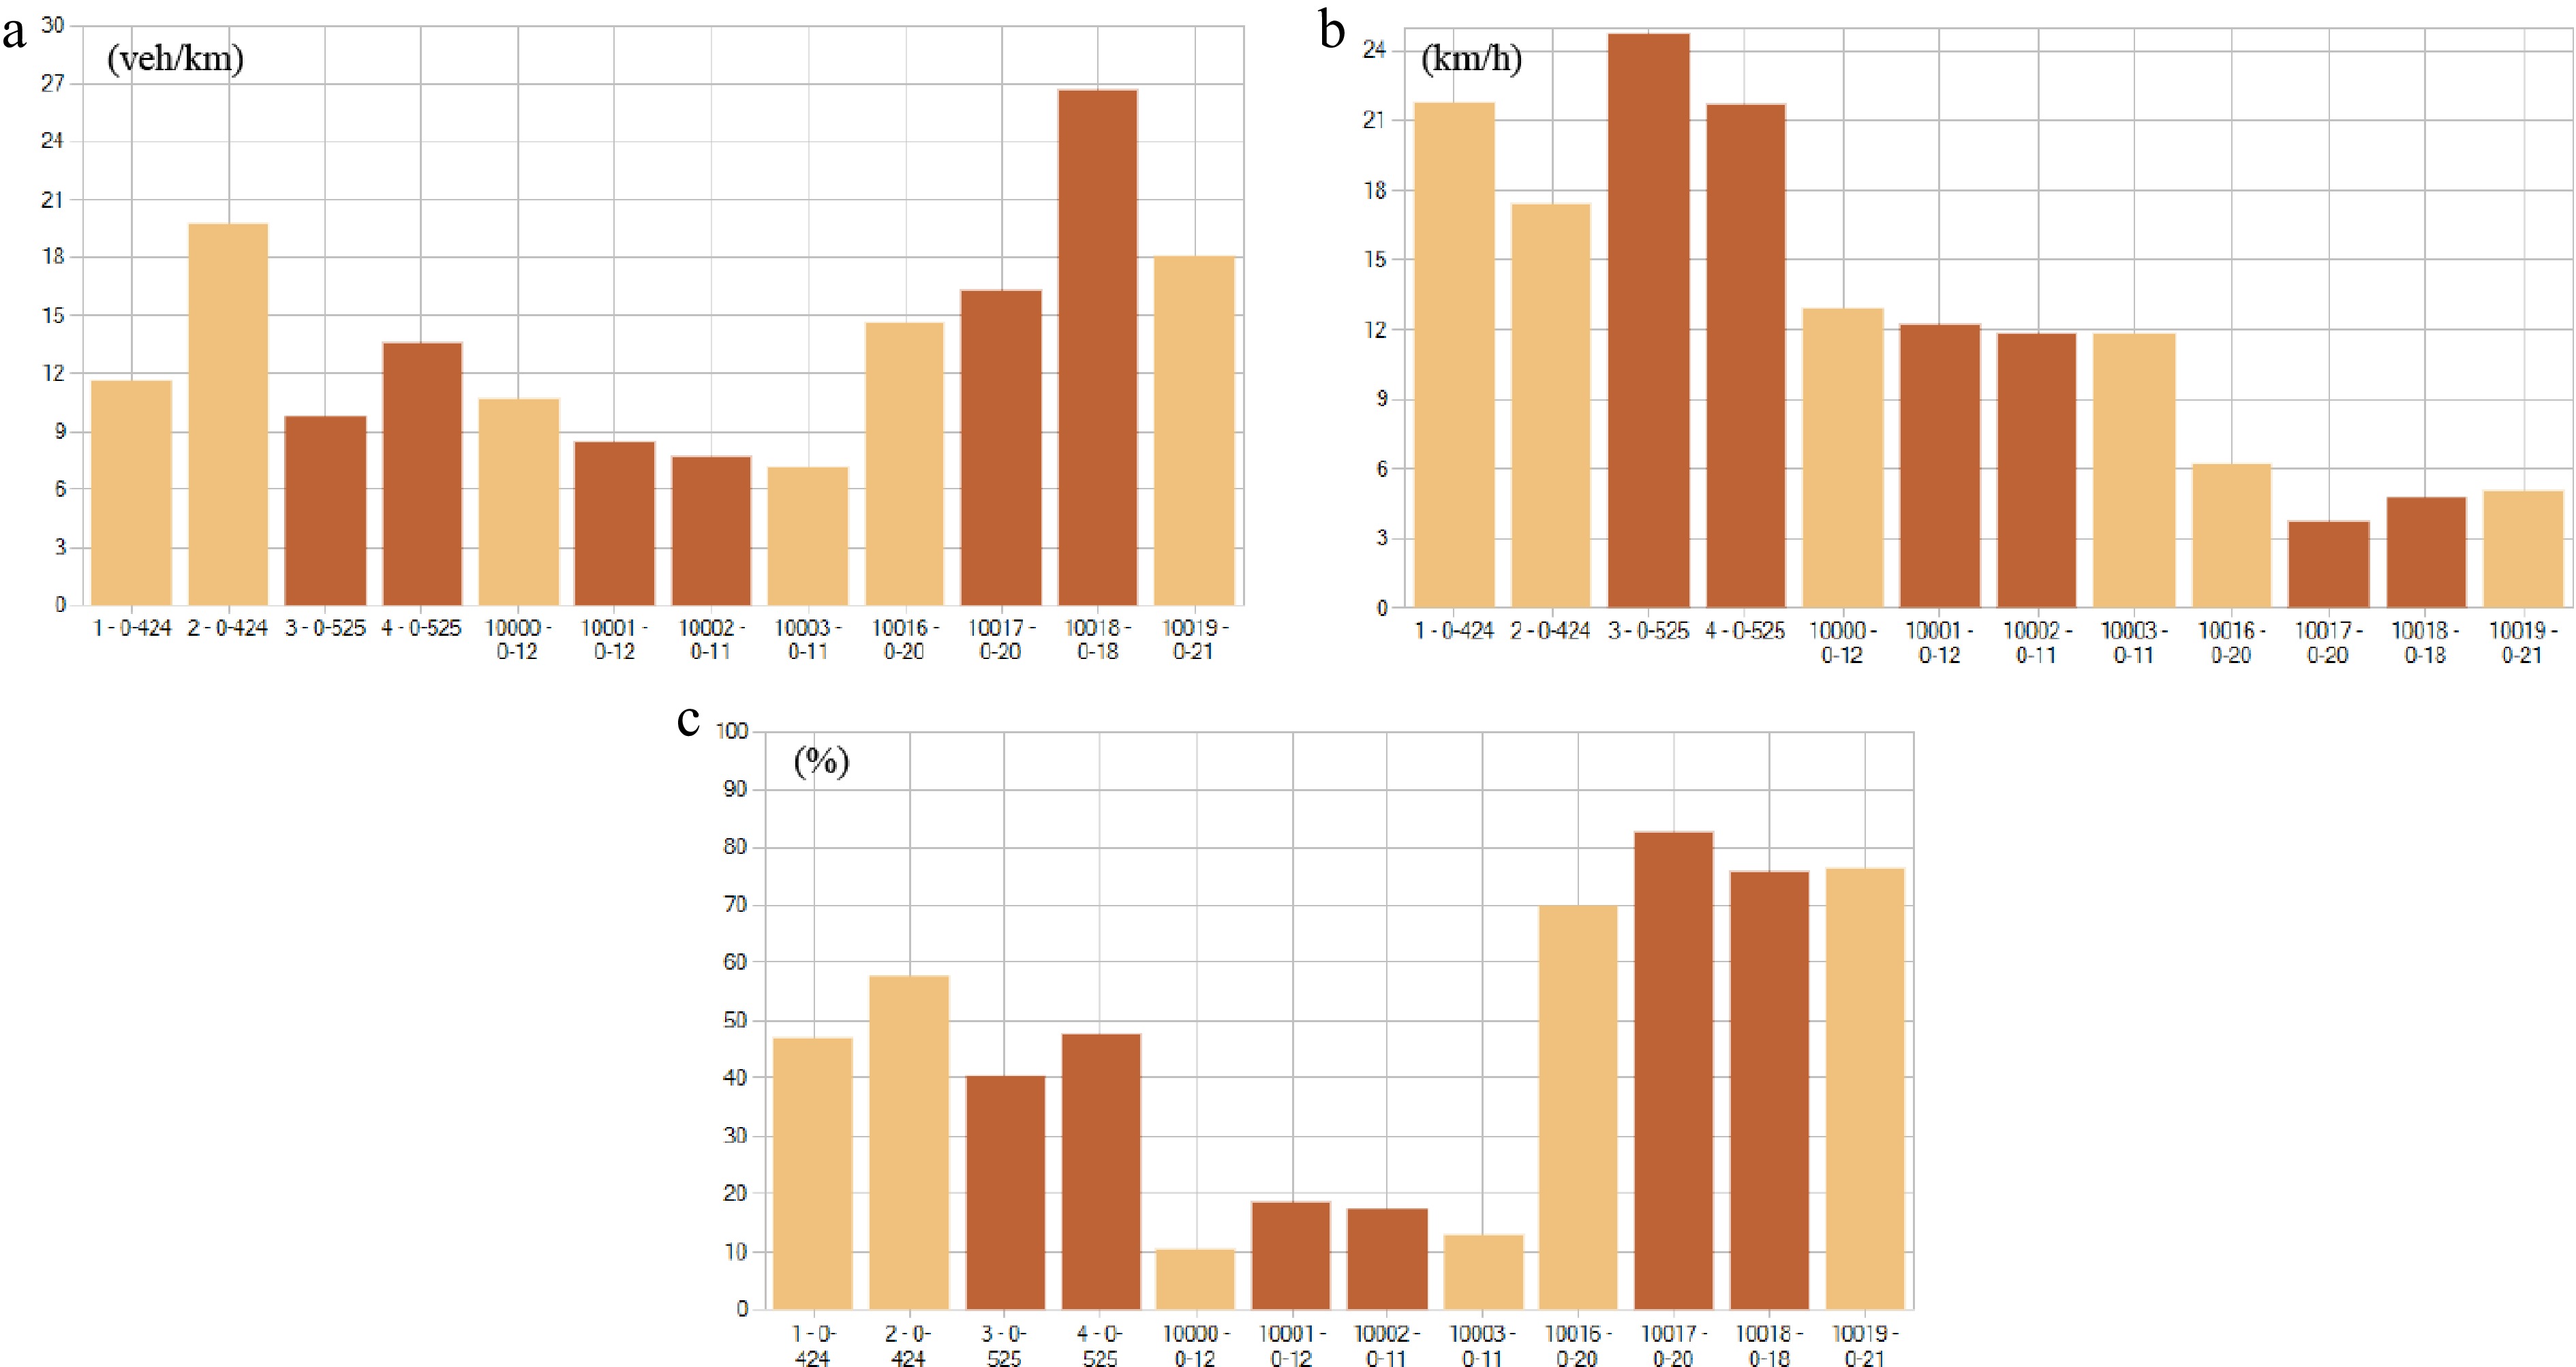
Figure 9.
(a) Vehicle density, (b) speed, and (c) relative delay of road segments at Intersection A.
-
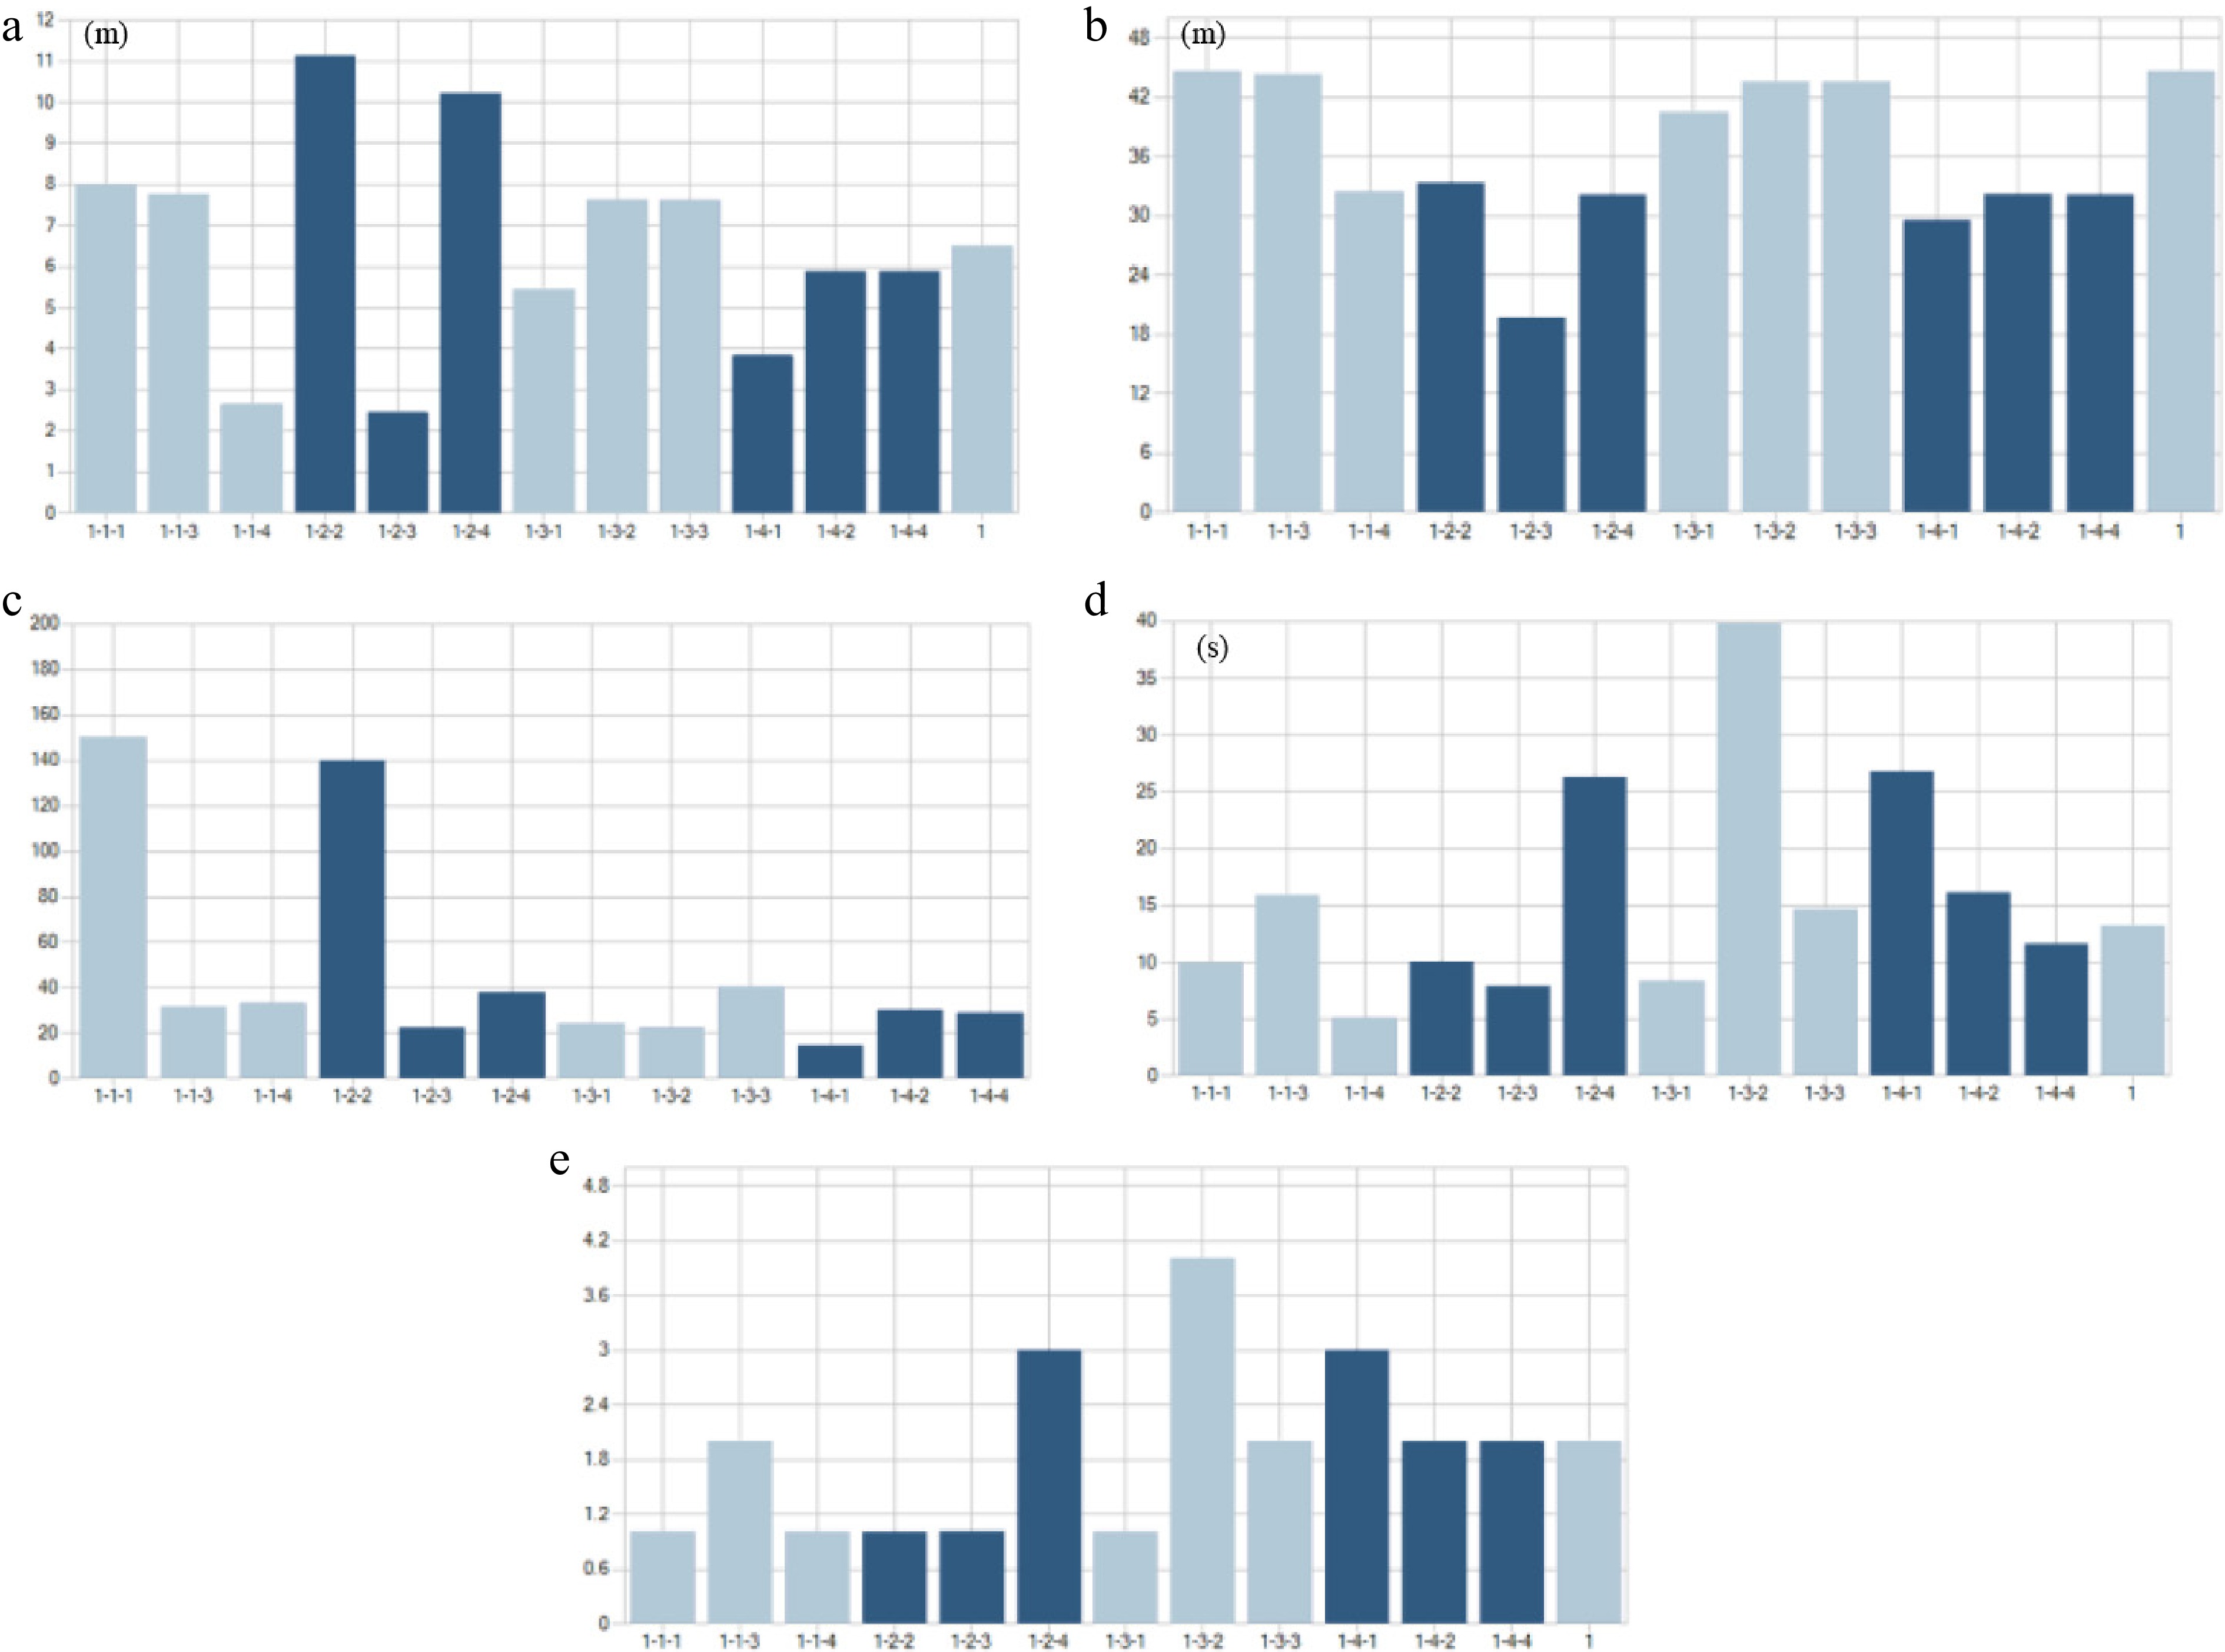
Figure 10.
(a) Vehicle queue length, (b) maximum queue length, (c) number of vehicles, (d) average vehicle delay, and (e) service level of each road segment at Intersection B.
-
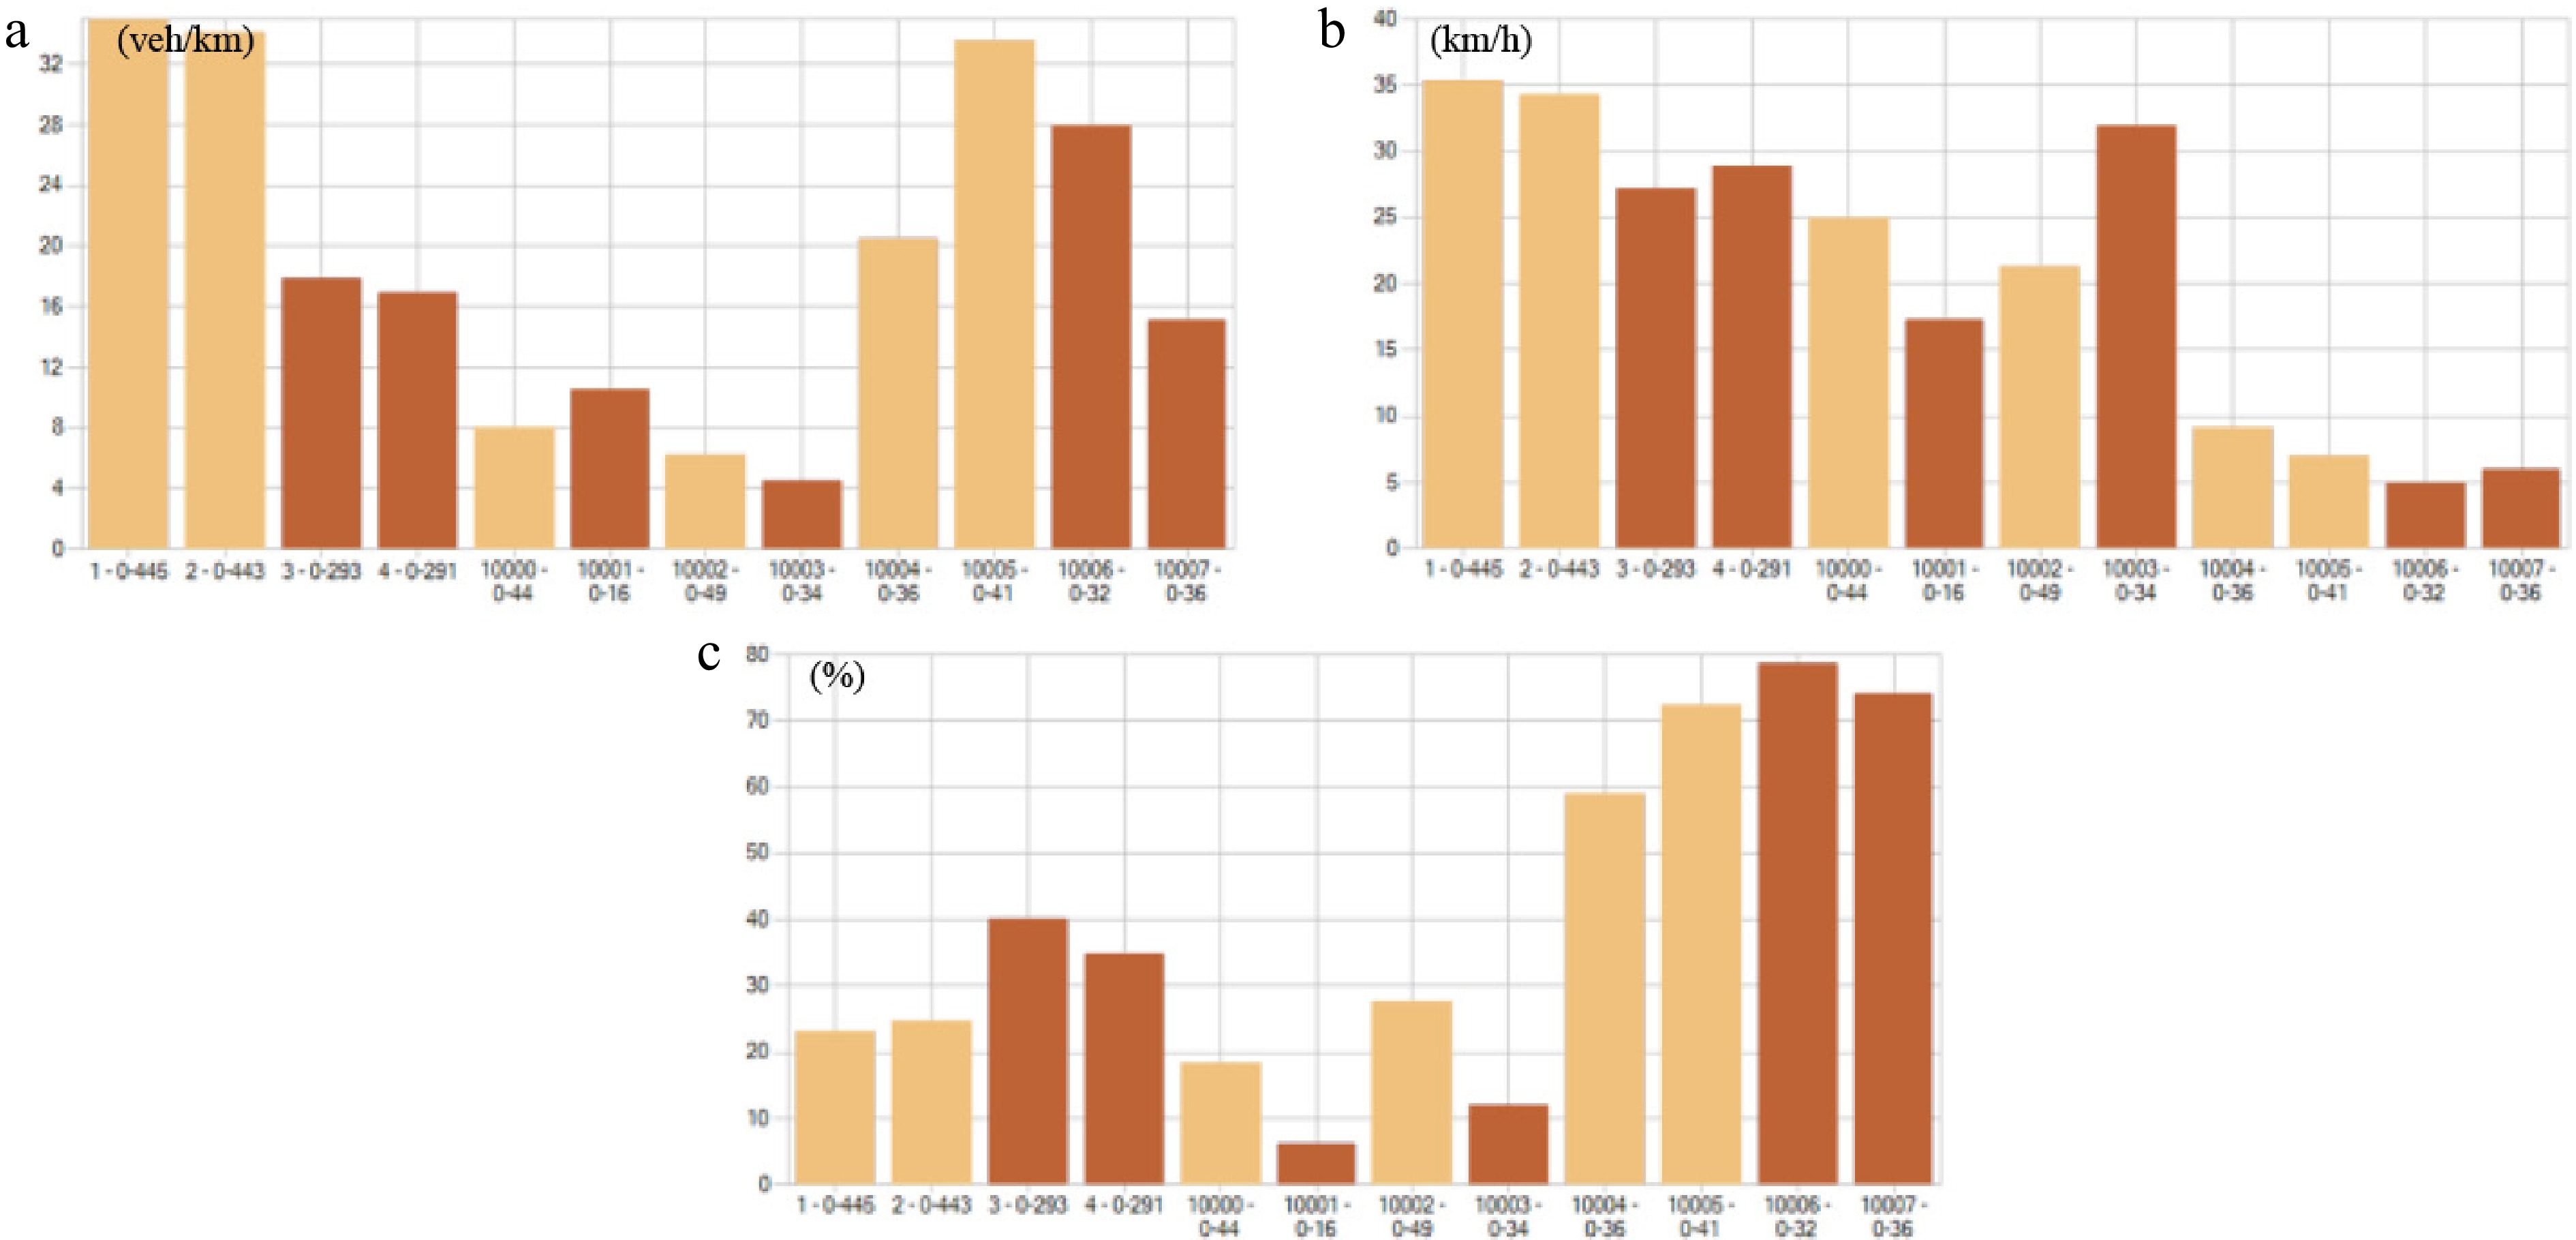
Figure 11.
Vehicle density (a), speed (b), and relative delay (c) of road segments at Intersection B.
-
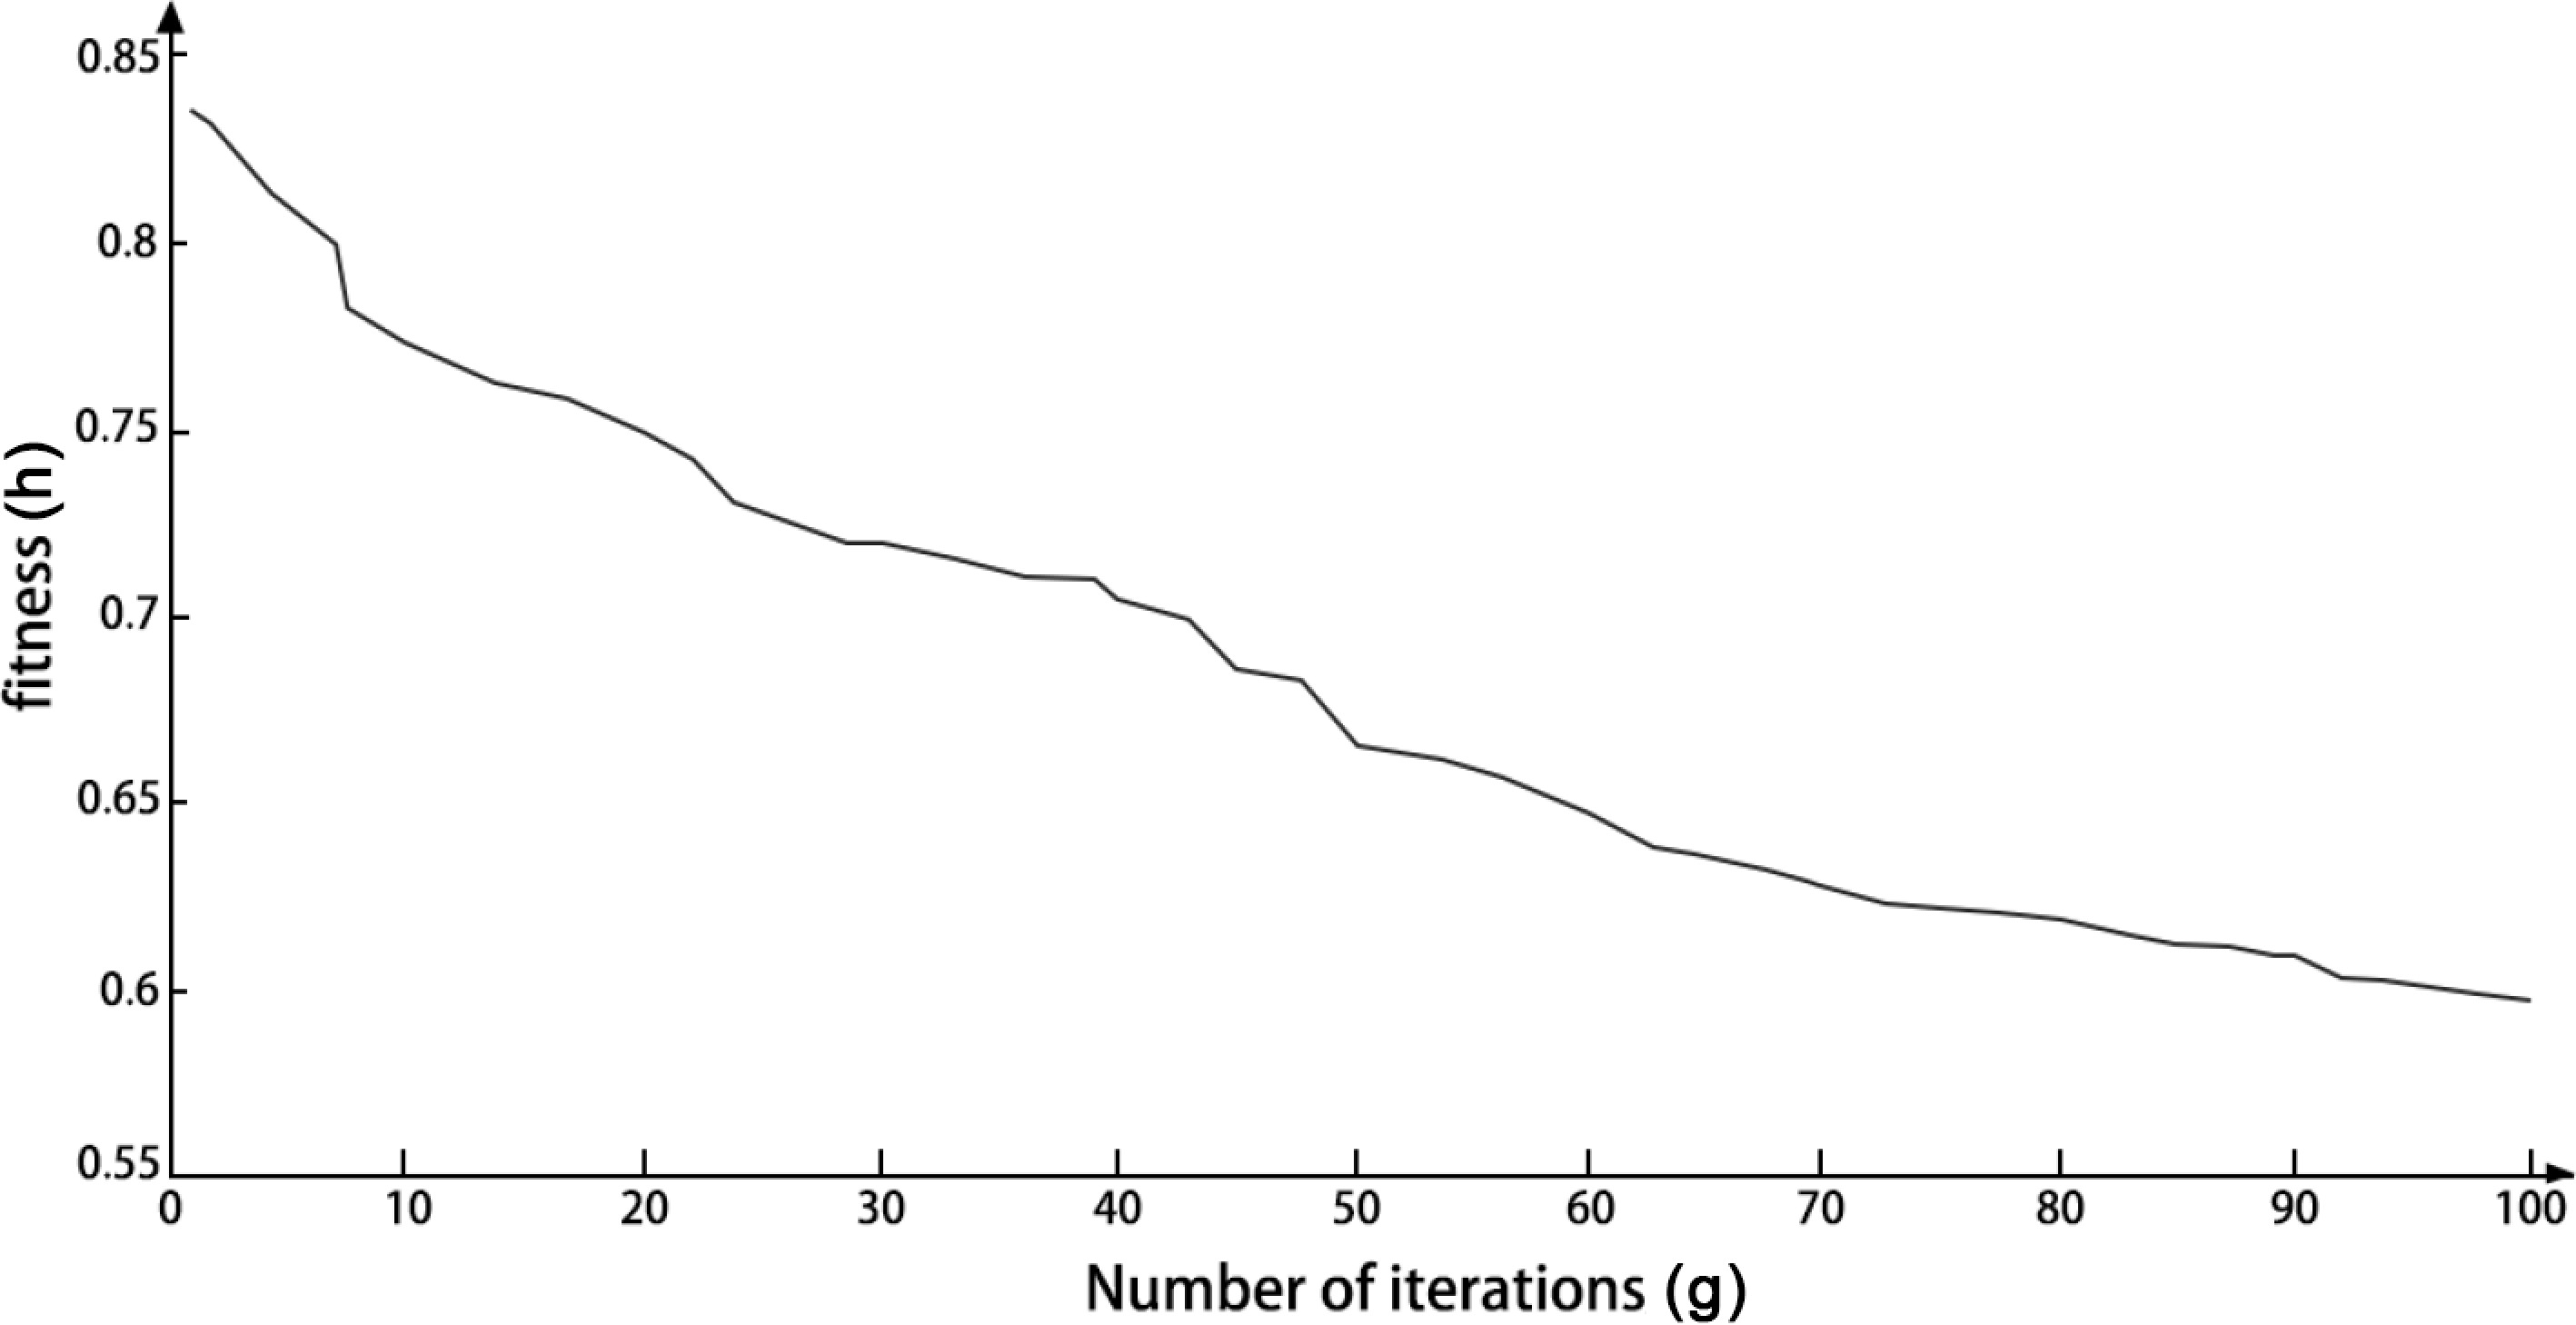
Figure 12.
Iterative curve of the genetic algorithm.
-
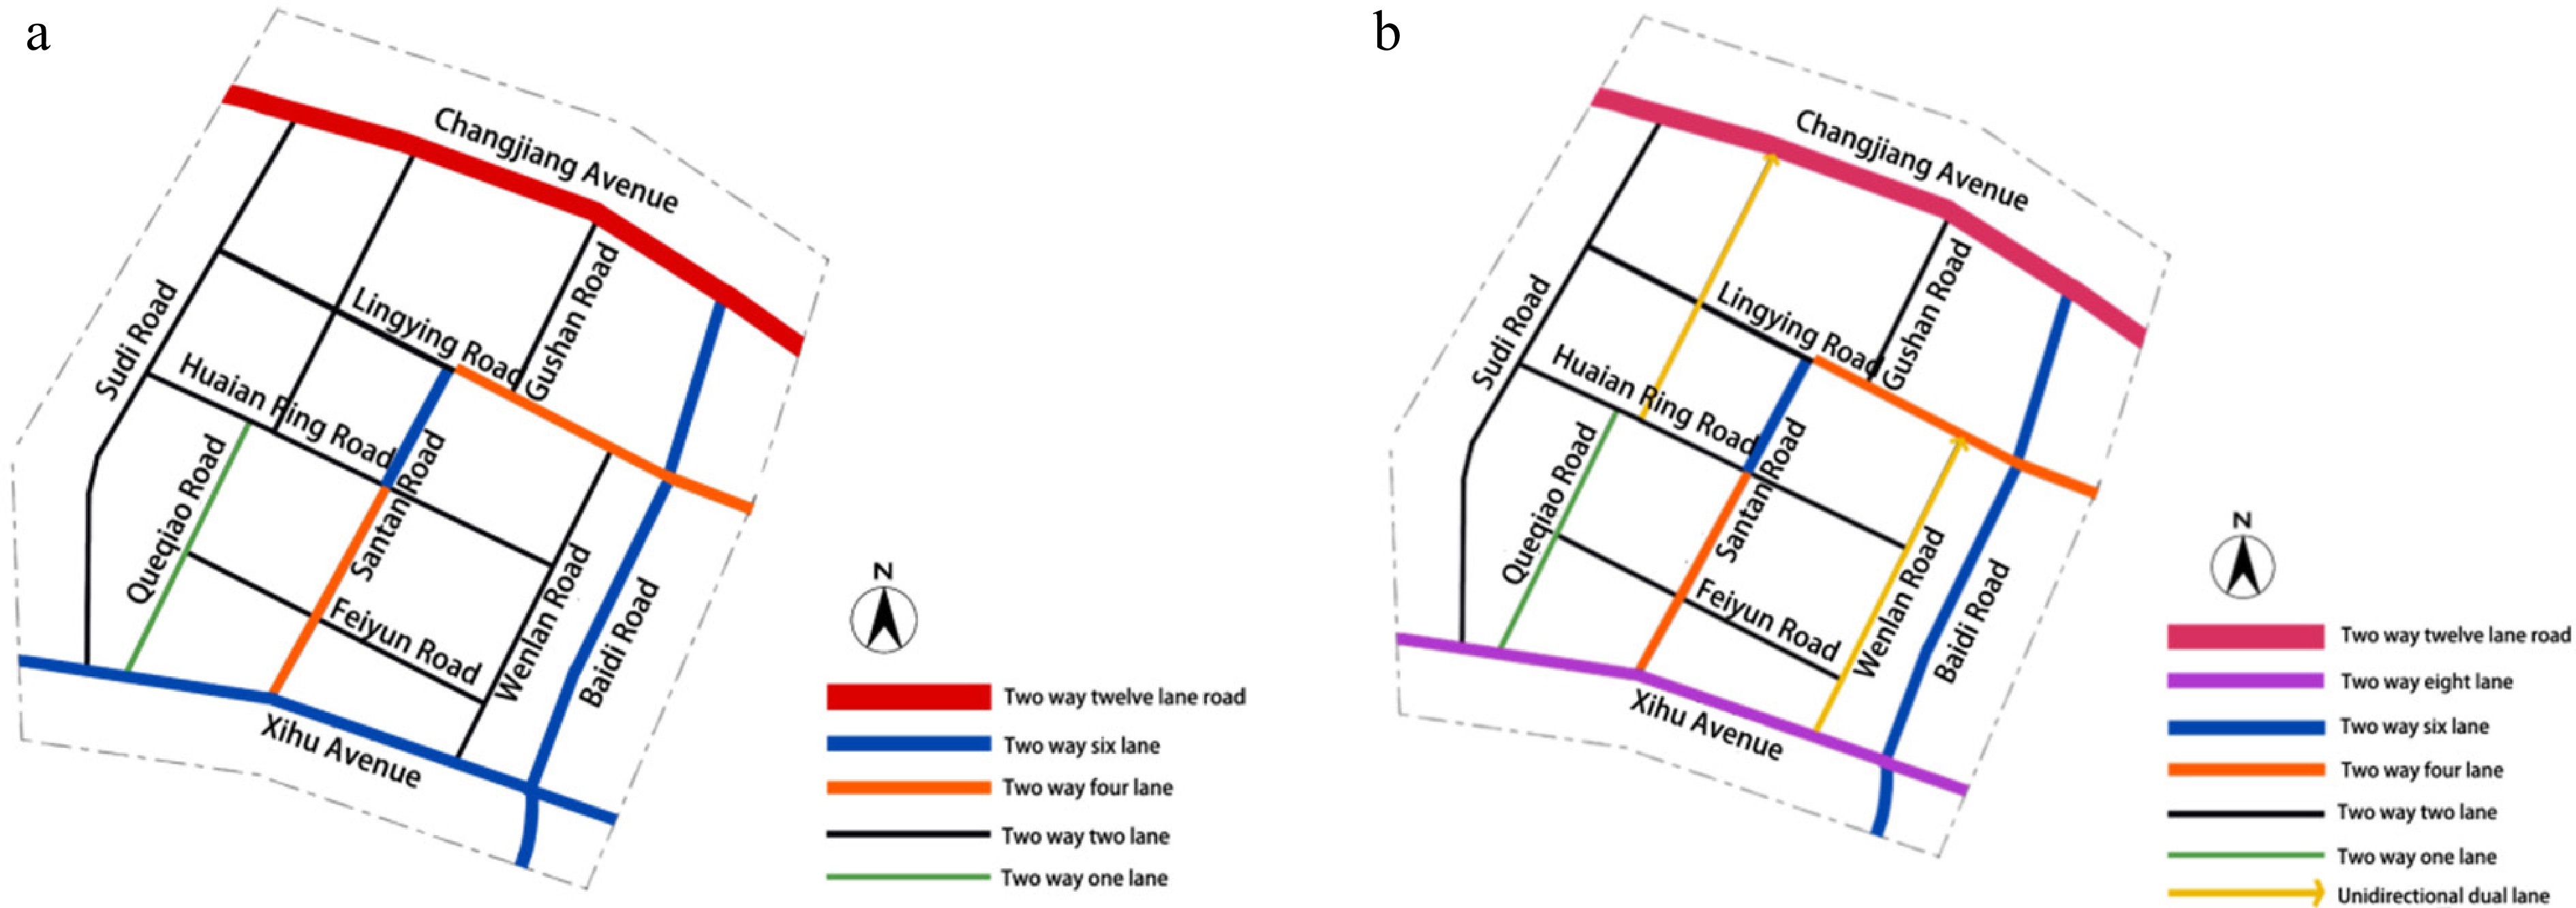
Figure 13.
Road network (a) before optimization and (b) after optimization.
-
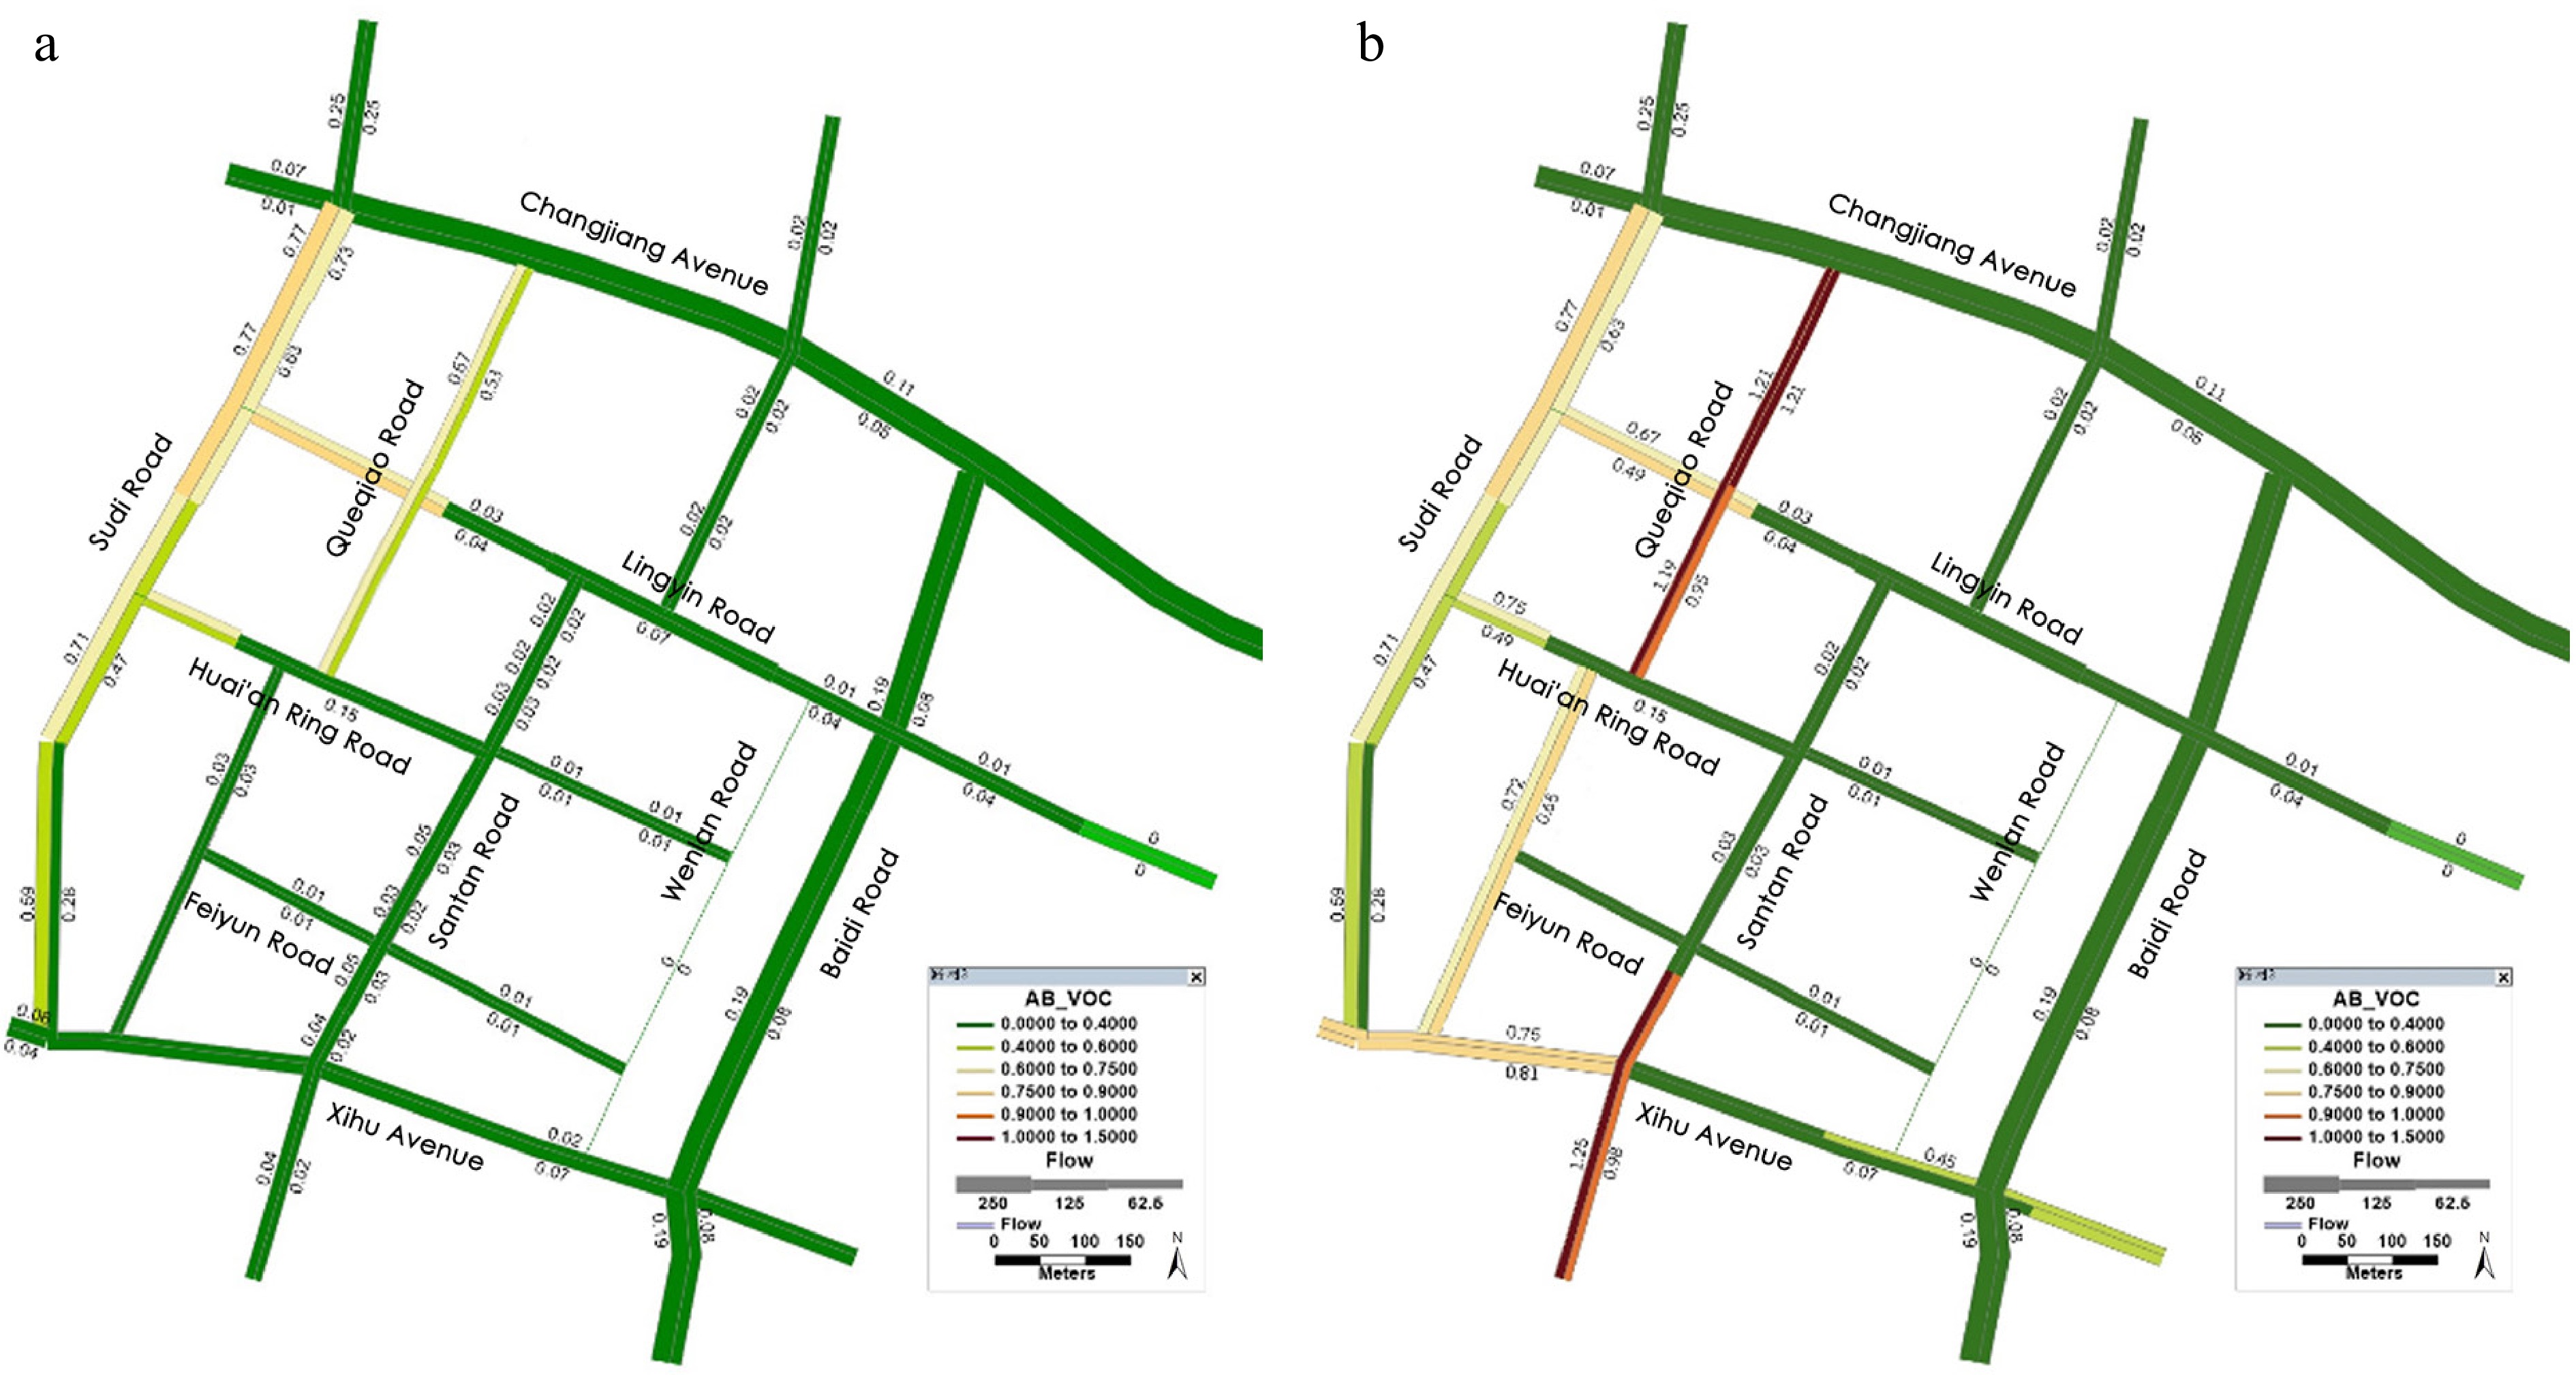
Figure 14.
Traffic service levels assigned by TransCAD (a) before optimization and (b) after optimization.
-
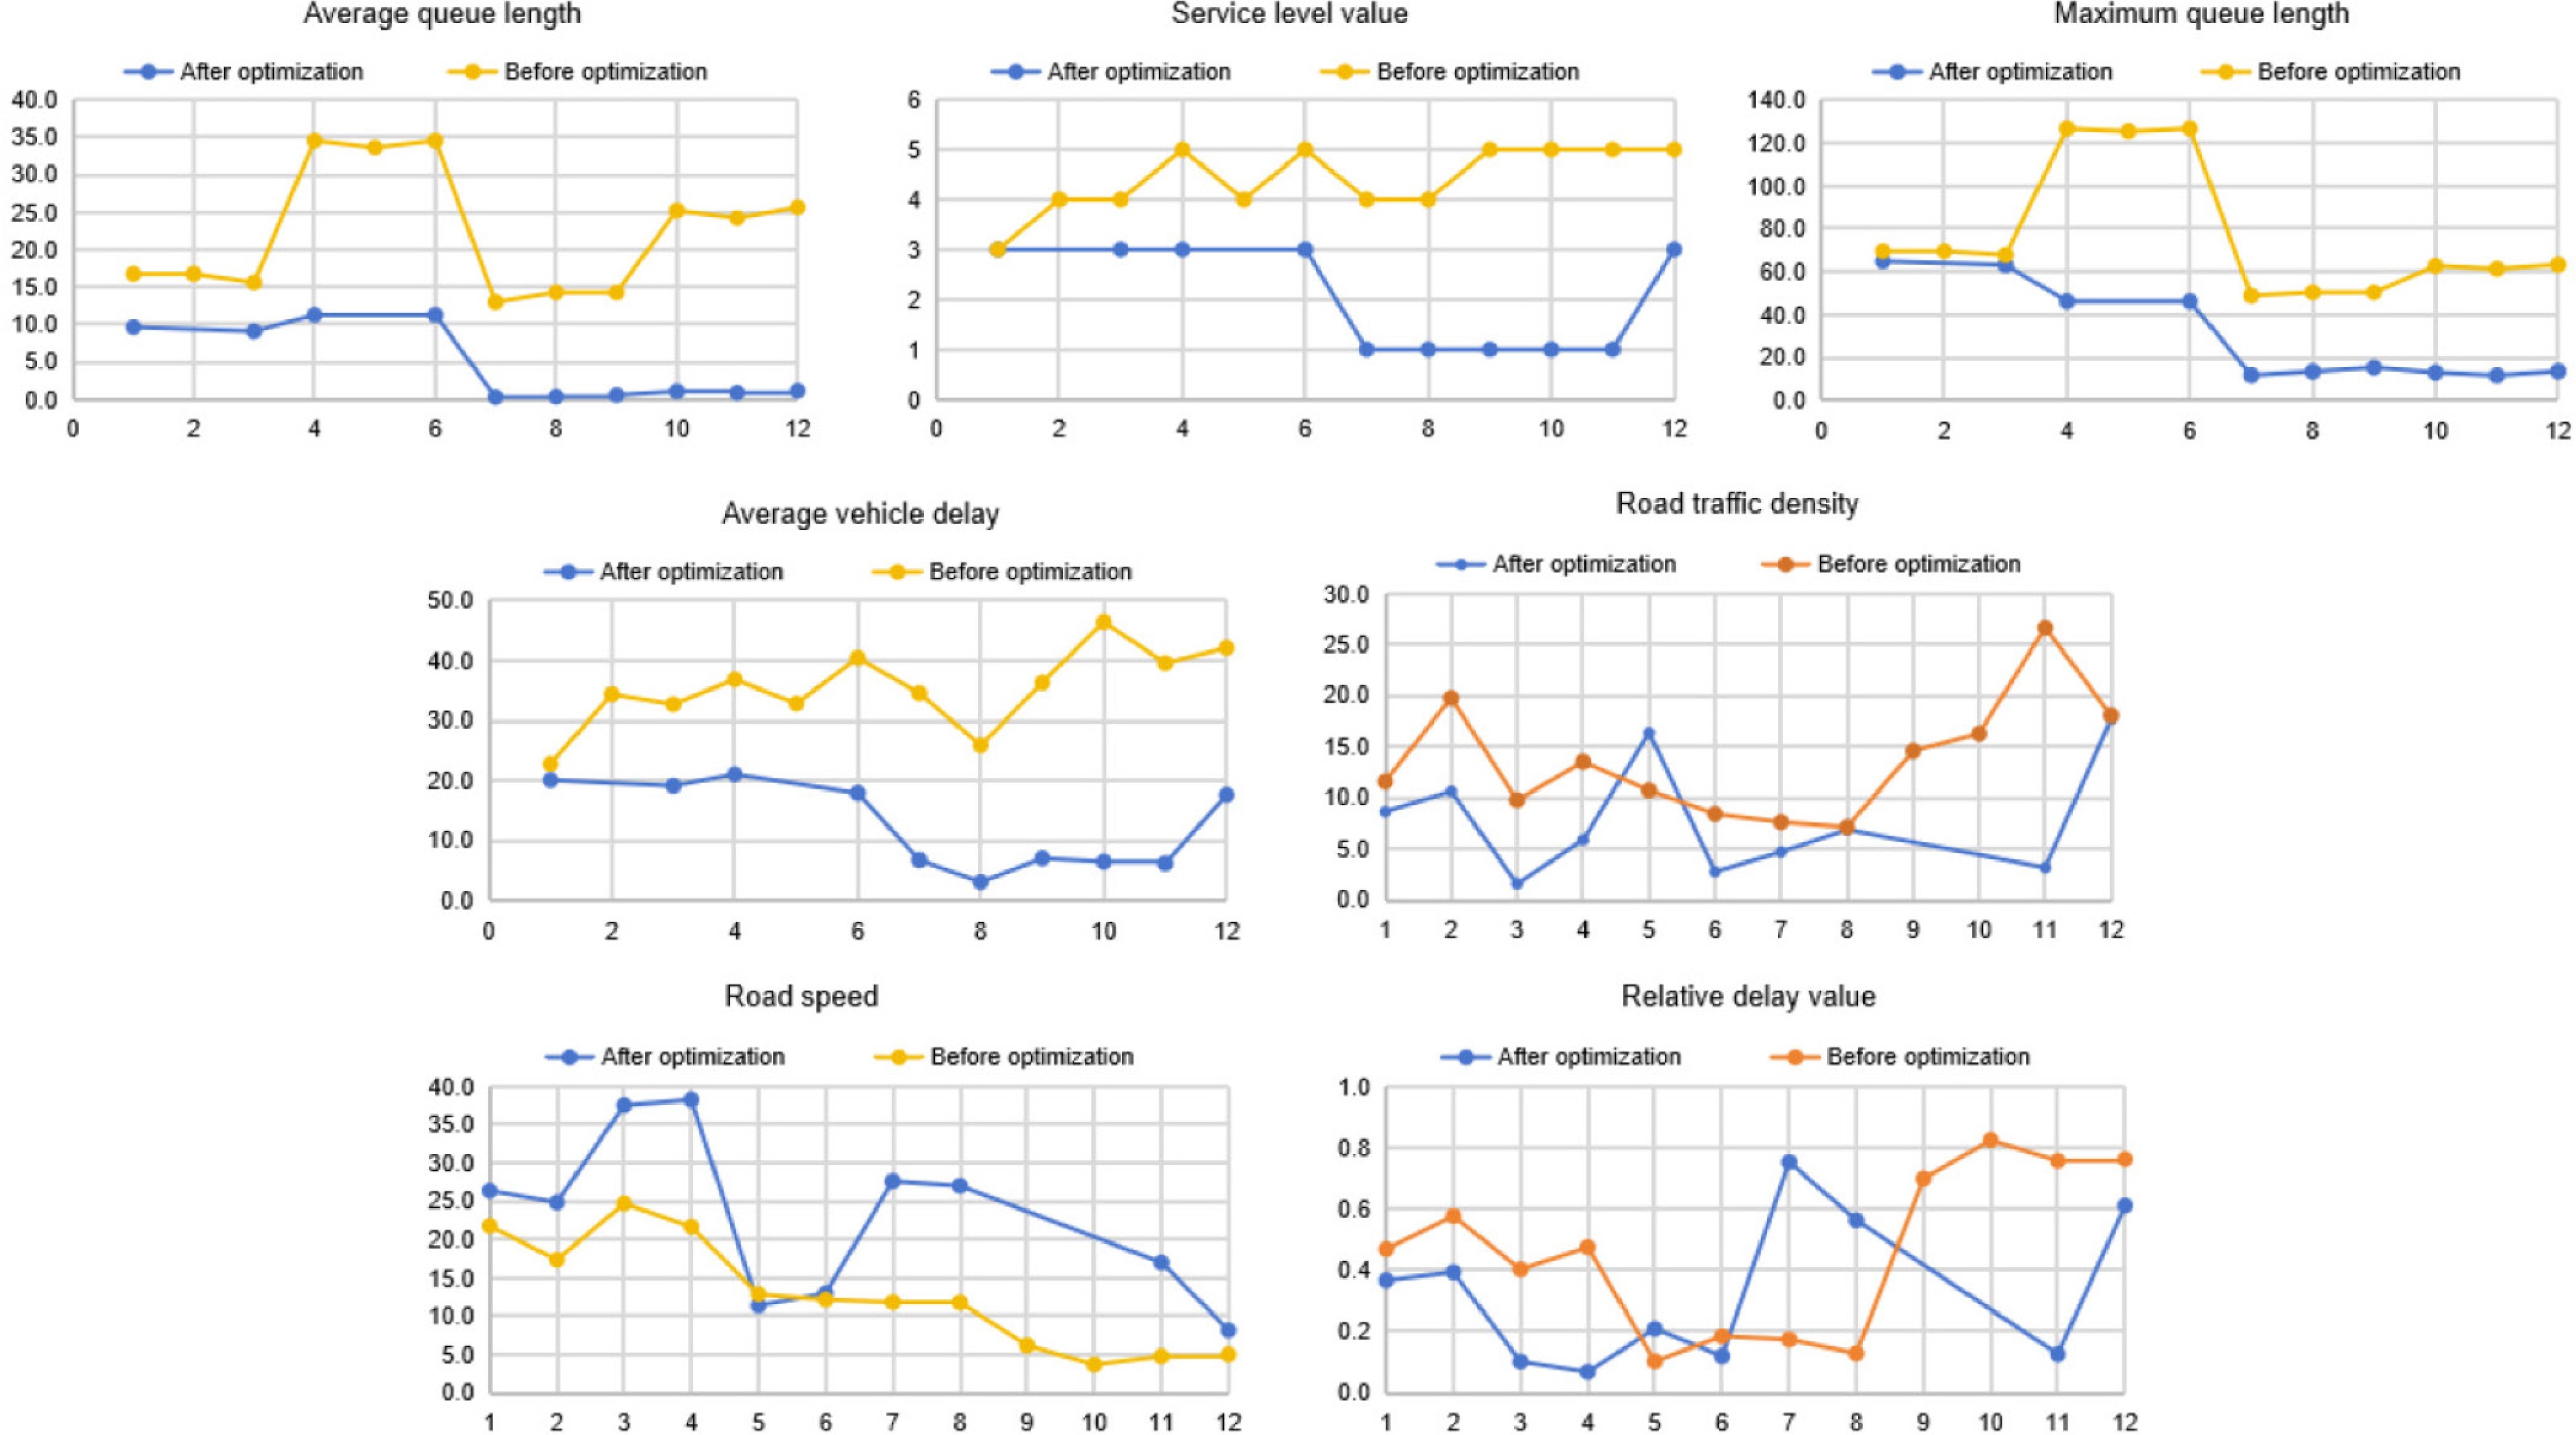
Figure 15.
Comparison of traffic capacity parameters before and after optimization at Intersection A.
-
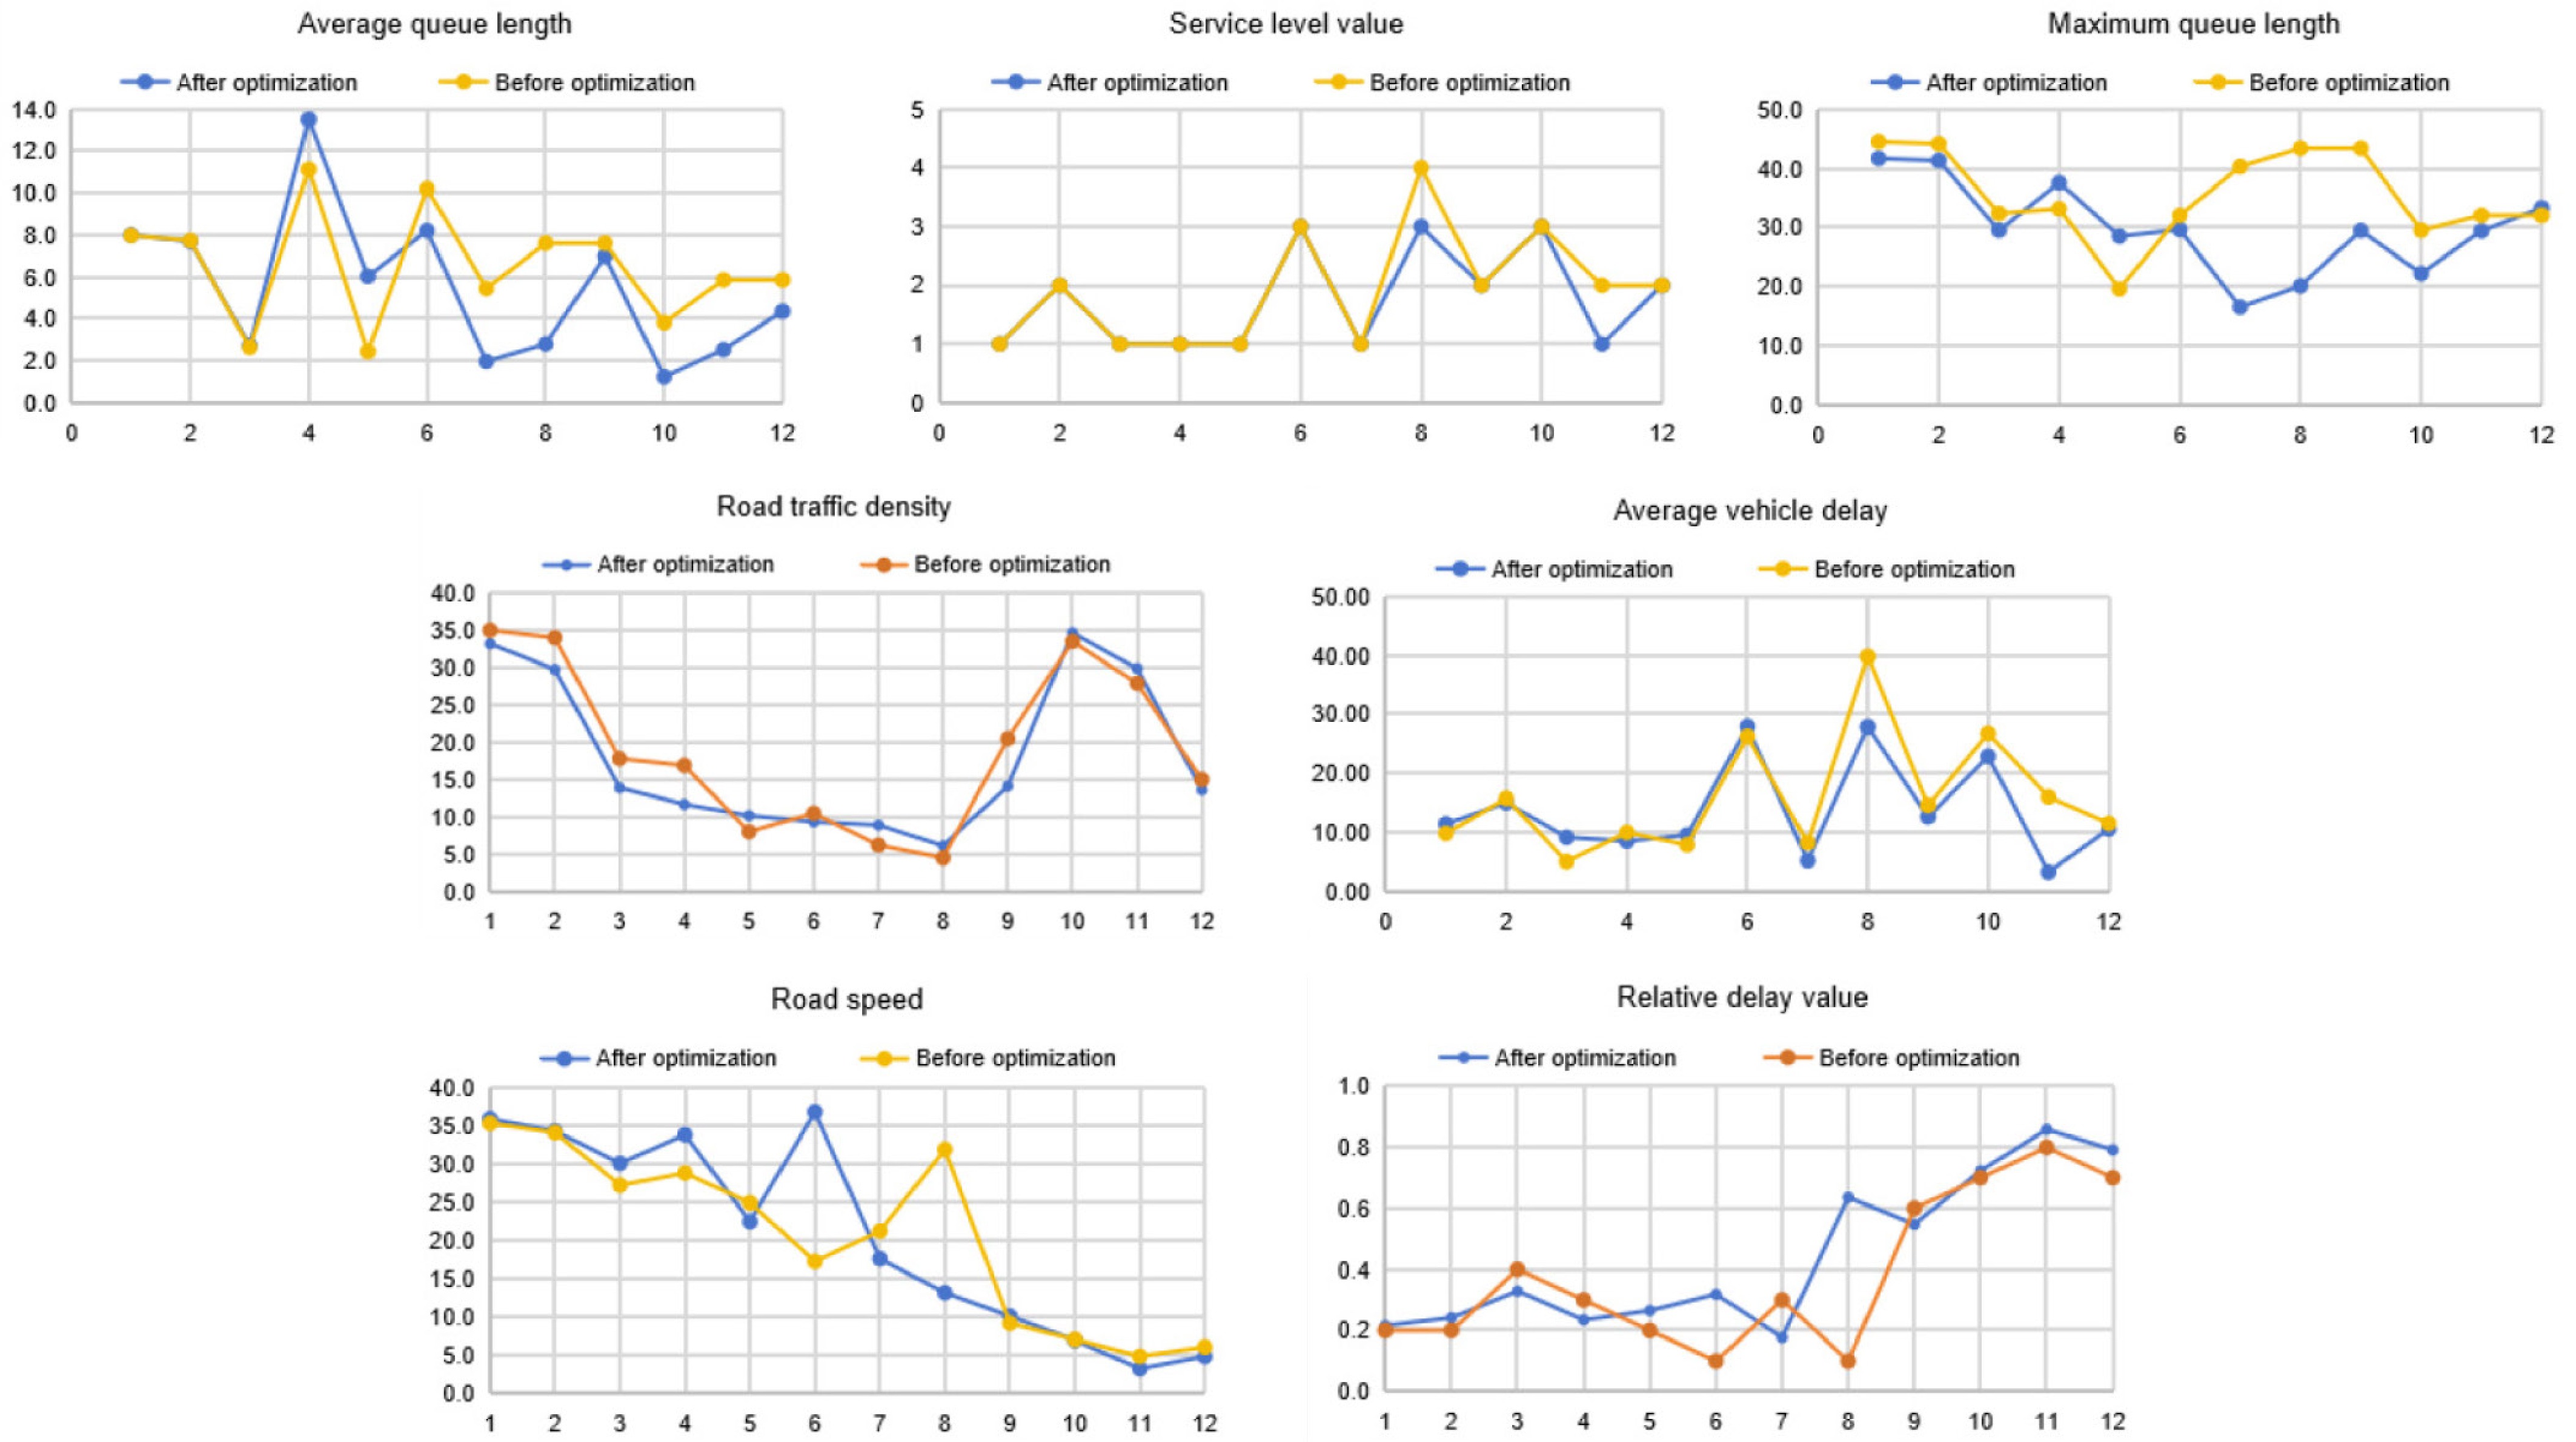
Figure 16.
Comparison of traffic capacity parameters before and after optimization at Intersection B.
-
Items Upper-level model Lower-level model Objective function Average travel speed of the road network ( $ \bar{V} $ Total impedance of the network (W) Constraint conditions
(control variable)Traffic capacity, investment limit Travel time on the road, intersection delay, the road's resistance Optimization scenarios
(decision variable)Road segment renovation (changing two-way to one-way, reducing two lanes, reducing one lane, the section remains unchanged, adding one lane, adding two lanes, changing one-way to two-way) Mode choice of travelers (walk, bus, bike, car, etc.) Table 1.
Summarization of variable settings for the bi-level optimization model.
-
Road section Direction Saturation Service level Changjiang Avenue (1−4) E to W 0.11 A W to E 0.06 A Baidi Road (4−23) S to N 0.08 A N to S 0.19 A Xihu Avenue (19−23) E to W 0.45−0.75 A−B W to E 0.07−0.81 A−B Sudi Road (1−19) S to N 0.28−0.47−0.63 A−B N to S 0.77−0.71−0.59 B−A Lingyin Road (5−10) E to W 0.03−0.67 A−B W to E 0.49−0.04 B−A Gushan Road (3−8) S to N 0.02 A N to S 0.02 A Santan Road (7−21) S to N 0.98−0.03−0.02 C−A−A N to S 0.02−0.03−1.25 A−A−C Queqiao Road (2−13) S to N 0.95−1.21 C N to S 1.21−1.19 C Queqiao Road (12−20) S to N 0.65 B N to S 0.72 B Huai'an Ring Road (11−15) E to W 0.01−0.75 A−B W to E 0.49−0.01 A Feiyun Road (16−18) E to W 0.01 A W to E 0.01 A Wenlan Road (9−22) S to N 0 / N to S 0 / Table 2.
Volume saturation and service level for each road section.
-
Road Section Traffic volume (pch/h) Topological direction Reverse topological direction Changjiang Avenue
(Sudi Road–Queqiao Road)1,260 1,146 Changjiang Avenue
(Queqiao Road–Gushan Road)1,754 2,252 Changjiang Avenue
(Gushan Road–Baitai Road)1,632 1,084 Baidi Road
(Changjiang Avenue–Lingyin Road)328 652 Baidi Road
(Lingyin Road–Xihu Avenue)834 710 Xihu Avenue
(Baitai Road–Wenlan Road)1,090 980 Xihu Avenue
(Wenlan Road–Santan Road)930 750 Xihu Avenue
(Santan Road–Queqiao Road)1,330 1,290 Xihu Avenue
(Queqiao Road–Sudi Road)1,140 1,210 Sudi Road
(Xihu Avenue–Huai'an Ring Road)300 180 Sudi Road
(Huai'an Ring Road–Lingyin Road)330 120 Sudi Road
(Lingyin Road–Changjiang Avenue)410 320 Lingyin Road
(Sudi Road–Santan Road)350 270 Lingyin Road
(Santan Road–Gushan Road)490 660 Lingyin Road
(Gushan Road–Baitai Road)300 400 Gushan Road
(Changjiang Avenue–Lingyin Road)220 350 Santan Road
(Lingyin Road–Xihu Avenue)570 650 Wenlan Road
(Lingyin Road–Xihu Avenue)100 150 Huai'an Ring Road
(Sudi Road–Wenlan Road)230 110 Feiyun Road
(Queqiao Road–Wenlan Road)230 60 Queqiao Road
(Changjiang Avenue–Huai'an Ring Road)120 70 Queqiao Road
(Huai'an Ring Road–Xihu Avenue)90 60 Table 3.
Calculated traffic volumes.
-
Decision variable Binary system Capacity transformation depth −3 001 Two-way changing to one-way −2 010 Reducing two lanes −1 011 Reducing one lane 0 100 The section remains unchanged 1 101 Adding a lane 2 110 Adding two lanes 3 111 One-way changing to two-way Table 4.
Correspondences between decision variable binaries and transformation depth
Figures
(16)
Tables
(4)