-
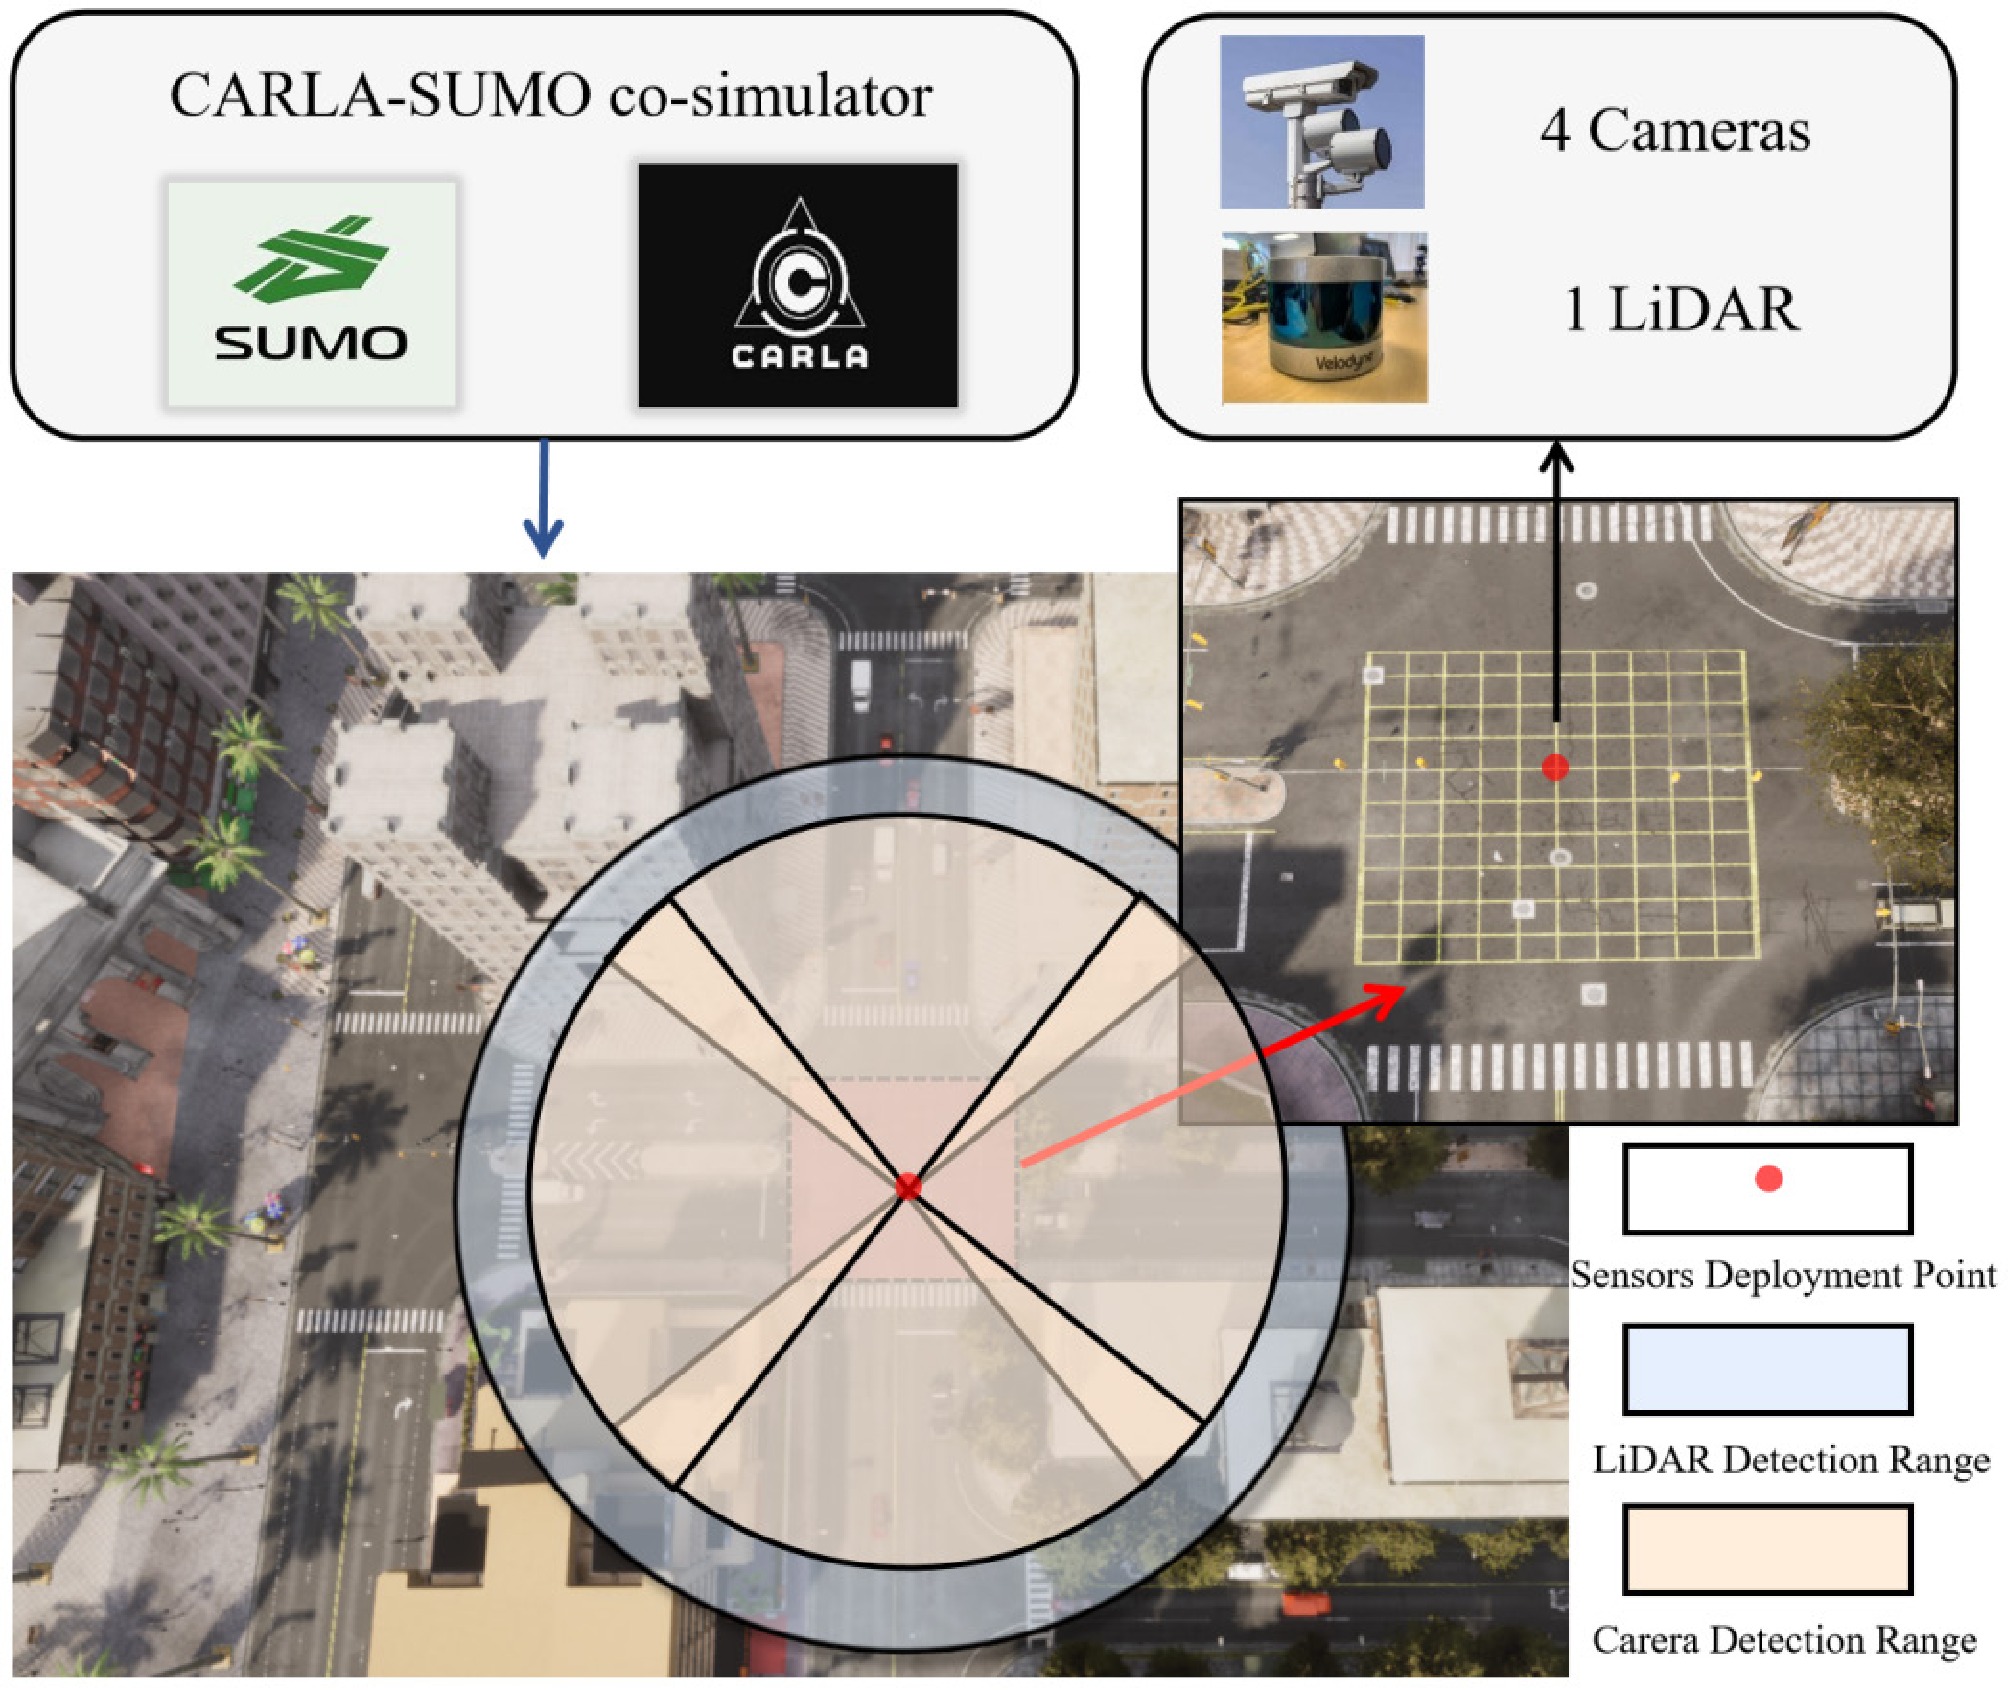
Figure 1.
Sensor deployment locations and hardware configurations.
-
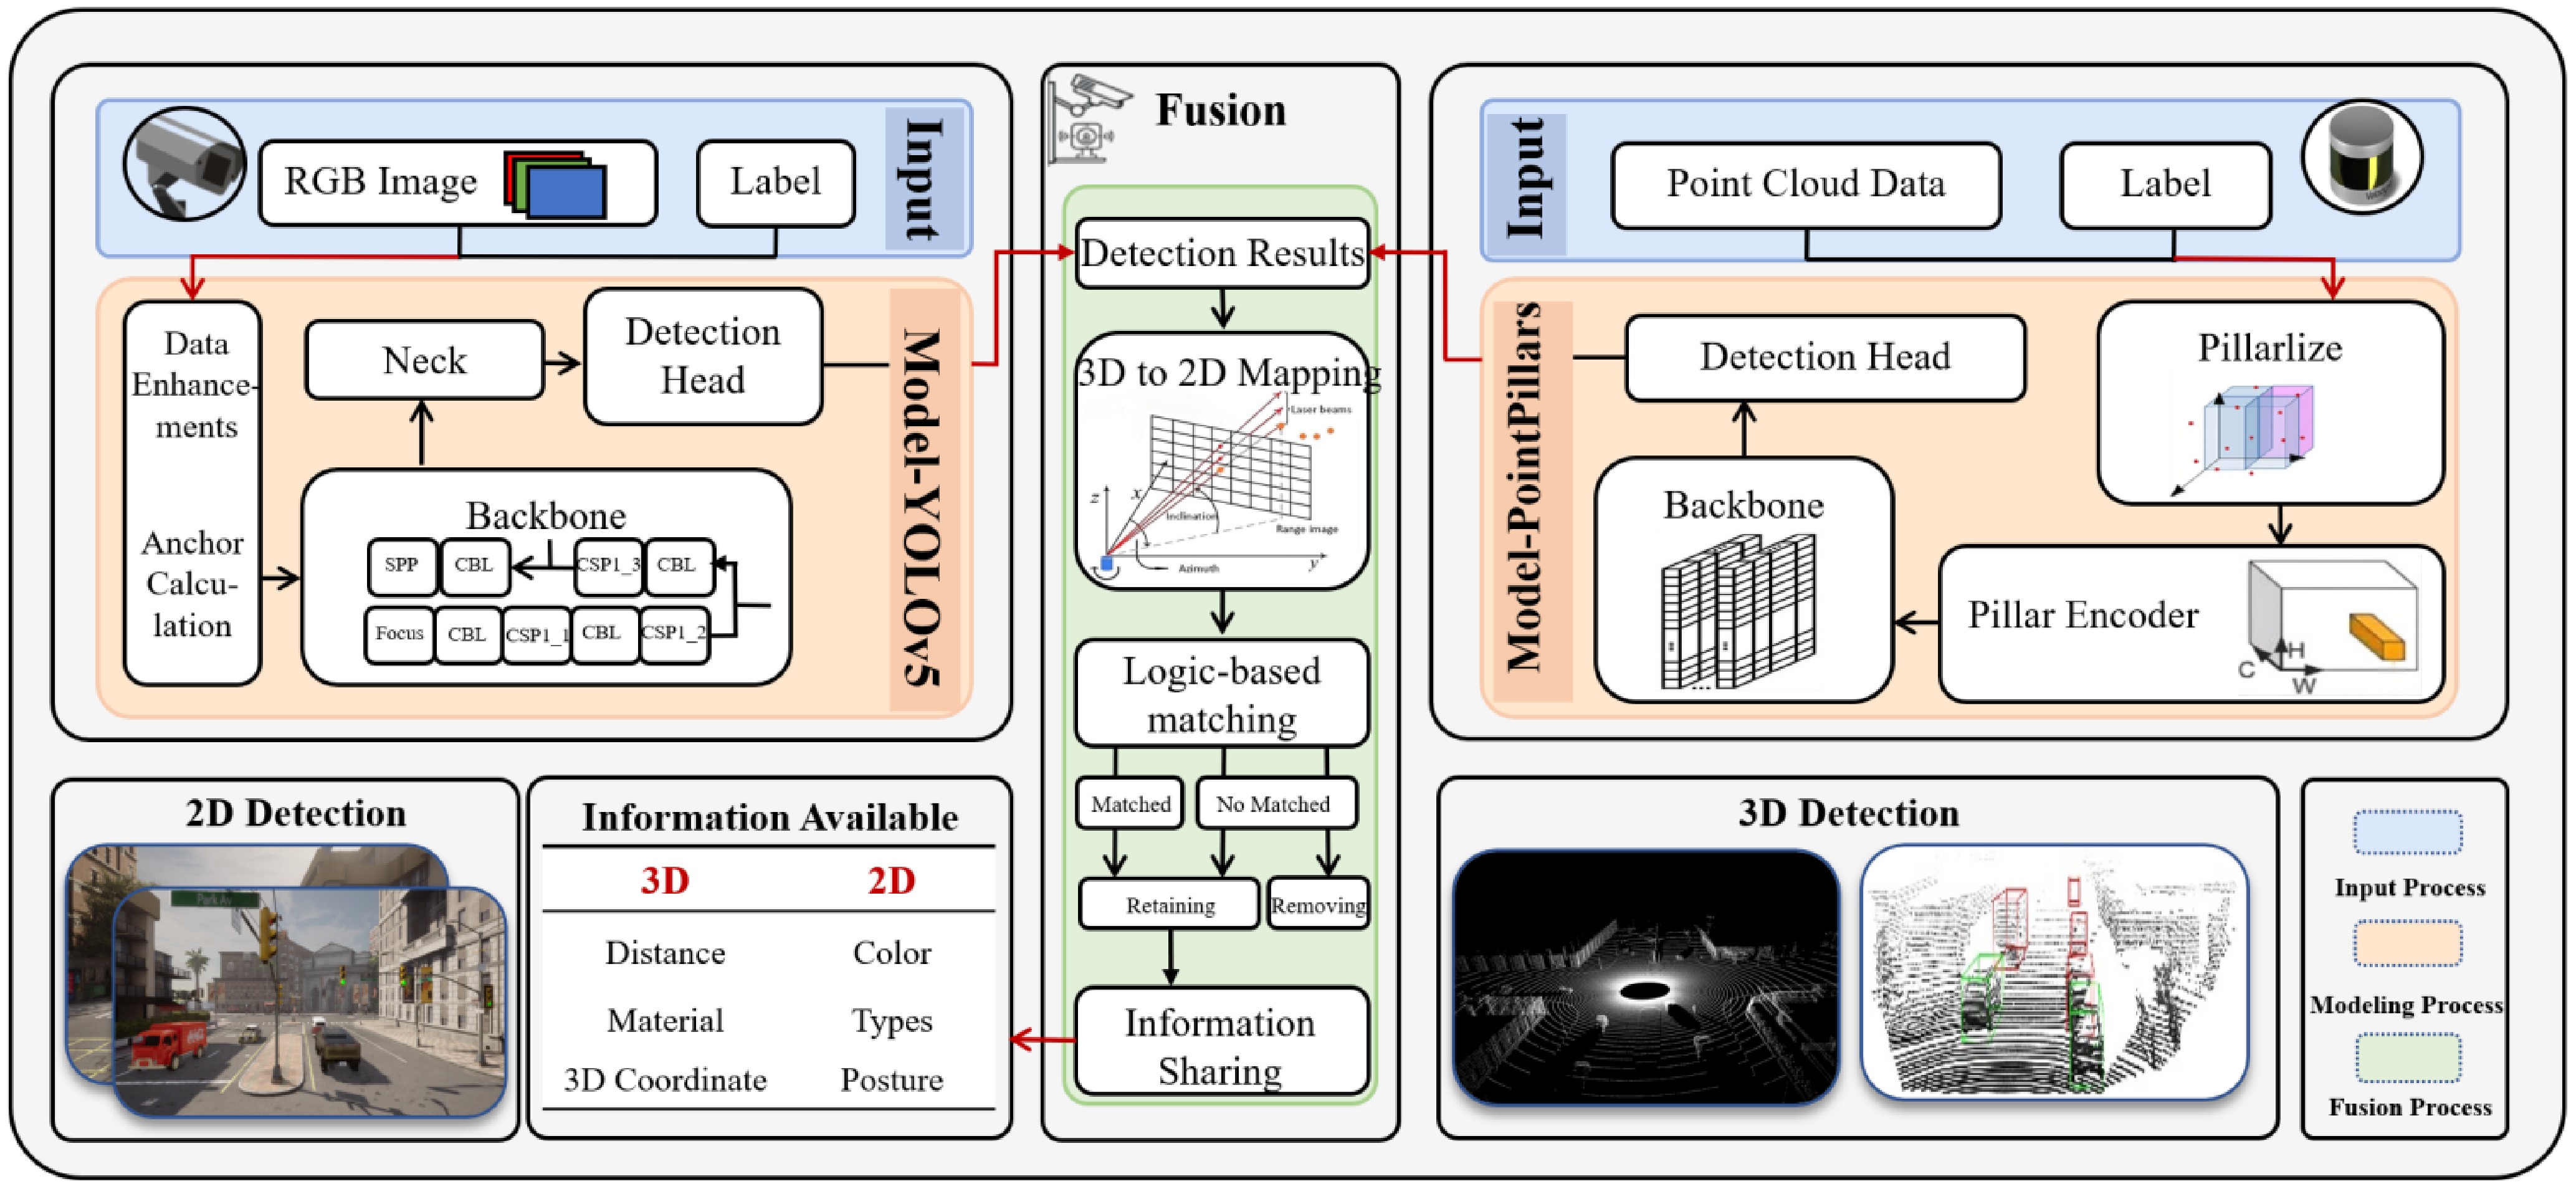
Figure 2.
Framework for multi-sensor fusion perception.
-
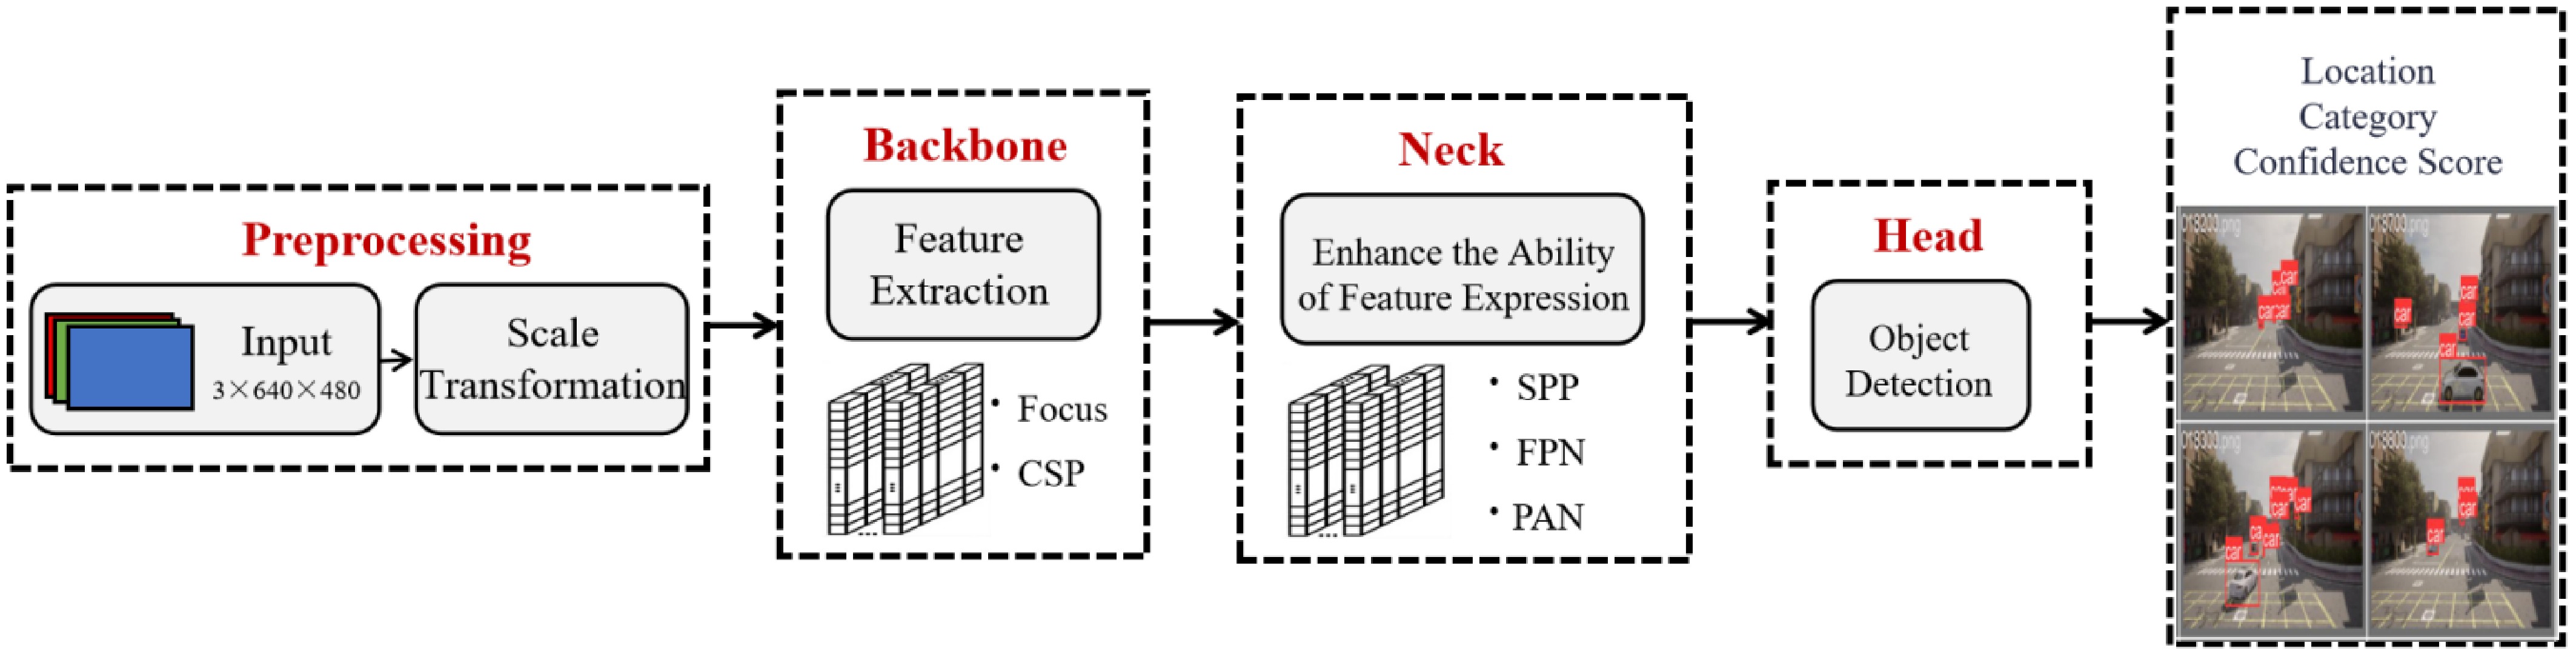
Figure 3.
Network overview for the YOLOv5.
-
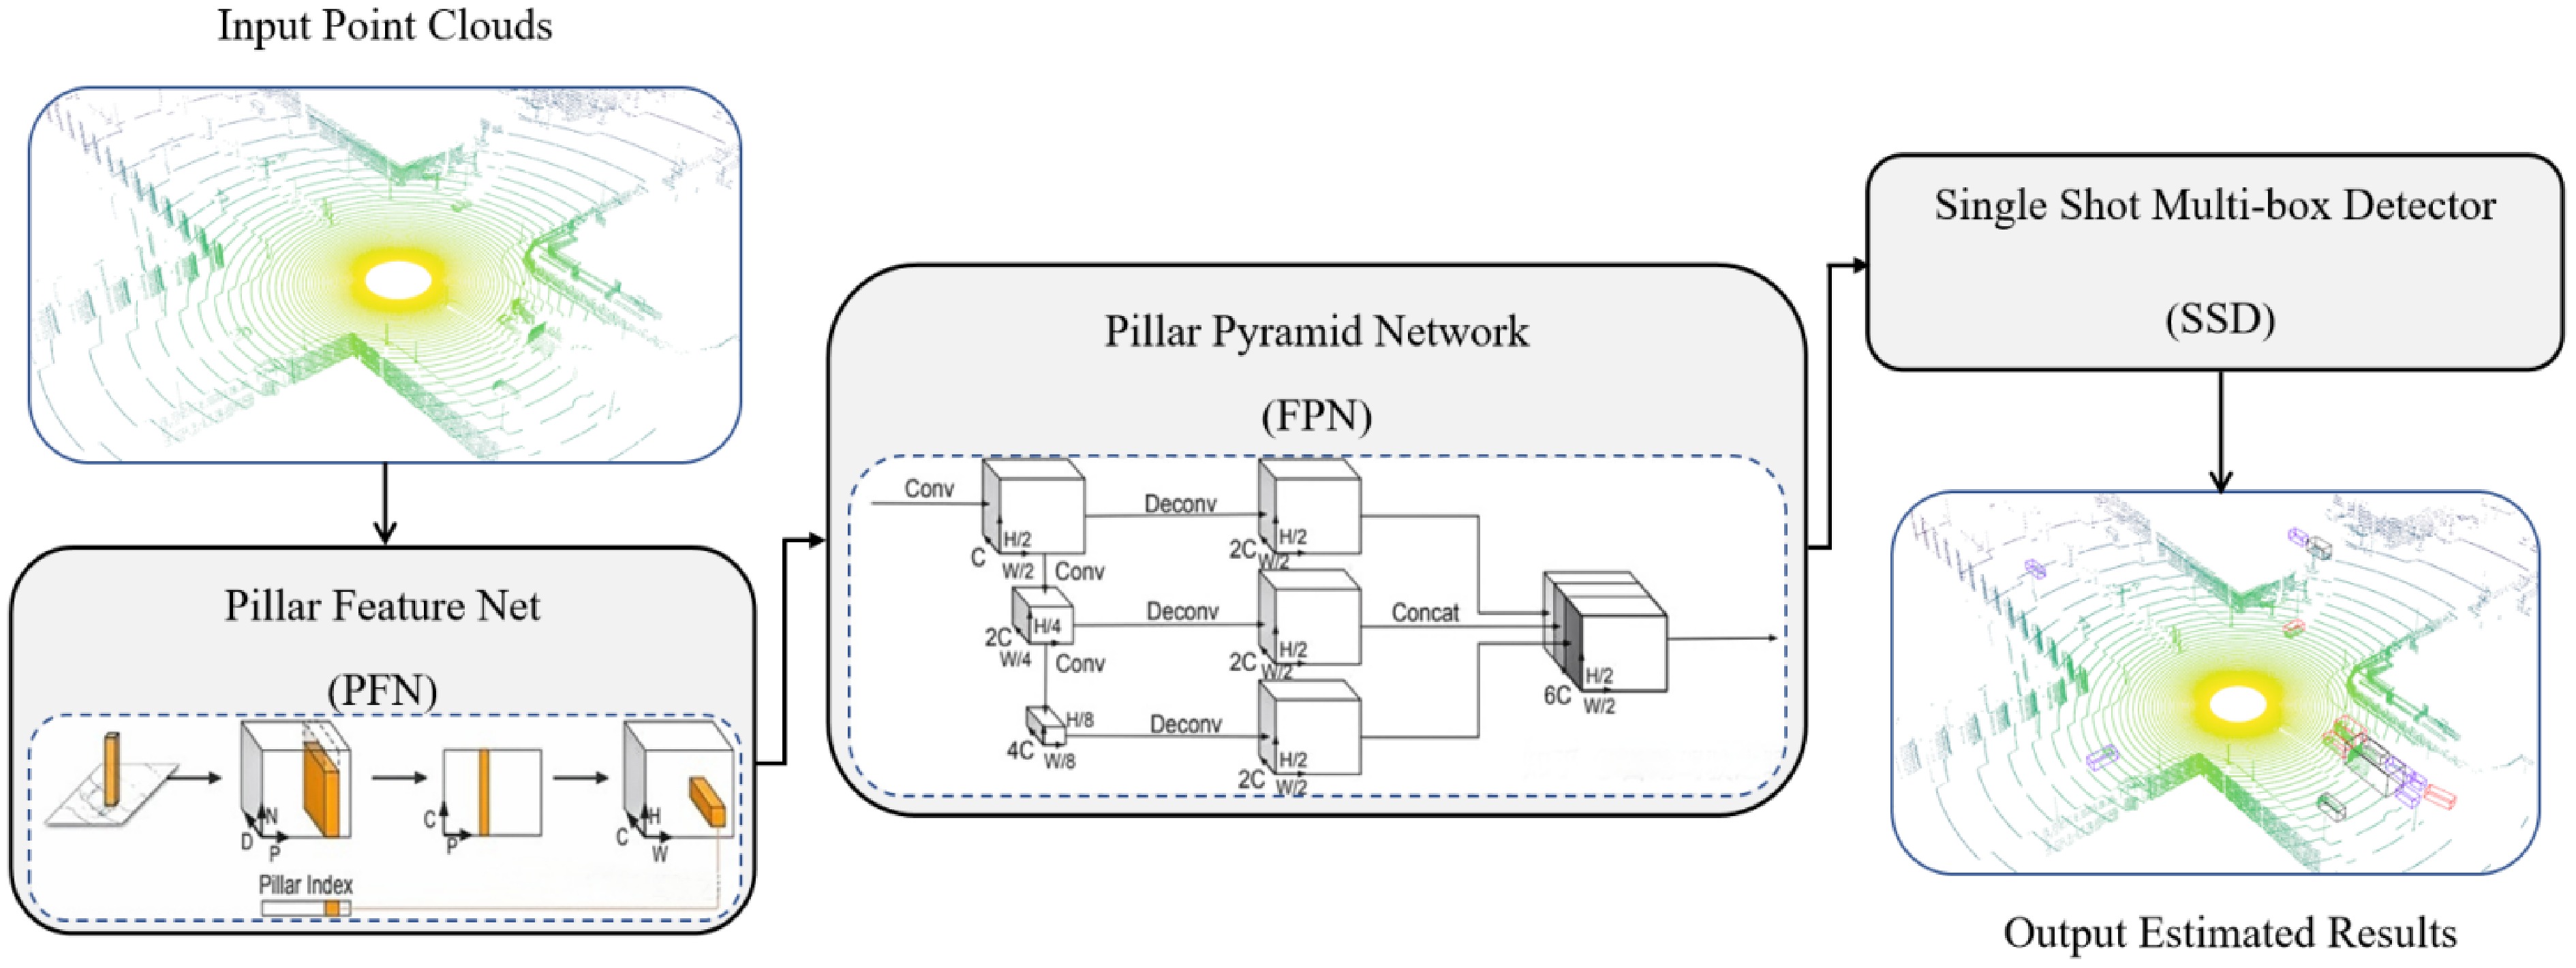
Figure 4.
Network overview for the PointPillars.
-
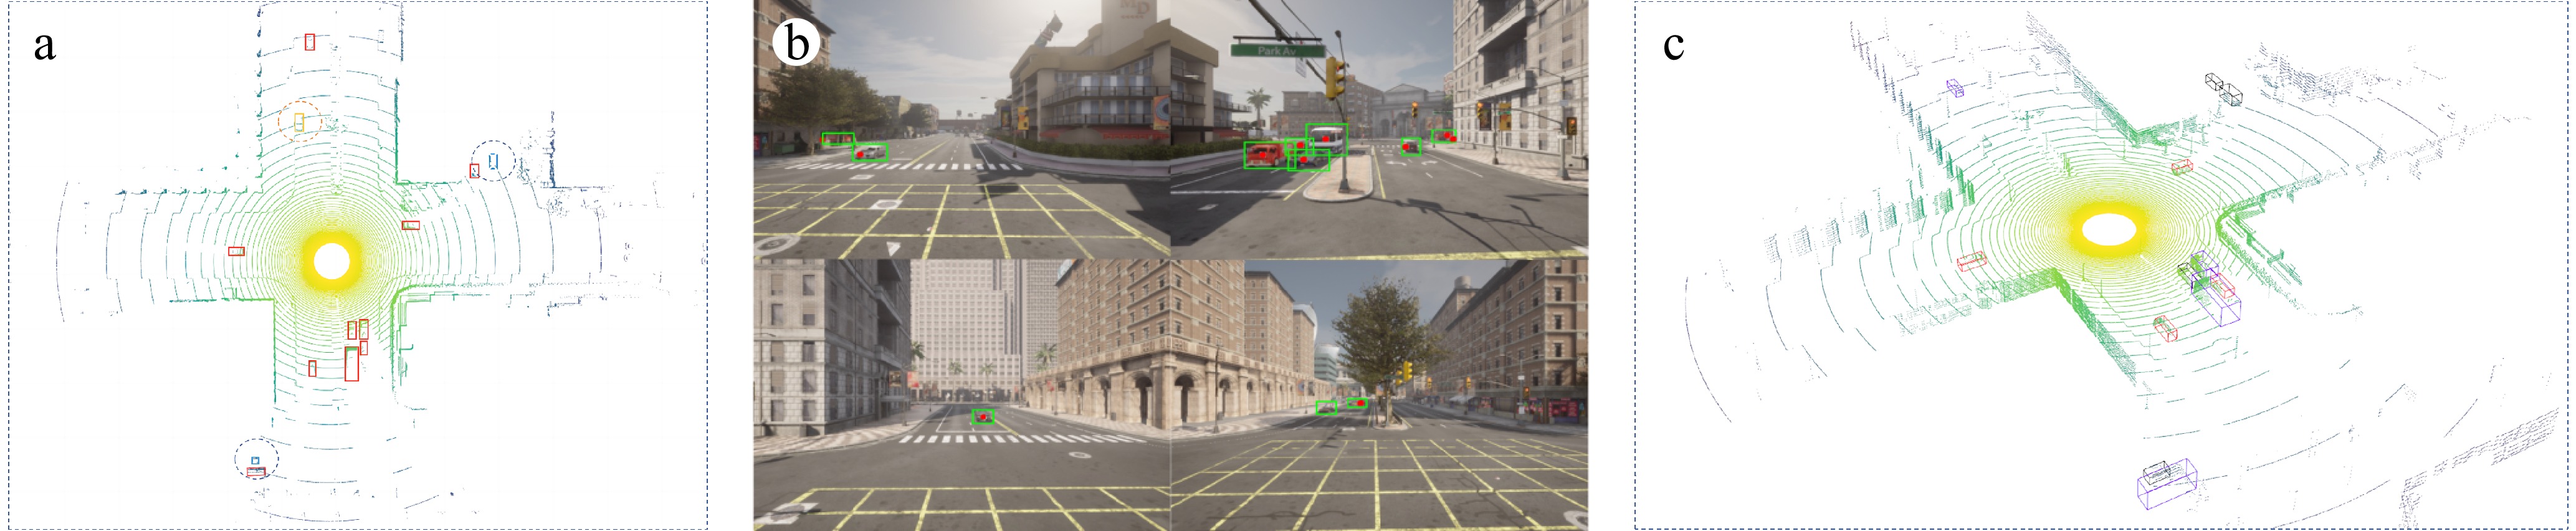
Figure 5.
Digital twin view. (a) BEV fusion view. (b) Camera view. (c) LiDAR view.
-
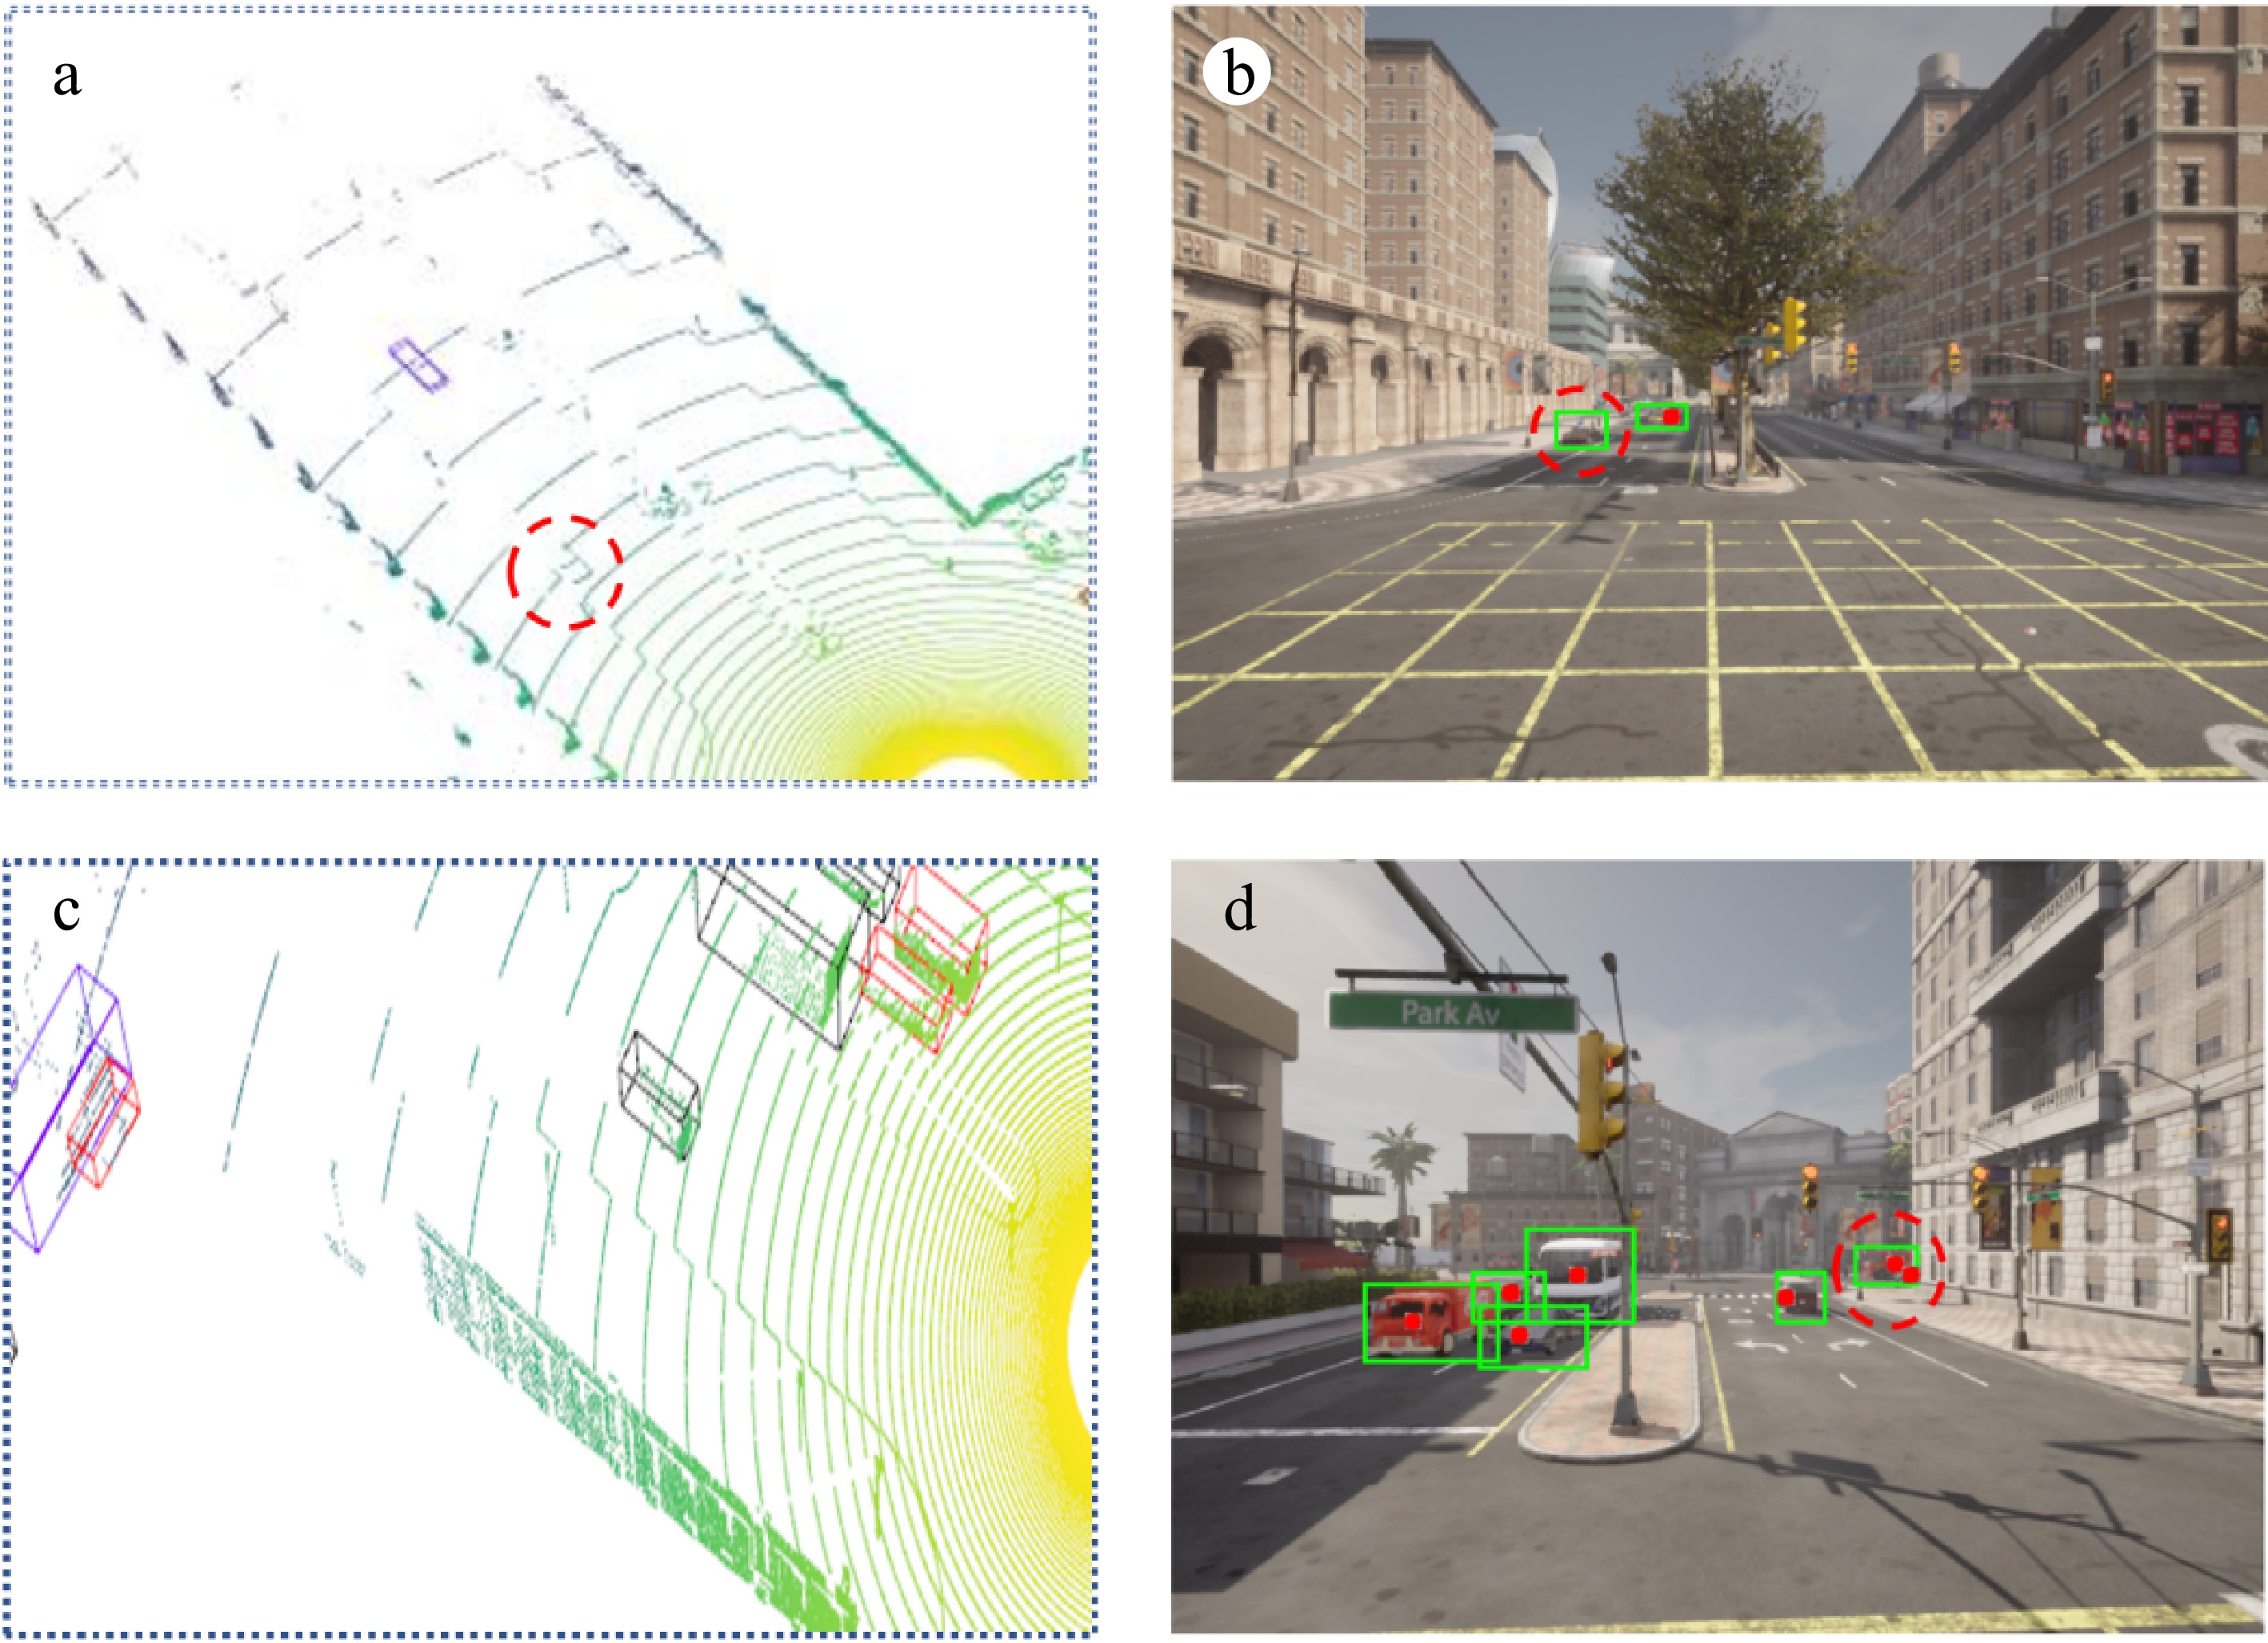
Figure 6.
Local details of the digital twin view. (a) 3D Detection Failure: The 3D detector fails to identify a vehicle near the intersection. (b) 2D Detection Success: The 2D detector successfully captures the vehicle that was missed in the 3D detection (as shown in a). (c) 3D Detection Success: The 3D detector successfully detects a vehicle that was occluded and missed by the 2D detector (as shown in d). (d) 2D Detection Failure: The 2D detector fails to detect a vehicle on the far side of the road due to the overlap of two vehicles.
-
Type Advantage Disadvantage Principle Main application Deployment location Geomagnetic coil[12] Fast response time, cost-effective Difficult to maintain, accuracy sensitive Electromagnetic induction Detecting the presence, passage of vehicles Position 0.2-0.4 m deep from the road surface Infrared sensors[13] High precision Low resolution, short distance Infrared reflectance Night vision, infrared imaging Signal arm, building above 3 m position Fisheye camera[14] Large detection range, high picture quality Highly expensive with distortion problems Image recognition technology Safety monitoring Signal arm, street lamp post 3−5 m height position LiDAR[15] 3D information available, high accuracy Slow processing, high costs Laser beam reflection Depth information perception, 3D reconstruction Signal arm, street lamp post 1.5−2.5 m height position Camera[5] Wide range, rich textures, low prices Light-sensitive, blurriness under high-speed Image recognition technology Path and object recognition Signal arm, street lamp post 2.5−5 m height position Table 1.
Common sensors in road infrastructure sensing systems.
-
Sensor Parameters Default Description LiDAR Channels 64 Number of lasers Height 3.17 m Height with respect to the road surface Range 100 m Maximum distance to measure/ray-cast in meters Rotation frequency 20 Hz LiDAR rotation frequency Points per second 500,000 Number of points Upper FOV 5 Angle in degrees of the highest laser beam Lower FOV −35 Angle in degrees of the lowest laser beam Noise stddev 0.01 Standard deviation of the noise model of point Dropoff rate 20% General proportion of points that are randomly dropped Dropoff intensity limit 0.8 Threshold of intensity value for exempting dropoff Camera FOV 90 Angle in degrees Focal length 360 Optical characteristics of camera lenses Principal point coordinate (320, 240) Image center coordinates Resolution 640 × 480 Measure of image sharpness FOV indicates field of view; stddev indicates standard deviation. Table 2.
Parameter configuration and description for Camera and LiDARs.
-
Table 3.
Comparison of common 2D detection algorithms average performance for cars.
-
Table 4.
Comparison of common 3D detection algorithms average performance for cars.
-
Parameter Description Value PointPillars YOLOv5 Range Detection range of the model. [0, −39.68, −3, 69.12, 39.68, 1] − Voxel size Voxel is a pixel in 3D space, voxel_size represents the size of the voxel. [0.16,0.16,4] − No. of classes Class of detection objects. 1 1 Lr Learning rate, which determines the step size of parameter updates during the optimization process. 0.003 0.01 Batch size Refers to the number of samples entered at once when training the model. 4 16 Epoch Number of iterations during training. 80 300 Table 5.
Hyper-parameter configuration.
Figures
(6)
Tables
(5)