-
Figure 1.
Differences in distance measurement between different scenes.
-
Figure 2.
Schematic diagram of a safety protection zone.
-
Figure 3.
Schematic diagram of two moving entities in a scene and velocity obstacle model.
-
Figure 4.
Schematic diagram of elliptical protective zones for aircraft and vehicle.
-
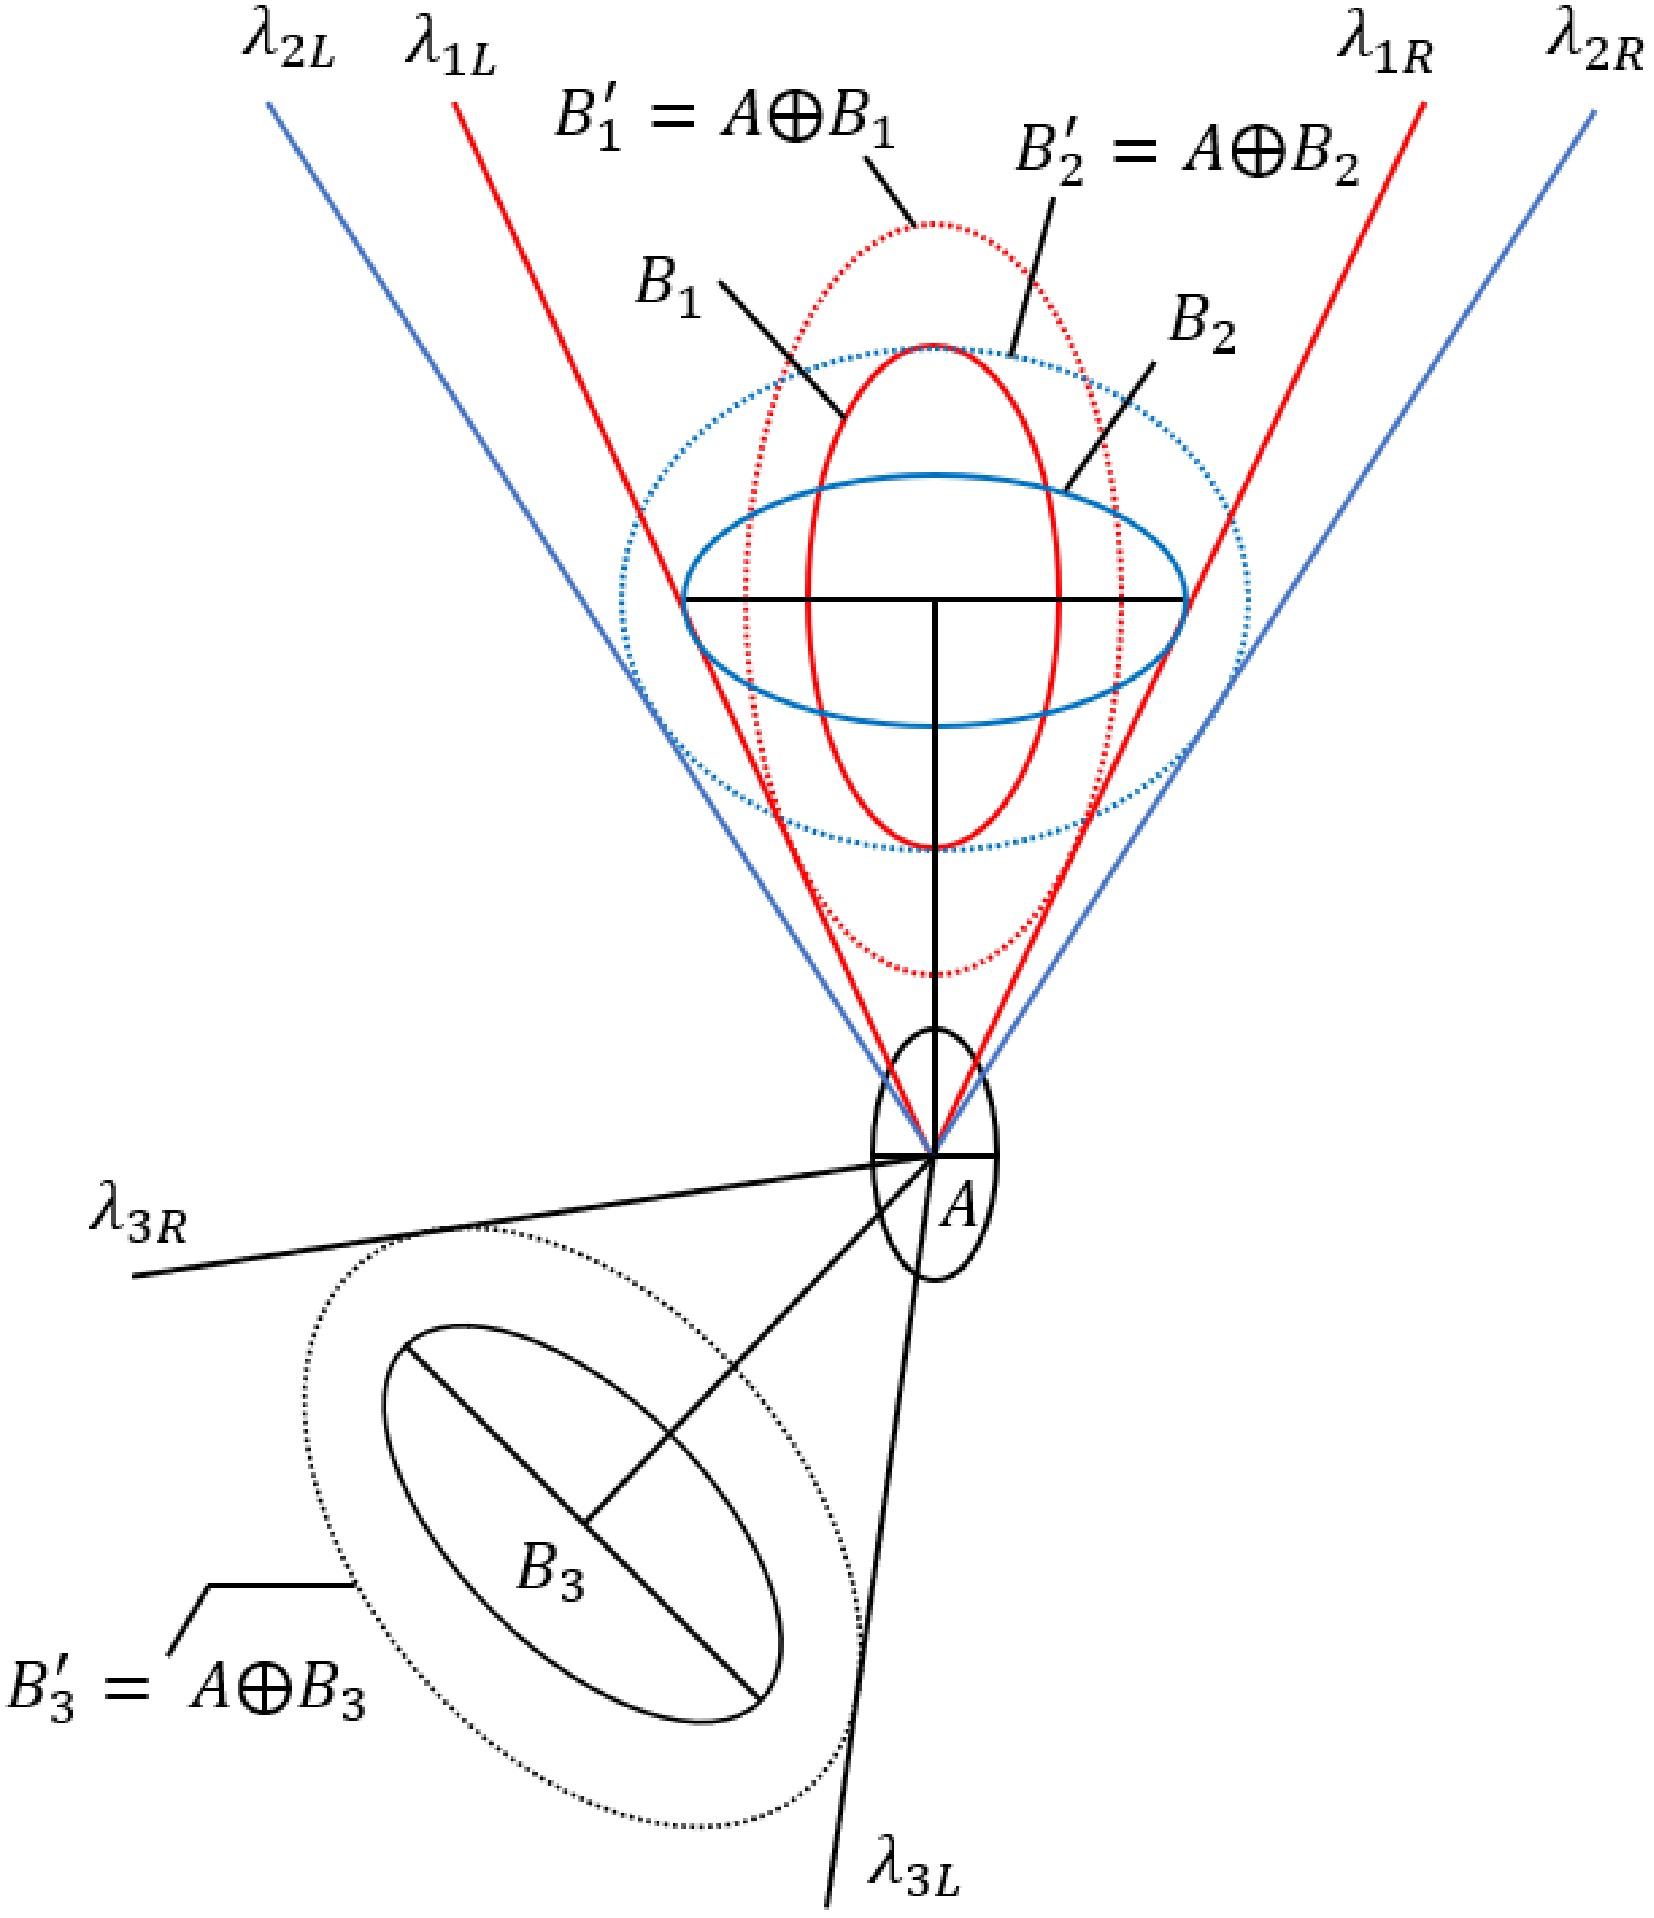
Figure 5.
Schematic diagram of the influence of the ellipse's major axis direction on the mapping result.
-
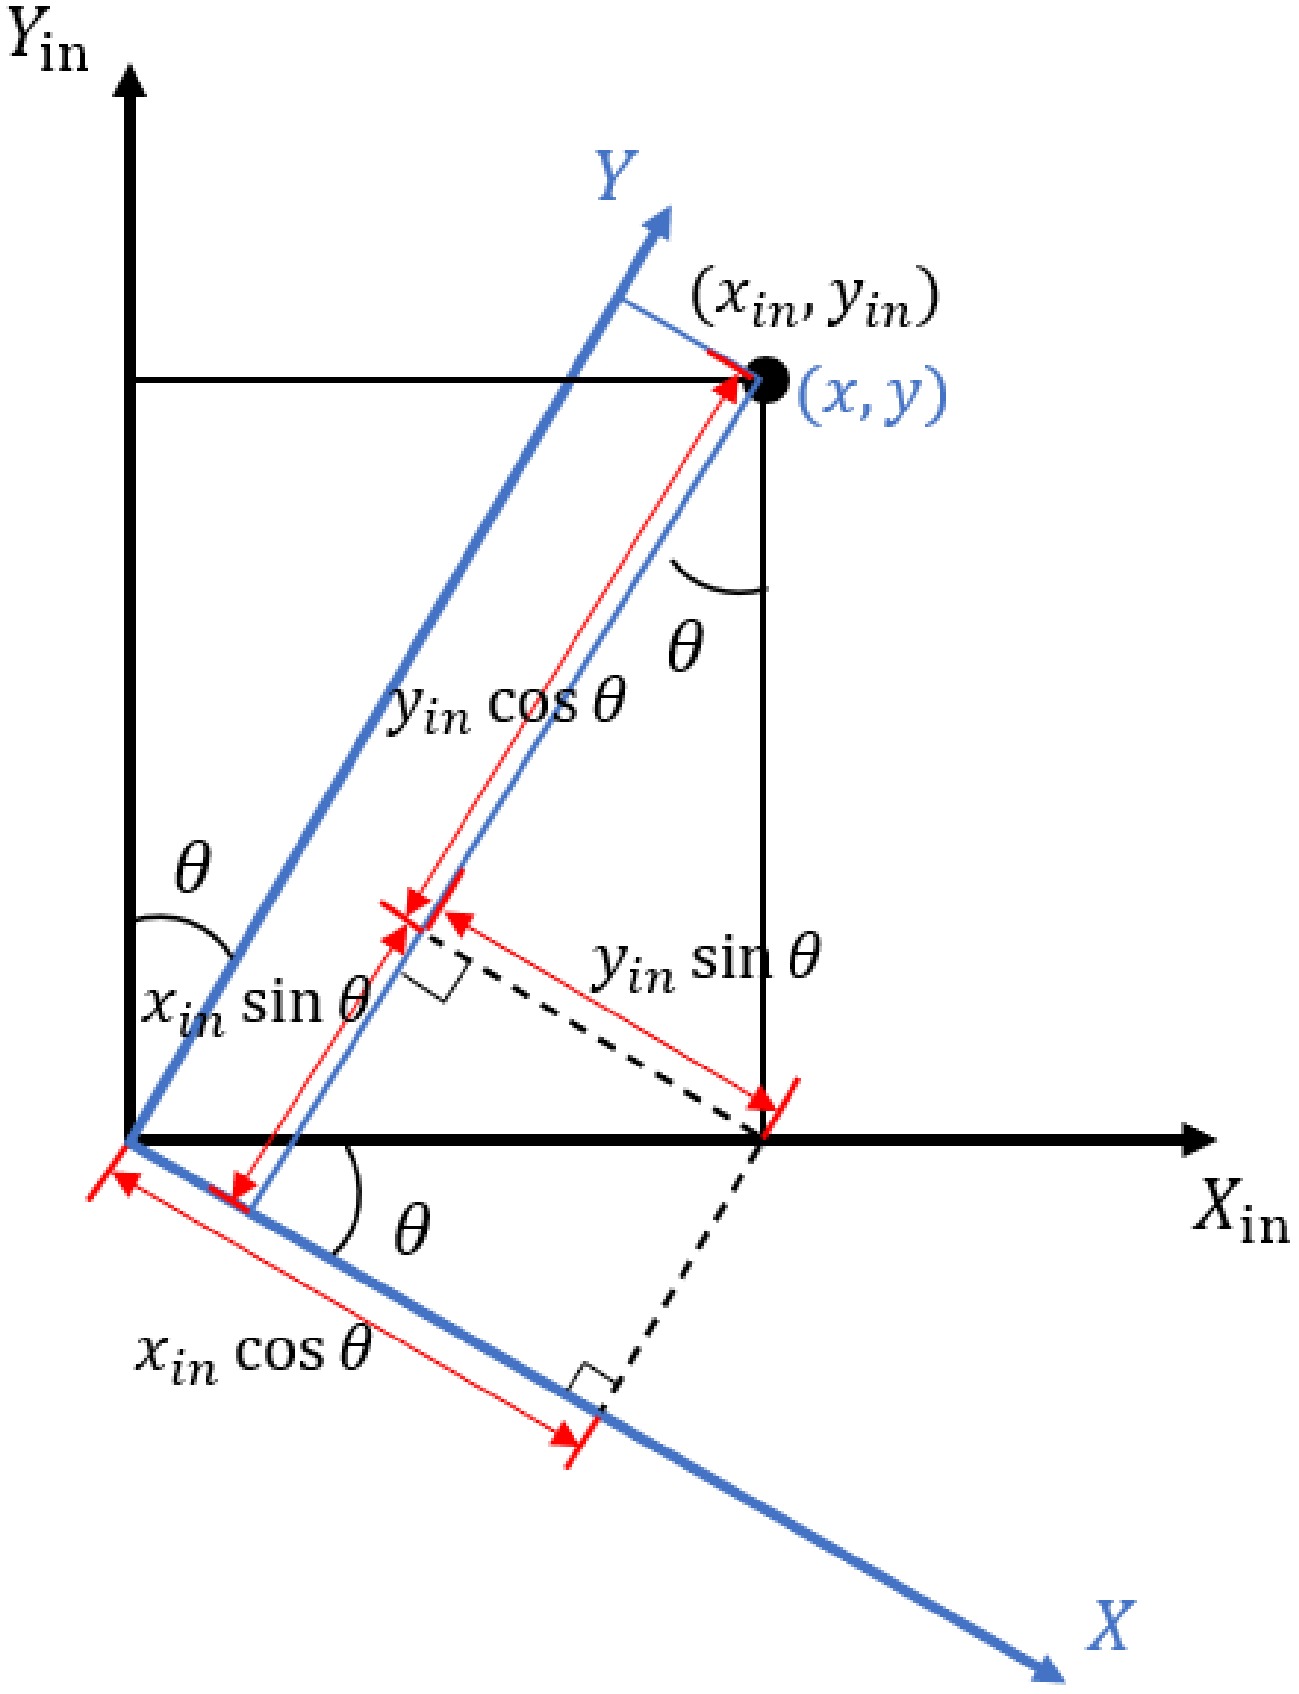
Figure 6.
Illustration of coordinate system transformation.
-
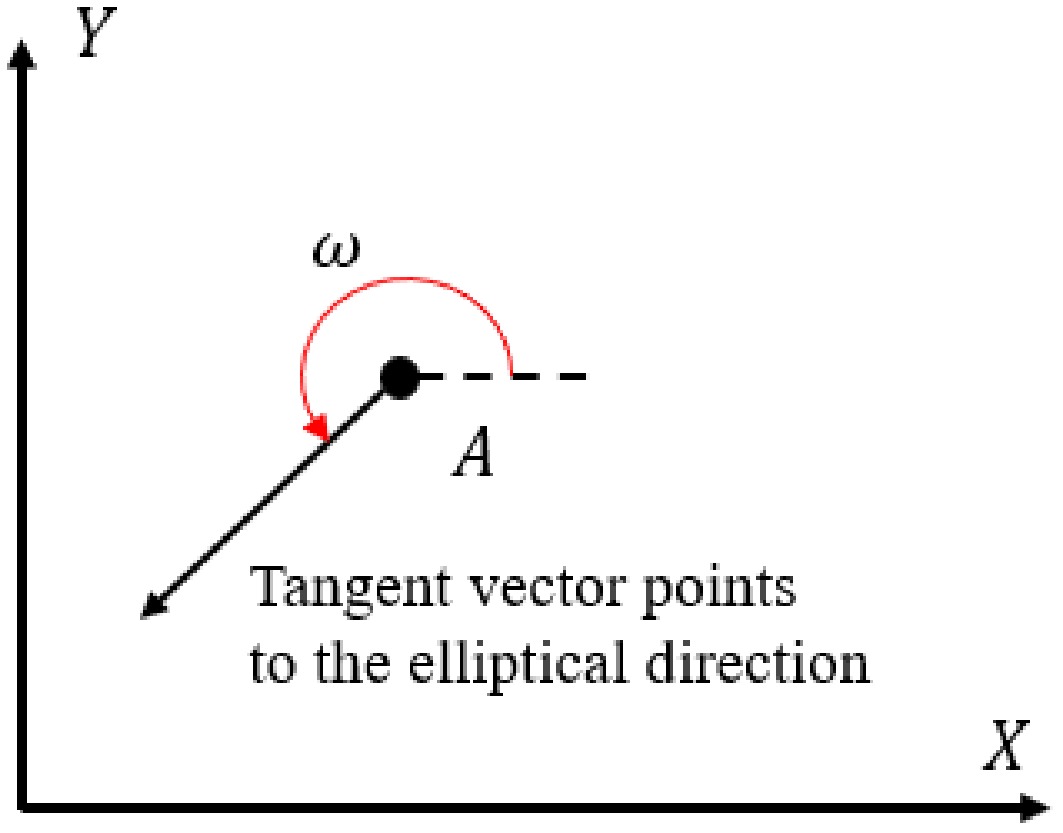
Figure 7.
Illustration of the meaning of tangent angle.
-
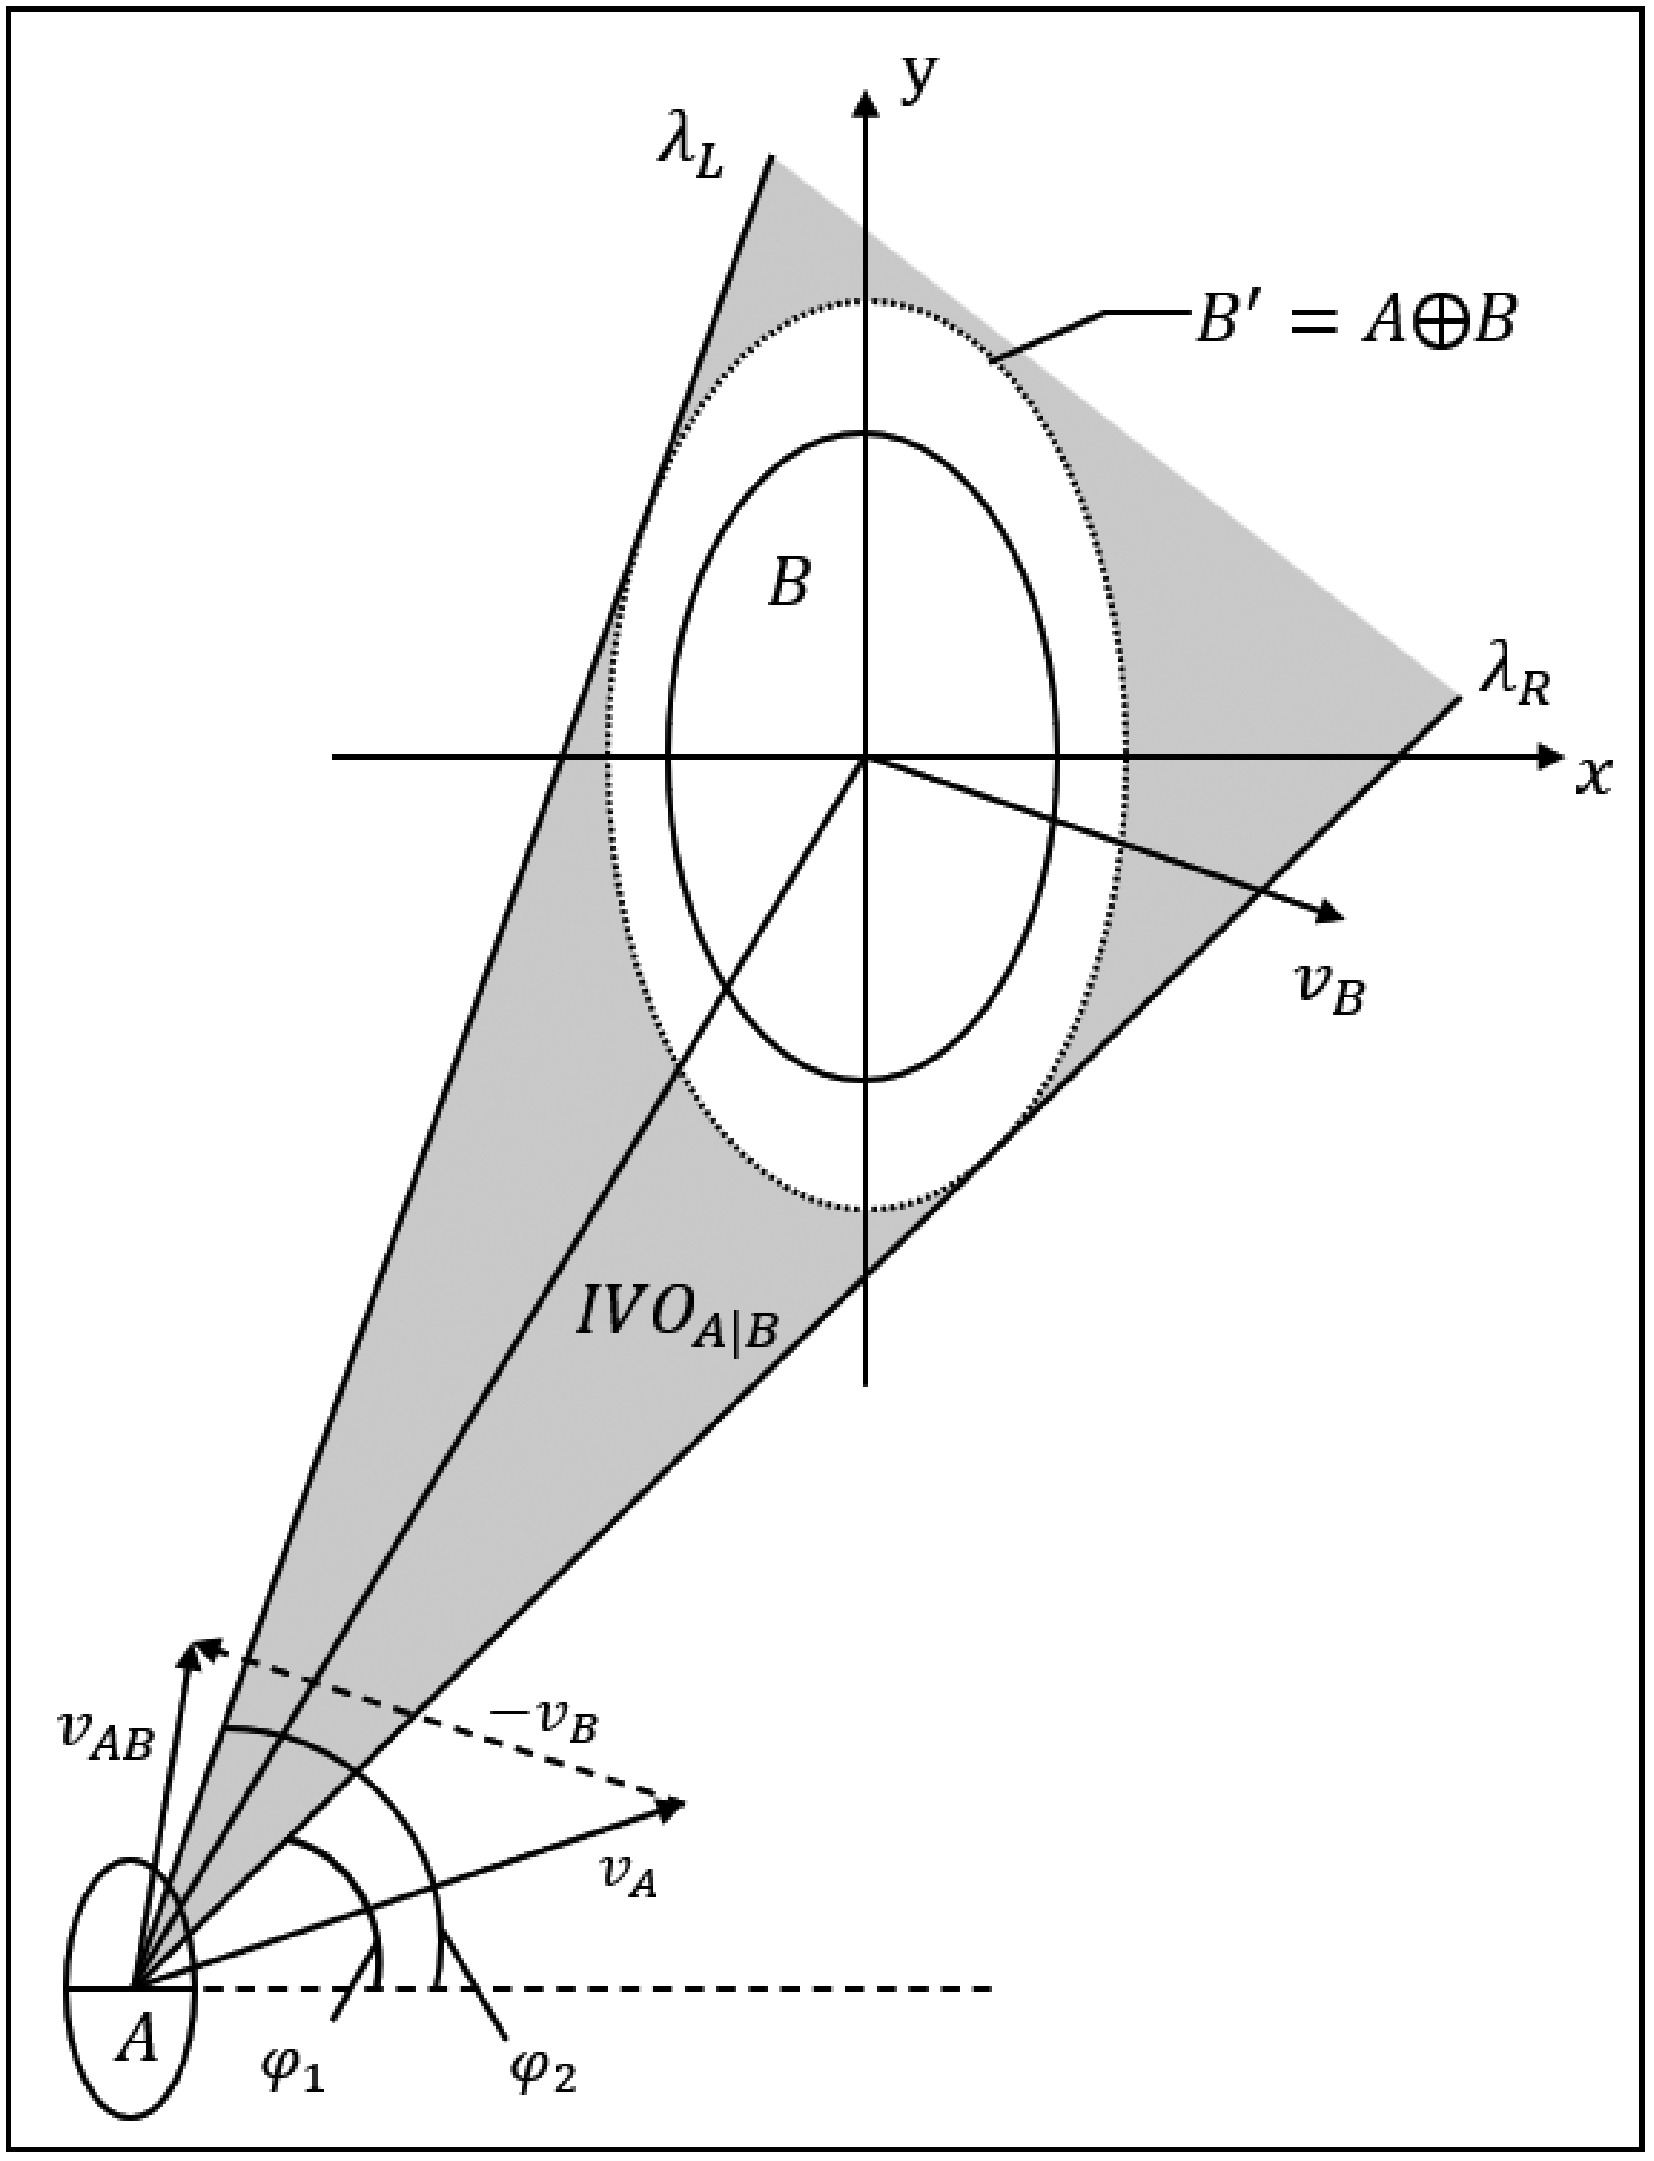
Figure 8.
Schematic diagram of the boundary of the improved velocity obstacle model's collision cone.
-
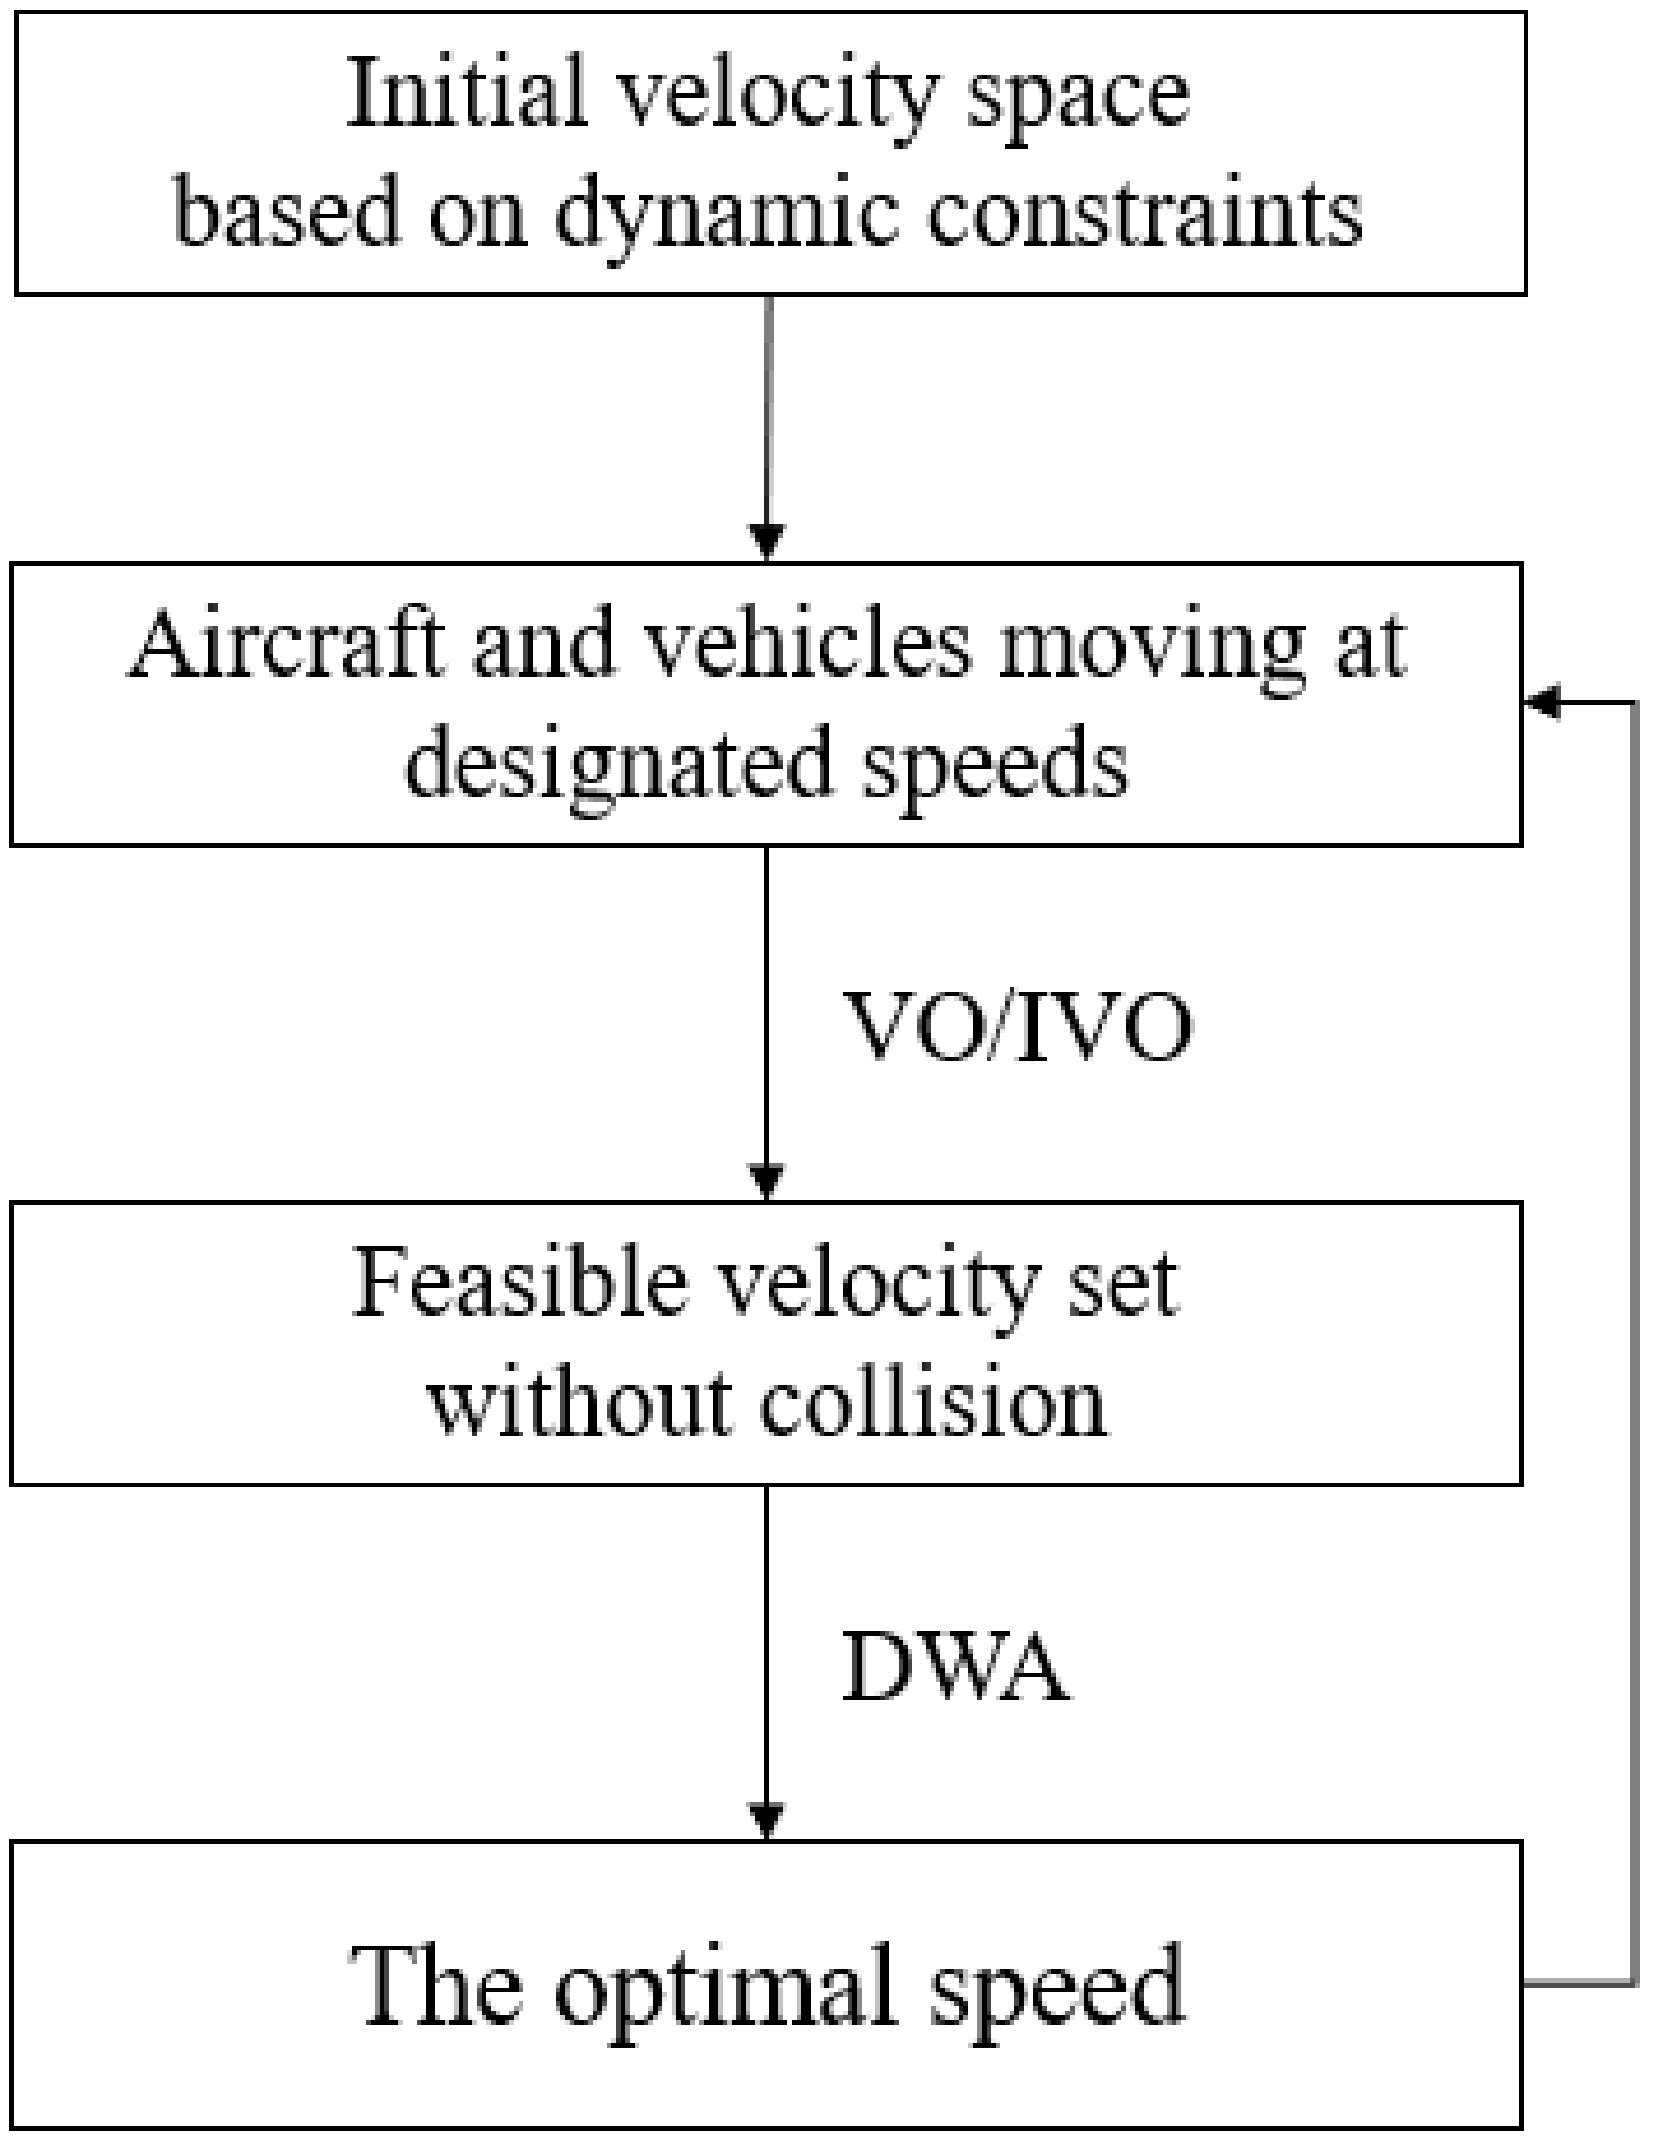
Figure 9.
Velocity update process diagram.
-
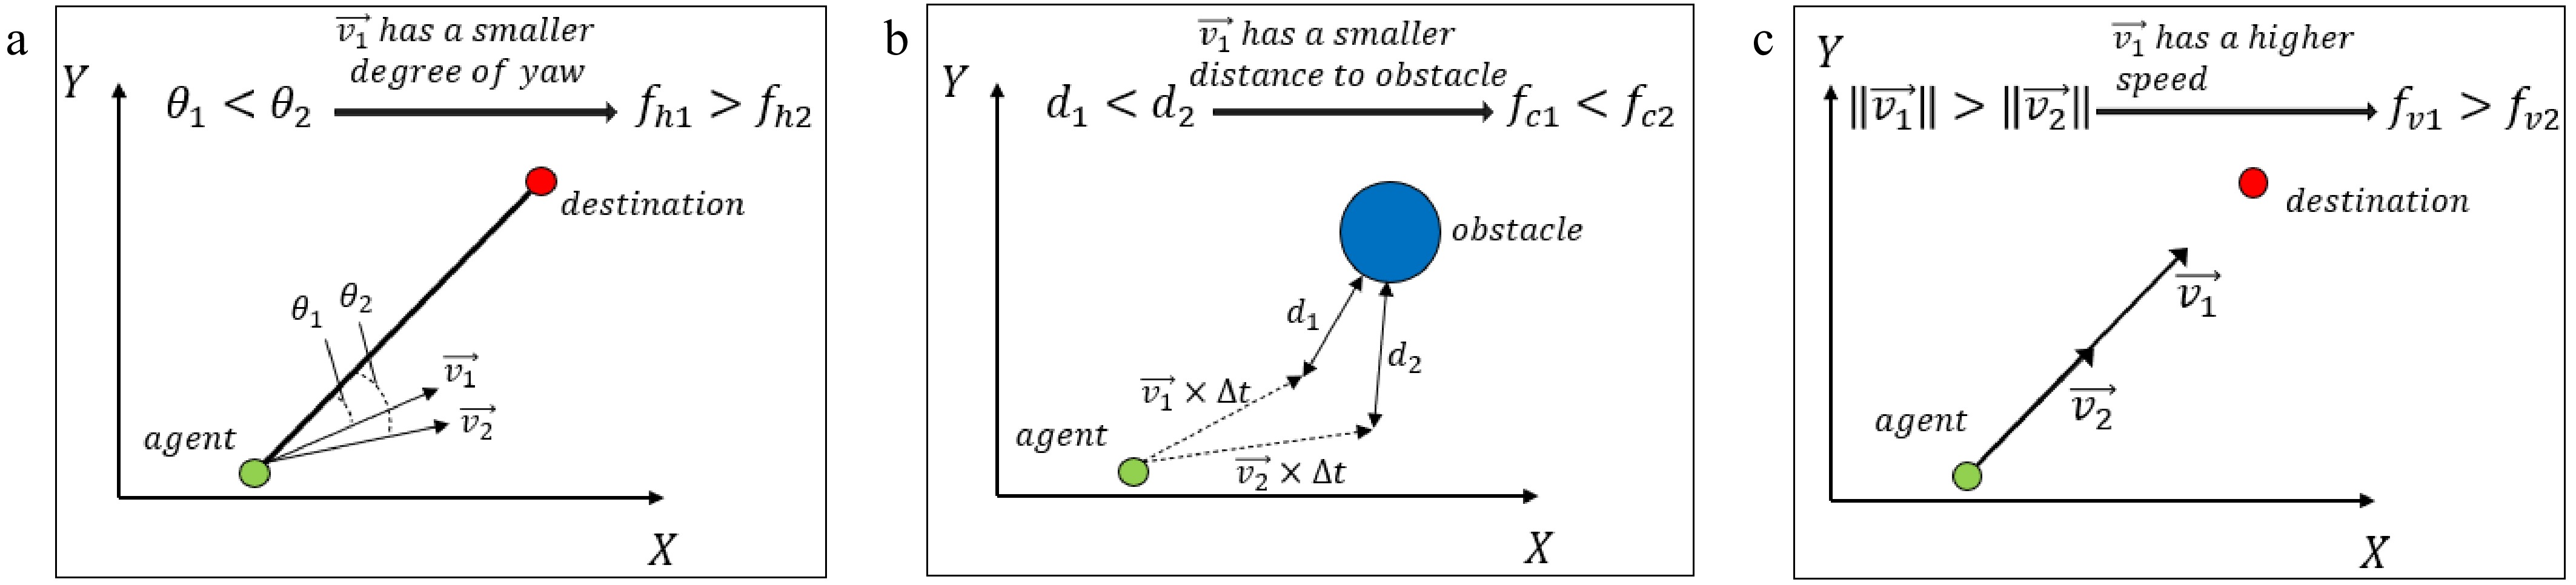
Figure 10.
Explanation of parameters in the dynamic window approach.
-
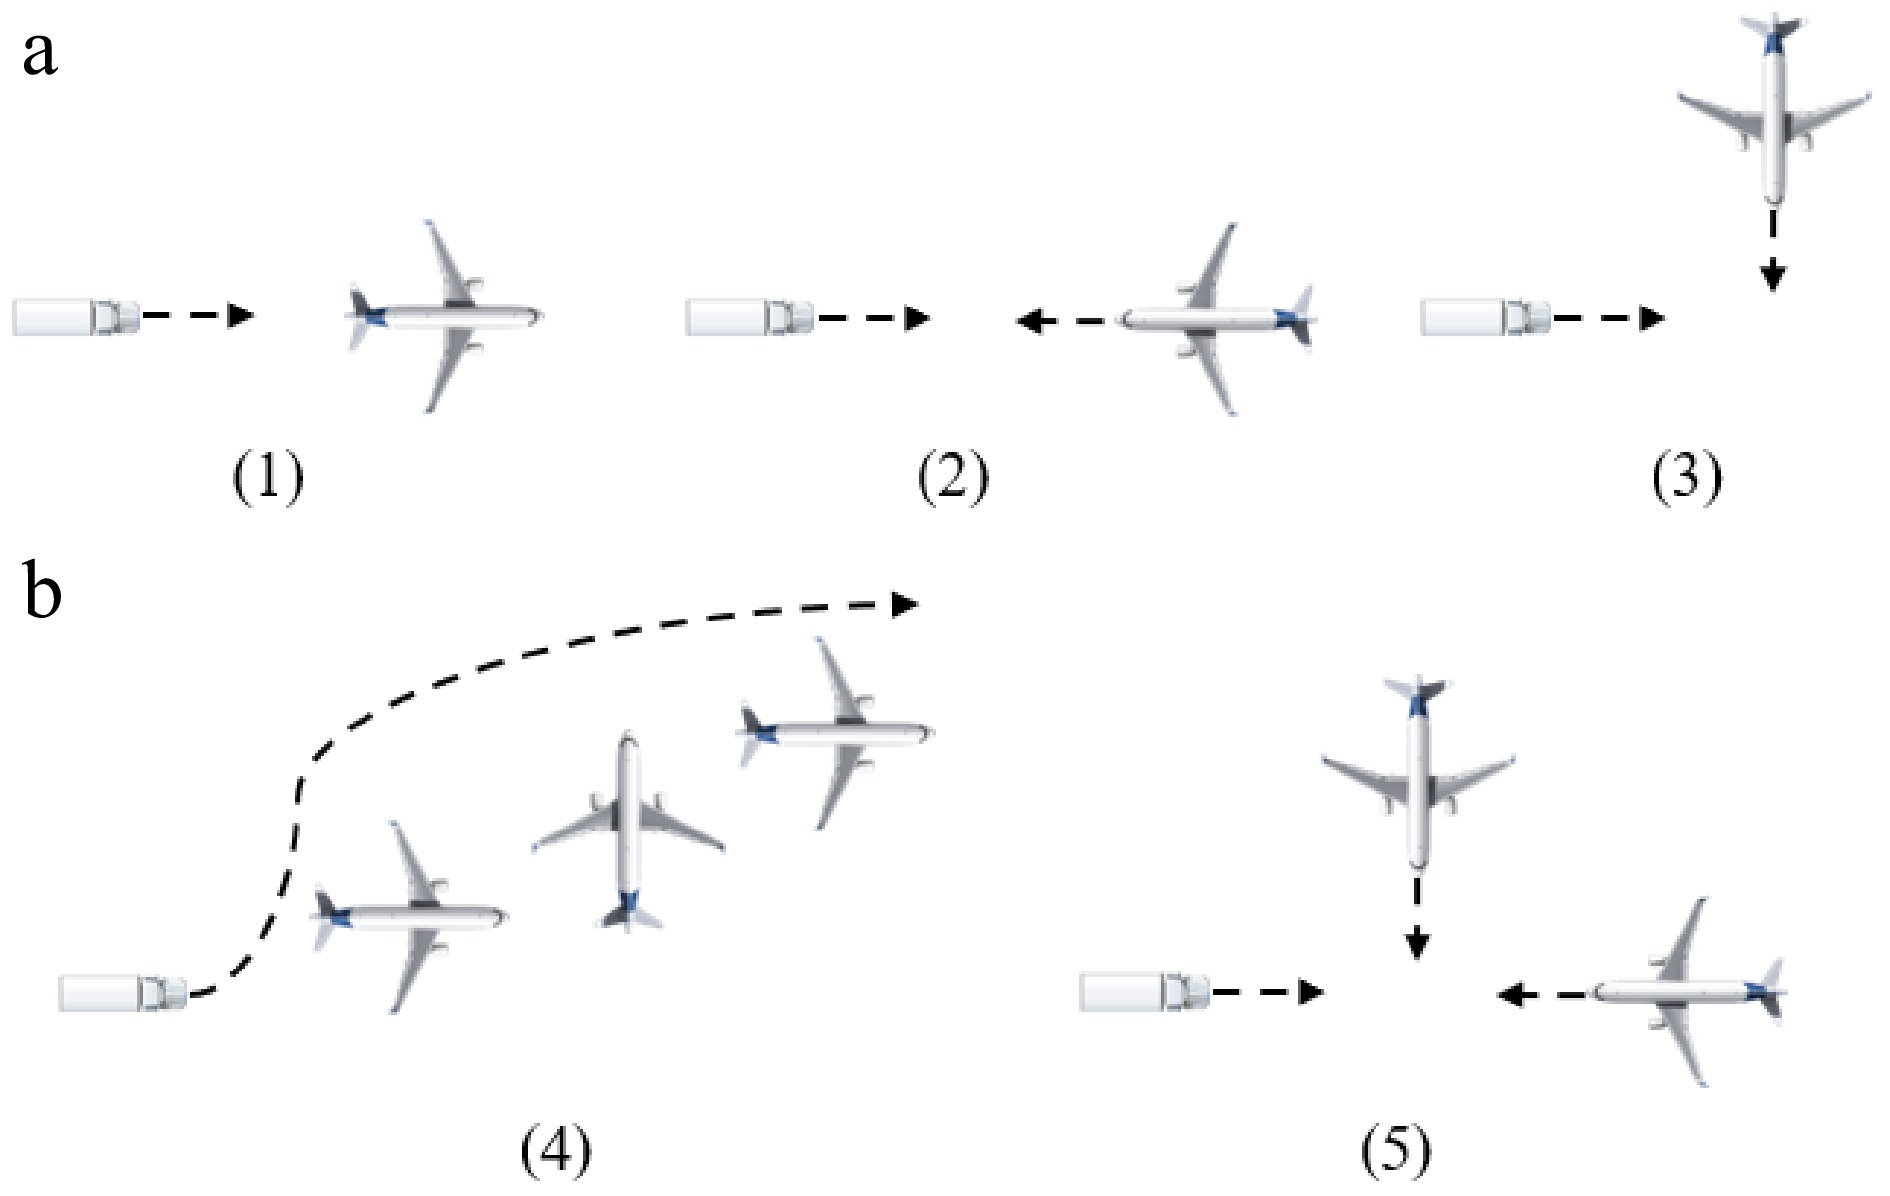
Figure 11.
Illustration of simulated scenario. (a) Conflict involving a single aircraft. (b) Conflict involving multiple aircraft.
-
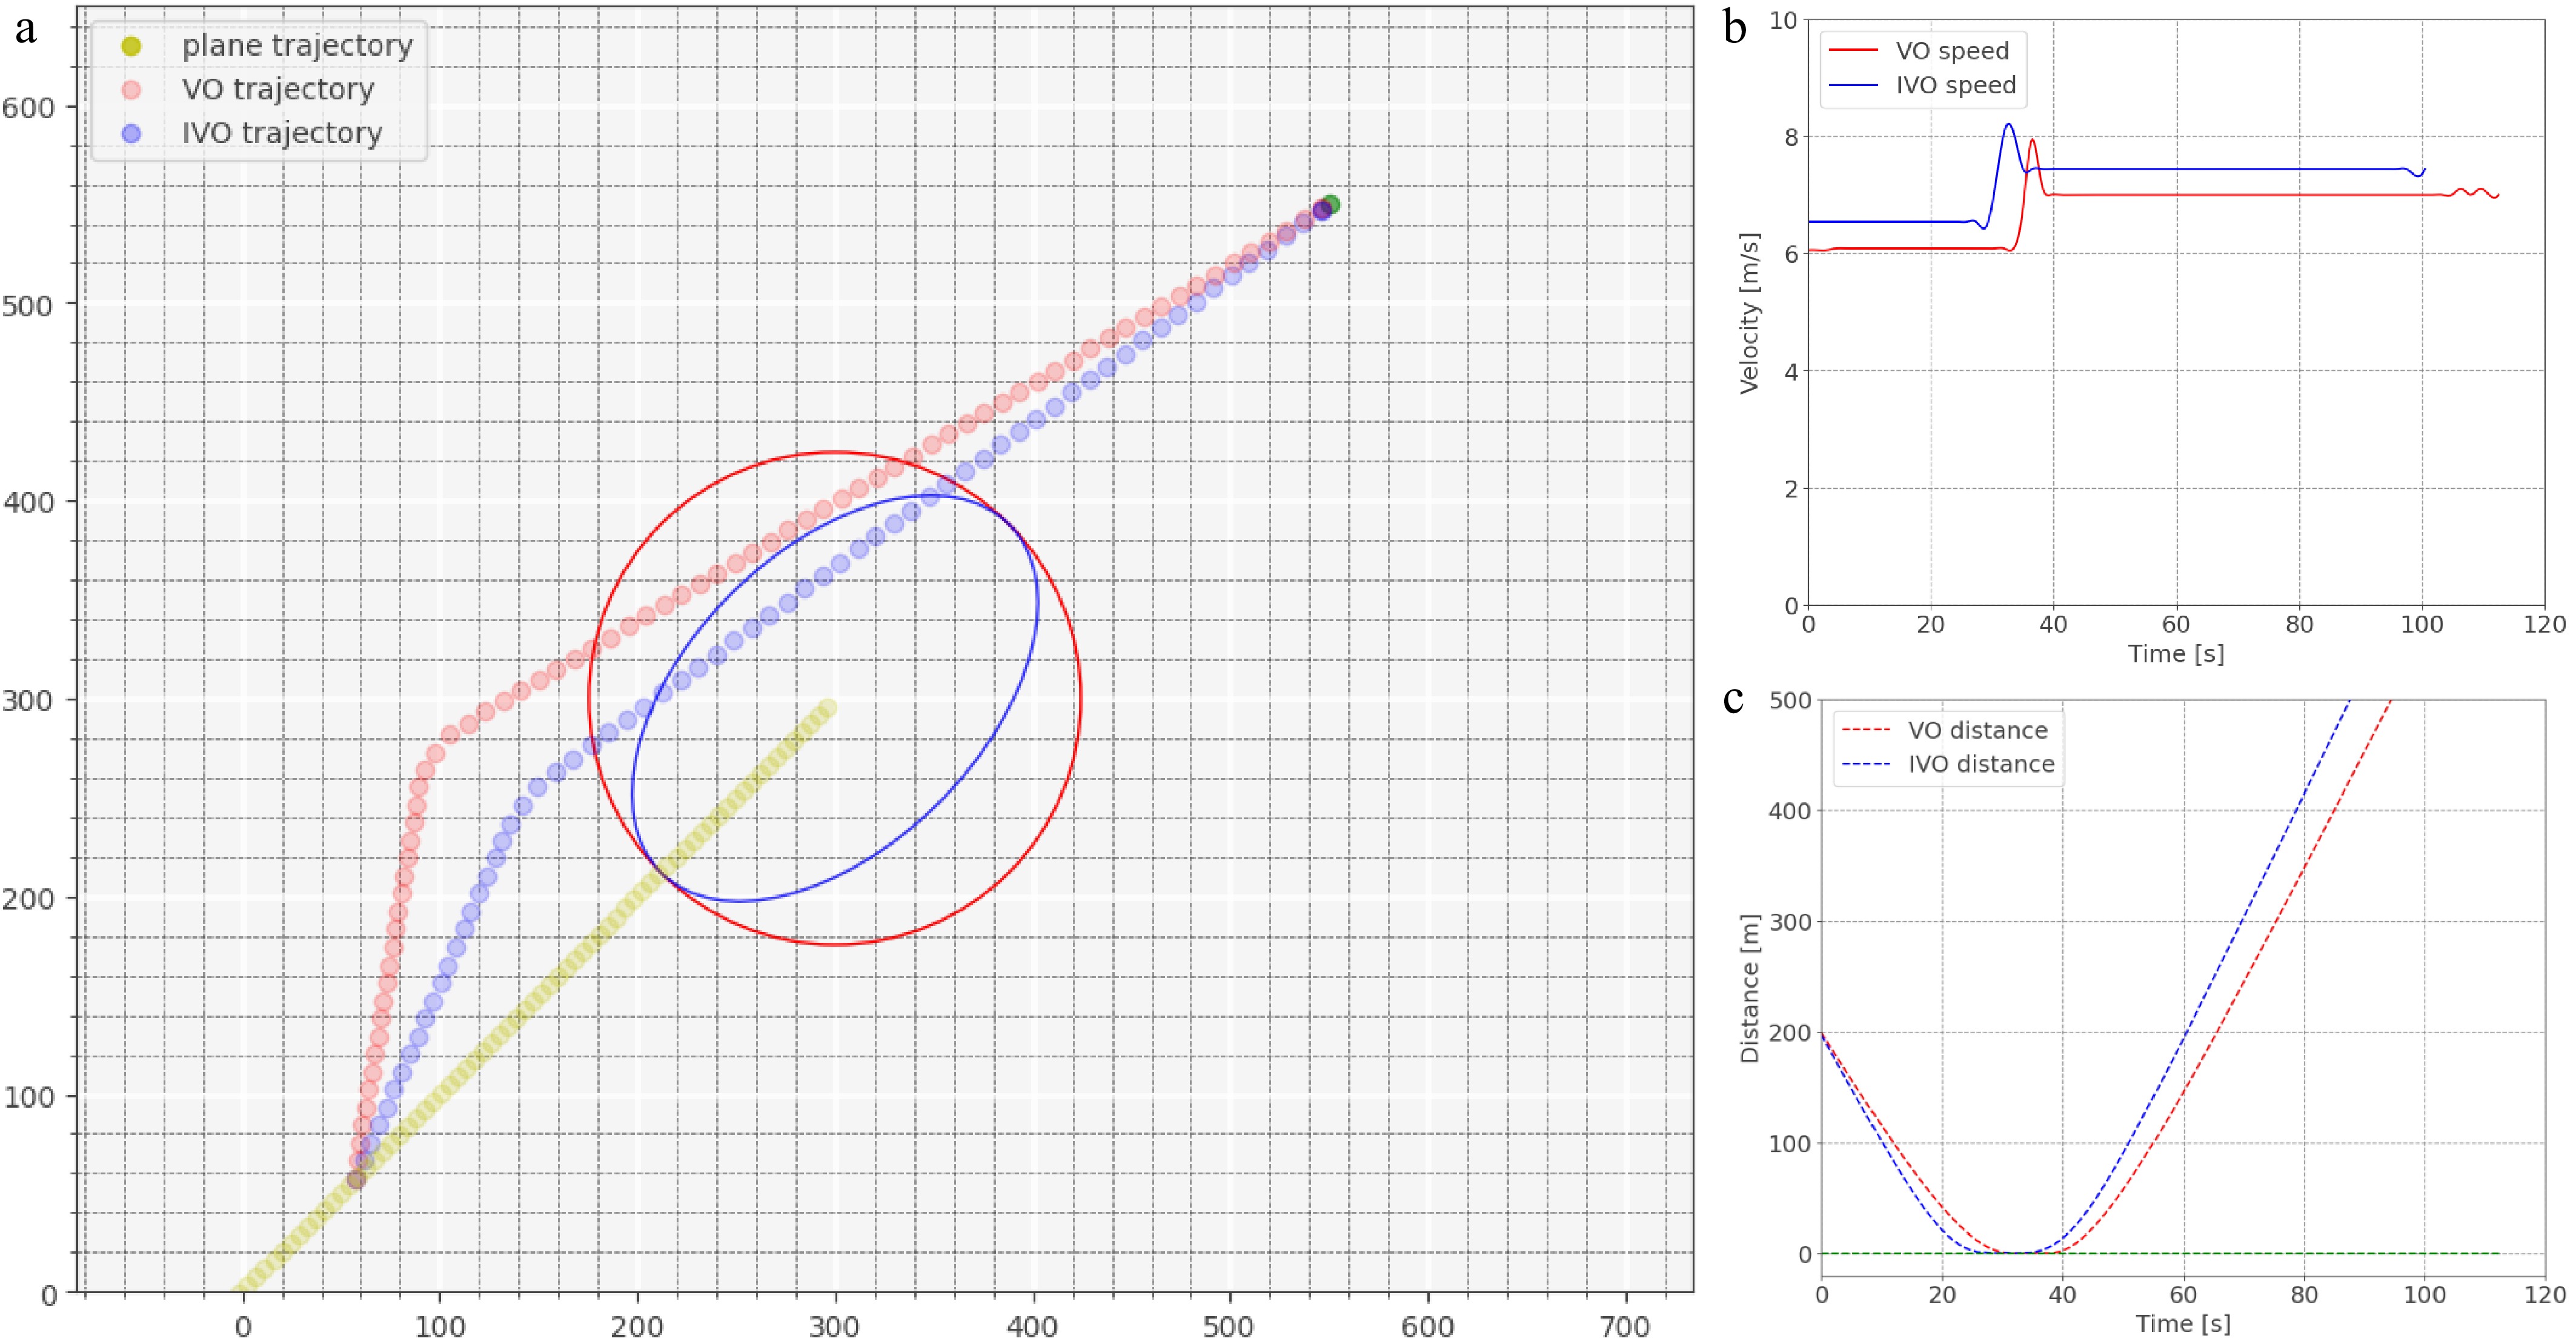
Figure 13.
Scene of head-on conflict. (a) Trajectory of vehicle avoids conflict. (b) Speed curve. (c) Distance of the vehicle to the boundary of the protected zone.
-
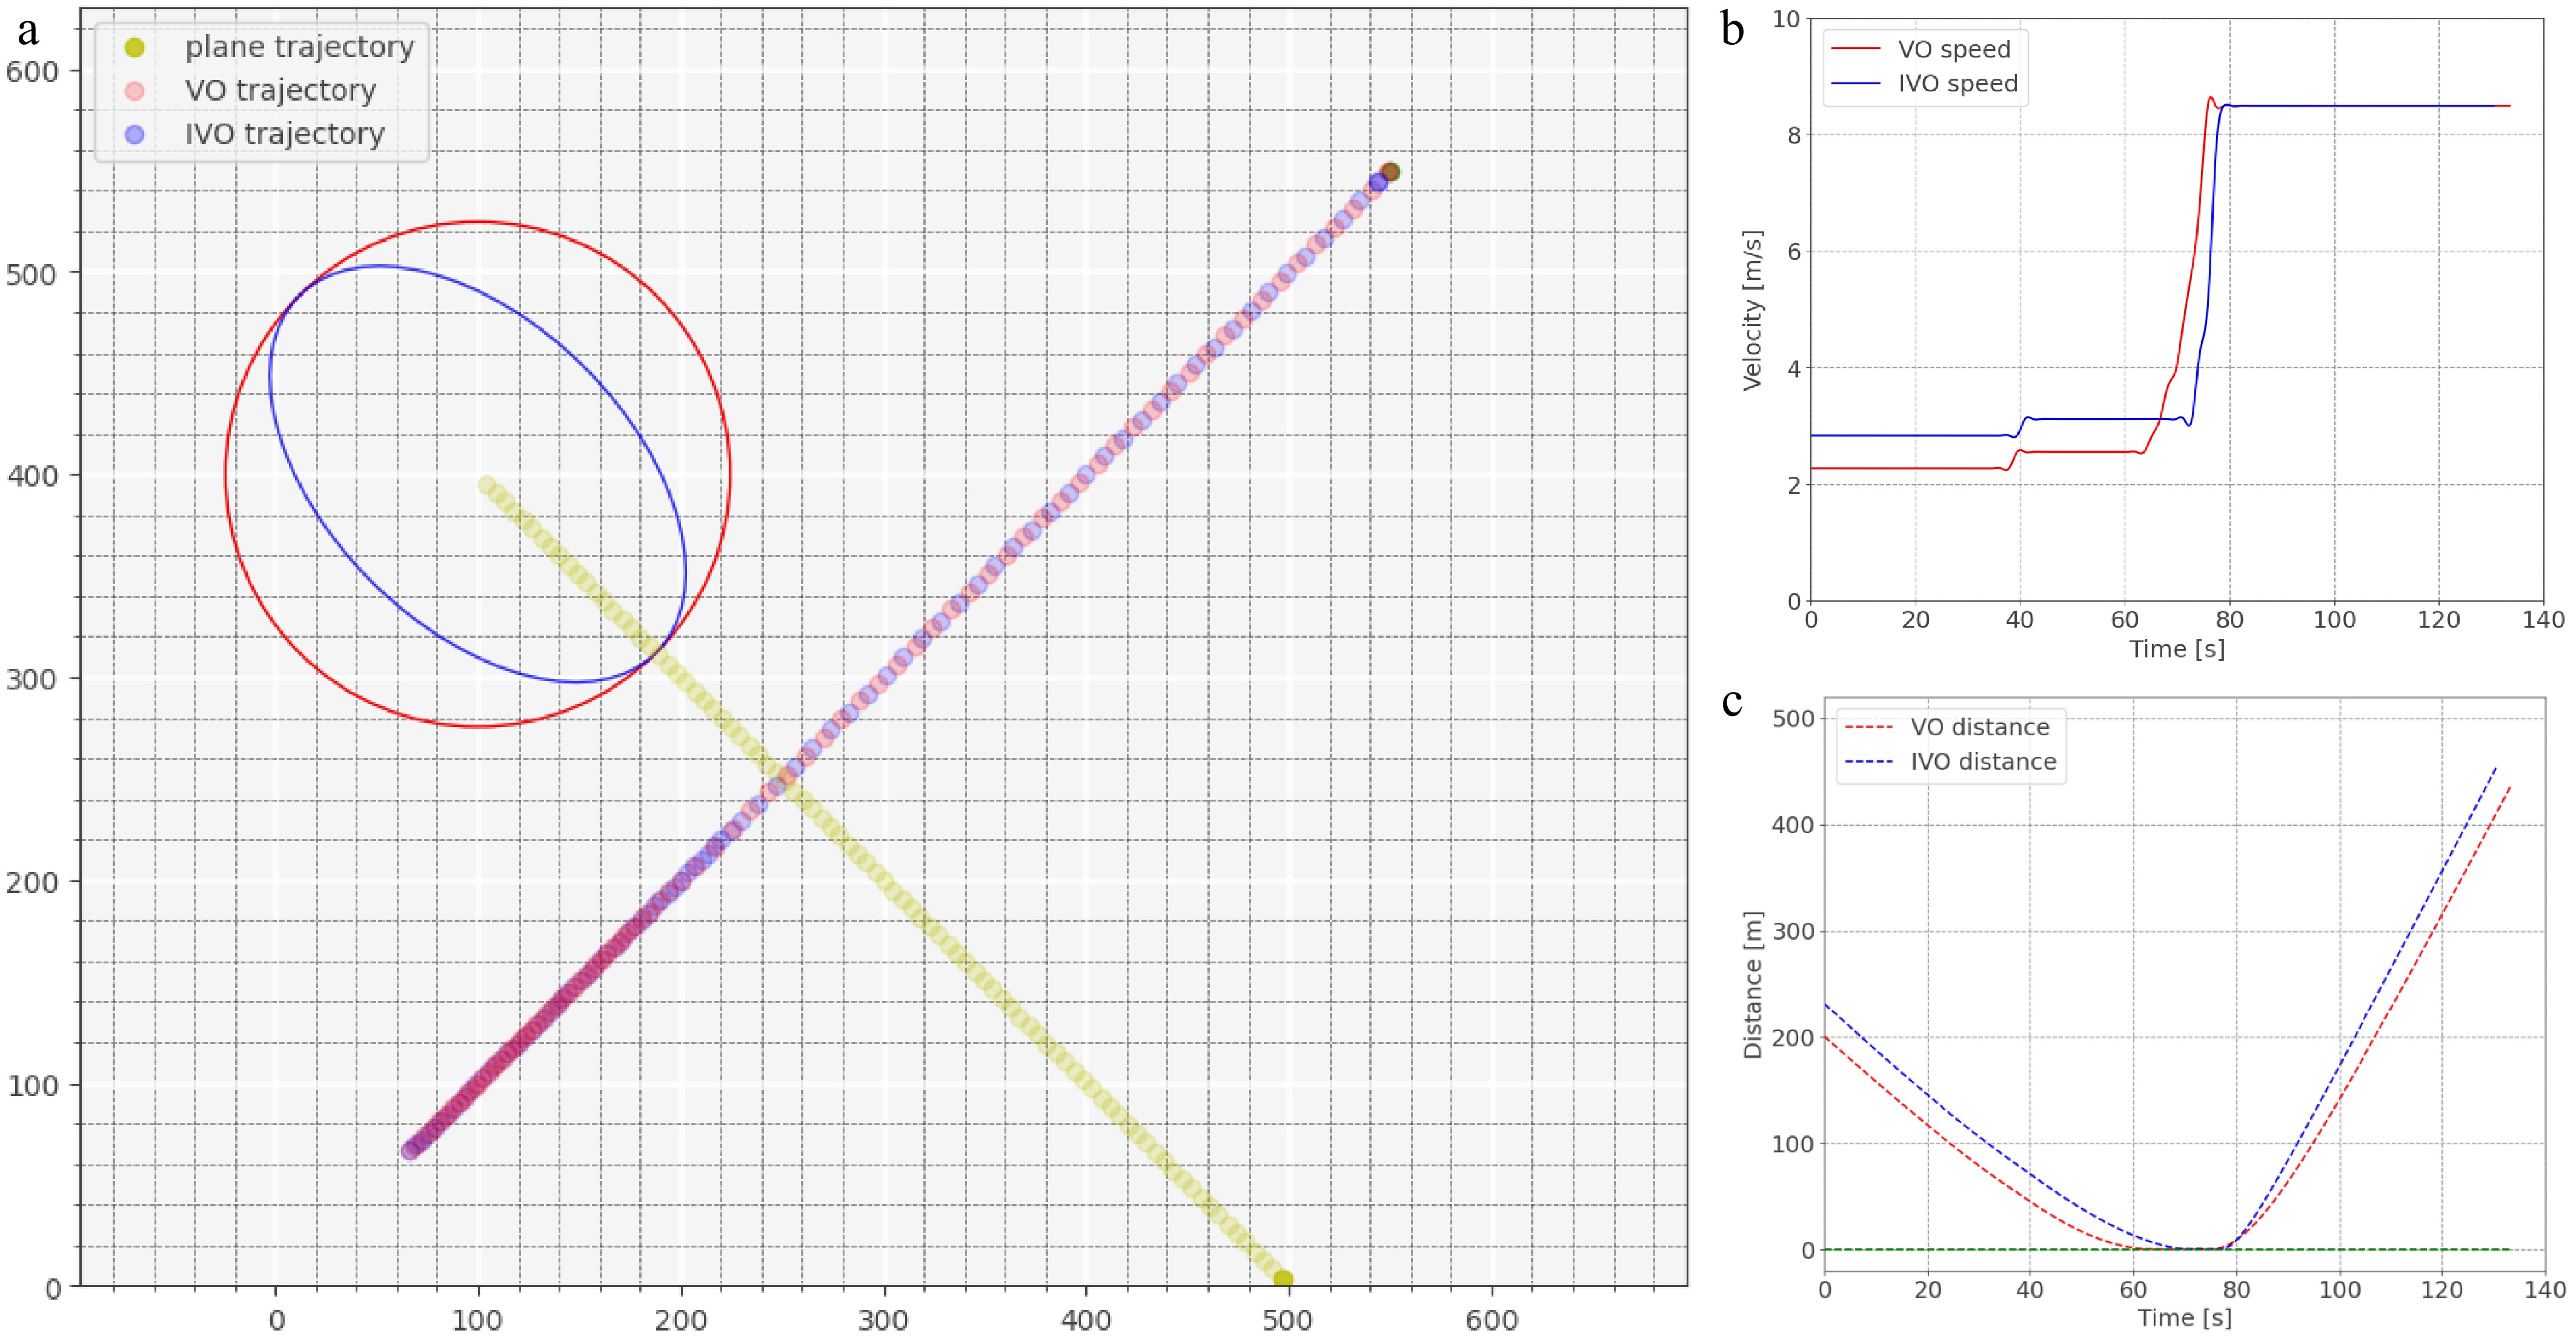
Figure 14.
Scene of cross conflict. (a) Trajectory of vehicle avoids conflict. (b) Speed curve. (c) Distance of the vehicle to the boundary of the protected zone.
-
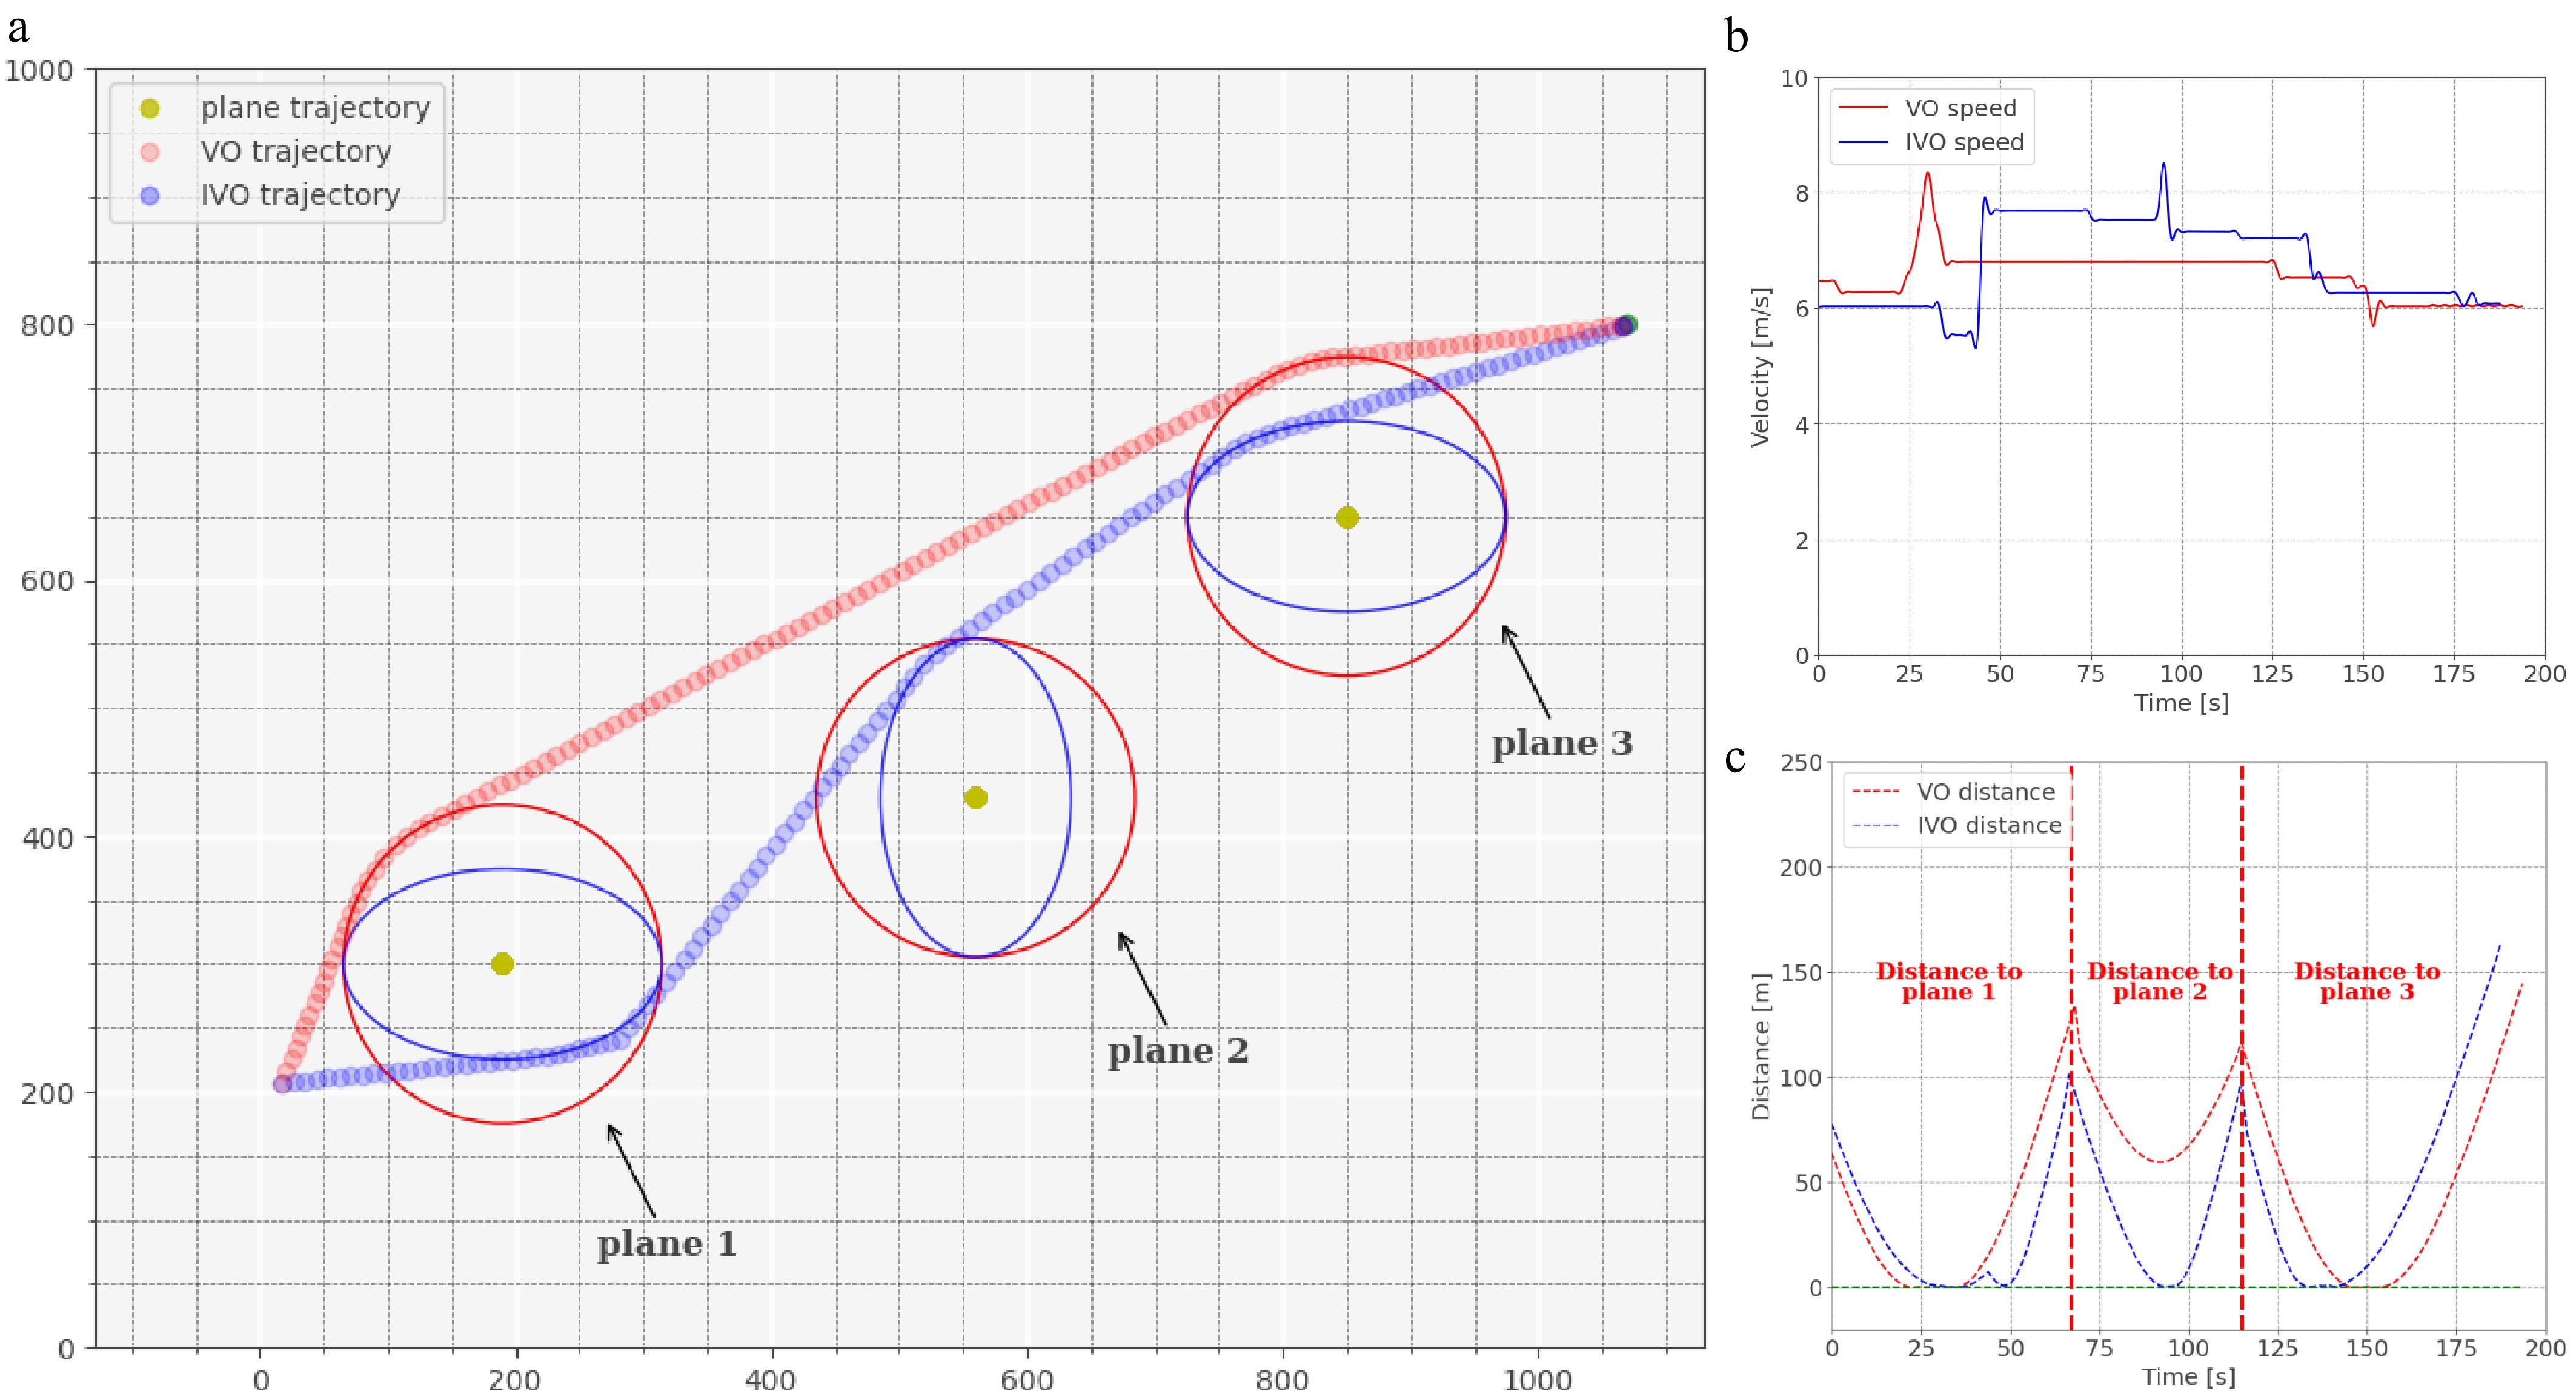
Figure 15.
Scene of multiple aircraft stationary with vehicle bypassing. (a) Trajectory of vehicle avoids conflict. (b) Speed curve. (c) Distance of the vehicle to the boundary of the protected zone.
-
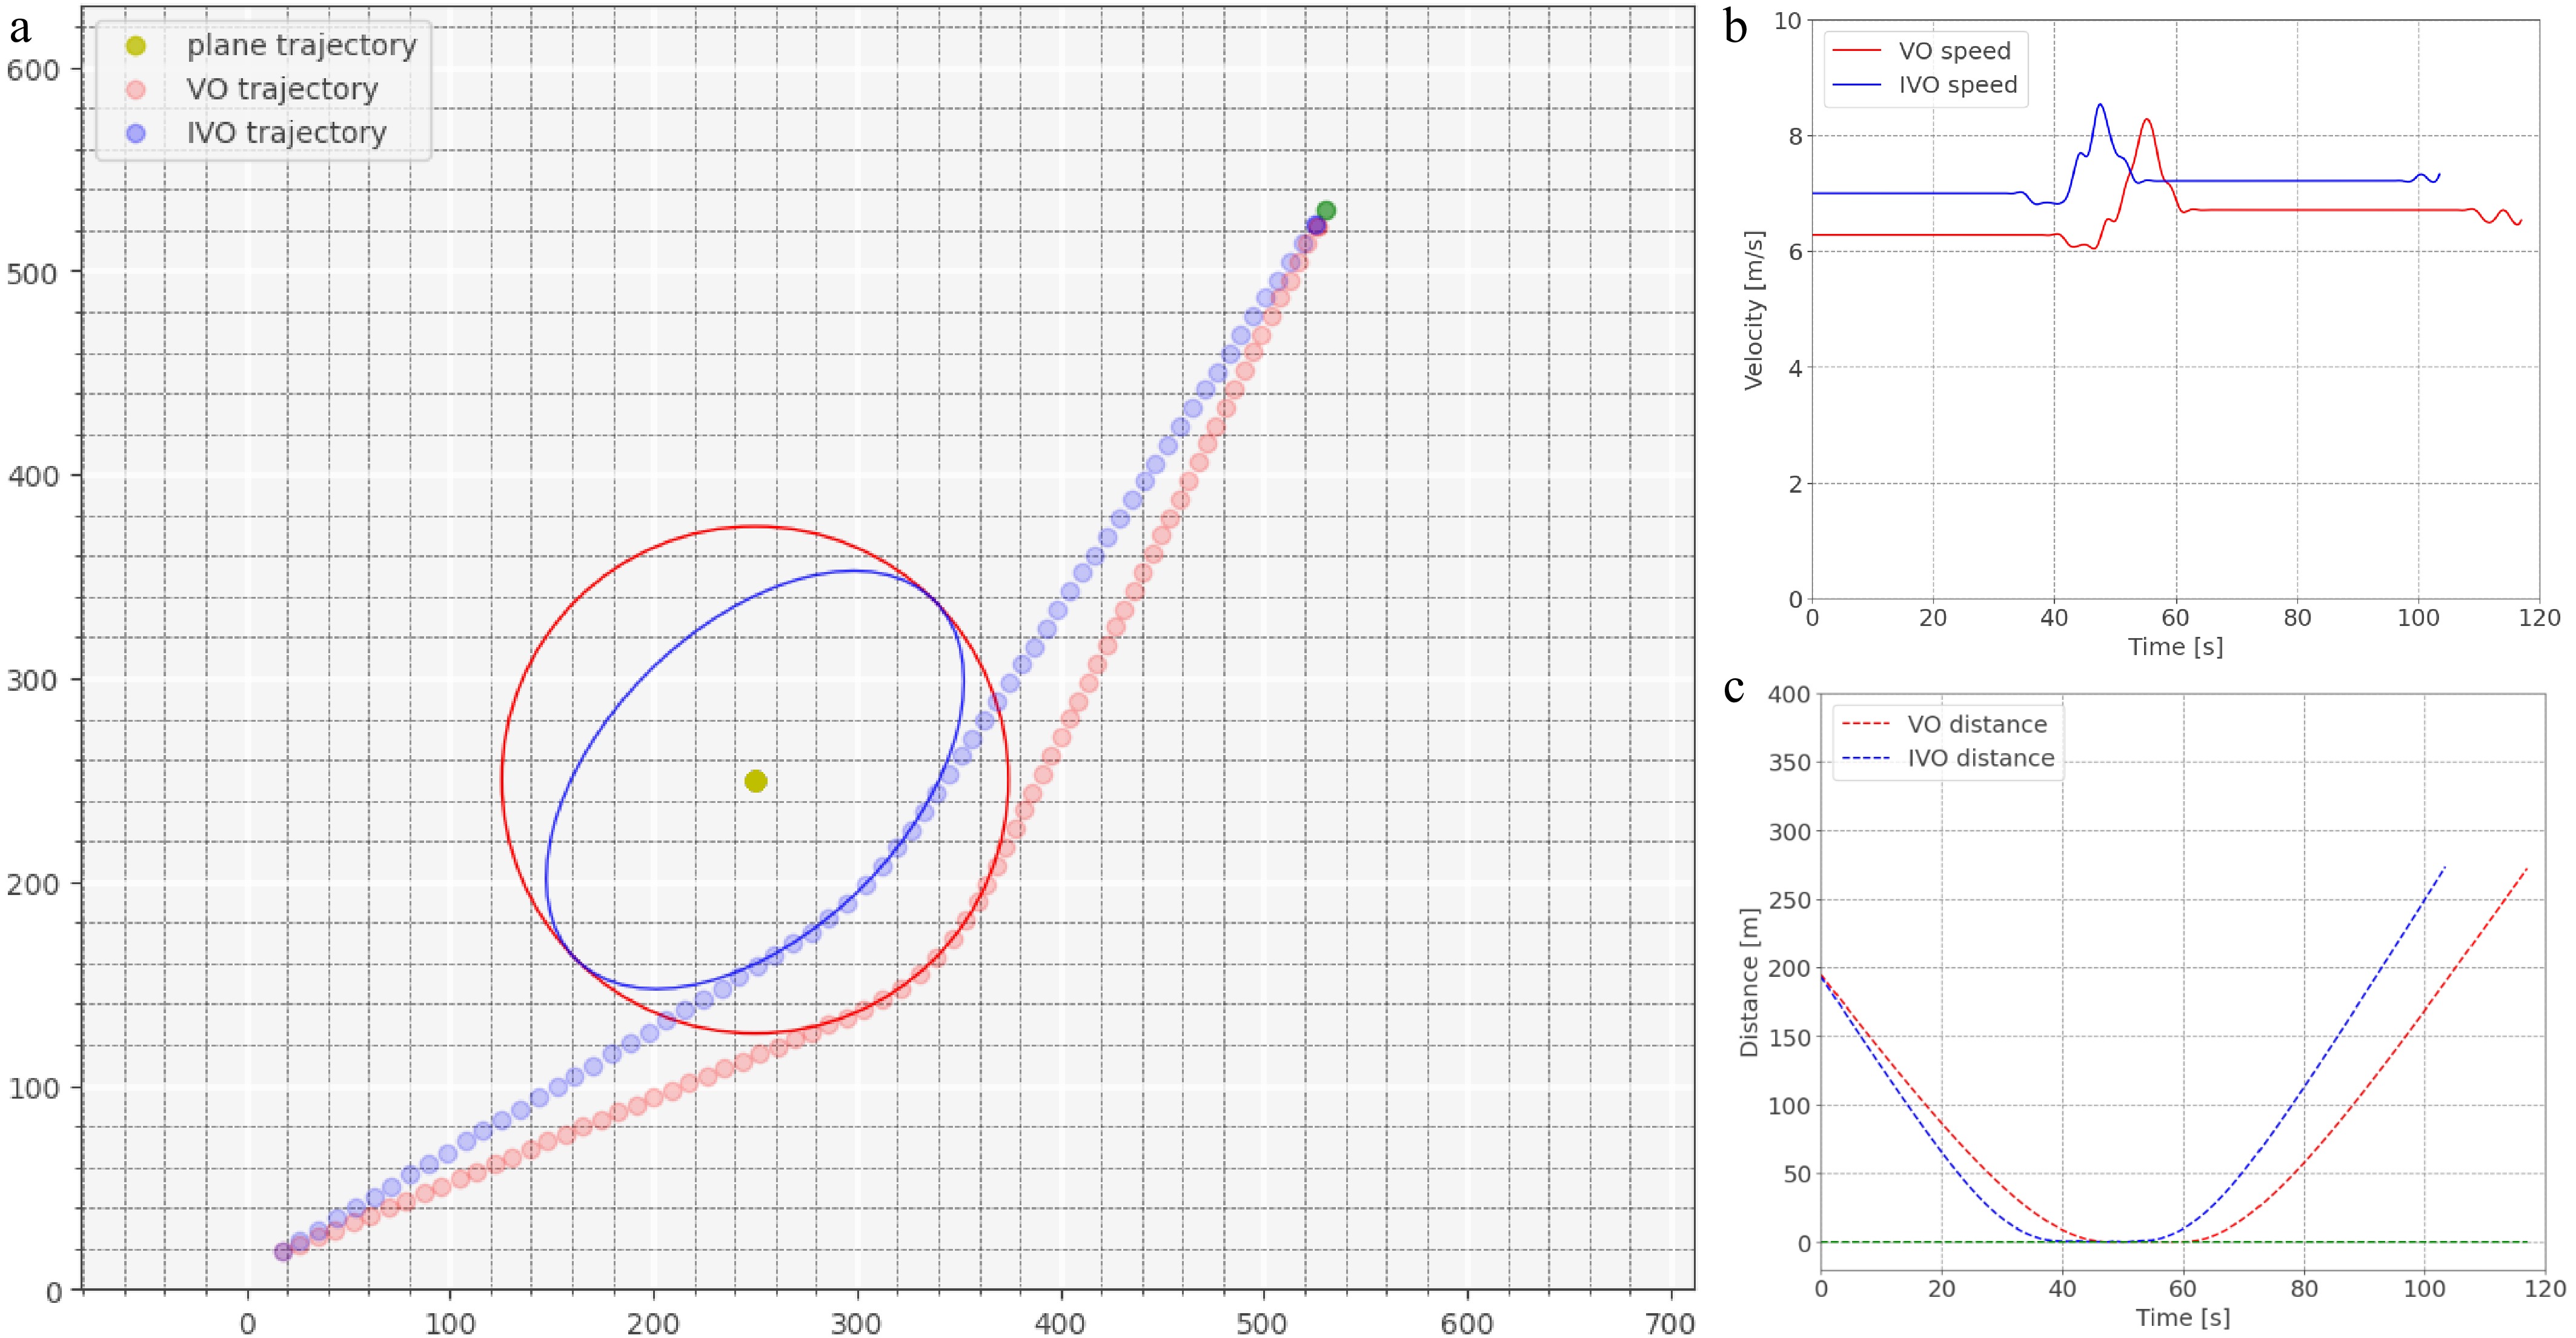
Figure 12.
Scene of aircraft stationary with vehicle bypassing. (a) Trajectory of vehicle avoids conflict. (b) Speed curve. (c) Distance of the vehicle to the boundary of the protected zone.
-
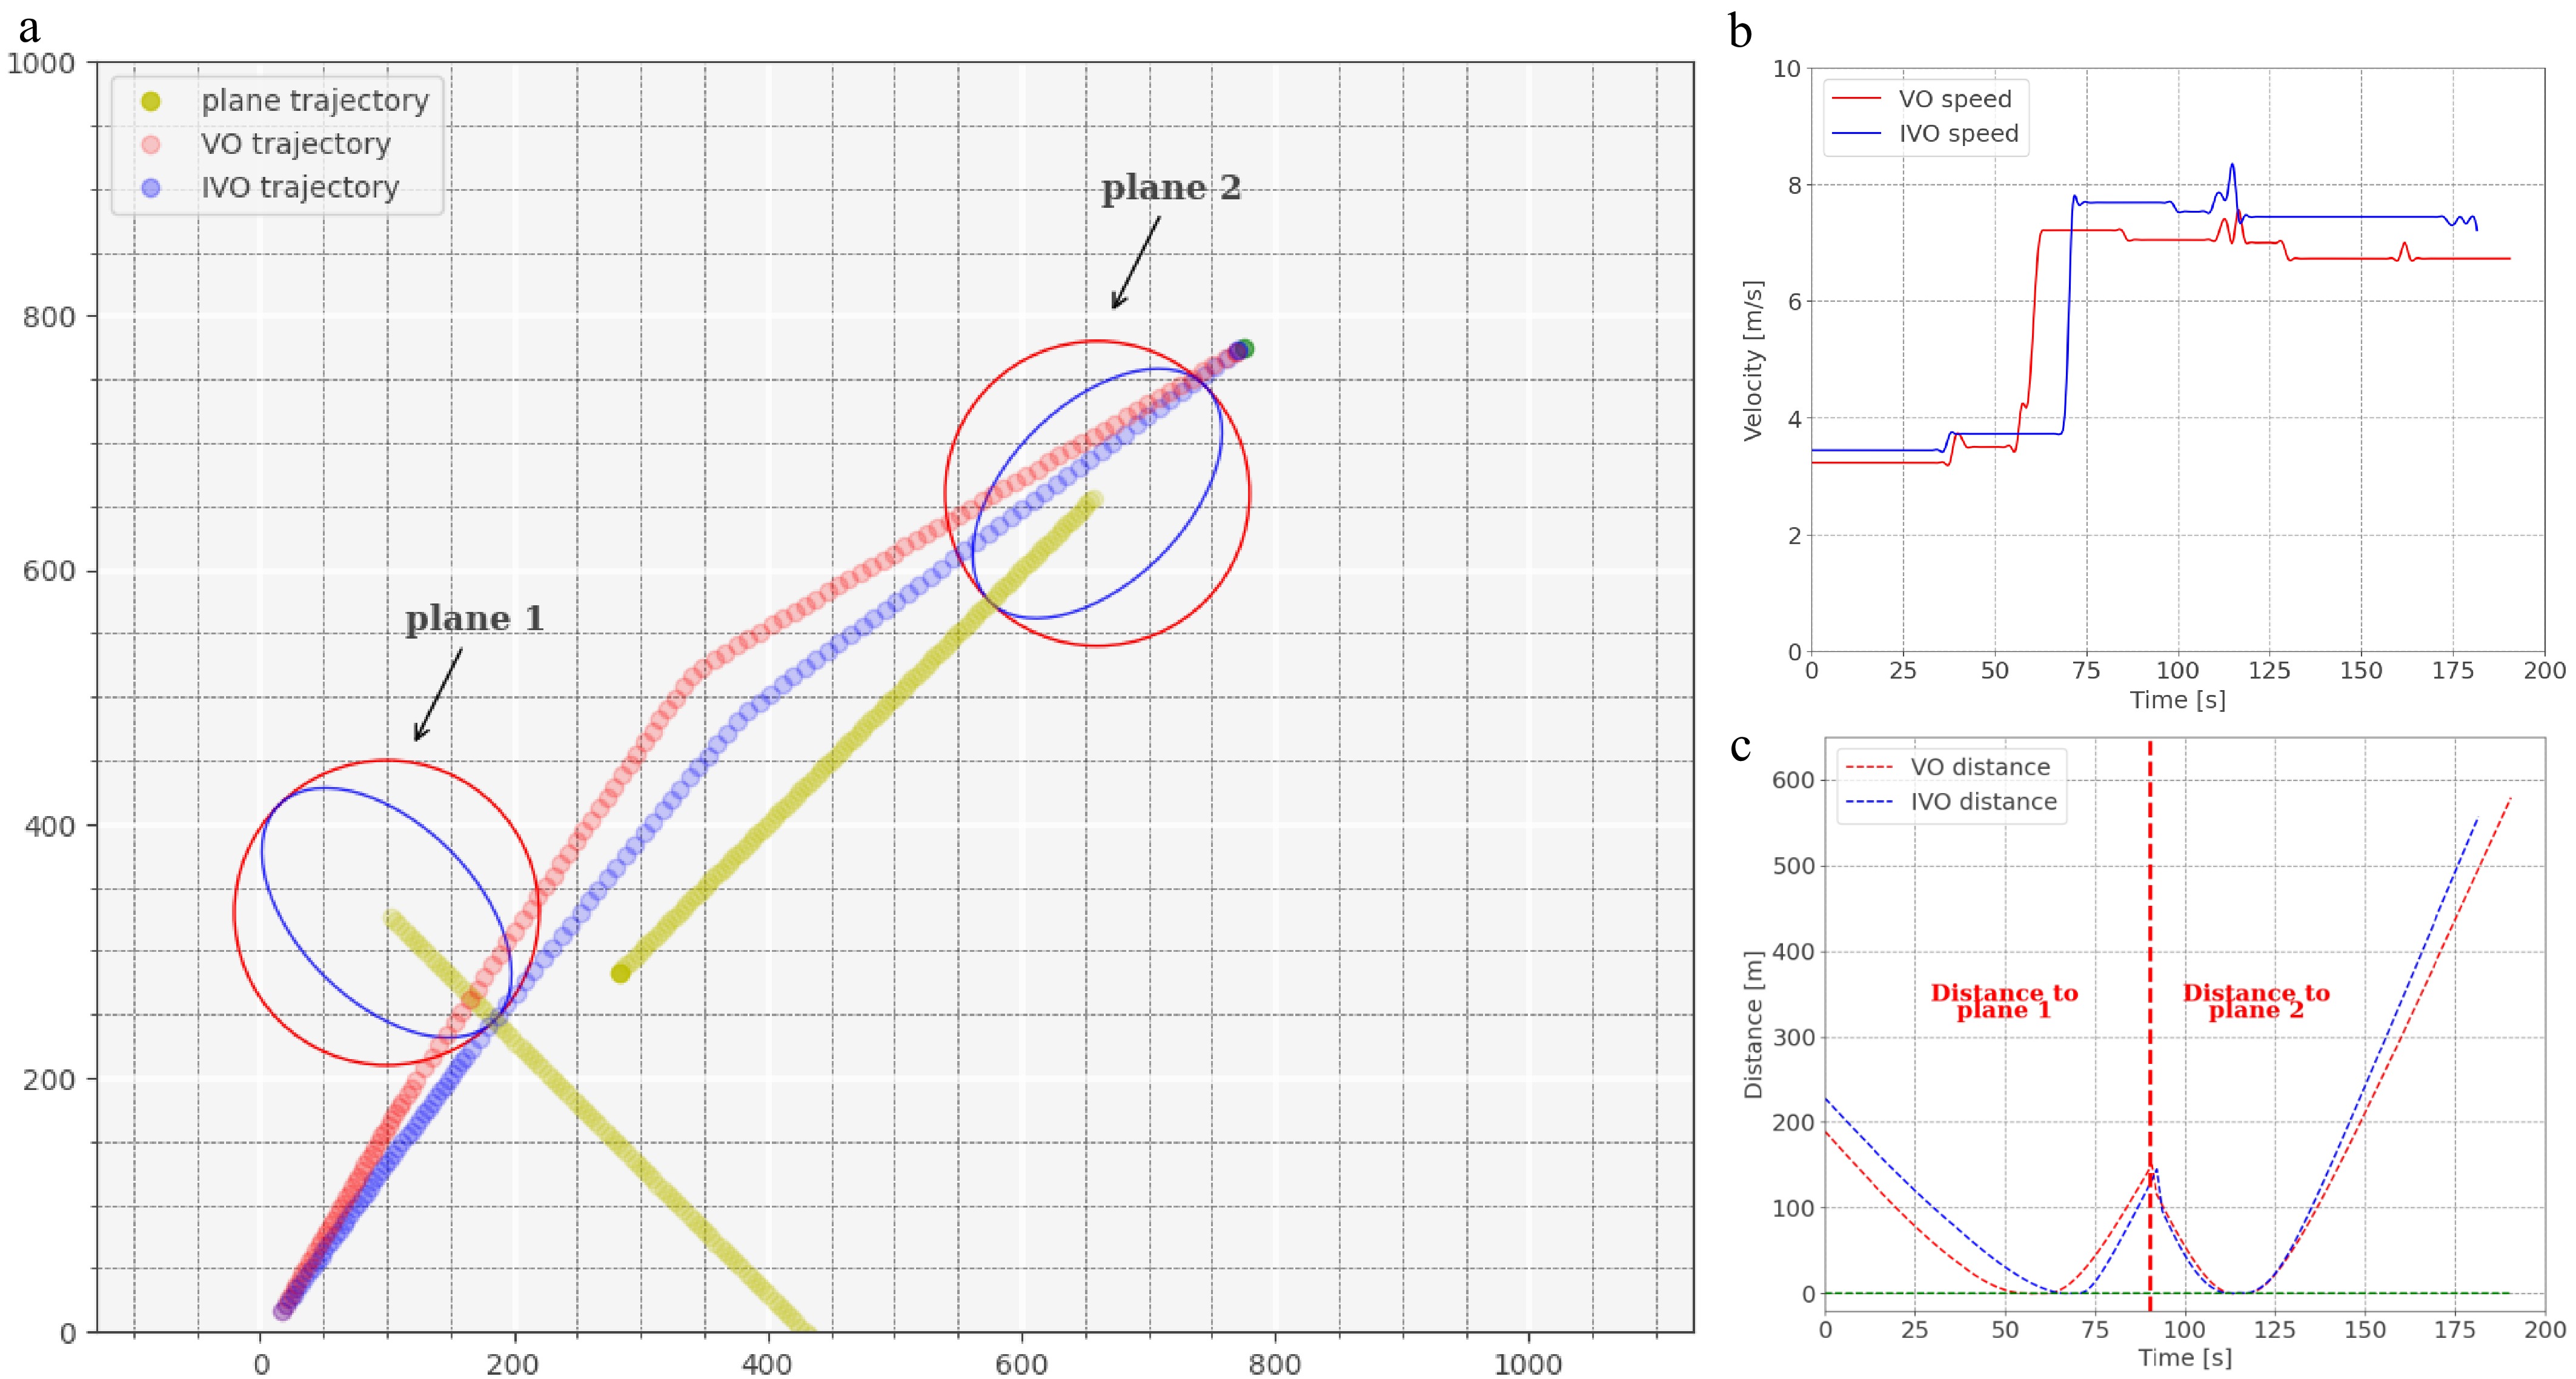
Figure 16.
Scene of combination of head-on and cross conflicts. (a) Trajectory of vehicle avoids conflict. (b) Speed curve. (c) Distance of the vehicle to the boundary of the protected zone.
-
Parameter Value Unit Ellipse B representing the aircraft protection zone The major axis 120 m The minor axis 70 m Ellipse A representing the range of the vehicle's profile The major axis 4.5 m The minor axis 2.0 m Range of aircraft taxiing speeds (0, 7) m/s Range of vehicle driving speeds (0,8.5) m/s Iteration step 1.5 s Table 1.
Basic parameters of operating entities.
-
Type of conflict scenarios Type of operating entities Initial position (m) Target position (m) Initial speed (m/s) Heading DWA coefficients kh, kc, kv Aircraft stationary with vehicle bypassing Vehicle (10, 10) (530, 530) 7.0 45° 200, 1, 20 Aircraft (250, 250) − 0 45° − Head-on conflict Vehicle (50, 50) (550, 550) 7.0 45° 200, 1, 20 Aircraft (300, 300) − 4.0 −135° − Cross conflict Vehicle (60, 60) (550, 550) 6.0 45° 200, 1, 20 Aircraft (100, 400) − 4.2 −45° − Table 2.
Initial state of conflict involving a single aircraft.
-
Type of conflict scenarios Type of operating entities Initial position (m) Target position (m) Initial speed (m/s) Heading DWA coefficients kh, kc, kv Multiple aircraft stationary with vehicle bypassing Vehicle (10, 200) (1070, 800) 7.0 45° 200, 1, 20 Aircraft (190, 300) − 0 0° − Aircraft (560, 430) − 0 90° − Aircraft (850, 650) − 0 0° − Combination of head-on and cross conflicts Vehicle (10, 10) (775, 775) 7.0 45° 200, 1, 20 Aircraft (660, 660) − 2.8 −135° − Aircraft (100, 300) − 3.3 −45° − Table 3.
Initial state of conflict involving multiple aircraft.
Figures
(16)
Tables
(3)